An evaluation of onshore digital elevation models for modeling tsunami inundation zones
 Jonathan Griffin1,2*
  Hamzah Latief3
  Widjo Kongko4
  Sven Harig5 Nick Horspool1
  Raditya Hanung3 Aditia Rojali3 Nicola Maher1 Annika Fuchs5
  Jakir Hossen6 Supryiati Upi7 Sri Edi Dewanto7 Natalja Rakowsky5 Phil Cummins1,6
- 1Community Safety Group, Geoscience Australia, Canberra, ACT, Australia
- 2Australia-Indonesia Facility for Disaster Reduction, Jakarta, Indonesia
- 3Faculty of Earth Sciences and Technology, Bandung Institute of Technology, Bandung, Indonesia
- 4Coastal Dynamics Research Centre, Agency for the Assessment and Application of Technology, Yogyakarta, Indonesia
- 5Computing Center, Alfred Wegener Institute, Helmholtz Center for Polar and Marine Research, Bremerhaven, Germany
- 6Research School of Earth Sciences, Australian National University, Canberra, ACT, Australia
- 7National Disaster Management Agency, Jakarta, Indonesia
A sensitivity study is undertaken to assess the utility of different onshore digital elevation models (DEMs) for simulating the extent of tsunami inundation using case studies from two locations in Indonesia. We compare airborne IFSAR, ASTER, and SRTM against high resolution LiDAR and stereo-camera data in locations with different coastal morphologies. Tsunami inundation extents modeled with airborne IFSAR DEMs are comparable with those modeled with the higher resolution datasets and are also consistent with historical run-up data, where available. Large vertical errors and poor resolution of the coastline in the ASTER and SRTM elevation datasets cause the modeled inundation extent to be much less compared with the other datasets and observations. Therefore, ASTER and SRTM should not be used to underpin tsunami inundation models. A model mesh resolution of 25 m was sufficient for estimating the inundated area when using elevation data with high vertical accuracy in the case studies presented here. Differences in modeled inundation between digital terrain models (DTM) and digital surface models (DSM) for LiDAR and IFSAR are greater than differences between the two data types. Models using DTM may overestimate inundation while those using DSM may underestimate inundation when a constant Manning's roughness value is used. We recommend using DTM for modeling tsunami inundation extent with further work needed to resolve the scale at which surface roughness should be parameterized.
Introduction
Large and destructive tsunami occur infrequently and for any particular location typically have recurrence intervals that exceed human lifespans. Extreme events such as the 2011 Tohoku Tsunami have recurrence intervals on the order of 1000 years (Minoura et al., 2001) meaning only in exceptional circumstances do historical records capture previous events of similar magnitude. Therefore, hydrodynamic models of tsunami inundation from realistic but hypothetical scenarios are fundamental to understanding the threat posed to a particular section of coast from tsunami. The results of tsunami inundation models can inform disaster management activities including evacuation and contingency planning, impact and risk assessment and warning, as well as structural mitigation measures (e.g., protective barriers, vertical evacuation shelters, and building design standards). A key input to tsunami inundation models is elevation data, and hydrodynamic models are known to be sensitive to the resolution and accuracy of elevation data (Satake, 1995; Casas et al., 2006; Horritt et al., 2006; Sanders, 2007; Gallegos et al., 2009; Tang et al., 2009; Tsubaki and Kawahara, 2013). Considering on-shore elevation (topography) data, there are several widely available digital elevation models (DEMs) that vary in resolution, accuracy, extent of coverage, and cost. This study assesses different available DEMs in regards to their utility for accurate tsunami inundation modeling.
In order to assess the different elevation datasets the purpose for which the inundation model will be used must be considered. In this study we focus on one fundamental purpose: defining the extent of the coastal region that may be inundated in a particular tsunami scenario. This supports first-order disaster planning by allowing disaster managers to assess who and what may be inundated, and where safe places are for evacuating people to. Therefore, in our assessment estimates of inundation extent must be sufficiently robust for decision making in this context. It is acknowledged that other calculated quantities such as flow depth and velocity may be subject to greater levels of uncertainty due to uncertainties in elevation data, and can be important for informing other disaster management decisions beyond the focus of this study.
While it can be expected that the best data in terms of accuracy and resolution will support the most accurate tsunami inundation modeling results, it is important to assess whether lower quality data (that may be cheaper and/or available in more areas) can be used to produce sufficiently reliable tsunami inundation maps to inform first-order evacuation planning (Lewis et al., 2013). This study was originally conceived to inform a data acquisition program for tsunami hazard assessment in Indonesia. We model tsunami inundation for two locations in Indonesia using different DEMs for onshore elevation and different resolutions of the numerical mesh of solution. We then assess which elevation datasets and model resolutions give sufficiently accurate results for the purposes articulated above. We then compare different parameterizations of roughness in order to better understand sensitivity to this parameter and its dependence on the choice of elevation data.
Available Digital Elevation Models (DEMs)
In this study we consider a variety of DEMs that are either commercially or freely available and acquired using different remote sensing techniques, both airborne and satellite derived. Some DEMs are available as both Digital Surface Models (DSM), which usually involve processing first returns from active source techniques (LiDAR and IFSAR, defined below), and Digital Terrain Models (DTM) which attempt to remove buildings, vegetation, and other elements from the dataset to provide a bare-earth elevation dataset. The DEMs considered here are based on what was available in the two study locations at the time of this study. The methods used to derive the DEMs are described below and summarized in Table 1. Note that for all datasets actual vertical accuracies will vary from reported accuracies due to land cover and slope (Hodgson et al., 2003).
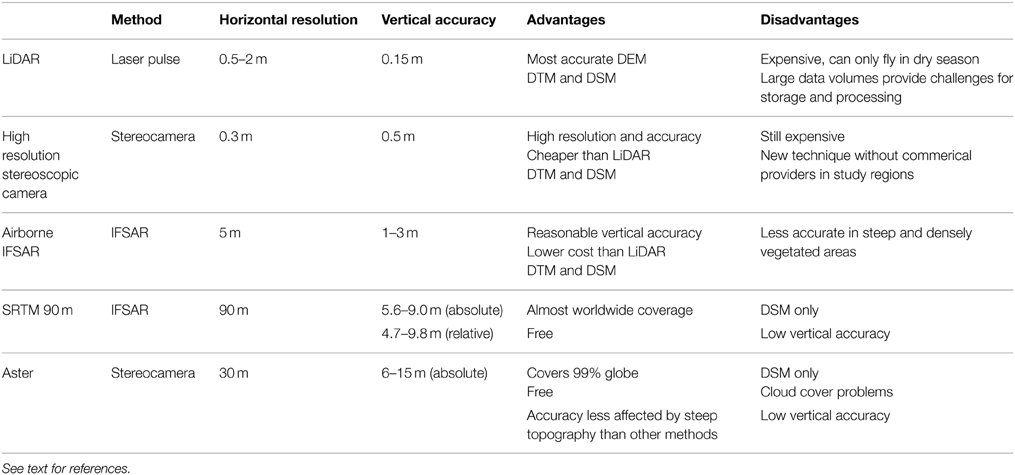
Table 1. A comparison of different topographic data types used in this study.
Light Detection and Ranging (LiDAR) data are collected using an airborne laser transmitter-receiver that measures the time taken for a laser pulse to reflect from surfaces below in order to determine elevation (Hodgson et al., 2003). LiDAR has a horizontal resolution of 0.5–2 m and a stated vertical accuracy of 0.15 m. Clusters of reflections can be used to identify bare earth, vegetation canopies, and buildings. However, this data is expensive and requires cloud-free weather for collection—in tropical regions this can make acquisition during the wet season difficult or impossible.
The Multifunctional camera—High resolution Stereoscopic Camera (HRSC) system was developed by the German Aerospace Centre (DLR) and Remote Sensing Solutions (RSS) (Anko et al., 2008) and uses three camera angles to derive high resolution elevation and imagery data. This system was used in Padang, West Sumatra to develop a digital elevation model with 0.3 m resolution and 0.5 m stated vertical accuracy (Taubenböck et al., 2009).
Airborne Interferometric Synthetic Aperture Radar (IFSAR or INSAR) data have 5 m horizontal resolution and 1–3 m stated vertical accuracy. This uses an airborne X-band (3 cm wavelength) source and sensors to generate a high resolution DEM. X-band radar does not fully penetrate vegetation (Hodgson et al., 2003) and therefore the raw product uses first returns to generate a DSM. Auxiliary data and imagery collected during the survey are then used to manually identify bare earth locations to produce a DTM by interpolation between bare earth points. This method is therefore more effective in open areas but less accurate in densely vegetated areas and areas of high relief, as interpolation of the terrain surface between bare earth locations can smooth topography.
Advanced Spaceborne Thermal Emission and Reflection Radiometer (ASTER) data have been used to generate a DSM using space-borne stereoscopic infrared cameras. It has a horizontal resolution of 30 m and vertical accuracy of 6–15 m depending on the location, which much higher accuracies in bare-earth areas (Tachikawa et al., 2011). This data is free and has almost complete global coverage.
Shuttle Radar Topography Mission (SRTM) data have been used to generate a DSM with approximately 90 m horizontal resolution over much of the earth's surface (Farr and Kobrick, 2000). These data were collected using C-band IFSAR and aimed for a vertical accuracy better than 16 m (Rodriguez et al., 2005). However, Rodriguez et al. (2005) compared SRTM with known ground points and found that SRTM performed better than this, with an absolute height error of 5.6–9.0 m and a relative height error of 4.7–9.8 m for 90% of the data, varying across the earth's surface. Random vertical noise of the order of 6 m has been documented for SRTM (Lewis et al., 2013). SRTM is freely available at 90 m resolution between 60°N and 56°S latitude, or about 80% of the earth's surface (Cowan and Cooper, 2005). A 30 m DSM derived from X-band data is increasingly being made freely available in some regions but was not available for the regions in this study at the time of analysis.
Figure 1 shows a comparison of the different datasets for the Wuring Peninsula, Maumere, and illustrates how the different collection methods generate different elevation surfaces. Representation of the coast in ASTER and SRTM datasets is poor. The SRTM dataset has land protruding up to 100 m seaward of the coastline digitized from high resolution (1 m) imagery, with elevations in excess of 10 m seaward of the coast. Conversely, there are gaps in the ASTER coverage of the Wuring Peninsula. There are also differences in the representation of the coast between the high resolution datasets, LiDAR, and IFSAR. This can be seen in the intertidal region covered by mangroves in the bottom right of the image, which is included in the IFSAR DEM but has been excluded as part of the ocean by the LiDAR providers. Furthermore, the IFSAR DEM appears to capture reflections from some boats in the nearshore region, which must be removed before integration with bathymetry data. Plotting a cross-section of the data (Figure 2) highlights differences in vertical accuracy and horizontal resolution between the datasets and differences between DTMs and DSMs. DTMs can be seen to be smoother than DSMs, and the IFSAR DTM is smoother than the LiDAR DTM.
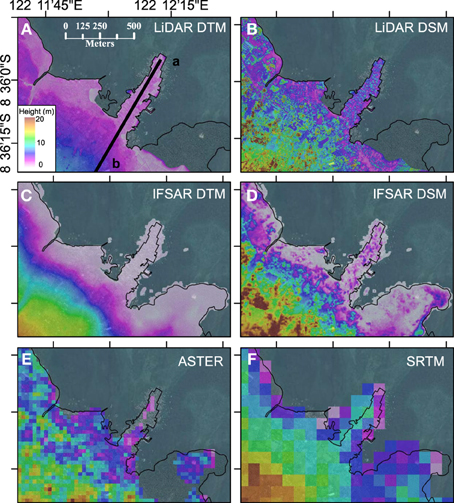
Figure 1. Comparison of elevation data for the Wuring Peninsula, Maumere for (A) LiDAR DTM; (B) LiDAR DSM; (C) IFSAR DTM; (D) IFSAR DSM; (E) ASTER30; and (F) SRTM90. Black line is the coastline digitized from high resolution imagery collected during the LiDAR survey. Line a-b in (A) defines the cross-section shown in Figure 2. See Figure 5 for location of Wuring Peninsula. Underlying imagery from Bing Imagery accessed through ArcGIS.
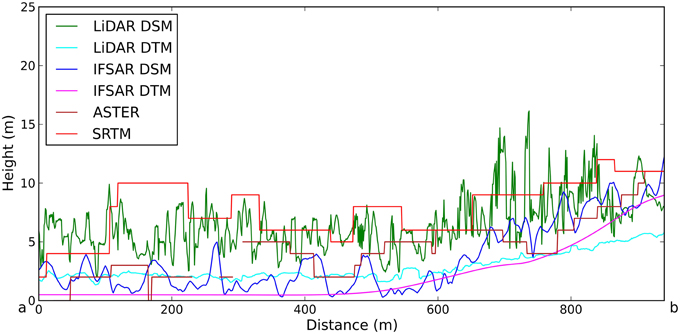
Figure 2. Cross-section of elevation profiles for the different DEM datasets along the line a-b shown in Figure 1A. Note that the ASTER cross-section has discontinuities where there is no data near the coast.
Tsunami Inundation Modeling
Tsunami propagation in the ocean can be described using shallow water theory and onshore inundation may be included by appropriate inundation schemes. For tsunami hazard assessment the 2D (depth integrated) non-linear shallow water (NLSW) equations are commonly implemented and solved numerically on a mesh or grid, and there are many software packages that implement NLSW solvers, such as TUNAMI (Goto et al., 1997), ANUGA (Nielsen et al., 2005), and TsunAWI (Rakowsky et al., 2013). While exact implementation varies, in two dimensions the NLSW equations can be expressed (e.g., Chaudhry, 2008) as two equations describing the conservation of momentum:
and one describing conservation of mass:
In the above equations, u and v are the flow velocities along horizontal x and y axes, t is time, h is the flow depth, z is the bed elevation, and g is the acceleration due to gravity. Sfx and Sfy are frictional forcing terms in the x and y directions respectively. Initial conditions of the deformation of the sea surface due to coseismic crustal deformation are used to force the model. The NLSW equations are also used to simulate fluvial flooding.
Sensitivity of Hydrodynamic Models to Elevation Data
Tsunami inundation is simulated through numerical solution of the NLSW equations (Equations 1–3) over a model of bathymetry and topography with appropriate extensions to model wetting and drying processes. In ANUGA, the conservative finite volume scheme allows discontinuities at the edges of all mesh triangles and therefore can simulate wetting and drying of mesh elements (Jakeman et al., 2010). In the finite element TsunAWI model wetting and drying is performed by an extrapolation scheme extending model quantities from the sea area to land (Lynett et al., 2002; Harig et al., 2008). The numerical solution is sensitive to both elevation data and the resolution of the mesh over which the equations are solved. Furthermore, elevation data must be interpolated to the model mesh introducing interpolation errors.
Horritt et al. (2006) found that model output for shallow fluvial flow was more sensitive to changes in model mesh resolution than changes in topographic data and suggested that mesh resolutions higher than the resolution of the underlying data may improve model performance. Sanders (2007) compared models of flow over a floodplain using LiDAR, airborne IFSAR, SRTM, and the United States Geological Survey's National Elevation Data (NED) and found that using SRTM resulted in an overestimation of the flood footprint by about 25%, which was considered reasonable for some applications. This performance is attributed to SRTM having better relative vertical accuracy in low relief environments such as floodplains. SRTM has also successfully been used to model storm surge inundation in the very low relief Bay of Bengal, after removal of vegetated pixels and smoothing to 900 m (Lewis et al., 2013). Conversely, Gallegos et al. (2009) found that neither SRTM nor the United States Geological Survey's NED were sufficiently accurate for reproducing observed flood footprints for a dam-break scenario in an urban area. Tsubaki and Kawahara (2013) have shown that the sensitivity of NLSW models to mesh resolution is dependent on slope, with low resolution meshes over-predicting the inundated area more significantly in steep areas compared with relatively flat areas.
Compared with fluvial flooding, there has been less work on the sensitivity of hydrodynamic models to elevation data for modeling tsunami inundation. Satake (1995) identified that tsunami models were more sensitive to bathymetry and elevation data than to a choice between use of the linear or NLSW wave equations for reproducing tsunami observations from tide gauges records. Tang et al. (2009) showed that using different elevation datasets gave substantially different inundation results for tsunami inundation models in Hawaii. Tsubaki and Kawahara (2013) found that elevation errors translate into errors in inundation depth of the same magnitude, while errors in flow velocity are larger than the magnitude of the elevation errors. However, if large scale topography is well represented then elevation uncertainties overlaying this may be less significant for estimating inundation extent, as the large scale topography controls the inundated area except in flatter areas.
Titov and Synolakis (1998) identified that a model resolution of 50 m was needed to accurately simulate tsunami propagation over typical coastal features however they do not provide comment regarding the accuracy of elevation data. Kazusa et al. (2004) in developing Cabinet Office recommendations for producing tsunami hazard maps in Japan advised that much higher resolution meshes must be developed to capture small coastal features such as streams, and that accurate modeling required elevation data with an accuracy of 1 m. In the flood context, Schubert and Sanders (2012) identify that appropriate mesh resolution will depend on if and how buildings are including the model.
Roughness
Friction at the boundary between the flow and the sea bottom/land reduces flow momentum. Features of the elevation surface with scales too small to be captured within the elevation model can exert a frictional force on the flow. For example, a surface covered with dense vegetation may retard flow more than a smoother surface such as an open sandy beach. Bed frictional forcing is parameterized through application of the Manning's formula:
where n is the Manning's roughness coefficient that can be derived empirically or estimated based on measurements of flow across real or idealized surfaces.
Forcing due to bed roughness relative to other terms in the NLSW equations in the deep ocean is small (being proportional to h−1/3) but becomes more significant in shallow water. Dao and Tkalich (2007) find that changing n from 0.025 to 0.015 in the open ocean does not change the quality of model fit with Jason-1 satellite observations of the 2004 Indian Ocean Tsunami, however friction values do change nearshore tsunami amplitudes significantly. They find a better match with observations using n = 0.025. Imamura et al. (2006), Latief and Hadi (2007), Imamura (2009) and Sugawara and Goto (2012) also suggest a value of n = 0.025 in the ocean and coastal waters while Satake (1995) uses n = 0.03 for coastal water. Fujima (2001) suggests friction values in the range 0.02–0.05 for modeling tsunami propagation. Kaiser et al. (2011) use a lower value of 0.011 in the sea, equivalent to a smooth surface, in order to fit observational data. Shimozono et al. (2012) use 0.02 in the ocean. Friction parameters are greater on land due to the resistance effects of vegetation and structures that are not included in the elevation model. Shimozono et al. (2012) use 0.05 for all on-land areas in reproducing the 2011 Tohoku tsunami. Kaiser et al. (2011) provide suggested values for Mannings n for a range of land cover types in coastal Thailand.
Figure 2 illustrates the difficulty in choosing appropriate roughness values, as different datasets capture different levels of detail of surface features. In urban areas, buildings may be represented either as elevation in a DSM or through parameterization of roughness using a DTM. Kaiser et al. (2011) compared these two possibilities and found that inundation depth and extent could reasonably be reproduced by using higher friction in urban areas, however friction values needed to be applied at the building scale to accurately reproduce flow velocities between buildings. Similar results have been found for flood modeling by Schubert and Sanders (2012), who compared four different methods for parameterizing buildings in finite-volume flow simulations including application of roughness coefficients at both the building and urban area scale. They found that calculation of flood extent and depth was not strongly sensitive to the roughness method while accurate simulation of flow velocity required building level parameterization.
Study Areas
Tsunami inundation is modeled for two Indonesian communities: Maumere and Padang (Figure 3).
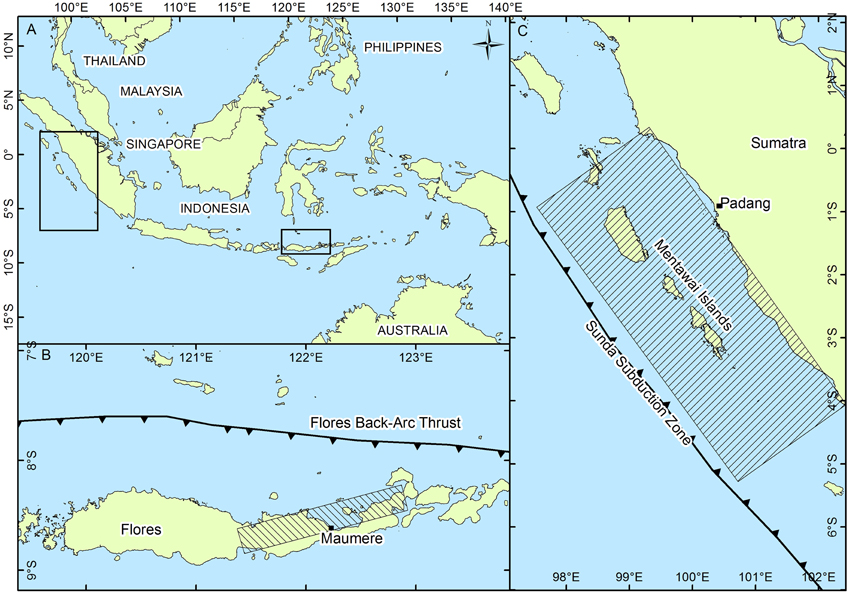
Figure 3. Regional setting (A) with inset maps showing the two study areas (B) Maumere, and (C) Padang. Hatched rectangles show the area of the fault rupture for each source model. Note that the source model for Maumere does not align with where the Flores Back-Arc Thrust is typically mapped. Fault traces are those used in the 2010 revision of Indonesia's national seismic hazard map (Irsyam et al., 2010).
Maumere is located on the north coast of Flores Island in the Indonesian province of East Nusa Tenggara. The population is 78,000 (BPS (Indonesian Central Agency for Statistics), 2014a) and is spread along the coastline, with high densities on the Wuring Peninsula and in the center of the city near the harbor. Coastal areas are either open beaches or fringed by mangroves, with some coral reefs extending offshore. This shallow platform drops off rapidly to depths of over 200 m within 0.7–2.0 km of the coastline. To the north of Maumere is the Flores Back-Arc Thrust, the main source of tsunami hazard for Maumere and northern Flores. In 1992 a moment magnitude (Mw) 7.8 earthquake generated a tsunami that inundated Maumere and northern Flores, killing about 2000 people (Tsuji et al., 1995).
Padang is a densely populated city of 877,000 people (BPS (Indonesian Central Agency for Statistics), 2014b) situated on a low lying coastal plain located at the foot of the Barisan Mountains in West Sumatra. Several beach ridges run parallel to the coast and it is bounded to the north, east, and south by rivers. Offshore the bathymetry slopes to depths of 200 m at about 20 km offshore. Padang was inundated by tsunami generated by earthquakes on the Mentawai Segment of the Sunda Subduction Zone in 1797 and 1833. Geological evidence suggests such events have a recurrence interval of approximately 200 years and therefore a similar event is anticipated to occur in the next few decades (Sieh et al., 2008).
Model Description
Software
A number of tsunami inundation models that solve the NLSW wave equations are available and have been validated against analytical solutions, wave tank experiments, and real tsunami data. In this study we use two models: ANUGA (finite volume; Nielsen et al., 2005; Jakeman et al., 2010); and TsunAWI (finite element; Rakowsky et al., 2013). ANUGA and TsunAWI discretise elevation data onto irregular triangular meshes. In TsunAWI elevation data is fitted to the mesh using a nearest-neighbor technique while ANUGA fits elevation data to the mesh using a global penalized least-squares fitting. ANUGA solves the NLSW equations in Cartesian coordinates while TsunAWI uses geographic coordinates and includes Coriolis forcing. Therefore, although both models are validated for their ability to realistically model tsunami, differences in the results are expected based on the use of different numerical schemes, forcing terms, and the way elevation data is represented in the model.
Tsunami Source Models
Several earthquake source models were published following the 1992 Flores earthquake and tsunami event (Imamura and Kikuchi, 1994; Beckers and Lay, 1995; Hidayat et al., 1995), however these were all limited to one or two subfaults. For this study a new source model is generated using 10 × 10 km subfaults by jointly fitting body wave, surface wave, and coseismic displacement data using the method of Thio et al. (2004), allowing much higher spatial resolution of the slip distribution. The two observed vertical coseismic displacements closest to the hypocenter have been down-weighted by a factor of 0.5 to reduce their dominance of the solution. The source model, waveform fits, and surface deformation are shown in Figure 4. The seismic waveform data and coseismic uplift/subsidence constrained the fault position and geometry to be similar to but significantly different from those used in previous studies (Table 2). Furthermore, our model has a region of high slip (20 m) near the hypocenter, which was required to fit the magnitude and pattern of cosesmic uplift and subsidence along the northern coast of Flores observed after the earthquake. Note that our source model, along with those obtained in previous studies, agrees with the observed pattern of aftershocks but does not coincide with the location of the Flores Back-Arc Thrust as typically indicated on maps of the regional tectonics (e.g., Irsyam et al., 2010). Rather, it is partly onshore suggesting that the Flores Back-Arc region is more complicated tectonically than is typically portrayed.
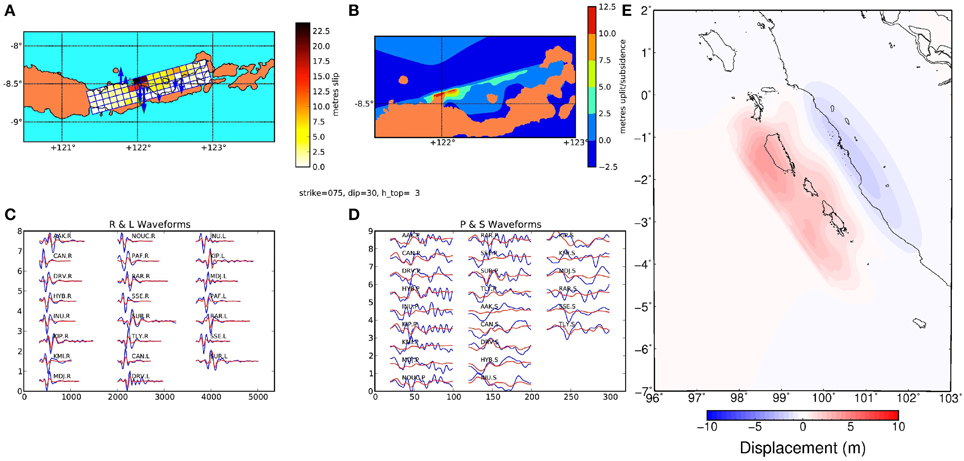
Figure 4. Source model for the 1992 Flores earthquake and tsunami. (A) Best fit model of slip distribution with observed (blue) and modeled (green) subsidence shown by vertical arrows; (B) resulting surface deformation; (C) Surface wave observations (blue) and model fit (red); (D) body wave observations (blue) and model fit (red). Surface deformation for the Padang consensus source mode (E).
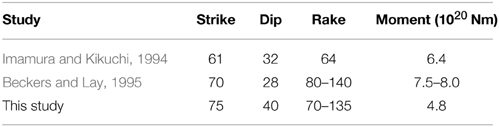
Table 2. Comparison of fault parameters for the 1992 Flores earthquake.
The tsunami threat to Padang from the Sumatran Megathrust directly offshore has been well studied (Borrero et al., 2006; Natawidjaja et al., 2006; McCloskey et al., 2008; Sieh et al., 2008; Schlurmann et al., 2010). We use the consensus source model of Schlurmann et al. (2010) (Figure 4E) that estimates the accumulated slip on the megathrust since previous ruptures in 1797 and 1833 (Natawidjaja et al., 2006; Chlieh et al., 2008). Note that this model does not take into account reduction in accumulated stress along the southern-most section of this source due to the recent Mw 7.8 25 October 2010 Mentawai Islands earthquake and tsunami. It also does not consider the potential for slip to occur right at the trench (which is not recorded in the geodetic studies used to inform this model) and therefore potentially does not represent the worst case for tsunami generation (Hill et al., 2012; Griffin et al., 2015).
Model Setup
Figure 5 shows the mesh used for the ANUGA models for Maumere and Padang and the TsunAWI model for Maumere. Both models use unstructured triangular meshes, with internal polygons used to define the maximum allowable size of an individual mesh element within that region. The smallest polygon shows the area of interest (AOI) that is used in the comparisons of inundation extent for the different data types. For the comparison of the different elevation datasets the same computational mesh was used in each simulation. Bathymetry data is not varied between simulations. We use a 90 m commercial bathymetry dataset provided by TCarta Marine for depths shallower than 1000 m and the General Bathymetric Chart of the Oceans (GEBCO) in deeper areas. The mesh resolution within the AOI was then varied to compare the effect of changing mesh resolution.
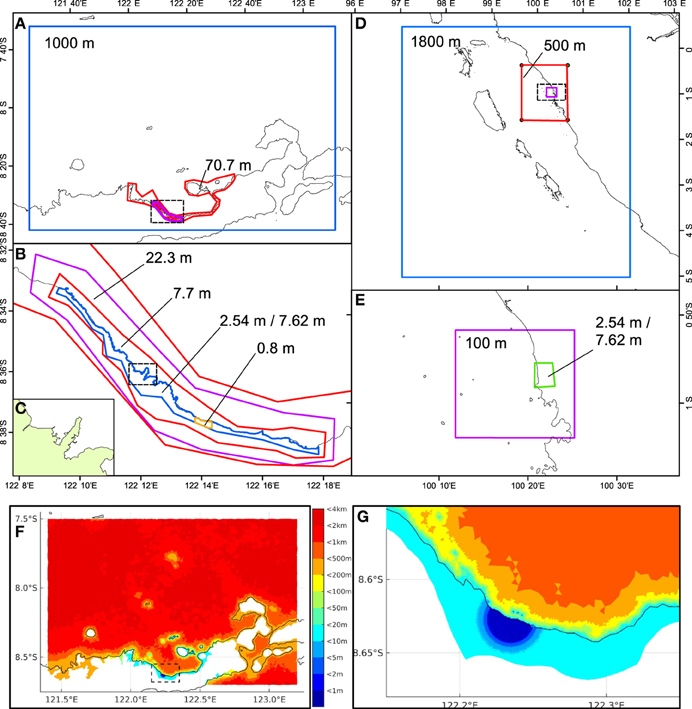
Figure 5. Polygons showing regions of different mesh resolution for the ANUGA models for: (A) north-eastern Flores, with the dashed black line showing the high resolution area shown in (B); (B) the coastline near Maumere, including the Wuring Peninsula, which is indicated by the dashed black rectangle; (C) the Wuring Peninsula, which is shown in Figures 1, 7, 12; (D) the Padang coastline, with the dashed black line showing the high resolution area shown in (E); (E) the coastline near Padang. The mesh resolution (m) in each polygon is indicated by the numbers in black. The blue rectangles in (A, D) outline the model boundaries for Maumere and Padang, respectively. Internal mesh resolution for TsunAWI model for Maumere is shown in (F) with dashed black line showing the high resolution area shown in (G).
Comparison of Inundated Area
In the absence of high quality observational data in the study areas, we define the benchmark model based on the highest resolution DTM available for each area with our best estimate of the appropriate friction coefficient from the available literature. That is, for Maumere we use the LiDAR DTM and for Padang the HRSC DTM. Following Kaiser et al. (2011) we apply a Manning's n of 0.06 for onshore regions of the Maumere model (medium density urban area) and 0.08 for onshore regions of the Padang model (high density urban area). Manning's n is 0.025 in offshore regions for the benchmark models.
The area of modeled inundation, A(Im), is compared against modeled inundation for a benchmark model, A(Ib). This is quantified following Jakeman et al. (2010) using the measures:
Where Pin refers to the proportion of the area inundated in the benchmark model that is not captured by the model being tested, whereas Pout is the area of the inundated area of the model being tested that falls outside of the benchmark model area, relative to the benchmark model area. Note that as both measures have the same denominator, they are not symmetrical. Pin scales between 0 and 1 with zero indicating a perfect fit. Pout is not constrained in the same way; values approaching 0 indicate that the modeled area outside the benchmark region is small relative to the area of the benchmark region, but do not necessarily indicate a good model fit unless Pin is also close to 0 (e.g., considering the case of disjoint inundation area).
For the comparison datasets, we use a constant low Manning's n of 0.025 in both the ocean and on land to ensure sensitivities are due to elevation data and not varying friction values. We then compare increased on-land friction values. This allows us to compare the sensitivity to friction parameters with sensitivity to onshore elevation data.
The field survey of the 1992 Flores tsunami by Tsuji et al. (1995) provides tsunami run-up data along the northern coast of Flores, with GPS locations of observed run-ups and sketch maps provided. The sketch maps were georeferenced using marked GPS observation points and key buildings, roads, and other geographic features that are visible in BING Maps aerial imagery for the region using the ArcGIS software. GPS locations for some features from Tsuji et al. (1995) do not match the locations of the features as observed in imagery and we estimate horizontal errors of 100 m in the resulting georeferenced sketches. These sketches allow us to use the Pin and Pout measures to assess the performance of our models against observation data for the Wuring Peninsula, one of the most heavily impacted parts of Maumere during the 1992 event.
Results
Comparison of Different Data Types
Figure 6 shows the values of Pin and Pout for inundation model results derived using each dataset for Maumere and Padang, calculated against our benchmark models. Figures 7, 8 plot inundation extents in the two locations. The results show that the IFSAR and LiDAR DTMs predict a greater inundation extent while all the other datasets, which are all DSMs, predict a smaller inundation extent. Differences between the DTM and DSM results for IFSAR and LiDAR are greater than differences between these two data types when comparing just DTMs or just DSMs.
Figure 6. Pin and Pout values for (A) Maumere, ANUGA model; (B) Maumere, TsunAWI model; and (C) Padang, ANUGA model, calculated against the benchmark models. Comparison models use Manning's n = 0.025 while benchmark models have onshore n = 0.06 (Maumere) and 0.08 (Padang).
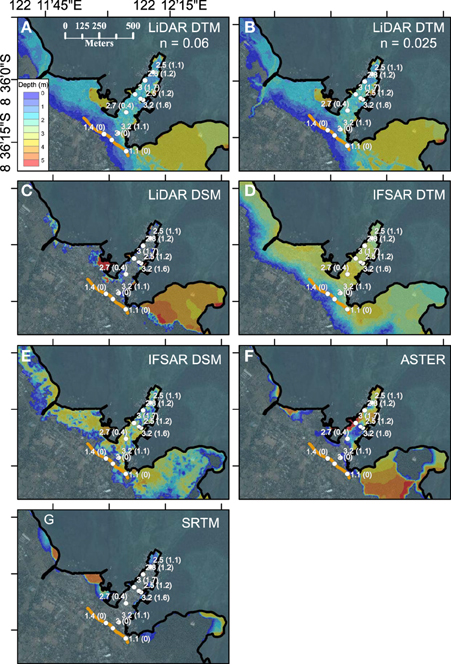
Figure 7. Comparison between inundation limit from georeferenced observational sketch from Tsuji et al. (1995) (orange line) and ANUGA inundation models for Wuring Peninsula, Flores, for (A) benchmark model using LiDAR DTM (n = 0.06); and comparison models (n = 0.025) for (B) LiDAR DTM; (C) LiDAR DSM; (D) IFSAR DTM; (E) IFSAR DSM; (F) ASTER; and (G) SRTM. Mesh resolution is 7.62 m. White figures show tsunami heights in meters from Tsuji et al. (1995) observations with tsunami flow depths in parentheses.
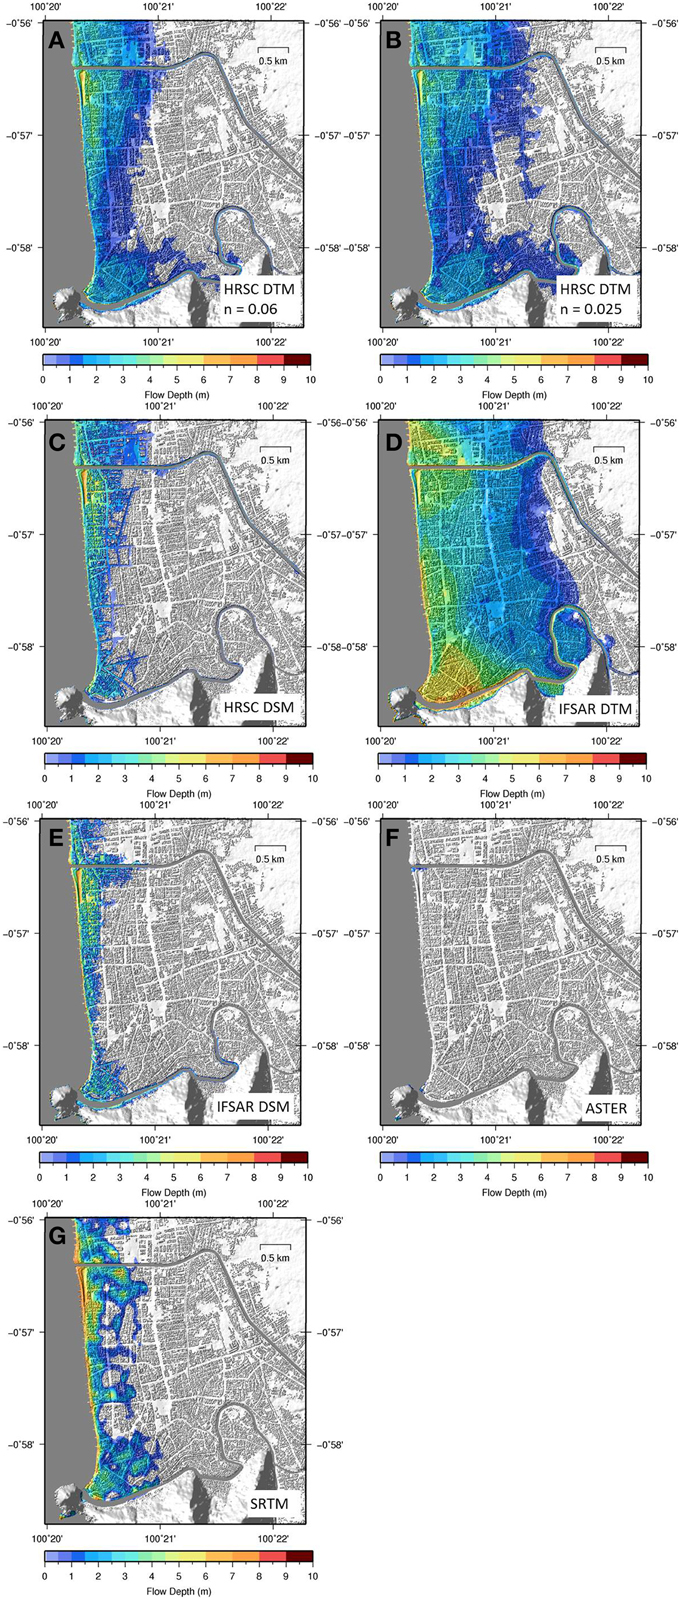
Figure 8. Inundation results for the 7.62 m mesh resolution ANUGA model for Padang for (A) HRSC DTM benchmark model (n = 0.08); and comparison models (n = 0.025) (B) HRSC DTM; (C) HRSC DSM; (D) IFSAR DTM; (E) IFSAR DSM; (F) ASTER; and (G) SRTM.
Figure 7 compares modeled and observed inundation for the 1992 Flores tsunami for the Wuring Peninsula, Maumere, with Pin and Pout calculations shown in Figure 9. The LiDAR and IFSAR DTMs slightly overestimate the observed inundation (Pout values of 0.22 and 0.28 respectively) noting that we probably use unreasonably low Manning's roughness values. The IFSAR DSM also matches the observations reasonable well, underestimating and overestimating the inundation extent by a similar amount in different areas. Inundation models using the LiDAR DSM, ASTER, and SRTM DSMs produce much less inundation than that observed (Pin values of 0.56, 0.39, and 0.77 respectively), with almost no inundation occurring in the SRTM case.
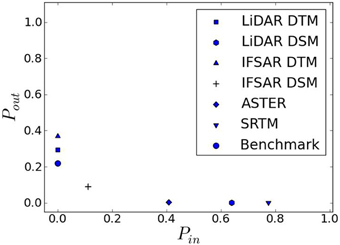
Figure 9. Pin and Pout values for modeled results compared with observations of tsunami inundation from Tsuji et al. (1995) for the Wuring Peninsula (area of sketch shown in Figure 6) for ANUGA simulations.
Comparison of Different Mesh Resolutions
A comparison of the same model (ANUGA) and elevation data (IFSAR DTM) using different mesh resolutions for Maumere is shown in Figure 10. The inundated area is very similar for all resolutions with only the 68.63 m model showing clear deviations as a result of the coarser resolution. This suggests that in this example, which is for a fairly uniform coastal geomorphology, the IFSAR data is sampling the topography at a higher horizontal resolution than is needed to simulate inundation.
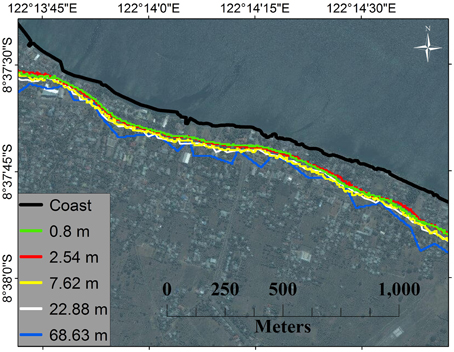
Figure 10. Comparison of modeled tsunami inundation depth for ANUGA models using the IFSAR DTM for different mesh resolutions for part of Maumere. See Figure 5B for location.
The effect of increasing model resolution is different for DTM and DSM. Figure 11 shows Pin and Pout values for LiDAR DTM and DSM, with the benchmark model in this case being the highest resolution model where convergence errors are expected to be at a minimum. All models use constant Manning's n = 0.025. For the DTM, as model resolution is decreased the model predicts a greater inundation area. For DSM as model resolution is increased the Pin values increase. This is likely because a finer resolution is need to resolve flow between buildings, trees, and other surface features. As a coarser resolution is used, interpolation of elevation to the model mesh may smooth these features toward average elevation values that are above the level of the terrain surface resulting in reduced inundation in some areas. The TsunAWI model results show less sensitivity to mesh resolution than the ANUGA results.
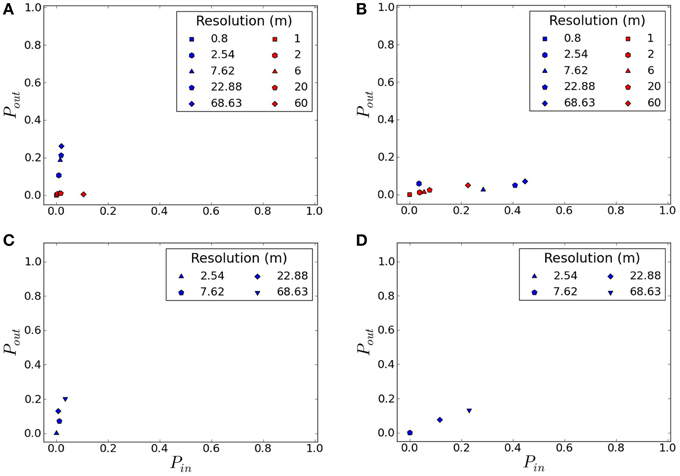
Figure 11. Pin and Pout values for different mesh resolutions for (A) LiDAR DTM and (B) LiDAR DSM for Maumere; (C) HRSC DTM and (D) HRSC DSM for Padang. The benchmark model is the model with the highest mesh resolution where convergence errors are assumed to be most reduced. ANUGA results are in blue, TsunAWI results are in red.
Sensitivity to Onshore Friction Values
Figures 12, 13 show different onshore friction values for the Wuring Peninsula, Maumere, and Padang, respectively. For Maumere, changing the onshore friction value does not significantly alter the inundation extent, whereas for Padang the effect is dramatic. In the case of Maumere, the extent of inundation is controlled more strongly by the topography. Conversely, for Padang the elevation is very flat and does not provide a topographic barrier to tsunami propagation, therefore friction is more dominant in controlling inundation extent. For Padang the inundation extent using HRSC DTM and Manning's n = 0.01 (Figure 13A) is similar to that obtained using IFSAR DTM and Manning's n = 0.025 (Figure 8D).
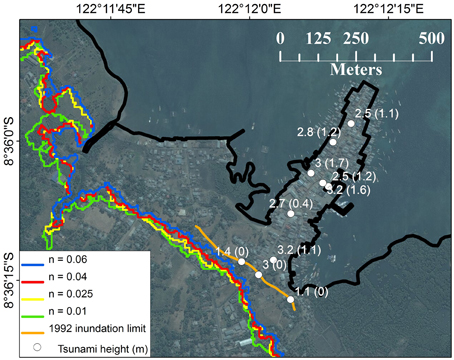
Figure 12. Comparison between inundation limit (orange line) from georeferenced observational sketch from Tsuji et al. (1995) and ANUGA inundation models for Wuring Peninsula, Flores, for LiDAR DTM using onshore Manning's n-values of 0.01, 0.025, 0.04, and 0.06. Mesh resolution is 7.62 m. White numbers give tsunami heights from the field survey with tsunami flow depths in parentheses.
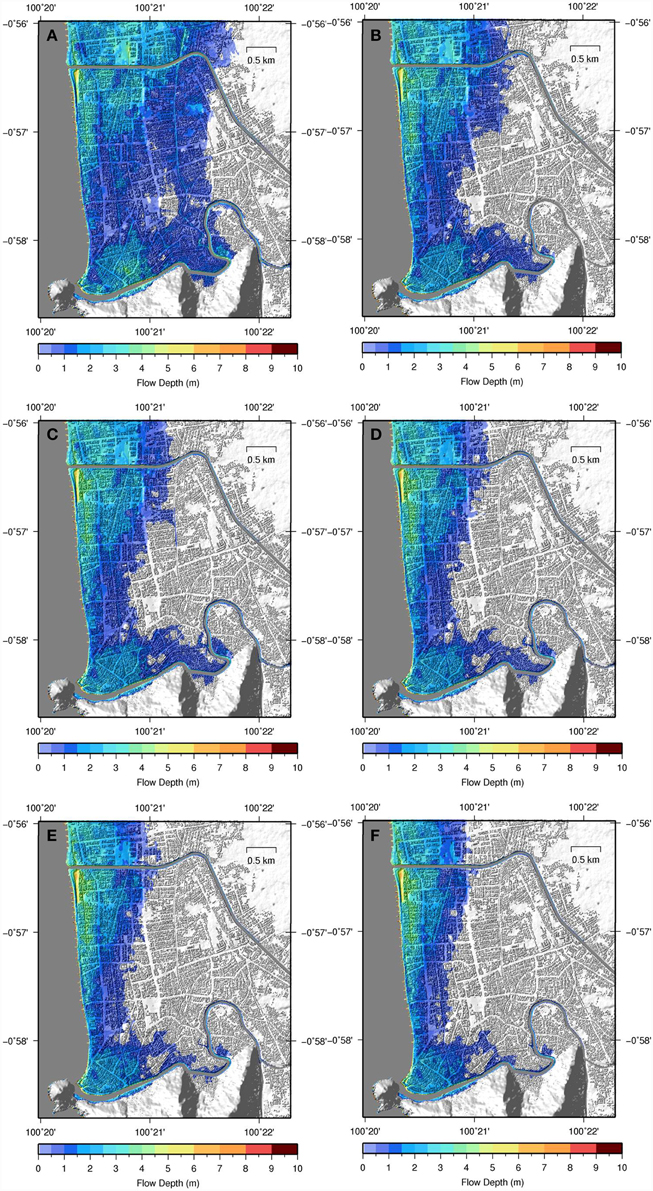
Figure 13. Comparison between ANUGA inundation models for Padang for LiDAR DTM using onshore Manning's n-values of (A) 0.01; (B) 0.025; (C) 0.04; (D) 0.06; (E) 0.08, and (F) 0.1. Mesh resolution is 7.62.
Discussion
The results presented in this paper clearly demonstrate that the present generation of freely available global DEMs (i.e., ASTER and SRTM90) are not sufficiently accurate to simulate tsunami inundation with confidence. These datasets are limited by their vertical accuracy, with coastal elevation errors that may exceed the amplitude of the tsunami wave being simulated. Unfortunately tsunami hazard assessments continue to use these datasets based on the argument that they are the “best available” when more accurate datasets are not available for part or all of the study region (e.g., DLR and GTZ, 2010; Latief, 2012; Norwegian Geotechnical Institute (NGI) and Geoscience Australia (GA), 2015). We therefore advocate for the development of a global, freely available, high vertical accuracy digital elevation model that would have many benefits to society, one of which would be informing tsunami hazard assessment and evacuation planning.
Simulations of the 2011 Tohoku Tsunami (Løvholt et al., 2012) and 2007 Tropical Cyclone Sidr storm surge (Lewis et al., 2013) events have demonstrated good results by making adjustments to the SRTM elevation model by removing cells containing vegetation and interpolating elevation values from adjacent cells. Lewis et al. (2013) also smoothed the SRTM dataset to a resolution of 900 m, which was sufficient for reproducing storm surge inundation extent in the very low relief Bay of Bengal. However, generalization of these results is limited by their dependence on manual identification of vegetation cover using additional datasets and the presence of nearby vegetation-free cells in order to interpolate the elevation surface. Calibration of channel depth (Lewis et al., 2013), Mannings n (Løvholt et al., 2012) Lewis et al., 2013), and the tsunami source model (Løvholt et al., 2012) further limit the generality of these results. We are not aware of any method that has been applied on a global scale that improves the vertical accuracy of the SRTM elevation model to be sufficient for the purposes articulated in this paper. Nevertheless, the promising results shown by (Løvholt et al., 2012) and Lewis et al. (2013) suggest further research should examine whether additional datasets such as imagery can be used to significantly improve the vertical accuracy of the global SRTM elevation model.
In cases where ASTER or SRTM are presently the “best available” elevation datasets we recommend that alternative strategies are used to underpin tsunami evacuation planning. This may include conservative estimation of the potential inundation zone based on historical records of tsunami or recent tsunami experiences from neighboring regions. Tsunami hazard maps derived using ASTER or SRTM may be dangerously misleading, and this may be amplified as the use of computational models may imply a greater confidence in the results than is warranted, even if appropriate caveats are given. Therefore, we argue that it is better not to have a modeled tsunami inundation map and instead develop alternative strategies than to use a map that may severely underestimate tsunami inundation extents.
The key limitation in the use of ASTER and SRTM datasets is vertical accuracy. This is in part derived from the fact that they are DSMs, and therefore may represent the canopy of coastal vegetation rather than the surface, along with uncertainties inherent in the methods used to derive elevation measurements. Horizontal resolution is less important in the case studies presented here, if DTMs are used. Using a mesh resolution of 25 m (i.e., similar to the horizontal resolution of ASTER data) is sufficient for modeling inundation extent; higher resolutions are only required if there is a requirement to resolve flow through and around individual features that may be captured in a DSM such as seawalls, inlets or buildings. For example, for hydrodynamic modeling of flood flow between buildings Gallegos et al. (2009) suggest a mesh resolution of approximately 5 m. These higher resolutions may be required for engineering purposes or detailed risk assessment, however in order to define evacuation areas a 25 m model resolution using an accurate DTM is sufficient.
Modeled inundation extents obtained using airborne IFSAR are comparable with those using higher accuracy LiDAR and HRSC datasets. Differences in modeled inundation between DTM and DSM for IFSAR and LiDAR/HRSC are greater than differences between the two data types. In the DSM models, features such as buildings and vegetation become solid parts of the elevation data and water must flow over or around them. Clearly this does not represent reality; although some structures may resist flow in a real tsunami, water can flow through buildings and vegetation, and some structures can be expected to be destroyed. A DTM, on the other hand, removes all of these features, and therefore does not capture any of the flow resistance that would be offered by these structures in a real tsunami. Flow resistance due to these features can be modeled by the inclusion of spatially varying friction parameters (Manning's roughness) and this has been done, for example, by Kaiser et al. (2011) for Patong, Thailand. This is much more important in flat areas, such as Padang, where friction becomes significant relative to the effect of topography. To avoid underestimating inundation extent as may happen with DSMs, we suggest that the best approach for assessing inundation extent is to use DTMs using appropriate roughness parameters to capture the effect of surface features. Further research is needed to determine the spatial scale at which friction needs to be parameterized through detailed comparison with observational run-ups. However, in any particular study it must be considered whether high resolution information on flow between buildings or other structures is required in which case more explicit inclusion of a building model derived from a DSM may be important (e.g., Schubert and Sanders, 2012).
Inundation distances are generally a little further for IFSAR DTM compared with LiDAR DTM. This can be partly explained by differences in actual elevation values in the IFSAR DTM, but an additional factor is that the LiDAR DTM is rougher than the IFSAR DTM (Figure 2). Along with the smoothing provided by the coarser horizontal resolution, the method used to extract the DTM from raw observations is different for each of the datasets. The LiDAR DTM is derived from the lowest return signals recorded whereas the IFSAR DTM is based on manual identification of bare earth points and then interpolation between these points, which can smooth over topographic features in between if they are obscured by the canopy. Furthermore, the model mesh resolution will also determine which topographic features are captured explicitly and which become “sub-grid” features captured by the roughness coefficient. Therefore, we conclude that it will not be possible to develop definitive recommendations regarding roughness coefficients for particular land cover types that are independent of the particular DEM and mesh resolution used in a tsunami inundation model.
The study presented here is limited in scope to considering onshore elevation data with the same “best available” bathymetry model being used in each case. This allows us to test sensitivity to changing the onshore elevation data type but leaves open the criticism that the “best available” bathymetry data used in this study may not be sufficiently accurate for modeling tsunami inundation. Comparison of our model results with observations of the 1992 Flores tsunami (Figure 7) shows that the bathymetry data used is sufficiently accurate to achieve robust results in this study but nevertheless we recommend a similar study be undertaken to assess the sensitivity of inundation results to different bathymetry datasets, particularly in the nearshore environment.
Conclusions
Different digital elevation data types have been tested for modeling the extent of tsunami inundation at two different locations in Indonesia. Based on the results of this study the following statements can be made:
• Tsunami inundation models developed using DEMs that are currently freely available at a global scale (i.e., ASTER and SRTM) have the potential to dangerously underestimate the inundation extent. These datasets should not be used to assess tsunami inundation zones using hydrodynamic models.
• Tsunami inundation models developed using airborne IFSAR DTMs may give inundation extents that are similar to those obtained using higher accuracy data, and observations where available, for model mesh resolutions between 0.8 and 68.63 m. These models overestimate inundation extent and therefore are suitable for use in the absence of higher accuracy data.
• Comparing results using airborne IFSAR with LiDAR and HRSC datasets, differences in inundation extent between DSMs and DTMs for the same dataset are greater then differences in inundation extent between the datasets. Tsunami inundation models developed using DSMs underestimate inundation extent while those developed using DTMs overestimate inundation extent where we have observations. It is recommended to use DTMs for modeling inundation extent.
• Further research is needed to determine at what scale spatially variable roughness should be applied, and the dependence of roughness values on the roughness of the underlying DEM.
• The importance of roughness is dependent on the topography of the coastal region. Changing Manning's roughness coefficients from 0.01 to 0.06 has a negligible effect on inundation extent for Maumere while halving the inundation extent in Padang.
• A mesh resolution of 25 m is suitable for estimating inundation extent using a DTM. Higher resolutions are needed to accurately model flow between and around individual structures if a DSM is used, or to better capture flow up rivers and inlets.
Conflict of Interest Statement
The authors declare that the research was conducted in the absence of any commercial or financial relationships that could be construed as a potential conflict of interest.
Acknowledgments
The authors would like to thank DLR for sharing the HRSC digital elevation model for Padang. Funding for other elevation data purchases was provided by the Australian Department of Foreign Affairs and Trade and the Indonesian National Disaster Management Agency through the Australia-Indonesia Facility for Disaster Reduction (AIFDR). Funding for participation in this project by the Alfred Wegener Institute was provided by PROTECTS (Project for Training, Education and Consulting for Tsunami Early Warning Systems) by the German Federal Ministry for Education and Research (BMBF), grant 03TSU07. The authors thank Kristy Van Putten, Ole Nielsen, Trevor Dhu (AIFDR) and Leharne Fountain (Geoscience Australia) for assistance with presenting the results of this work. The manuscript was substantially improved by reviews from Rikki Weber and Gareth Davies (Geoscience Australia), Matthew Lewis (Bangor University) and Dai Yamazaki (JAMSTEC). Imagery is courtesy of Bing Imagery provided through ArcGIS software. Some data processing and figure preparation was done using the Generic Mapping Tools (Wessel and Smith, 1998). This paper is published with the permission of the CEO, Geoscience Australia.
References
Anko, B., Heiko, H., Karsten, S., Michael, S., and Jurgen, W. (2008). “MFC—a modular line camera for 3D world modulling,” in RobVis LNCS, Vol. 4931, eds G. Sommer and R. Klette (Berlin; Heidelberg: Springer), 319–326.
Beckers, J., and Lay, T. (1995). Very broadband seismic analysis of the 1992 Flores, Indonesia, earthquake (Mw = 7.9). J. Geophys. Res. 100, 18179–18193. doi: 10.1029/95JB01689
Borrero, J. C., Sieh, K., Chlieh, M., and Synolakis, C. E. (2006). Tsunami inundation modeling for western Sumatra. Proc. Natl. Acad. Sci. U.S.A. 103, 19673–19677. doi: 10.1073/pnas.0604069103
BPS (Indonesian Central Agency for Statistics). (2014a). Sikka Regency in Figures. Jakarta: BPS Catalogue.
BPS (Indonesian Central Agency for Statistics). (2014b). Sumatra Barat in Figures. Jakarta: BPS Catalogue.
Casas, A., Benito, G., Thorndycraft, V. R., and Rico, M. (2006). The topographic data source of digital terrain models as a key element in the accuracy of hydraulic flood modelling. Earth Surf. Proc. Landf. 31, 444–456. doi: 10.1002/esp.1278
Chlieh, M., Avouac, J. P., Sieh, K., Natawidjaja, D. H., and Galetzka, J. (2008). Heterogeneous coupling of the Sumatran megathrust constrained by geodetic and paleogeodetic measurements. J. Geophys. Res. Solid Earth 113:B05305. doi: 10.1029/2007JB004981
Cowan, D., and Cooper, G. (2005). The Shuttle Radar Topography Mission—a new source of near-global digital elevation data. Explor. Geophys. 36, 334–340. doi: 10.1071/EG05334
Dao, M., and Tkalich, P. (2007). Tsunami propagation modeling: a sensitivity study. Nat. Hazards Earth Sys. Sci. 7, 741–754. doi: 10.5194/nhess-7-741-2007
DLR (German Aerospace Centre) GTZ (German Technical Cooperation Agency). (2010). Tsunami Hazard Maps for Kabupaten Cilacap. Technical Documentation. Available online at: http://www.gitews.org/tsunami-kit/en/E1/further_resources/hazard_maps/central_java/Technical%20Dokumentation%20Tsunami%20Hazard%20Map%20Cilacap.pdf
Farr, T. G., and Kobrick, M. (2000). Shuttle Radar Topography Mission produces a wealth of data. Eos Trans. Am. Geophys. Union 81, 583–585. doi: 10.1029/EO081i048p00583
Fujima, K. (2001). “Long wave propagation on large roughness,” in Proceedings International Tsunami Symposium (Seattle, WA), 7–22.
Gallegos, H. A., Schubert, J. E., and Sanders, B. F. (2009). Two-dimensional, high-resolution modeling of urban dam-break flooding: a case study of Baldwin Hills, California. Adv. Water Resour. 32, 1323–1335. doi: 10.1016/j.advwatres.2009.05.008
Goto, C., Ogawa, Y., Shuto, N., and Imamura, F. (1997). IUGG/IOC Time Project: Numerical Method of Tsunami Simulation with the Leap-Frog Scheme. Paris: IOC Manuals and Guides No. 35; UNESCO.
Griffin, J. D., Pranantyo, I. R., Kongko, W., Haunan, A., Robiana, R., Miller, V., et al. (2015). Assessing Tsunami Hazard Using Heterogeneous Slip Models in the Mentawai Islands, Indonesia. Geohazards in Indonesia. London, UK: Geological Society of London Special Publication.
Harig, S., Chaeroni, C., Pranowo, W. S., and Behrens, J. (2008). Tsunami simulations on several scales. Ocean Dyn. 58, 429–440. doi: 10.1007/s10236-008-0162-5
Hidayat, D., Barker, J. S., and Satake, K. (1995). Modeling the seismic source and tsunami generation of the December 12, 1992 Flores Island, Indonesia, earthquake. Pure Appl. Geophys. 144, 537–554. doi: 10.1007/978-3-0348-7279-9_10
Hill, E. M., Borrero, J. C., Huang, Z., Qiu, Q., Banerjee, P., Natawidjaja, D. H., et al. (2012). The 2010 Mw 7.8 Mentawai earthquake: very shallow source of a rare tsunami earthquake determined from tsunami field survey and near−field GPS data. J. Geophys. Res. Solid Earth 117:B06402. doi: 10.1029/2012JB009159
Hodgson, M. E., Jensen, J. R., Schmidt, L., Schill, S., and Davis, B. (2003). An evaluation of LIDAR-and IFSAR-derived digital elevation models in leaf-on conditions with USGS Level 1 and Level 2 DEMs. Remote Sens. Environ. 84, 295–308. doi: 10.1016/S0034-4257(02)00114-1
Horritt, M. S., Bates, P. D., and Mattinson, M. J. (2006). Effects of mesh resolution and topographic representation in 2D finite volume models of shallow water fluvial flow. J. Hydrol. 329, 306–314. doi: 10.1016/j.jhydrol.2006.02.016
Imamura, F. (2009). “Tsunami modelling: calculating inundation and hazard maps,” in Tsunamis. The Sea, Ideas and Observations on Progress in the Studies of the Sea, Vol. 15, eds E. Bernard and A. Robinson (Cambridge, MA: Harvard University Press), 321–332.
Imamura, F., and Kikuchi, M. (1994). Moment realease of the 1992 Flores Island earthquake inferred from tsunami and teleseismic data. Sci. Tsunami Hazards 12, 67–76.
Imamura, F., Yalciner, A., and Ozyurt, G. (2006). Tsunami Modeling Manual. Available online at: http://www.tsunami.civil.tohoku.ac.jp/hokusai3/E/projects/manual-ver-3.1.pdf
Irsyam, M., Sengara, W., Aldiamar, F., Widiyantoro, S., Triyoso, W., Natawidjaja, D. H., et al. (2010). Development of Seismic Hazard Maps for Indonesia for Revision of Seismic Hazard Map in SNI 03-1726-2002. Bandung: Bandung Institute of Technology.
Jakeman, J., Nielsen, O., Van Putten, K., Mleczko, R., Burbidge, D., and Horspool, N. (2010). Towards spatially distributed quantitative assessment of tsunami inundation models. Ocean Dyn. 60, 1115–1138. doi: 10.1007/s10236-010-0312-4
Kaiser, G., Scheele, L., Kortenhaus, A., Løvholt, F., Römer, H., and Leschka, S. (2011). The influence of land cover roughness on the results of high resolution tsunami inundation modeling. Nat. Hazards Earth Sys. Sci. 11, 2521–2540. doi: 10.5194/nhess-11-2521-2011
Kazusa, S., Takeda, M., Kageyama, T., Hosomi, Y., and Sunohara, Y. (2004). Tsunami and Storm Surge Hazard Map Manual. Study Committee on Tsunami and Storm Surge Hazard Maps, Cabinet Office (Disaster Management). Available online at: http://www.icharm.pwri.go.jp/publication/pdf/2004/tsunami_and_storm_surge_hazard_map_manual.pdf
Latief, H. (2012). “Kaijian risiko tsunami di Provinsi Sumatera Barat dan Upaya Mitigasinya,” in Proceedings of the 37th HAGI Annual Convention and Exhibition (Palembang).
Latief, H., and Hadi, S. (2007). “Coastal protection in the aftermath of the Indian Ocean tsunami: what role for forests and trees?” in The Role of Forests and Trees in Protecting Coastal Areas against Tsunamis, eds S. Braatz, S. Fortuna, J. Broadhead, and R. Leslie (Khao Lak: Food and Agricultural Society of the United Nations, Regional Office for Asia and the Pacific).
Lewis, M., Bates, P., Horsburgh, K., Neal, J., and Schumann, G. (2013). A storm surge inundation model of the northern Bay of Bengal using publicly available data. Q. J. R. Meteorol. Soc. 139, 358–369. doi: 10.1002/qj.2040
Løvholt, F., Kaiser, G., Glimsdal, S., Scheele, L., Harbitz, C. B., and Pedersen, G. (2012). Modeling propagation and inundation of the 11 March 2011 Tohoku tsunami. Nat. Hazards Earth Sys. Sci. 12, 1017–1028. doi: 10.5194/nhess-12-1017-2012
Lynett, P. J., Wu, T.-R., and Liu, P. L.-F. (2002). Modeling wave runup with depth-integrated equations. Coas. Eng. 46, 89–107. doi: 10.1016/S0378-3839(02)00043-1
McCloskey, J., Antonioli, A., Piatanesi, A., Sieh, K., Steacy, S., Nalbant, S., et al. (2008). Tsunami threat in the Indian Ocean from a future megathrust earthquake west of Sumatra. Earth Planet. Sci. Lett. 265, 61–81. doi: 10.1016/j.epsl.2007.09.034
Minoura, K., Imamura, F., Sugawara, D., Kono, Y., and Iwashita, T. (2001). The 869 Jogan tsunami deposit and recurrence interval of large-scale tsunami on the Pacific coast of northeast Japan. J. Nat. Disaster Sci. 23, 83–88.
Natawidjaja, D. H., Sieh, K., Chlieh, M., Galetzka, J., Suwargadi, B. W., Cheng, H., et al. (2006). Source parameters of the great Sumatran megathrust earthquakes of 1797 and 1833 inferred from coral microatolls. J. Geophys. Res. 111, 1–37. doi: 10.1029/2005jb004025
Nielsen, O., Roberts, S., Gray, D., McPherson, A., and Hitchman, A. (2005). “Hydrodynamic modelling of coastal inundation,” in MODSIM (Melbourne, VIC).
Norwegian Geotechnical Institute (NGI) Geoscience Australia (GA). (2015). Tsunami Methodology and Result Overview in UNISDR Global Assessment Report on Disaster Risk Reduction 2015: Background Papers for Global Risk Assessment, Geneva.
Rakowsky, N., Androsov, A., Fuchs, A., Harig, S., Immerz, A., Danilov, S., et al. (2013). Operational tsunami modelling with TsunAWI—recent developments and applications. Nat. Hazards Earth Sys. Sci. 13, 1629–1642. doi: 10.5194/nhess-13-1629-2013
Rodriguez, E., Morris, C. S., Belz, J. E., Chapin, E. C., Martin, J. M., Daffer, W., et al. (2005). An Assessment of the SRTM Topographic Products. Technical Report JPL D-31639, Jet Propulsion Laboratory.
Sanders, B. F. (2007). Evaluation of on-line DEMs for flood inundation modeling. Adv. Water Resour. 30, 1831–1843. doi: 10.1016/j.advwatres.2007.02.005
Satake, K. (1995). Linear and nonlinear computations of the 1992 Nicaragua Earthquake Tsunami. Pure Appl. Geophys. 144, 3–4. doi: 10.1007/BF00874378
Schlurmann, T., Kongko, W., Goseberg, N., Natawidjaja, D. H., and Sieh, K. (2010). “Near field tsunami hazard map Padang, West Sumatra: utilizing high resolution geospatial data and reasonable source scenarios,” in Proceedings of the ICCE No.32 (Shanghai).
Schubert, J. E., and Sanders, B. F. (2012). Building treatments for urban flood inundation models and implications for predictive skill and modeling efficiency. Adv. Water Resour. 41, 49–64. doi: 10.1016/j.advwatres.2012.02.012
Shimozono, T., Sato, S., Okayasu, A., Tajima, Y., Fritz, H. M., Liu, H., et al. (2012). Propagation and inundation characteristics of the 2011 Tohoku tsunami on the central Sanriku coast. Coast. Eng. J. 54:1250004. doi: 10.1142/S0578563412500040
Sieh, K., Natawidjaja, D. H., Meltzner, A. J., Shen, C.-C., Cheng, H., Li, K.-S., et al. (2008). Earthquake supercycles inferred from sea-level changes recorded in the corals of West Sumatra. Science 322, 1674–1678. doi: 10.1126/science.1163589
Sugawara, D., and Goto, K. (2012). Numerical modeling of the 2011 Tohoku-oki tsunami in the offshore and onshore of Sendai Plain, Japan. Sediment. Geol. 282, 110–123. doi: 10.1016/j.sedgeo.2012.08.002
Tachikawa, T., Kaku, M., Iwasaki, A., Gesch, D., Oimoen, M., Zhang, Z., et al. (2011). ASTER Global Digital Elevation Model Version 2 –Summary of Validation Results. Joint Report of NASA Land Processes Distributed Active Archive Center and the Join Japan-US ASTER Science Team.
Tang, L., Titov, V. V., and Chamberlin, C. D. (2009). Development, testing, and applications of site−specific tsunami inundation models for real−time forecasting. J. Geophys. Res. 114:C12025. doi: 10.1029/2009JC005476
Taubenböck, H., Goseberg, N., Setiadi, N., Lämmel, G., Moder, F., Oczipka, M., et al. (2009). “Last-Mile” preparation for a potential disaster—interdisciplinary approach towards tsunami early warning and an evacuation information system for the coastal city of Padang, Indonesia. Nat. Hazards Earth Sys. Sci. 9, 1509–1528. doi: 10.5194/nhess-9-1509-2009
Thio, H. K., Graves, R. W., Somerville, P. G., Sato, T., and Ishii, T. (2004). A multiple time window rupture model for the 1999 Chi-Chi earthquake from a combined inversion of teleseismic, surface wave, strong motion, and GPS data. J. Geophys. Res. 109:B08309. doi: 10.1029/2002jb002381
Titov, V. V., and Synolakis, C. E. (1998). Numerical modeling of tidal wave runup. J. Waterway Port Coast. Eng. 124, 157–171. doi: 10.1061/(asce)0733-950x(1998)124:4(157)
Tsubaki, R., and Kawahara, Y. (2013). The uncertainty of local flow parameters during inundation flow over complex topographies with elevation errors. J. Hydrol. 486, 71–87. doi: 10.1016/j.jhydrol.2013.01.042
Tsuji, Y., Matsutomi, H., Imamura, F., Takeo, M., Kawata, Y., Matsuyama, M., et al. (1995). Damage to coastal villages due to the 1992 Flores Island earthquake tsunami. Pure Appl. Geophys. 144, 481–524. doi: 10.1007/BF00874380
Keywords: digital elevation model, tsunami inundation, LiDAR, IFSAR, SRTM
Citation: Griffin J, Latief H, Kongko W, Harig S, Horspool N, Hanung R, Rojali A, Maher N, Fuchs A, Hossen J, Upi S, Edi Dewanto S, Rakowsky N and Cummins P (2015) An evaluation of onshore digital elevation models for modeling tsunami inundation zones. Front. Earth Sci. 3:32. doi: 10.3389/feart.2015.00032
Received: 30 April 2015; Accepted: 08 June 2015;
Published: 30 June 2015.
Edited by:
Guy Jean-Pierre Schumann, University of California, Los Angeles, USAReviewed by:
Matthew Lewis, Bangor University, UKDai Yamazaki, Japan Agency for Marine-Earth Science and Technology, Japan
Copyright © 2015 Griffin, Latief, Kongko, Harig, Horspool, Hanung, Rojali, Maher, Fuchs, Hossen, Upi, Edi Dewanto, Rakowsky and Cummins. This is an open-access article distributed under the terms of the Creative Commons Attribution License (CC BY). The use, distribution or reproduction in other forums is permitted, provided the original author(s) or licensor are credited and that the original publication in this journal is cited, in accordance with accepted academic practice. No use, distribution or reproduction is permitted which does not comply with these terms.
*Correspondence: Jonathan Griffin, Community Safety Group, Geoscience Australia, Cnr Jerrabomberra Avenue and Hindmarsh Drive, Symonston, ACT 2601, Australia, jonathan.griffin@ga.gov.au