Inactivation of Cone-Specific Phototransduction Genes in Rod Monochromatic Cetaceans
 Mark S. Springer1*
  Christopher A. Emerling1,2
  Noah Fugate1,3 Rachna Patel1
  James Starrett1,4
  Phillip A. Morin5,6
  Cheryl Hayashi1
  John Gatesy1
- 1Department of Biology, University of California, Riverside, Riverside, CA, USA
- 2Museum of Vertebrate Zoology, University of California, Berkeley, Berkeley, CA, USA
- 3Department of Ecology and Evolutionary Biology, University of California, Los Angeles, Los Angeles, CA, USA
- 4Department of Biology, San Diego State University, San Diego, CA, USA
- 5Southwest Fisheries Science Center, National Marine Fisheries Service, National Oceanic and Atmospheric Administration, La Jolla, CA, USA
- 6Scripps Institution of Oceanography, University of California, San Diego, La Jolla, CA, USA
Vertebrate vision is mediated by two types of photoreceptors, rod and cone cells. Rods are more sensitive than cones in dim light, but are incapable of color discrimination because they possess only one type of photosensitive opsin protein (rod opsin = RH1). By contrast, cones are more important for vision in bright light. Cones also facilitate dichromatic color vision in most mammals because there are two cone pigment genes (SWS1, LWS) that facilitate color discrimination. Cone monochromacy occurs when one of the cone opsins (usually SWS1) is inactivated and is present in assorted subterranean, nocturnal, and aquatic mammals. Rod monochromacy occurs when both cone photoreceptors are inactivated, resulting in a pure rod retina. The latter condition is extremely rare in mammals and has only been confirmed with genetic evidence in five cetacean lineages, golden moles, armadillos, and sloths. The first genetic evidence for rod monochromacy in these taxa consisted of inactivated copies of both of their cone pigment genes (SWS1, LWS). However, other components of the cone phototransduction cascade are also predicted to accumulate inactivating mutations in rod monochromats. Here, we employ genome sequences and exon capture data from four baleen whales (bowhead, two minke whales, fin whale) and five toothed whales (sperm whale, Yangtze River dolphin, beluga, killer whale, bottlenose dolphin) to test the hypothesis that rod monochromacy is associated with the inactivation of seven genes (GNAT2, GNB3, GNGT2, PDE6C, PDE6H, CNGA3, CNGB3) in the cone phototransduction cascade. Cone-monochromatic toothed whales that retain a functional copy of LWS (beluga whale, Yangtze River dolphin, killer whale, bottlenose dolphin) also retain intact copies of other cone-specific phototransduction genes, whereas rod monochromats (Antarctic minke whale, common minke whale, fin whale, bowhead whale, sperm whale) have inactivating mutations in five or more genes in the cone phototransduction cascade. The only shared inactivating mutations that were discovered occur in the three Balaenoptera species (two minke whales, fin whale), further suggesting that rod monochromacy evolved independently in two clades of baleen whales, Balaenopteroidea and Balaenidae. We estimate that rod monochromacy evolved first in Balaenopteroidea (~28.8 Ma) followed by P. macrocephalus (~19.5 Ma) and Balaenidae (~13.0 Ma).
Introduction
Vision in mammals is initiated when photoreceptors in the retina are activated by light. The two types of photoreceptor cells in the retina are rods and cones, each of which contains photosensitive visual pigments that are comprised of an opsin protein plus a chromophore. Rods are more sensitive than cones to dim light but possess only a single type of photosensitive opsin protein (rod opsin = RH1), which precludes color discrimination. By contrast, cones are more important for vision in bright light. Cones have higher spatial acuity than rods because their signals are not spatially pooled to the same extent as rods, and in most mammals allow for color discrimination because there are two cone opsin classes, each with a distinct λmax: short-wavelength sensitive opsin 1 (SWS1) and long-wavelength sensitive opsin (LWS). Exceptions to the two-cone opsin condition (dichromacy) include most anthropoids (Catarrhini, Platyrrhini) and a few lemuriform primates (Propithecus coquereli, Varecia, Eulemur flavifrons), which exhibit routine (catarrhines, Alouatta) or polymorphic (most platyrrhines, Lemuriformes) trichromacy, and various cone monochromats that are typically nocturnal or aquatic and have an inactivated copy of the gene that encodes SWS1 (Fasick et al., 1998; Peichl and Moutairou, 1998; Peichl et al., 2001; Levenson and Dizon, 2003; Newman and Robinson, 2005; Tan et al., 2005; Levenson et al., 2006; Hunt et al., 2009; Jacobs, 2009, 2013; Veilleux and Bolnick, 2009; Davies et al., 2012; Emerling et al., 2015). There are also rod monochromats that have inactivated copies of both cone opsins. Meredith et al. (2013) provided the first genetic evidence for rod monochromacy and their results suggested that this condition arose independently in five different lineages of Cetacea including Balaenidae (bowhead and right whales), Balaenopteroidea (rorquals plus gray whale), Mesoplodon bidens (Sowerby's beaked whale), Physeter macrocephalus (sperm whale), and Kogia breviceps (pygmy sperm whale).
Subsequent to Meredith et al.'s (2013) report of inactivated SWS1 and LWS in multiple cetacean lineages, Emerling and Springer (2015) documented the inactivation of additional cone-specific genes in sperm whale and common minke whale based on available genome sequences. Emerling and Springer (2014, 2015) also documented rod monochromacy in two species of Chrysochloridae (golden moles), some Xenarthra (armadillos, sloths), and possibly Heterocephalus glaber (naked mole rat). Importantly, eight of nine core proteins in the cone phototransduction cascade (two cone opsins, two of three GN proteins that comprise transducin, two phoshodiesterase subunits [PDE proteins], two cGMP gated channels [CNG proteins]) have inactivated genes in one or more rod monochromatic taxa. By contrast, all of these genes remain intact in mammalian taxa with cone trichromacy, cone dichromacy, or cone monochromacy. The only exception is the naked mole rat, which is either an SWS1-cone monochromat or a functional rod monochromat based on genomic evidence (Emerling and Springer, 2014).
Here, we utilize genome sequences and exon capture data from four baleen whales (Balaena mysticetus [bowhead whale], Balaenoptera physalus [fin whale], Balaenoptera acutorostrata [common minke whale], Balaenoptera bonaerensis [Antarctic minke whale]) and five toothed whales (Physeter macrocephalus [sperm whale], Lipotes vexillifer [Yangtze River dolphin], Delphinapterus leucas [beluga whale], Orcinus orca [killer whale], Tursiops truncatus [bottlenose dolphin]) to test the hypothesis that rod monochromacy is associated with the inactivation of seven cone-specific genes (GNAT2, GNB3, GNGT2, PDE6C, PDE6H, CNGA3, CNGB3) in the cone phototransduction cascade. In addition to cataloging inactivation mutations (frameshifts, premature stop codons, splice site mutations), we perform selection analyses to test whether these genes have evolved neutrally in rod monochromatic cetaceans. We also use estimates of selection intensity (dN/dS values) and published timetrees for Cetacea to estimate when rod monochromacy evolved in the balaenid, rorqual, and sperm whale lineages.
Materials and Methods
Ethics Statement
Samples from Choeropsis liberiensis, Delphinapterus leucas, and Balaenoptera physalus were obtained from the New York Zoological Society, which maintained a “frozen zoo” as a reservoir of wildlife samples that were made available to researchers world-wide to study the conservation, evolution, and ecology of various species. The sample for Choeropsis liberiensis is an organ tissue specimen taken from a necropsy of a captive animal from the Bronx Zoo that was collected ~20 years ago. The blood sample for Delphinapterus leucas derives from a regular health check-up that was administered to a captive animal at the New York Aquarium (previously Coney Island Aquarium) more than 15 years ago. The sample (skin) for Balaenoptera physalus is ~25 years old and derives from a stranded (deceased) animal for which New York Zoological Society staff collected samples. The Balaenoptera bonaerensis sample was obtained from skin biopsies in the Southwest Fisheries Science Center (SWFSC, specimen Z23603) Marine Mammal and Sea Turtle Research (MMASTR) Collection, which were obtained from the South Australian Museum, Adelaide, Australia (SAM M15375). Our collaborator, Annalisa Berta at San Diego State University, and her Masters student, Amanda Rychel, requested a tissue sample from SWFSC and utilized the sample to do a pilot study on mysticete (baleen) whale phylogeny in approximately 2002–2003 and subsequently published their work (Rychel et al., 2004). Shortly thereafter, Gatesy and Berta requested a transfer of baleen whale samples from SDSU to the University of California—Riverside. This request was approved by SWFSC, and the transferred sample was utilized in the hybridization capture experiments described below.
Database Mining
Gene names (OPN1LW [LWS], OPN1SW [SWS1], CNGA3, CNGB3, GNAT2, GNB3, GNGT2, PDE6C, PDE6H) were used as key words to search for mRNA sequences in GenBank. Nucleotide BLAST searches (http://blast.ncbi.nlm.nih.gov/Blast.cgi) were performed against NCBI's whole-genome shotgun contigs using megablast with coding sequences from mRNAs as query sequences. Query sequences were from the same taxon when available or from a close relative (e.g., Bos taurus [cow] for Capreolus capreolus [roe deer]). We targeted the genomes of six cetaceans with assembled genomes (Balaenoptera acutorostrata, Balaenoptera bonaerensis, Physeter macrocephalus, Lipotes vexillifer, Orcinus orca, Tursiops truncatus), and six outgroups (Camelus ferus [wild Bactrian camel], Sus scrofa [domestic pig], C. capreolus, B. taurus, Pantholops hodgsonii [Tibetan antelope], Capra hircus [goat]). Retrieved contigs or relevant portions thereof were imported into Geneious 8.1 (http://www.geneious.com, Kearse et al., 2012) and manually annotated after using MUSCLE (Edgar, 2004) to align exons from Homo sapiens reference sequences against the individual contigs. We also blasted the sequence read archive for Balaenoptera physalus (fin whale; Yim et al., 2014) with query sequences from two of its congeners, B. bonaerensis and B. acutorostrata. Blast hits were downloaded and assembled in Geneious. Finally, we imported the genome of Balaena mysticetus (bowhead whale; Keane et al., 2015) into Geneious and queried this genome with discontiguous megablast using sequences from other mysticetes. Coding sequences were manually inspected for inactivating mutations including altered start codon missense mutations, premature stop codons, frameshift mutations, stop codon mutations, and altered splice sites at intron boundaries. The latter were identified following the AG (acceptor splice site)/GT (donor splice site) rule with an allowance for GC donor splice sites (Burset et al., 2000). Accession numbers for sequences that were mined from databases are provided in Supplementary Information.
Hybridization Capture and Next Generation Sequencing
Hybridization capture and next generation sequencing were used to obtain sequences for one outgroup taxon (Choeropsis liberiensis, pygmy hippopotamus) and three cetaceans including Delphinapterus leucas (beluga) and additional individuals of two species (Balaenoptera physalus, and B. bonaerensis) whose genome sequences are available on NCBI. DNA was extracted using the DNeasy Blood and Tissue kit (Qiagen). Our protocol for library construction and targeted enrichment for paired-end sequencing is described in detail elsewhere and was performed with the SureSelectXT Target Enrichment System for Illumina Paired-End Sequencing Library kit (Agilent) (Springer et al., 2016). We targeted the coding exons of seven genes (SWS1, LWS, GNAT2, GNGT2, PDE6C, PDE6H, CNGB3) for enrichment with a custom-designed biotinylated RNA library. Probes were compiled from cetacean genome sequences (Tursiops truncatus, Orcinus orca) and included 60-bp overhangs of introns at both the 5′ and 3′ ends. The fasta file of target sequences (exon + flanking introns) was entered into the Agilent SureDesign algorithm to generate 120-base long oligomers with sufficient overlap that each nucleotide position in the compiled database was present, on average, in five different oligomers. Paired-end sequencing (2 × 100) was performed on an Illumina HiSeq 2500 platform at the UC Riverside Institute for Integrative Genome Biology Genomics Core. FastQC v.0.10.0 (http://www.bioinformatics.babraham.ac.uk/projects/fastqc/) with the no-group setting used to visualize per-base quality distributions of de-multiplexed fastq files for both read pair files. Based on these results, we trimmed the first three bases and the last base with FASTX-Toolkit v.0.0.13.2 (http://hannonlab.cshl.edu/fastx_toolkit/index.html), which resulted in 97 bp reads. We filtered out reads with all but three identical bases or a quality score below 30 at any base position with FastX-toolkit on each fastq file. PRINSEQ lite v.0.20.4 (Schmieder and Edwards, 2011) was then used to find the read pairs that passed these filtering conditions. These read pairs were then interleaved into a single file using the ShuffleFastq script in RACKJ v.0.95 (http://rackj.sourceforge.net/Scripts/index.html#ShuffleFastq). Fastq files were imported into Geneious 7.1 (http://www.geneious.com, Kearse et al., 2012). Individual reads were mapped to reference (“target”) sequences and consensus sequences were assembled with a matching threshold of 85%. Accession numbers for new sequences are KX064683-KX064690 and KX118304-KX118323.
Phylogeny Reconstruction
Individual gene trees and the concatenation tree based on nine genes were estimated with RAxML 8.2.4 (Stamatakis, 2006, 2014) on CIPRES (Miller et al., 2010). Analyses were performed with a GTR + Γ model of sequence evolution (i.e., GTRGAMMA option in RAxML), and the analysis with the concatenated data set allowed each gene to have its own parameters for the GTR + Γ model (RAxML does not allow for simpler models of sequence evolution). Rapid bootstrap analyses (Stamatakis et al., 2008) were performed with 500 pseudoreplicates. Bootstrap analyses and a search for the best ML tree were performed in a single run. In addition to maximum likelihood analyses, we also performed maximum parsimony analyses with the concatenated data set to determine if the results of different phylogenetic methods are in agreement with each other. A maximum parsimony search was implemented with PAUP 4.0a147 (Swofford, 2002) using the branch-and-bound search algorithm. A maximum parsimony bootstrap analysis was also performed with PAUP and employed 500 bootstrap pseudoreplicates with a branch-and-bound search for each pseudoreplicate.
Selection Analyses
Selection analyses were performed with codeml in PAML (Yang, 2007) for seven cone-specific phototransduction genes (LWS, GNAT2, GNGT2, PDE6C, PDE6H, CNGA3, CNGB3) for which inactivation is associated with rod monochromacy in various cetacean lineages (Meredith et al., 2013) as well as other rod monochromatic mammals (Emerling and Springer, 2014, 2015). SWS1 is also cone-specific, but the inactivation of this gene occurred on deeper branches in Cetacea (i.e., stem odontocete and stem mysticete branches) and is associated with cone monochromacy rather than rod monochromacy (Meredith et al., 2013). GNB3, another phototransduction gene, is never inactivated in rod monochromats. Frameshift insertions were deleted and premature stop codons were recoded as missing data prior to running codeml analyses. Analyses were performed with Model 1 (one dN/dS ratio for all branches) and two additional models (Model 2, Model 3) that allowed five separate categories for branch dN/dS values including a category for functional branches leading to taxa with cone dichromacy or monochromacy, three categories for transitional branches where there is evidence that rod monochromacy evolved (Physeter branch, Balaena branch, stem balaenopteroid branch), and one category for fully pseudogenic branches in crown balaenopteroid branches. Branches in the latter category post-date the transition from cone monochromacy to rod monochromacy. The dN/dS ratio for the crown balaenopteroid branches was estimated in Model 2 and fixed at 1.0 in Model 3 given that this is the expected value for neutrally evolving pseudogenes. Analyses were performed with the RAxML species tree (see above) that is consistent with previously published phylogenetic work (McGowen et al., 2009; Meredith et al., 2011) and two different codon frequency models in codeml, codon frequency model 1 (CF1) and codon frequency model 2 (CF2).
Estimation of Inactivation Times
To estimate when rod monochromacy evolved in different lineages of Cetacea (i.e., Balaenidae, Physeter, Balaenopteridae), we used divergence times from McGowen et al. (2009) and equations from Meredith et al. (2009) that employ dN/dS ratios for functional (ωf), pseudogenic (ωp), and transitional (= mixed) branches (ωm) where transitions from cone monochromacy to rod monochromacy have been inferred (Meredith et al., 2013). We combined sequences for seven cone-specific, phototransduction genes that are inactivated in one or more rod monochromatic cetaceans, as well as in other mammalian rod monochromats (Emerling and Springer, 2014, 2015), to achieve more statistical power than is possible with individual genes. An underlying assumption of this approach is that all seven cone-specific genes have evolved under neutral selection coincident with the evolution of rod monochromacy in each of these lineages, even in cases where the accumulation of frameshift mutations, premature stop codons, or other inactivating mutations has lagged behind the presumably “jobless” role of these cone-specific genes following inactivation of both SWS1 and LWS. For confidence intervals on these inactivation dates, we used prop.test in the stats package of R to determine 95% confidence intervals on the proportion of nonsynonymous and synonymous substitutions and the dN/dS ratio. For example, PAML returned N*dN = 125.3 and S*dS = 71.3 for the Physeter branch with CF1. Based on these values, and their sum of 196.6, prop.test (125.3, 196.6) gives 95% confidence intervals of 0.566 and 0.704 for the proportion of nonsynonymous substitutions and 0.296 and 0.434 for the proportion of synonymous substitutions. These proportions were then used to estimate the number of nonsynonymous and synonymous substitutions and the dN/dS values associated with the 95% confidence intervals. For the above example, 0.566 × 196.6 = 111.28 nonsynonymous substitutions, 0.434 × 196.6 = 85.32 synonymous substitutions, so that dN = 111.28/6824.3 = 0.0163 nonsynonymous substitutions per nonsynonymous site, dS = 85.32/2853.7 = 0.0299 synonymous substitutions per synonymous site, and dN/dS = 0.0163/0.0299 = 0.545 at the lower confidence interval (values for the number of non-synonymous sites [6824.3] and synonymous sites [2853.7] were taken directly from PAML output). We then used these lower and upper confidence intervals on dN/dS ratios and equations from Meredith et al. (2009) to calculate 95% confidence intervals on inactivation dates. Fossil occurrence data for Cetacea were downloaded from the Paleobiology Database (26 January 2016) using the taxon names Physeteroidea, Balaenidae, and Balaenopteroidea.
Results
Alignments and Phylogeny
Alignments for nine phototransduction genes (SWS1, LWS, GNAT2, GNB3, GNGT2, PDE6C, PDE6H, CNGA3, CNGB3) are provided in Supplementary Information. RAxML gene trees for each of the nine genes are shown in Figure 1. The concatenated alignment is 11828 bp and the partitioned RAxML tree (–lnL = −37085.256) with bootstrap support percentages is shown in Figure 2. All clades received 100% bootstrap support excepting Cetruminantia (97%) and Balaenoptera bonaerensis (99%). Maximum parsimony analyses recovered an identical tree (3694 steps) with 100% bootstrap support for all clades excepting Cetruminantia (99%) and Balaenoptera bonaerensis (97%).
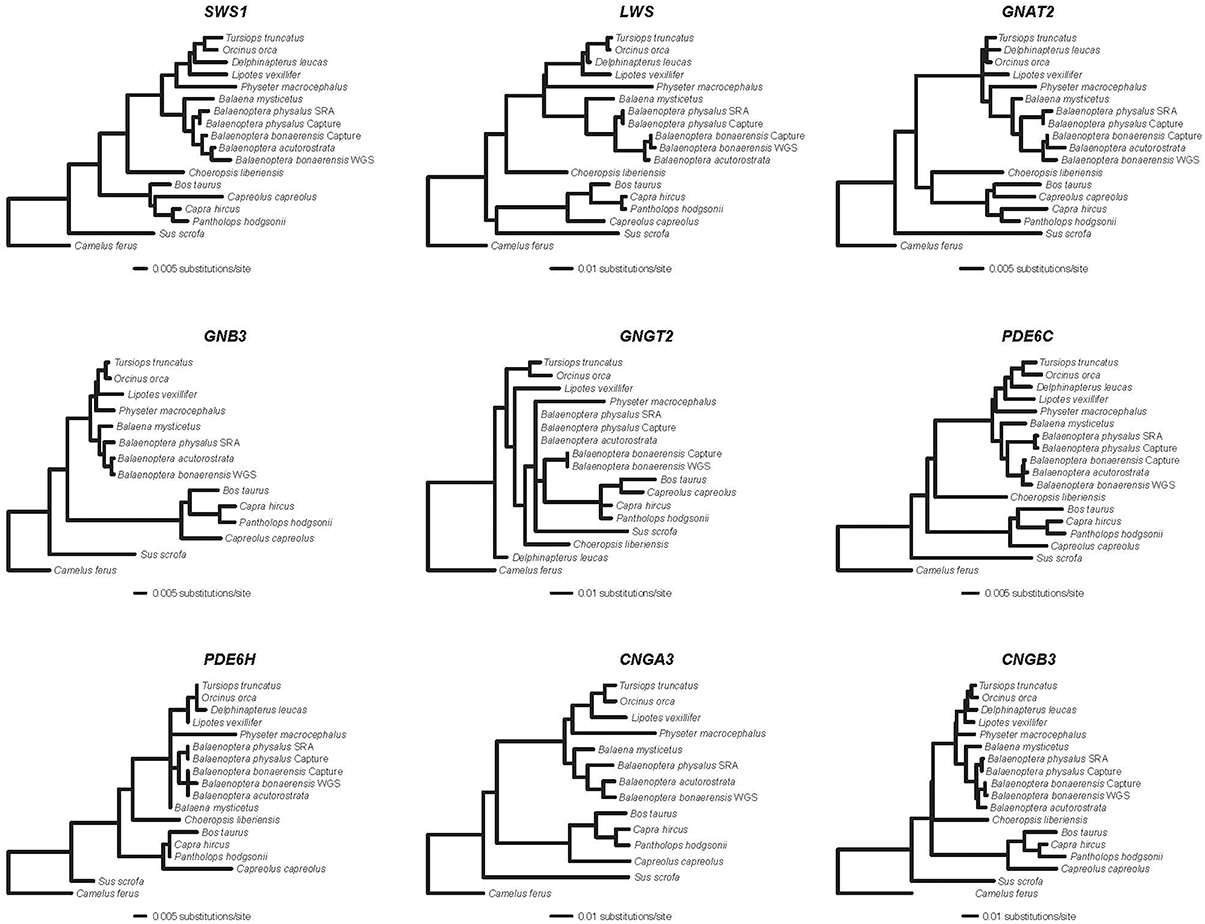
Figure 1. RAxML phylograms (GTR + Γ) for nine genes that encode proteins in the cone phototransduction cascade. SWS1 and LWS are opsins; GNAT2, GNB3, and GNGT2 encode subunits of transducin; PDE6C and PDE6H encode subunits of phosphodiesterase; and CNGA3 and CNGB3 encode cGMP gated-channel proteins.
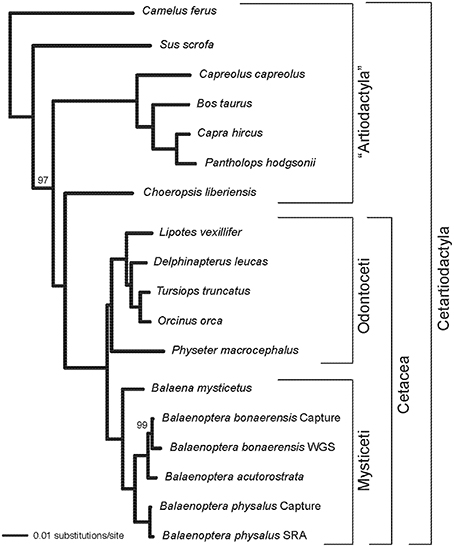
Figure 2. RAxML phylogram based on a partitioned analysis of the concatenated alignment for nine phototransduction genes. Each gene was allowed to have its own GTR + Γ model of sequence evolution. Bootstrap percentages are shown for clades with support scores < 100%.
Inactivating Mutations
Inactivating mutations in SWS1 are present in all cetaceans including mutations that are shared by all odontocetes and mysticetes, respectively (Table 1). LWS, in turn, is inactivated in Physeter macrocephalus, Balaena mysticetus, and all three species of Balaenoptera (B. acutorostrata, B. bonaerensis, B. physalus) that were investigated (Table 1) including two inactivating mutations that are shared by all three species of Balaenoptera (Table 1). The inactivation of SWS1 and LWS in Physeter, Balaena, and Balaenoptera spp. confirms the presence of rod monochromacy in these clades (Meredith et al., 2013). In addition, inactivating mutations are present in one or more of these rod monochromats for all of the remaining phototransduction genes except GNB3 (Table 1, Figures 3, 4). Overall, P. macrocephalus has inactivating mutations in six of nine phototransduction genes, B. mysticetus has inactivating mutations in five of eight phototransduction genes (GNGT2 is coded as Ns for this gene), and Balaenoptera spp. have inactivating mutations in six (B. acutorostrata) or seven (B. physalus, B. bonaerensis) phototransduction genes (Table 1). Among the GN protein genes (GNAT2, GNB3, GNGT2) that comprise transducin, there is an acceptor splice site mutation (“AG” to “AC”) in intron 6 of GNAT2 that is shared by the two minke whales (B. acutorostrata, B. bonaerensis). Shared inactivating mutations in the phosphodiesterase subunits include a premature stop codon in PDE6H that is present in all three species of Balaenoptera and a 4-bp frameshift deletion in exon 20 of PDE6C that is present in both individuals of Balaenoptera physalus and polymorphic in B. bonaerensis (present in exon capture individual, absent in NCBI WGS individual). Finally, both of the cGMP gated-channel genes (CNGA3, CNGB3) have acceptor splice site mutations that are shared by the two minke whale species. Additional inactivating mutations in the phototransduction genes of rod monochromats are unique to single species including 13 mutations in Physeter macrocephalus, seven mutations in Balaena mysticetus, ten mutations in Balaenoptera physalus, one mutation in Balaenoptera acutorostrata, and two mutations in Balaenoptera bonaerensis.
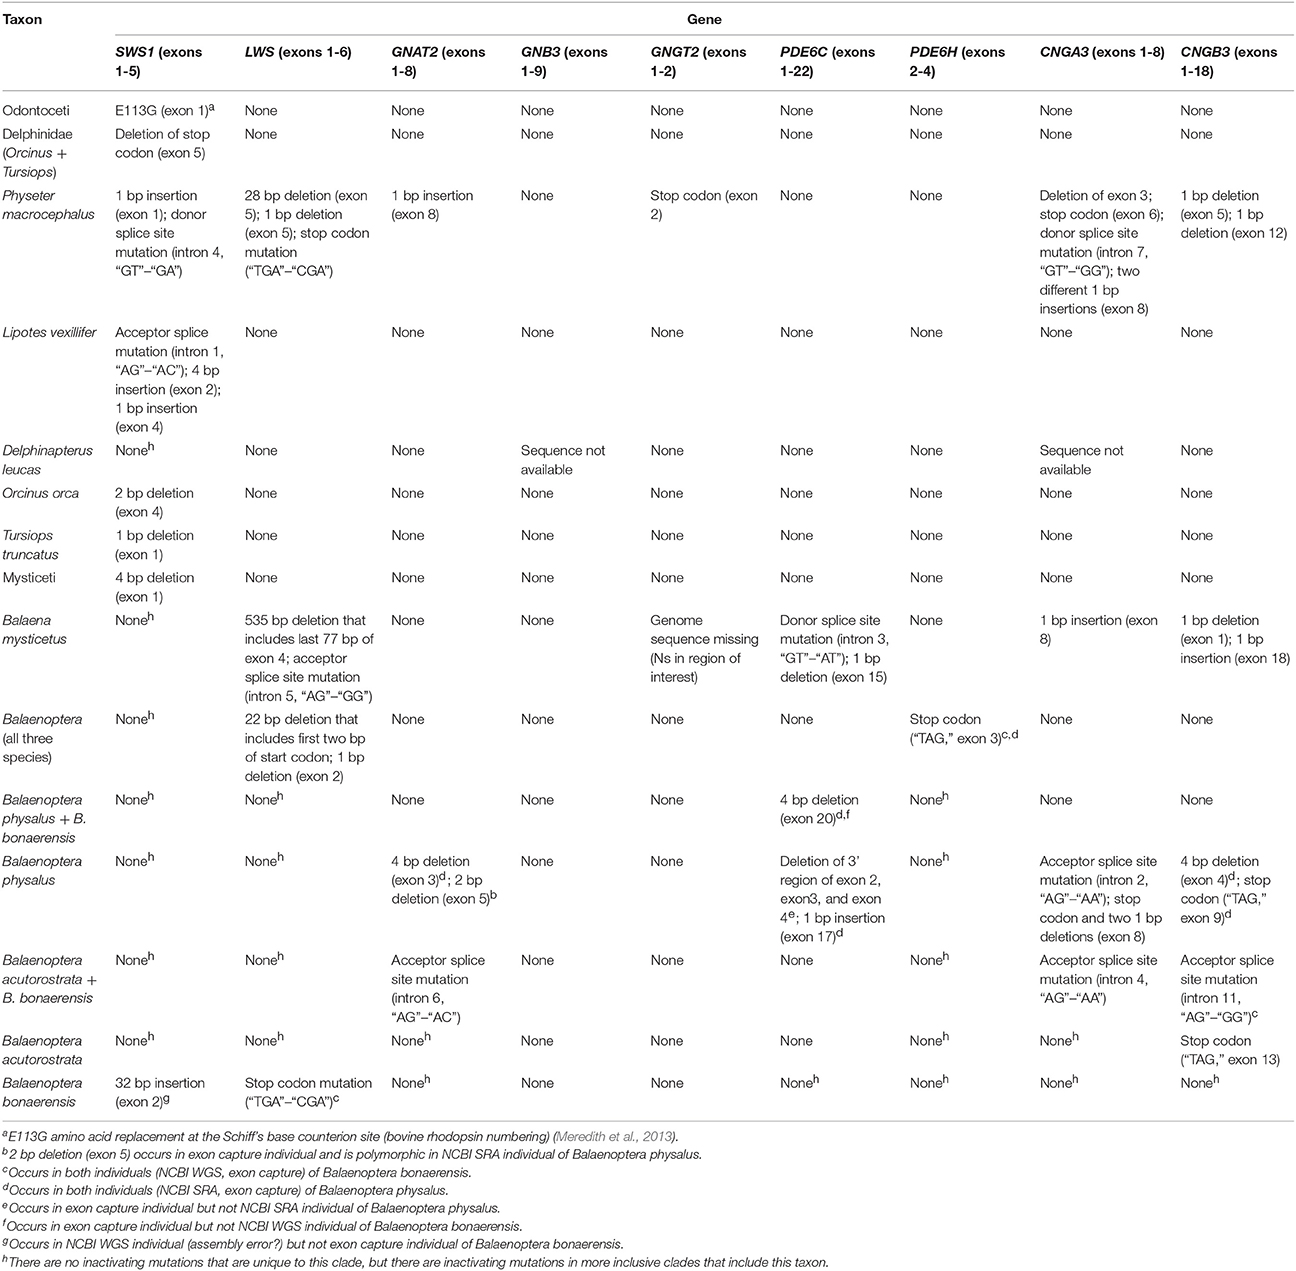
Table 1. Inactivating mutations in cetacean cone-specific pathway phototransduction genes.
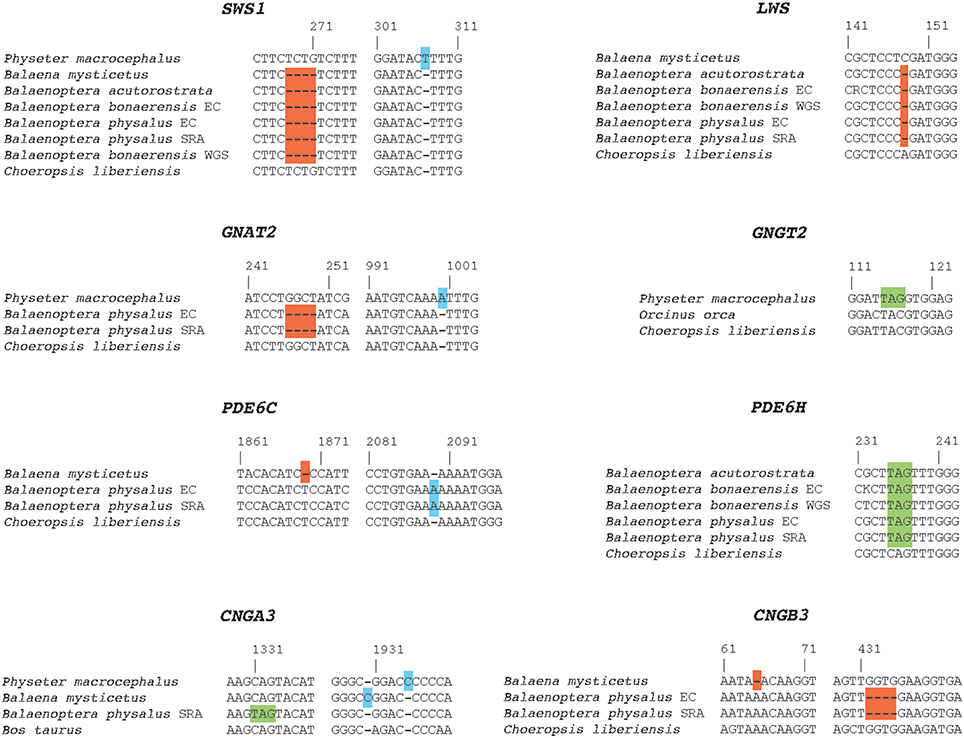
Figure 3. Examples of inactivating mutations in eight different cone-specific phototransduction genes of rod monochromatic cetaceans. Frameshift deletions are highlighted in red boxes; frameshift insertions are highlighted in blue boxes; and premature stop codons are highlighted in green boxes. EC, exon capture; SRA, sequence read archive; WGS, NCBI whole genome sequence.
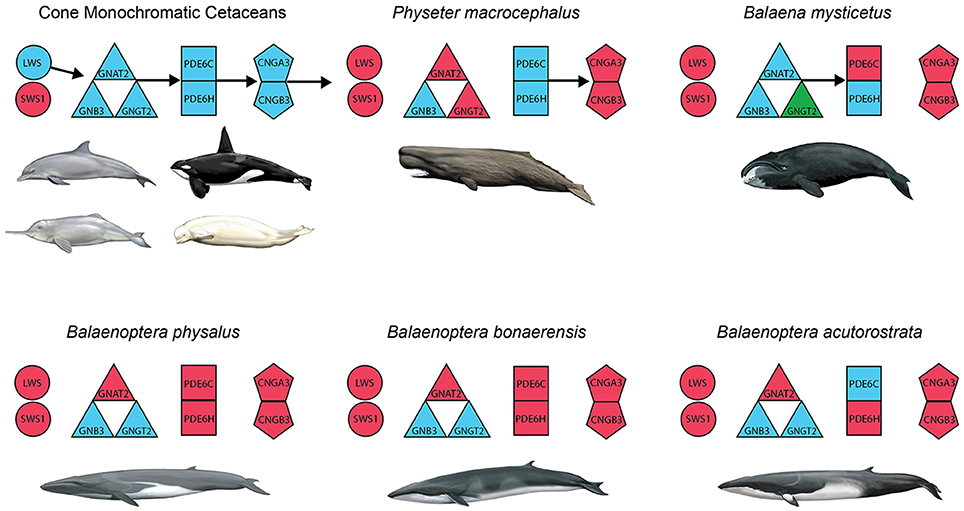
Figure 4. Summary of inactivated genes in the cone phototransduction pathway of cone monochromatic and rod monochromatic cetaceans. Opsins (SWS1, LWS) are depicted with circles; transducin subunits (GNAT2, GNB3, GNGT2) are depicted with triangles; phosphodiesterase subunits (PDE6C, PDE6H) are depicted with squares; and cGMP gated-channel protein genes (CNGA3, CNGB3) are depicted with pentagons. Blue and red correspond to intact and inactivated genes, respectively, and green indicates a gene that is represented by a string of Ns in the genome of Balaena mysticetus (bowhead). Arrows indicate the directionality of the phototransduction cascade, and the absence of arrows indicates the predicted disruption of that portion of the cascade.
Selection Analyses
Table 2 summarizes the results of selection (dN/dS) analyses. Model 1 (one dN/dS category for the entire tree) was rejected (p < 1.0 × 10⁻⁹) in favor of Model 2, which allows for five different dN/dS categories (one category for functional branches, three categories for transitional branches where rod monochromacy evolved, one category for fully pseudogenic branches). The dN/dS value for functional branches (i.e., ωf) in Model 2 is 0.171 and 0.161 with CF1 and CF2, respectively. The dN/dS value for fully pseudogenic branches (i.e., ωp) in crown Balaenoptera, in turn, is slightly elevated above 1 (1.198 with CF1, 1.134 with CF2), although ωp is not significantly different than 1.0 when Model 2 (ωp = free parameter) is compared to Model 3 (ωp = 1.0) (Table 2). This comparison (Model 2 vs. 3) suggests that elevation of the dN/dS value above 1 in crown Balaenoptera may be the result of random sampling error. For Models 2 and 3, two of the three transitional branches (Balaena, Physeter) have dN/dS values between ωf and ωp as is expected for branches with mixed histories that are part functional and part pseudogenic. The dN/dS value for stem Balaenoptera is slightly higher than for crown Balaenoptera, but the stem and crown Balaenoptera values are not significantly different from each other based on dN/dS analyses that enforced the same value for these branches (Table 2).
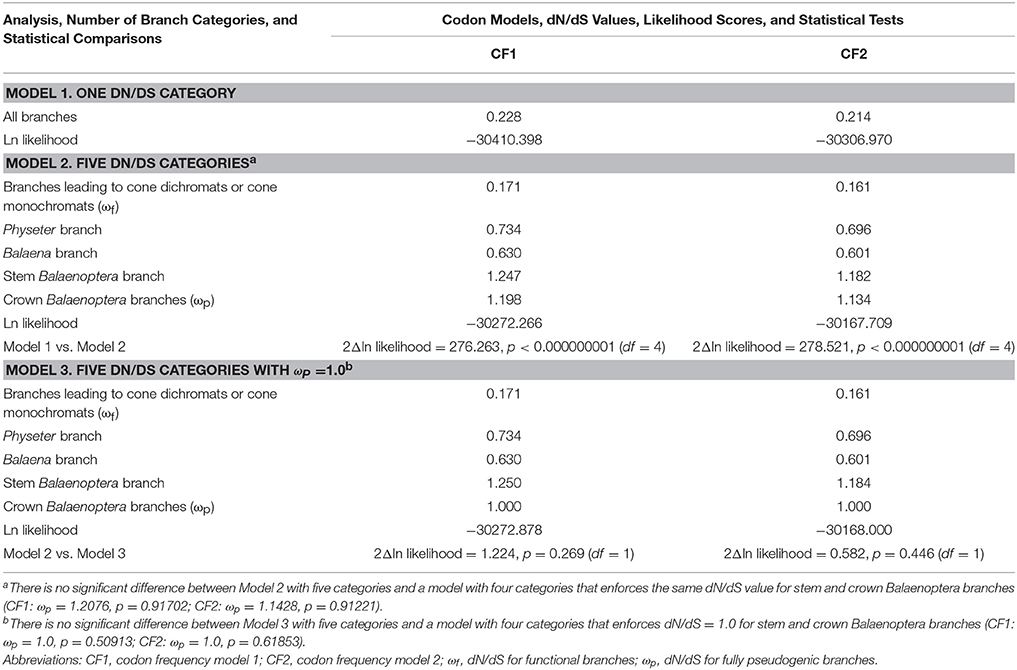
Table 2. Results of dN/dS analyses with different branch categories and two different codon frequency models (CF1, CF2).
Inactivation Dates
Point estimates and 95% confidence intervals for the timing of the evolution of rod monochromacy in three different cetacean lineages (Physeter, Balaena, stem Balaenoptera) are shown in Figure 5 and summarized in Table 3. These estimates are based on dN/dS ratios for the concatenation of seven cone-specific genes (LWS, GNAT2, GNGT2, PDE6C, PDE6H, CNGA3, CNGB3) that are known to become inactivated in association with rod monochromacy. Estimates are based on two different codon frequency models (CF1, CF2), estimated vs. fixed (1.0) values for the dN/dS ratio on branches that post-date the evolution of rod monochromacy, and equations that allow for one synonymous rate or two separate synonymous rates for functional and pseudogenic branches, respectively (Meredith et al., 2009). Eight point estimates for the timing of rod monochromacy in Physeter range from 23.58 to 15.94 million years ago (mean = 19.46 MYA). Point estimates for the onset of rod monochromacy in Balaena range from 15.94 to 10.40 MYA (mean = 12.97 MYA). Finally, all of the point estimates for the evolution of rod monochromacy on the stem Balaenoptera branch are coincident with the age of crown Mysticeti (28.79 MYA) on the timetree given that the dN/dS value on the stem Balaenoptera branch, which extends from crown Mysticeti (28.79 MYA) to crown Balaenoptera (13.80 MYA), is slightly higher than the estimated or fixed dN/dS value for fully pseudogenic branches (Table 2). Similarly, the upper 95% confidence interval for the evolution of rod monochromacy on the stem Balaenoptera branch is constrained by the age of crown Mysticeti, i.e., the age of rod monochromacy cannot be older than the age of crown Mysticeti because there are no inactivating mutations in cone-specific genes that are shared by all mysticetes. However, the lower bound of the 95% confidence interval suggests that rod monochromacy may have evolved as late as 19.30 MYA in this lineage.
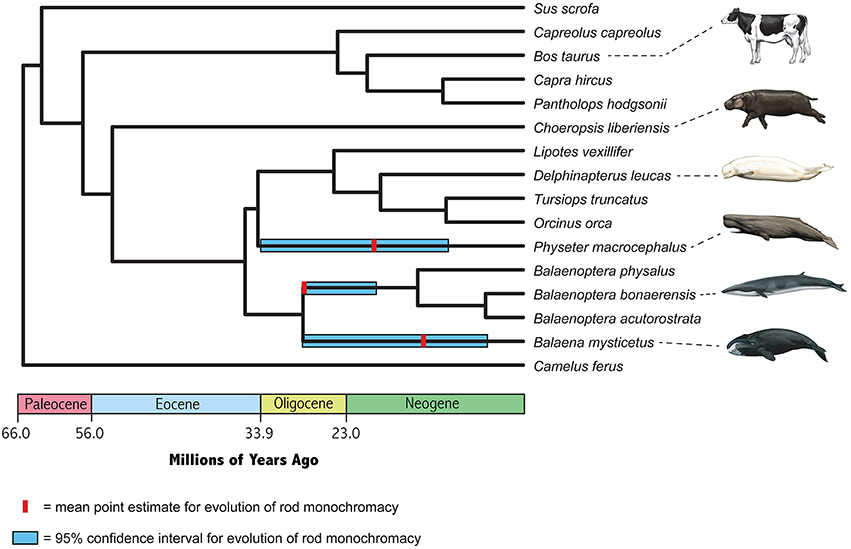
Figure 5. Timetree for nine cetaceans and seven cetartiodactyl outgroups based on divergence dates from McGowen et al. (2009) for Cetacea, Hassanin et al. (2012) for Ruminantia, and Meredith et al. (2011) for deeper divergences. Mean estimates for the onset of rod monochromacy in Physeter, Balaena, and Balaenoptera are averages of eight different values, and 95% confidence intervals on these estimates encompass the entire range of eight different analyses (Table 3).
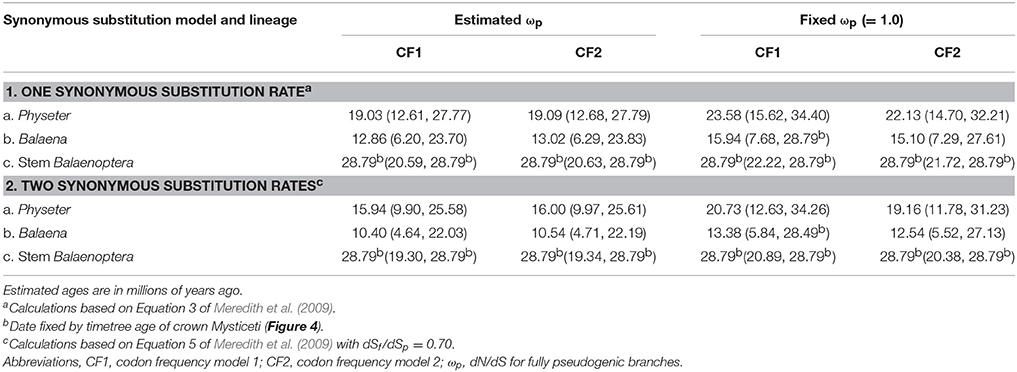
Table 3. Estimates for the timing of rod monochromacy in Physeter, Balaena, and stem Balaenoptera based on dN/dS (= ω) values.
Discussion
Inactivating Mutations in the Cetacean Cone Phototransduction Cascade
All living cetaceans are either cone monochromats or rod monochromats (Meredith et al., 2013). Cone monochromacy is inferred to have evolved independently on the stem odontocete and on the stem mysticete branches based on inactivating mutations in SWS1. These inactivating mutations occurred after a blueshift in RH1 on the stem cetacean branch, perhaps because the benefit of possessing SWS1 cones, with less efficient photon capture than rods, became increasingly small after the rods were blue-shifted. Rod monochromacy, in turn, evolved on at least five occasions in Cetacea based on the phylogenetic distribution of inactivating mutations in LWS (Meredith et al., 2013). Three instances of rod monochromacy are found in odontocetes (Physeter macrocephalus, Kogia breviceps, Mesoplodon bidens) and two occur in mysticetes (Balaenidae, Balaenopteroidea). In all cases, rod monochromatic cetaceans are known to dive to depths of at least 100 m with physeteroids (P. macrocephalus, K. breviceps) and ziphiids (M. bidens) among the deepest diving mammals. The “pure rod” retina in rod monochromatic odontocetes may be viewed as an extreme adaptation to dim-light conditions in the mesopelagic (150–1000 m) and bathypelagic (>1000 m) zones where there is little (mesopelagic) or no (bathypelagic) down-welling light. In these instances, the pure rod retina may be useful for detecting bioluminescent prey, which in the extreme case of the bathypelagic zone are the only source of light. Odontocetes are capable of echolocation, and the combination of rod monochromacy plus echolocation may be more effective in locating prey than echolocation alone. Deep-diving mysticetes, in turn, are known to batch filter aggregations of tiny, bioluminescent prey at night and may also benefit from a pure rod retina with its higher density of rods that are more effective than cones at contrast detection (Meredith et al., 2013).
Among the rod monochromatic lineages, P. macrocephalus, Balaenidae, and Balaenopteroidea are represented by taxa with genome sequences or exon-capture data for cone phototransduction genes. Beyond inactivating mutations in SWS1 and LWS, all three rod monochromatic cetacean lineages included in our study have inactivating mutations in additional genes in the phototransduction cascade: GNAT2, GNGT2, CNGA3, and CNGB3 in Physeter; PDE6C, CNGA3, and CNGB3 in Balaena; and GNAT2, PDE6C, PDE6H, CNGA3, and CNGB3 in two or all three species of Balaenoptera. The occurrence of inactivating mutations in both cone opsins (SWS1, LWS), as well as in other genes that are crucial for the phototransduction cascade, provides compelling evidence that these taxa are rod monochromats as originally suggested by Meredith et al. (2013) based on inactivating mutations in SWS1 and LWS. With the exception of CNGA3, all of the phototransduction genes with inactivating mutations in one or more cetacean rod monochromats also have inactivating mutations among non-cetacean rod monochromats including golden moles, sloths, and armadillos (Emerling and Springer, 2014, 2015). Among the phototransduction genes that we investigated, only GNB3 is intact in rod-monochromatic cetaceans, presumably because this gene is pleiotropic (Keers et al., 2011; Kumar et al., 2013). Similarly, this gene remains functional in golden moles and xenarthrans (Emerling and Springer, 2014, 2015). By contrast, all LWS-cone monochromats that have been investigated, including odontocetes in the present study (Tursiops, Lipotes, Orcinus, Delphinapterus) and non-cetacean taxa such as the Chinese pangolin (Manis pentadactyla; Emerling and Springer, 2015), have intact copies of the abovementioned phototransduction genes except for SWS1.
The Timing of Rod Monochromacy in Cetacean Clades
The oldest member of Physeteroidea (sperm whales) is Ferecetotherium kelloggi from the late Oligocene (28.1–23.03 Ma) of Azerbaijan (Lambert et al., 2008; Gol'din and Marareskul, 2013). The physeteroids Diaphorocetus poucheti, Idiorophus bolzanensis, and Scaldicetus bellunensis are known from the early Miocene (Aquatanian, 23.03–20.44 Ma) (Paleobiology Database). McGowen et al.'s (2009) timetree for Cetacea suggests that crown physeteroids last shared a common ancestor 24.21 Ma. Our point estimates for the evolution of rod monochromacy in Physeter macrocephalus are in the range of 23.58–15.94 Ma (mean = 19.46 Ma) and were calculated with McGowen et al.'s (2009) timetree date of 34.69 Ma for crown Odontoceti. These estimates are consistent with independent inactivations of LWS in P. macrocephalus and Kogia breviceps (pygmy sperm whale) after these taxa diverged from a common ancestor (Meredith et al., 2013). However, it will be important to examine other cone-specific genes in Kogia to determine if Kogia and Physeter share inactivating mutations in other cone phototransduction genes that are inactivated in Physeter (Figure 4; GNAT2, GNGT2, CNGA3, CNGB3).
All of our point estimates for the evolution of rod monochromacy in Balaenoptera are coincident with McGowen et al.'s (2009) timetree estimate of 28.79 Ma for the most recent common ancestor of crown Mysticeti because the dN/dS value for the stem Balaenoptera branch, which extends from crown Mysticeti to the most recent common ancestor of B. physalus, B. bonaerensis, and B. acutorostrata, is slightly above one. However, 95% confidence intervals on these estimates suggest that rod monochromacy may have evolved as late as ~22–19 Ma in the lineage leading to Balaenoptera. Meredith et al. (2013) reported an intact copy of LWS in the neobalaenid Caperea marginata (pygmy right whale), which is the extant sister taxon to Balaenopteroidea (McGowen et al., 2009; Meredith et al., 2011; Gatesy et al., 2013). The putatively functional copy of LWS in C. marginata suggests that rod monochromacy evolved in the lineage leading to Balaenoptera (and other balaenopteroids) after Neobalaenidae diverged from Balaenopteroidea. McGowen et al.'s (2009) timetree date for this split is 22.59 Ma, although the putative stem balaenopteroid Mauicetus parki is slightly older (>23.03 Ma) and suggests an earlier split for Neobalaenidae and Balaenopteroidea (Boessenecker and Fordyce, 2015). If Caperea retains functional LWS-cones, as suggested by an intact copy of LWS in this taxon, then rod monochromacy in Balaenopteroidea probably evolved soon after the Neobalaenidae-Balaenoptera split. However, it will be important to determine if the shared stop codon in exon 3 of PDE6H, which occurs in all three species of Balaenoptera that were investigated, is also shared by other balaenopteroids and possibly Caperea.
The second mysticete lineage with rod monochromacy is Balaenidae and is represented in our study by Balaena mysticetus. Meredith et al. (2013) reported an inactivating splice site mutation in LWS that is shared by both extant balaenid genera, Balaena and Eubalaena. Our estimates for the evolution of rod monochromacy in Balaena suggest that this condition originated 15.94–10.4 Ma, which pre-dates McGowen et al.'s (2009) estimate for the last common ancestor of Balaenidae at 5.38 Ma and is consistent with Meredith et al.'s (2013) evidence for the evolution of rod monochromacy in the common ancestor of extant balaenids. The oldest stem balaenid fossil is Morenocetus from the early Miocene (~22–20 Ma) (McGowen et al., 2009). Our point estimates for the evolution of rod monochromacy in Balaena are all younger than 20 Ma and suggest that Morenocetus retained LWS-cones, although 95% confidence intervals on these estimates allow for the possibility that rod monochromacy in balaenids is as old as Morenocetus.
The Fate of Cone Cells in Rod Monochromatic Cetaceans
Schweikert et al. (2016) confirmed the total loss of cone-based photoreception in the retina of Balaena mysticetus based on immunofluorescence, histology, and ultrastructural analyses. Despite the loss of the outer segments of cone cells, where opsins reside, the retina of B. mysticetus retains putative cone pedicles and somata in addition to cone bipolar cells, which may be retained for rod-based signaling in mammals (Schweikert et al., 2016). Cone bipolar cells are required for the transmission of rod-based signals to the brain (though see below), so the retention of cone bipolar cells is perhaps not surprising. Schweikert et al. (2016) suggest that conservation of cone signaling structures (i.e., cone synapses and cone bipolar cells) may facilitate multi-channel, rod-based signaling that is more sensitive to a broad range of light intensities than would be possible with rod-to-rod bipolar cell signaling alone.
A different arrangement occurs in Heterocephalus glaber (naked mole rat), where unusual retinal wiring may be consistent with functional rod monochromacy (Mills and Catania, 2004). Typical retinal wiring includes synapses between rods and rod bipolar cells, with the latter then synapsing to cone bipolar cells via AII amacrine cells before ultimately connecting to retinal ganglion cells. However, the rod bipolar cells of H. glaber depart from this canonical rule (in mammals) of making exclusive contact with AII amacrine cells. Instead, connections with AII amacrine cells are diminished and some rod bipolar cells make direct contact with retinal ganglion cells (Mills and Catania, 2004). These findings suggest that the need for cone bipolar cells in H. glaber has been effectively reduced, and is consistent with the inactivation of several cone phototransduction genes (LWS, GNAT2, PDE6C, PDE6H) in this species that hint at functional rod monochromacy even though SWS1-cones are present (Emerling and Springer, 2014). An alternative hypothesis is that SWS1-cones in H. glaber have co-opted rod-specific paralogs of inactivated cone-specific genes (GNAT2, PDE6C, PDE6H; Emerling and Springer, 2014).
The phylogenetic mapping of inactivating mutations suggests that placental mammal diversity includes at least seven other lineages where rod monochromacy evolved independently (Balaenopteroidea, Physeter macrocephalus, Kogia breviceps, Mesoplodon bidens, Chrysochloridae [golden moles], Cingulata [armadillos], Folivora [sloths]). Placentalia therefore provides a natural laboratory for inquiring whether or not cone somata and pedicles are always retained in rod monochromats or if there are multiple solutions to retinal rewiring in the absence of photosensitive cone cells. Importantly, investigations into the loss of cone input to the cone bipolar cells in these divergent lineages may shed light on fundamental questions regarding the evolutionary plasticity of neural (brain) circuitry. In the case of Cetacea, our point estimates for the origins of rod monochromacy in different lineages suggest that this condition evolved earlier in both P. macrocephalus (~23.6–15.9 Ma) and Balanopteroidea (~28.8) than in Balaenidae (~15.9–10.4 Ma), so there has been more time for fine tuning of rod-based signaling to the brain in the absence of light-sensitive cones. The onset of rod monochromacy in two xenarthran lineages, Cingulata and Folivora, is estimated to have occurred even earlier near the KPg boundary (~66 Ma) based on dN/dS ratios (Emerling and Springer, 2015). Emerling and Springer's (2015) point estimate of ~66 Ma for the onset of rod monochromacy in Folivora implies that rod monochromacy evolved in the common ancestor of Folivora (sloths) and Vermilingua (anteaters), which last shared a common ancestor ~56 Ma. However, the hypothesis that anteaters are also rod monochromats remains to be tested with genomic data (Emerling and Springer, 2015). Detailed investigations of retinal morphology in all of these lineages with immunofluorescence and histological/ultrastructural techniques, as in Schweikert et al. (2016), should provide insights into both developmental and functional constraints associated with rod monochromacy in diverse placental mammals.
Author Contributions
MS, CE, JG, and PM conceived the study. JS, CH performed exon capture experiments. MS, NF, RP, and CE collected data from genomic databases. MS performed phylogenetic and statistical analyses. MS, CE wrote the manuscript. MS, JG constructed figures. NF, RP, JS, PM, CH, and JG provided comments on the draft manuscript. All authors read and approved the final draft for submission.
Funding
This work was supported by NSF grant DEB-1457735 to JG, MS, and PM.
Conflict of Interest Statement
The authors declare that the research was conducted in the absence of any commercial or financial relationships that could be construed as a potential conflict of interest.
Acknowledgments
We thank Brittany Hancock-Hanser for helpful comments. For providing DNA samples, we thank Southwest Fisheries Science Center–Genetics Archive (LaJolla, CA), the New York Zoological Society (Bronx, NY), South Australian Museum (Adelaide, Australia), G. Amato, and H. Rosenbaum. We thank C. Buell for artwork.
Supplementary material
The Supplementary Material for this article can be found online at: https://www.frontiersin.org/article/10.3389/fevo.2016.00061
References
Boessenecker, R. W., and Fordyce, R. E. (2015). A new genus and species of eomysticetid (Cetacea: Mysticeti) and a reinterpretation of “Mauicetus” lophocephalus Marples, 1956: transitional baleen whales from the upper Oligocene of New Zealand. Zool. J. Linn. Soc. 175, 607–660. doi: 10.1111/zoj.12297
Burset, M., Seledtsov, I. A., and Solovyev, V. V. (2000). Analysis of canonical and non-canonical splice sites in mammalian genomes. Nucleic Acids Res. 28, 4364–4375. doi: 10.1093/nar/28.21.4364
Davies, W. I. L., Collin, S. P., and Hunt, D. M. (2012). Molecular ecology and adaptation of visual photopigments in craniates. Mol. Ecol. 21, 3121–3158. doi: 10.1111/j.1365-294X.2012.05617.x
Edgar, R. C. (2004). MUSCLE: multiple sequence alignment with high accuracy and high throughput. Nucleic Acids Res. 32, 1792–1797. doi: 10.1093/nar/gkh340
Emerling, C. A., Huynh, H. T., Nguyen, M. A., Meredith, R. W., and Springer, M. S. (2015). Spectral shifts of mammalian ultraviolet-sensitive pigments (short wavelength sensitive opsin 1) are associated with eye length and photic niche evolution. Proc. R. Soc. B Biol. Sci. 282:20151817. doi: 10.1098/rspb.2015.1817
Emerling, C. A., and Springer, M. S. (2014). Eyes underground: regression of visual protein networks in subterranean mammals. Mol. Phylogenet. Evol. 78, 260–270. doi: 10.1016/j.ympev.2014.05.016
Emerling, C. A., and Springer, M. S. (2015). Genomic evidence for rod monochromacy in sloths and armadillos suggests early subterranean history for Xenarthra. Proc. R. Soc. B Biol. Sci. 282:20142192. doi: 10.1098/rspb.2014.2192
Fasick, J. I., Cronin, T., Hunt, D., and Robinson, P. (1998). The visual pigments of the bottlenose dolphin (Tursiops truncatus). Vis. Neurosci. 15, 643–651. doi: 10.1017/S0952523898154056
Gatesy, J., Geisler, J. H., Chang, J., Buell, C., Berta, A., Meredith, R. W., et al. (2013). A phylogenetic blueprint for a modern whale. Mol. Phylogenet. Evol. 66, 479–506. doi: 10.1016/j.ympev.2012.10.012
Gol'din, P. E., and Marareskul, V. A. (2013). Miocene toothed whales (Cetacea, Odontoceti) from the Dniester Valley: the first record of sperm whales (Physeteroidea) from the Eastern Europe. Vestn. Zool. 47, 21–26. doi: 10.2478/vzoo-2013-0043
Hassanin, A., Delsuc, F., Ropiquet, A., Hammer, C., van Vuuren, B. J., Matthee, C., et al. (2012). Pattern and timing of diversification of Cetartiodactyla (Mammalia, Laurasiatheria), as revealed by a comprehensive analysis of mitochondrial genomes. C. R. Biol. 335, 32–50. doi: 10.1016/j.crvi.2011.11.002
Hunt, D. M., Carvalho, L. S., Cowing, J. A., and Davies, W. L. (2009). Evolution and spectral tuning of visual pigments in birds and mammals. Philos. Trans. R. Soc.Lond. B Biol. Sci. 364, 2941–2955. doi: 10.1098/rstb.2009.0044
Jacobs, G. H. (2009). Evolution of colour vision in mammals. Philos. Trans. R. Soc.Lond. B Biol. Sci. 364, 2957–2967. doi: 10.1098/rstb.2009.0039
Jacobs, G. H. (2013). Losses of functional opsin genes, short-wavelength cone photopigments, and color vision: a significant trend in the evolution of mammalian vision. Vis. Neurosci. 30, 39–53. doi: 10.1017/S0952523812000429
Keane, M., Semeiks, J., Webb, A. E., Li, Y. I., Quesada, V., Craig, T., et al. (2015). Insights into the evolution of longevity from the bowhead whale genome. Cell Rep. 10, 112–122. doi: 10.1016/j.celrep.2014.12.008
Kearse, M., Moir, R., Wilson, A., Stones-Havas, S., Cheung, M., Sturrock, S., et al. (2012). Geneious basic: an integrated and extendable desktop software platform for the organization and analysis of sequence data. Bioinformatics 28, 1647–1649. doi: 10.1093/bioinformatics/bts199
Keers, R., Bonvicini, C., Scassellati, C., Uher, R., Placentino, A., Giovannini, C., et al. (2011). Variation in GNB3 predicts response and adverse reactions to antidepressants. J. Psychopharmacol. 25, 867–874. doi: 10.1177/0269881110376683
Kumar, R., Kohli, S., Alam, P., Barkotoky, R., Gupta, M., Tyagi, S., et al. (2013). Interactions between the FTO and GNB3 genes contribute to varied clinical phenotypes in hypertension. PLoS ONE 8:e63934. doi: 10.1371/journal.pone.0063934
Lambert, O., Bianucci, G., and de Muizon, C. (2008). A new stem-sperm whale (Cetacea, Odontoceti, Physeteroidea) from the latest Miocene of Peru. C. R. Palevol. 7, 361–369. doi: 10.1016/j.crpv.2008.06.002
Levenson, D., and Dizon, A. (2003). Genetic evidence for the ancestral loss of shortwavelength-sensitive cone pigments in mysticete and odontocete cetaceans. Proc. R. Soc. B Biol. Sci. 270, 673–679. doi: 10.1098/rspb.2002.2278
Levenson, D. H., Ponganis, P. J., Crognale, M. A., Deegan, J. F. II., Dizon, A., and Jacobs, G. H. (2006). Visual pigments of marine carnivores: pinnipeds, polar bear, and sea otter. J. Comp. Physiol. A 192, 833–843. doi: 10.1007/s00359-006-0121-x
McGowen, M. R., Spaulding, M., and Gatesy, J. (2009). Divergence date estimation and a comprehensive molecular tree of extant cetaceans. Mol. Phylogenet. Evol. 53, 891–906. doi: 10.1016/j.ympev.2009.08.018
Meredith, R. W., Gatesy, J., Emerling, C. A., York, V. M., and Springer, M. S. (2013). Rod monochromacy and the coevolution of cetacean retinal opsins. PLoS Genet. 9:e1003432. doi: 10.1371/journal.pgen.1003432
Meredith, R. W., Gatesy, J., Murphy, W. J., Ryder, O. A., and Springer, M. S. (2009). Molecular decay of the tooth gene enamelin (ENAM) mirrors the loss of enamel in the fossil record of placental mammals. PLoS Genet. 5:e1000634. doi: 10.1371/journal.pgen.1000634
Meredith, R. W., Janečka, J. E., Gatesy, J., Ryder, O. A., Fisher, C. A., Teeling, E. C., et al. (2011). Impacts of the Cretaceous Terrestrial Revolution and KPg extinction on mammal diversification. Science 334, 521–524. doi: 10.1126/science.1211028
Miller, M. A., Pfeiffer, W., and Schwartz, T. (2010). “Creating the CIPRES science gateway for inference of large phylogenetic trees,” in Proceedings of the Gateway Computing Environments Workshop (New Orleans, LA), 1–8.
Mills, S. L., and Catania, K. C. (2004). Identification of retinal neurons in a regressive rodent eye (the naked mole-rat). Vis. Neurosci. 21, 107–117. doi: 10.1017/S0952523804043020
Newman, L. A., and Robinson, P. R. (2005). Cone visual pigments of aquatic mammals. Vis. Neurosci. 22, 873–879. doi: 10.1017/S0952523805226159
Peichl, L., Behrmann, G., and Kroger, R. H. H. (2001). For whales and seals the ocean is not blue: a visual pigment loss in marine mammals. Eur. J. Neurosci. 13, 1520–1528. doi: 10.1046/j.0953-816x.2001.01533.x
Peichl, L., and Moutairou, K. (1998). Absence of short-wavelength sensitive cones in the retina of seals (Carnivora) and African giant rats (Rodentia). Eur. J. Neurosci. 10, 2586–2594. doi: 10.1046/j.1460-9568.1998.00265.x
Rychel, A. L., Reeder, T. W., and Berta, A. (2004). Phylogeny of mysticete whales based on mitochondrial and nuclear data. Mol. Phylogenet. Evol. 32, 892–901. doi: 10.1016/j.ympev.2004.02.020
Schmieder, R., and Edwards, R. (2011). Quality control and preprocessing of metagenomic datasets. Bioinformatics 27, 863–864. doi: 10.1093/bioinformatics/btr026
Schweikert, L. E., Fasick, J. I., and Grace, M. S. (2016). Evolutionary loss of cone photoreception in balaenid whales reveals circuit stability in the mammalian retina. J. Comp. Neurol. doi: 10.1002/cne.23996. [Epub ahead of print].
Springer, M. S., Starrett, J., Morin, P. A., Lanzetti, A., Hayashi, C., and Gatesy, J. (2016). Inactivatioin of C4orf26 in toothless placental mammals. Mol. Phylogenet. Evol. 95, 34–45. doi: 10.1016/j.ympev.2015.11.002
Stamatakis, A. (2006). RAxML-VI-HPC: maximum likelihood-based phylogenetic analyses with thousands of taxa and mixed models. Bioinformatics 22, 2688–2690. doi: 10.1093/bioinformatics/btl446
Stamatakis, A. (2014). RAxML Version 8: a tool for phylogenetic analysis and post-analysis of large phylogenies. Bioinformatics 30, 1312–1313. doi: 10.1093/bioinformatics/btu033
Stamatakis, A., Hoover, P., and Rougemont, J. (2008). A rapid bootstrap algorithm for the RAxML web servers. Syst. Biol. 57, 758–771. doi: 10.1080/10635150802429642
Swofford, D. L. (2002). PAUP. Phylogenetic Analysis Using Parsimony (* and Other Methods). Sunderland, MA Sinauer Associates.
Tan, Y., Yoder, A. D., Yamashita, N., and Li, W.-H. (2005). Evidence from opsin genes rejects nocturnality in ancestral primates. Proc. Natl. Acad. Sci. U.S.A. 102, 14712–14716. doi: 10.1073/pnas.0507042102
Veilleux, C. C., and Bolnick, D. A. (2009). Opsin gene polymorphism predicts trichromacy in a cathemeral lemur. Am. J. Primatol. 71, 86–90. doi: 10.1002/ajp.20621
Yang, Z. (2007). PAML 4: phylogenetic analysis by maximum likelihood. Mol. Biol. Evol. 24, 1586–1591. doi: 10.1093/molbev/msm088
Keywords: Cetacea, opsins, phototransduction, pseudogenes, rod monochromacy
Citation: Springer MS, Emerling CA, Fugate N, Patel R, Starrett J, Morin PA, Hayashi C and Gatesy J (2016) Inactivation of Cone-Specific Phototransduction Genes in Rod Monochromatic Cetaceans. Front. Ecol. Evol. 4:61. doi: 10.3389/fevo.2016.00061
Received: 09 March 2016; Accepted: 23 May 2016;
Published: 10 June 2016.
Edited by:
Wayne Iwan Lee Davies, University of Western Australia, AustraliaReviewed by:
Kristian Donner, University of Helsinki, FinlandCristiano Bertolucci, University of Ferrara, Italy
Copyright © 2016 Springer, Emerling, Fugate, Patel, Starrett, Morin, Hayashi and Gatesy. This is an open-access article distributed under the terms of the Creative Commons Attribution License (CC BY). The use, distribution or reproduction in other forums is permitted, provided the original author(s) or licensor are credited and that the original publication in this journal is cited, in accordance with accepted academic practice. No use, distribution or reproduction is permitted which does not comply with these terms.
*Correspondence: Mark S. Springer, mark.springer@ucr.edu