Directly Measured Denitrification Reveals Oyster Aquaculture and Restored Oyster Reefs Remove Nitrogen at Comparable High Rates
 Austin T. Humphries1*
  Suzanne G. Ayvazian2
  Joanna C. Carey3
  Boze T. Hancock4
  Sinead Grabbert2
  Donald Cobb2
  Charles J. Strobel2
  Robinson W. Fulweiler5
- 1Department of Fisheries, Animal and Veterinary Sciences, University of Rhode Island, Kingston, RI, USA
- 2National Health and Environmental Effects Research Laboratory, Atlantic Ecology Division, U.S. Environmental Protection Agency, Narragansett, RI, USA
- 3The Ecosystems Center, Marine Biological Laboratory, Woods Hole, MA, USA
- 4The Nature Conservancy, Graduate School of Oceanography, University of Rhode Island, Narragansett, RI, USA
- 5Departments of Earth and Environment and of Biology, Boston University, Boston, MA, USA
Coastal systems are increasingly impacted by over-enrichment of nutrients, which has cascading effects for ecosystem functioning. Oyster restoration and aquaculture are both hypothesized to mitigate excessive nitrogen (N) loads via benthic denitrification. The degree to which these management activities perform similar functions for removing N, however, has not been extensively examined in New England, a place where nutrient runoff is high and increasing oyster (Crassostrea virginica) restoration and aquaculture activity is taking place. Here, we use a novel in situ methodology to directly measure net N2 and O2 fluxes across the sediment-water interface in a shallow (~1 m) coastal pond in southern Rhode Island. We collected data seasonally during 2013 and 2014 at restored oyster reefs, oyster aquaculture, oyster cultch (shell), and bare sediment. Restored oyster reefs and aquaculture had the highest mean (±SE) denitrification rates, 581.9 (±164.2) and 346 (±168.6) μmol N2−N m−2 h−1, respectively, and are among the highest recorded for oyster-dominated environments. Denitrification rates at sites with oyster cultch were 60.9 (±44.3) μmol N2−N m−2 h−1, which is substantially less than the sites with active oysters but still more than 50% higher than denitrification rates measured in bare sediment (24.4 ± 10.1 μmol N2–N m−2 h−1). The increase in denitrification rates at treatments, however, varied by season and the greatest rates for restored reefs were in the fall. Overall, the greatest aggregate denitrification rates occurred in the fall. Sediment oxygen demand (SOD) followed similar patterns but with greater overall rates in the summer, and displayed a strong linear relationship with denitrification (R2 = 0.93). Our results demonstrate that habitats associated with live oysters have higher net denitrification rates and that oyster reef restoration and oyster aquaculture may provide similar benefits to the ecosystem in terms of N removal. However, gas fluxes may also be affected where three-dimensional structure is introduced via oyster shell cultch and this appears to be seasonally-dependent. These data will be important for managers as they incorporate oysters into nutrient reduction strategies and consider system-level trade-offs in services provided by oyster reef restoration and aquaculture activities.
Introduction
Excessive nutrient input from anthropogenic activities has altered the balance between inputs and exports resulting in a variety of well-known negative consequences for many organisms as well as overall ecosystem function (Valiela et al., 1992; Smith, 2003). Nitrogen (N) is of particular concern for estuaries because it often limits primary production and regulates the base of food webs (Howarth, 1988). Excessive N loading stimulates algal growth, which may lead to harmful algal blooms (Paerl, 1997), shifts in community assemblages (Hauxwell et al., 2001), reduced oxygen levels (i.e., hypoxia; Rabalais et al., 2002; Diaz and Rosenberg, 2008), and broad-scale eutrophication (Nixon, 1995). Suspension filter feeders such as oysters, however, may serve as N sinks for non-point sources (Kellogg et al., 2013). Managers are therefore beginning to look at oyster reef restoration and aquaculture as potential mitigation tools to resist and perhaps even reverse eutrophication in coastal environments. However, little is known about the capacity or comparative efficacy of restored oyster reefs or oyster aquaculture to mitigate the impacts of eutrophication.
Oysters were once a plentiful resource and a ubiquitous feature along estuarine landscapes, but are now functionally extinct from many areas due, at least in part, to fishing pressure (Kirby, 2004) and disease (Powell et al., 2012). In fact, present estimates of decline place oysters as one of the most imperiled nearshore habitats, with only 15% of historic reefs remaining worldwide (Beck et al., 2011) and < 1% remaining in Rhode Island (zu Ermgassen et al., 2012). This is of concern not only because oysters support a socially and economically valuable fishery, but also because oysters provide numerous non-extractive services to the surrounding environment (Coen et al., 2007). These services may include providing habitat for associated organisms and fisheries (Peterson et al., 2003; Humphries and La Peyre, 2015), erosion mitigation via sediment accretion and wave attenuation (Meyer et al., 1997; La Peyre et al., 2015), and water quality enhancement (Nelson et al., 2004; Newell, 2004). Local environmental conditions affect oyster populations and the delivery of ecosystem services regardless of whether oysters are being restored or raised in aquaculture farms. As such, there is a need to better understand the potential parallels in functioning between restored oyster habitat and aquaculture as coastal managers deal with interacting environmental stressors and the trade-offs between harvest or restoration, aquaculture, and the delivery of non-extractive ecosystem services.
In New England, many coastal systems are highly impacted by N, and thus the delivery of N that comes from atmospheric deposition, river discharges, sewage outfalls, or groundwater flow all contribute to eutrophication (Ryther and Dunstan, 1971; Correll et al., 1992; Valiela et al., 1997). Nitrogen may remain in the system contained in phytoplankton and other particulate organic matter, or it can be removed via physical transport or burial (through bioassimilation into primary consumer tissue and/or shell), as well as microbial-mediated denitrification (denitrification; Kellogg et al., 2014). Denitrification is an anaerobic process that converts bioavailable N to dinitrogen (N2) gas (Vitousek et al., 1997; Seitzinger et al., 2006). The amount of N that remains or is removed depends on complex interactions between biological, physical, and geochemical processes and may be difficult to tease apart (Cornwell et al., 1999; Fulweiler et al., 2008).
Estuaries and coastal marine environments are heterogeneous and dynamic, posing challenges to efforts at reducing the variance in quantifying and modeling N cycling (Seitzinger, 2008). While recent studies have shown that natural and restored oyster reefs can increase sediment denitrification rates (e.g., Piehler and Smyth, 2011; Kellogg et al., 2013; Smyth et al., 2013, 2015), variance among studies is high and the influence of aquaculture has been difficult to determine (Holyoke, 2008; Dumbauld et al., 2009; Higgins et al., 2011, 2013). Many studies attribute the variability in denitrification rates to interactions between numerous stochastic environmental parameters including dissolved oxygen, chlorophyll a, salinity, turbidity, temperature, and bivalve density (Carmichael et al., 2012; Smyth et al., 2013). Thus, there is a need to develop a better understanding of the relative influence that these factors have on denitrification rates and other gas fluxes such as oxygen (O2), or sediment oxygen demand (SOD).
Development of techniques to measure N cycling under field conditions has intensified during the last few decades. Recent studies have quantified the effects of oyster communities on N cycling using methods comparing sediment with oyster biodeposits vs. reference sediment (e.g., Piehler and Smyth, 2011; Smyth et al., 2013, 2015). These laboratory methods use sediment cores and thus exclude oysters and other associated organisms, which are known to provide physical structure that influence denitrification and SOD (Nizzoli et al., 2007). Kellogg et al. (2013) used a different method with oysters inside incubation chambers and combined an in situ equilibrium with ex situ incubation and measurement. Despite these advances in quantifying gas fluxes and attempts at replicating field conditions, it may be instructive to use sampling techniques that occur exclusively in situ to reduce variability and more closely mimic natural conditions. In situ measurement of gas flux would help to expand current knowledge of denitrification and SOD in estuarine ecosystems, isolate factors in oyster-dominated habitats that can maximize denitrification, and aid in the development of N-efficient management practices.
Oyster aquaculture and oyster reef restoration are currently increasing across much of the northern Atlantic coast of the United States due to their market value and/or for the non-extractive services they provide. The placement of cultch (shell) is a common first step in the larger process of oyster reef restoration that is meant to encourage oyster recruitment. While oyster restoration and aquaculture activities may have different goals depending on the setting, their relative impacts on nitrogen cycling may be variable (e.g., Holyoke, 2008; Kellogg et al., 2013). Here, we test this hypothesis and focus on quantifying changes in nutrient dynamics that oyster cultch, established reef restoration, oyster aquaculture, and bare sediment provide in terms of denitrification as well as SOD. In the process, we developed a novel in situ field methodology for measuring gas fluxes to better mimic field conditions and reduce variability. We hypothesized that oyster reef restoration and oyster aquaculture would enhance denitrification rates and oyster cultch would not have an impact due to biological activity that only live oysters provide (e.g., filtration, biodeposition). To examine this, we track denitrification and SOD in three different habitats through time and assessed seasonal changes over a 2-year period.
Materials and Methods
Study Area
We quantified rates of sediment denitrification and SOD across four different habitats in Ninigret Pond, RI (USA): bare sediment, oyster cultch, oyster aquaculture, and restored oyster reefs (Figure 1). Ninigret Pond is a back-barrier lagoon along the southern shore of Rhode Island. It has a residence time of 10±3 days (Moran et al., 2014) and diurnal tides of ~0.5 m. Mean annual inputs of dissolved inorganic N are ~1.85 × 10⁹ mmol yr−1 with the largest inputs from groundwater and the atmosphere (Moran et al., 2014). Intertidal and subtidal habitats include fringing salt marsh, eelgrass, and some existing natural oyster reef.
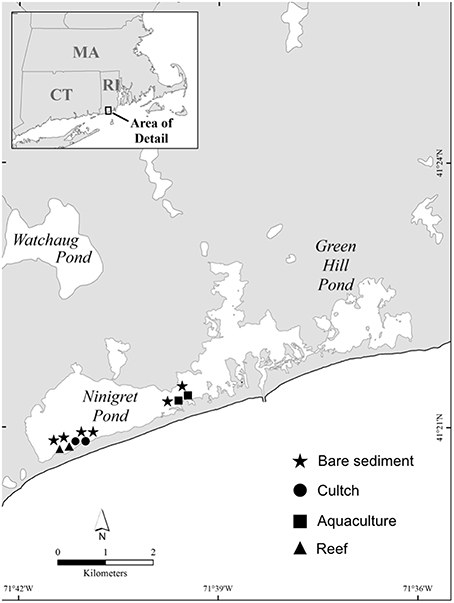
Figure 1. Study area map with treatment locations.
In this study, oyster plots consisted of previously restored reefs, where each reef was constructed by placing unaggregated shell in 5 × 5 m patches, then seeded with juvenile oysters in 2010. Oyster density at the restored reefs at the beginning of our sampling in 2013 was ~54 individuals m−2, with a mean shell height (SH) of 55 mm. Oyster cultch plots were created in 2012 by placing unaggregated shell in 5 × 5 m patches 7 months before sampling and were separated from the restored oyster reefs by ~150 m. Oyster aquaculture plots used in this study were underneath suspended mesh bags where oysters were being actively grown and harvested. The aquaculture plots were ~2 km away from the restored reef and cultch plots, which was the closest oyster farm. Mean density of oysters in the aquaculture plots was 700 ind m−2 and size varied depending on the time of year. We sampled bare sediment plots at each of the three sites and ~35 m away from any structured habitat. Water depth at all sites was between 0.4 and 1.2 m depending on the tide.
In situ Environmental Chambers
One of the primary goals of this research was to develop an in situ environmental chamber that would establish a methodology for others to measure SOD and denitrification rates. Our chamber design is modified from that described by Kellogg et al. (2013). The three primary components are machined from 40.6 cm (16″) inner diameter plexi-glass and PVC cylinders: a sampling base (area = 0.126 m−2), a mid-section wrapped with dark bubble-wrap insulation, and a lid with an impeller arm powered by a drill for stirring (Figure 2). The stir rate was ~70 rotations per minute. At the beginning of each sampling year, bases were deployed and filled with material from the site and allowed to equilibrate for ~6 weeks before sampling. At the oyster reef restoration site, sediment, oyster shell, and oysters were used as fill in the bases. At the oyster cultch site, sediment and oyster shell were used as fill in the bases. At the oyster aquaculture site, surrounding sediment was used as the fill and bases were directly underneath oysters in suspended bags. Bare sediment treatments consisted of sediment only and care was taken to choose areas representative of the pond. Bases were flush with the sediment surface and were not moved during the sampling year, allowing us to return to the exact same location for repeat measurements.
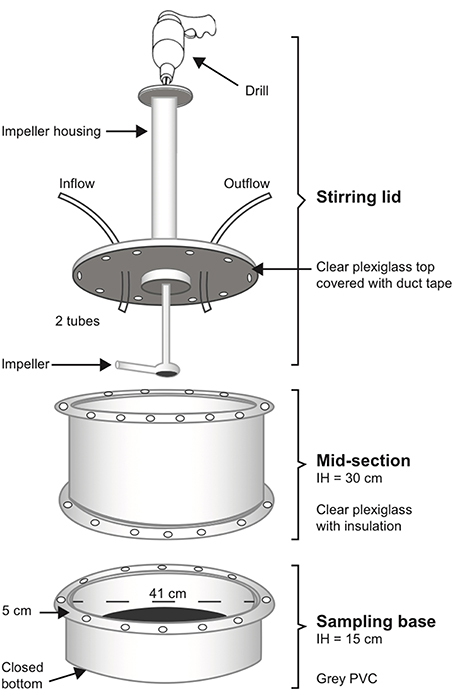
Figure 2. Diagram of incubation chamber used to measure nutrient fluxes in situ. See text for full description of setup in the field.
For each incubation, we attached the mid-section to the base with 24 evenly spread bolts and wing nuts and a rubber gasket. We wiped and inspected the mid-section for air bubbles, then secured the lid and impeller arm to the mid-section, again using 24 evenly spread bolts and wing nuts and a rubber gasket (Figure 2). Importantly, we did this while snorkeling, allowing us to visually examine the chamber for air bubbles and remove them if necessary. Once the chamber was secure and bubble-free, we placed an opaque black plastic cover on top of the lid to block any light. We placed an Onset Hobo Pendant Temperature/Light 64K data logger inside each chamber (prior to construction). The logger was anchored to the sediment to record light penetration and water temperature throughout the incubation. Each stirring lid was fitted with an inflow and outflow tube with stop valves, such that the inflow tube was connected to a carboy suspended ~1.2 m above the water and filled with unfiltered site water.
Sample Collection
We first deployed the in situ sampling bases in the spring of 2013. Two replicate experimental plots were identified at each site (cultch, aquaculture, oyster reef restoration), separated by ~20 m, and 2 bases were deployed in each plot which were separated by ~10 m from one another. We also identified and sampled bare sediment near each site (~40 m away) and 2 bases were deployed here as well, also separated by ~10 m from one another. Sampling occurred quarterly (spring = May; summer = July/August; fall = October) throughout 2013. In spring 2014, the bases at the oyster cultch were discontinued to concentrate increased efforts in the restored oyster and aquaculture sites. Therefore, in 2014, there were two experimental plots at the oyster reef restoration and aquaculture sites, each with 3 bases (as opposed to 2 bases per plot in 2013), as well bare sediment. Similar to 2013, sampling occurred quarterly (spring = May, summer = August, fall = October) throughout 2014.
At the onset of the experiment in 2013, we determined sediment grain size at each site using a Malvern Hydro 2000S/Mastersizer 2000 System. During each quarterly sampling event at each site, we measured sediment chlorophyll a and C:N ratios in duplicate. Sediment chlorophyll a samples were analyzed on a Turner Model AU-10 Digital Fluorometer with Optical Kit P/N 10-040R and the C:N samples were processed on a ThermoFinnigan Flash EA 112 as described in Katz et al. (2013). During gas flux measurements, we collected surface water measurements using a Hach probe (HQD portable meter with 4-pole conductivity probe and luminescent dissolved oxygen probe), which included temperature, salinity, dissolved oxygen (DO), and percentage oxygen (O2) saturation. All water column and sediment characteristics were analyzed at the US Environmental Protection Agency laboratory in Narragansett, RI.
Gas Fluxes
During incubations, we sampled dissolved gases five times from each chamber, balancing the need for at least a 2 mg L−1 change in DO but taking care not to allow the sample to go hypoxic (DO < 2 mg L−1). Timing of sampling events was based on DO changes and total incubation periods varied seasonally and by site (bare sediment and cultch: 3–6 h; oyster aquaculture: 1–3 h; restored oyster reef: 1–3 h). To reduce the possibility of bubble formation, which is well-known to impact the N2/Ar technique described below (Kana et al., 1994; Eyre et al., 2002), we performed all incubations in the early morning when the water was below saturation for DO and the chambers were dark.
During each sampling event, water samples were collected for analyses of dissolved gases O2, N2, and Ar into Labco Exetainer vials. Water samples were preserved with 10 μl of super saturated zinc chloride solution, sealed, submerged in water and stored at temperatures below incubation temperatures until analysis. Dissolved gas samples were analyzed using the N2/Ar technique (Kana et al., 1994) and a quadruple membrane-inlet mass spectrometer (MIMS) at Boston University in Boston, MA. The N2/Ar technique gives a net measurement of N2 fluxes (i.e., gross nitrogen fixation–gross denitrification). All positive fluxes are indicative of net denitrification, while a negative flux would indicate net nitrogen fixation.
Gas Flux Analysis
SOD and net N2 fluxes across the sediment-water interface were determined using linear regressions fitted to plots of concentration vs. time. Fluxes were calculated when the regression line had an R2 ≥ 0.65 (Prairie, 1996) and were statistically significant (p < 0.10). Fluxes were then prorated for the volume of water in the chamber and the chamber area. We calculated mean denitrification and SOD for each incubation and used this value for future calculations.
Statistical Analyses
We tested for a treatment effect on sediment grain size, chlorophyll a, and molar C:N ratios using linear models with Tukey post-hoc tests. We tested the effects of treatment and season, as well as their interaction, on rates of denitrification and SOD using linear mixed-effects models (LME). In these models, we treated the location of the bare sediment plots as a random nested effect to account for any potential location-specific differences (Hurlbert, 1984). Additionally, we used the mean from the multiple chambers in each plot as the lowest aggregate value for analyses to avoid pseudoreplication (Hurlbert, 1984). To test significant comparisons of interest, we used main effects models with Tukey post-hoc tests. When testing for the effects of each treatment by season, we used an auto-regressive correlation structure to account for the temporal correlation in the data (Zuur et al., 2009). Data were tested for normality using Shapiro–Wilks test and quantile–quantile plots. Finally, we used linear regression to assess the relationship between denitrification and SOD, pooling the data by season for each treatment. All statistical analyses were done in R, version 3.1.3 (R Core Development Team, 2015). All rates are reported as mean μmol N2–N m−2 h−1 plus or minus one standard error.
Results
We captured a range of temperatures during the experiment: from 14 to 22°C in the spring, 20 to 24°C in the summer and 8 to 17°C in the fall. Salinity ranged between 18 and 32‰, with generally lower levels during the spring (mean spring: 23‰ vs. mean summer: 30‰).
Sediment grain size varied across some treatments, but no treatment had < 98% sand (Table 1). Silt was greatest in aquaculture and significantly greater than bare sediment (p < 0.01) and reef (p = 0.03), but not cultch (p = 0.12). Clay did not vary among treatment (p = 0.464). Sand was greater in bare sediment (p < 0.01) and reef (p = 0.03) than aquaculture. Sediment molar C:N ratios varied among treatment (Residual df = 280; F = 9.57, p < 0.001) and were between 11 and 13. Sediment chlorophyll a was varied significantly (Residual df = 201; F = 11.10, p < 0.001) and ranged from 2.5 μg/g at the bare sediment treatment to a high of 7.1 μg/g at the aquaculture treatment. Overall, oyster aquaculture sediment chlorophyll a was significantly greater than any other treatment. Water column DO at the start of the incubations ranged from 4.7 to 11.3 mg L−1 (55.7%−96.4%).
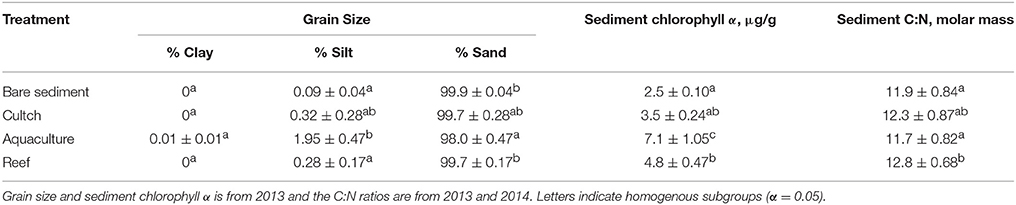
Table 1. Site characteristics including mean (±SE) grain size, sediment chlorophyll α, and sediment molar C:N ratio.
Denitrification varied by season and treatment, but there was an interaction precluding conclusions about the main effects (Table 2; Figure 3). Denitrification rates at the bare sediment (F = 0.719, p = 0.501), cultch (F = 0.024, p = 0.886), and aquaculture (F = 3.528, p = 0.057) treatments showed no statistically significant differences among season. For restored reefs (F = 4.429, p = 0.028), however, fall was greater than spring (t = 2.948, p = 0.0233) but not summer (t = 1.773, p = 0.208). Denitrification rates during the spring (F = 1.267, p = 0.310) and summer (F = 3.183, p = 0.055) seasons were not significantly different among treatment. During the fall (F-value 4.602, p = 0.026), restored reef was greater than bare sediment (t = 2.873, p = 0.028), but no other treatments were significantly different from one another.
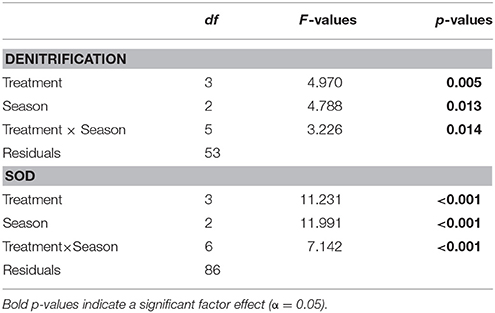
Table 2. Results from LMEs of denitrification and sediment oxygen demand (SOD), respectively.
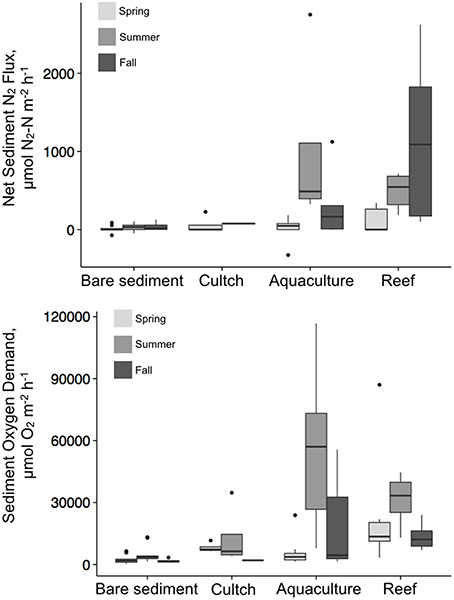
Figure 3. Boxplots of seasonal denitrification and sediment oxygen demand rates.
Overall, denitrification was highest in fall [517.8 (±183) μmol N2–N m−2 h−1], followed by summer [386.2 (±143.8) μmol N2–N m−2 h−1] and then spring [47.2 (±25.6) μmol N2–N m−2 h−1]. Denitrification rates across treatments revealed the highest rates at the restored oyster reef [581.9 (±164.2) μmol N2–N m−2 h−1] followed by aquaculture [346.1 (±168.6) μmol N2–N m−2 h−1], then cultch [60.9 (±44.3) μmol N2–N m−2 h−1], and bare sediment [24.4 (±10.1) μmol N2–N m−2 h−1; Figure 4].
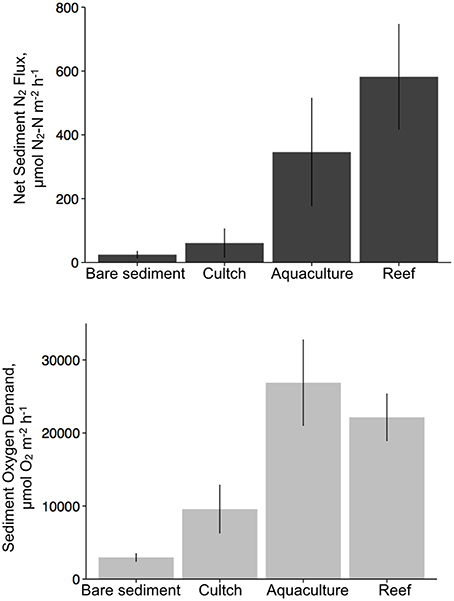
Figure 4. Mean (±SE) fluxes of denitrification and sediment oxygen demand.
We also measured rates of N2 uptake or N-fixation. The maximum rate of N-fixation (−325.5 μmol N2–N m−2 h−1) was observed at the aquaculture site in the spring of 2014 and two lesser rates of N-fixation were also observed at the control sites in the summer of 2013 (−47.6 μmol N2–N m−2 h−1) and the spring of 2014 (−73.2 μmol N2–N m−2 h−1). On several other occasions we measured significant rates of net N-fixation, however, in most of these cases the water column N2 concentrations were well-above what would be predicted based on ambient temperature and salinity. In these instances we did not report the rate of N-fixation because we were concerned that the N-fixation might be an artifact of the supersaturated N2 concentrations. This occurred most often in the summer of 2013 and most especially for the oyster aquaculture, restored reef, and cultch sites. In total, we did not include 22 fluxes (out of a total of 101).
Similar to denitrification, season, and treatment, as well as their interaction, influenced SOD, precluding conclusions on main effects (Table 2; Figure 3). SOD rates at the bare sediment (F = 4.663, p = 0.018), aquaculture (F = 10.013, p < 0.001), and restored reef (F = 3.786, p = 0.036) treatments showed statistically significant differences among season. Bare sediment SOD was greater in the summer than fall (t = −2.957, p = 0.016), but no other seasons were significantly different from one another. Spring (t = 4.165, p < 0.001) and fall (t = −3.406, p = 0.006) had significantly lower SOD rates for aquaculture than summer. Restored reef SOD had greater rates in the summer than fall (t = −2.742, p = 0.028), but no other statistically significant differences existed. Cultch SOD rates did not significantly vary by season (F = 0.497, p = 0.631). SOD rates during the spring (F = 2.905, p = 0.059) were not significantly different among treatment, however, treatment varied significantly during summer (F = 10.483, p < 0.001) and fall (F = 3.783, p = 0.029). In the summer, SOD at aquaculture was greater than cultch (t = 3.393, p = 0.009) and bare sediment (t = 3.598, p < 0.001), and SOD at restored reef was greater than bare sediment (t = 3.008, p = 0.025). In the fall, SOD rates were only greater at aquaculture than bare sediment (t = 3.141, p = 0.016), all other comparisons were not significantly different from one another.
Overall, SOD rates in the summer [28197.2 (±4724.9) μmol O2 m−2 h−1] were greater than those in the spring [9553.3 (±2835.5) μmol O2m−2 h−1] or fall [9724.4 (±2221.8) μmol O2m−2 h−1]. Aquaculture SOD rates were greatest [26880.8 (±5845.8) μmol O2 m−2 h−1], followed by restored reef [22143.6 (±3193.2) μmol O2 m−2 h−1], cultch [9581.8 (± 3271.6) μmol O2m−2 h−1], and bare sediment [2959.4 (±528.3) μmol O2m−2 h−1; Figure 4].
We found a strong linear relationship between denitrification and SOD with a slope of 0.019 (R2 = 0.93, p < 0.001; Figure 5). These data are pooled and presented seasonally, with each point representing a treatment × season mean and standard error.
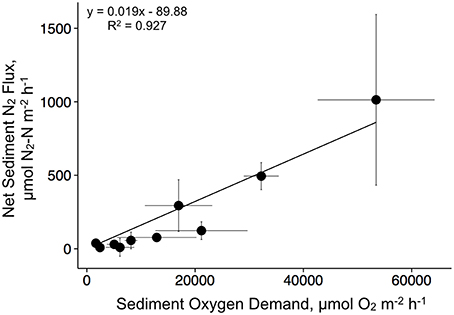
Figure 5. Relationship between sediment oxygen demand and denitrification for the duration of the experiment. Data are mean values for each treatment by season combination.
Discussion
In this study, we developed an in situ technique to measure denitrification and SOD. An advantage of this methodology is that we are able to closely mimic the study environment and to return to the same site repeatedly thereby minimizing spatial heterogeneity (Groffman and Hanson, 1997; Smyth et al., 2015). This method, however, has some constraints that may limit its applicability. The current design has strict water level requirements (>10 cm above chamber lid and < 1.2 m above the electronic stirrer). If water levels are too shallow, the mid-section of the incubation chamber cannot be attached to the base without introducing air bubbles, which significantly and selectively affect gas concentrations in water (Reeburgh, 1969). If the water level fluctuates significantly, perhaps from wave energy, there can be difficulties in maintaining a bubble-free environment during set up. Water clarity is also a requirement as you must be able to inspect the chamber for correct o-ring placement and bubbles. Therefore, turbid waters (e.g., Gulf of Mexico) may not be a good location for this method. It is essential to begin these incubations early in the morning when dissolved oxygen concentrations are well-below saturation. Finally, we tried to also include light incubations in the first year but found that during the course of the incubation, water temperature inside the chamber rose and we were uncomfortable using the N2 data as equilibrium changes were likely driving the observed fluxes. Where environmental conditions are similar to those in our experiment, this new methodology may be a way to better mimic the natural environment and reduce variability resulting from spatial heterogeneity.
We measured denitrification and SOD rates for oyster cultch, aquaculture, and reef restoration in a system that is representative of many New England coastal areas. We found that compared to bare sediment alone, oyster reef restoration and aquaculture enhanced sediment denitrification rates by 557.5 (±154.1) and 321.7 (±158.5) μmol N2–N m−2 h−1, respectively. An ecologically important but lower sediment denitrification rate [36.4 (± 34.2) μmol N2–N m−2 h−1] was observed with oyster cultch. Our sediment denitrification rates exceeded the range reported for other natural and restored oyster reef sites in North Carolina (Piehler and Smyth, 2011; Smyth et al., 2013; 22 and 26.1 μm N-N2 m−2 h−1, respectively), but similar to those reported by Kellogg et al. (2013) from the Virginia coast (300–1600 μm N-N2 m−2 h−1).
The magnitude of the increase in denitrification by treatment was dependent on season with the greatest denitrification rates observed in fall. This is different from some other studies looking at the impact of oysters on denitrification but similar to others looking at denitrification in bare sediments. Piehler and Smyth (2011) found denitrification rates near oyster reefs to be lowest during the fall. Importantly, Piehler and Smyth (2011) did not include live oysters—but instead sampled the bare sediment adjacent to the oyster habitat. The lower rates they report are likely a function of not including the biologically active oysters (Piehler and Smyth, 2011). The lack of correlation with temperature in our study is consistent with other observations from colder, deeper subtidal marine sediments (e.g., Laursen and Seitzinger, 2002; Heiss et al., 2012). Additionally, intertidal sediment denitrification rates were highest in winter and early spring with lowest rates in summer in the Wadden Sea (Kieskamp et al., 1991). And, in Chesapeake Bay denitrification rates were minimal in summer and higher in spring and fall (Kemp et al., 1990). In many estuaries, summer denitrification is driven by coupled nitrification–denitrification (Jenkins and Kemp, 1984; Horrigan and Capone, 1985; Rysgaard et al., 1996). Thus, anything that lowers nitrification (e.g., low oxygen conditions) will limit nitrate availability and thus denitrification rates are often lowest in summer.
SOD can be positively correlated to sediment denitrification rates in a wide variety of sediment types, especially where low oxygen conditions limit denitrification rates (Eyre et al., 2013). We found a strong correlation (R2 = 0.93, p < 0.001) between SOD and denitrification, but the slope (0.019) was lower than those from other studies in both terrestrial and aquatic environments (see Eyre et al., 2013). For instance, Fennel et al. (2009) compiled 657 denitrification and SOD measurements from aquatic sediments and found a slope of 0.089, whereas Piehler and Smyth (2011) found an average slope of 0.063 across multiple sites and seasons. Measuring SOD is a much cheaper and easier alternative to denitrification, and our results suggest this relationship has the potential to be used as a predictive tool for determining N-reduction from subtidal oyster restoration or aquaculture temperate systems.
Effects of oyster aquaculture on nutrient bioextraction likely depend heavily on aquaculture practices. For instance, forms of aquaculture that use cultch on the substratum (e.g., Louisiana) could be expected to resemble denitrification rates more similar to natural or restored oyster reefs (Sisson et al., 2011). Although, the aquaculture site we used for this study used off-bottom cages that may not be similar in structure to natural or restored oyster reefs, we still found denitrification rates to be comparable to restored reefs. This suggests that oyster aquaculture may be functionally similar to restored oyster reefs where environmental conditions are comparable, regardless of aquaculture technique/gear. Other studies suggest rates of denitrification are rarely enhanced in sediments below aquaculture operations (Holyoke, 2008; Higgins et al., 2011, 2013). These studies, however, have lacked seasonal data, which as shown in our study and others (e.g., Kellogg et al., 2013; Smyth et al., 2013), can significantly influence denitrification rates. Future studies examining N2 gas fluxes at oyster and other shellfish aquaculture sites should consider seasonal differences throughout the year as well as the type of gear used and harvest practices. Determining how these factors interact to influence impacts of the industry on the environment will be critical for establishing best management practices. Rose et al. (2015) suggests N removal from aquaculture farms compares similarly (per-acre basis) to other best management approaches for non-point source nitrogen mitigation.
Ninigret Pond, where we conducted this study, is receiving ~1.85 × 10⁹ mmol y−1 of inorganic N (Moran et al., 2014). Currently, oyster aquaculture covers 1.4% of the surface area of Ninigret Pond (Dave Beautel, Aquaculture and Fisheries Coordinator at RI Coastal Resources Management Council, personal communication). If we scale the observed mean aquaculture denitrification rate (346 μmol N2–N m−2 h−1) to the current area under aquaculture (90,300 m2) then we predict that ~134 × 103 moles per year, or roughly 7% of the total N inputs into Ninigret Pond, are currently being removed. The Coastal Resource Management Council (CRMC) of Rhode Island currently caps oyster aquaculture at 5% of the total surface area of any coastal pond (http://www.crmc.ri.gov/aquaculture/aquaculturefaq.html). Thus, if in the future 5% of this estuary is used for oyster aquaculture, we predict that this activity has the potential to remove 26% of the total N inputs. However, we measured the highest denitrification rates at the restored oyster reef sites. In turn if oyster reefs were restored in just 5% of the pond area then >40% of the total N inputs could be removed. Of course, these values should be taken with caution for a variety of reasons. First, we observed large variation in the denitrification rates, including some N-fixation, and thus understanding the cause of these variations is a key step to better constraining N removal rates. Second, here we report only net N2 fluxes and not have taken into account fluxes of other nitrogen species. For example, if the flux of ammonium out of the sediments outpaces denitrification then these oyster habitats could be increasing water column primary production, enhancing sediment organic matter loading, increasing SOD and, in time, ultimately decreasing N removal. Additionally, in these calculations we assume that denitrification rates do not change even as oyster density increases, nor do the rates reported here capture a multi-year variability, or the impact of macroalgae. Thus, denitrification must be considered within a matrix of factors that can potentially influence denitrification rates to more accurately determine the potential of different oyster management strategies to remove N.
The growing impact of humans on ecosystems demands science find feasible solutions to current and future problems including nutrient enrichment. Eutrophication is increasing worldwide and finding ways to balance inputs and outputs will be critical as future stressors interact in surprising ways. Rising appreciation for the ecosystem services oysters provide has led to increased efforts to restore or enhance habitat, even initiating oyster aquaculture within a broader management portfolio. One service oysters have been shown to provide is improved water quality through the conversion of fixed N to N2 gas, but the rate of denitrification has been highly variable. This study is the first to conduct in situ measurements of gas fluxes during multiple seasons and years at both oyster reef restoration and oyster aquaculture sites (within the same system). Overall, these data suggest that the biological properties of oysters (e.g., filtration, biodeposition) are important factors in priming sediments for denitrification and SOD, but that the introduction of three-dimensional habitat structure via oyster shell may also increase sediment metabolism. This benthic-pelagic coupling may be a result of increases in associated bioturbating organisms when structure (e.g., cultch) is added to an otherwise homogeneous benthic environment (Rysgaard et al., 1995; Humphries et al., 2011). The strong linear relationship between denitrification and SOD suggests that managers may measure SOD as a proxy for denitrification, which may provide a cheaper and more easily employed method for estimating N removal via denitrification. A better understanding of the processes influencing denitrification should improve our ability to describe restoration goals for oysters and assist in achieving maximum water quality benefits from aquaculture.
Author Contributions
Conceived and designed the experiments, SA, BH, RF. Performed the experiments, AH, SA, JC, BH, SG, DC, CS. Analyzed the data, AH, JC, SG, RF. Contributed reagents/materials/analysis tools, AH, SA, BH, RF. Wrote the paper, AH, RF.
Funding
AH, SA, JC, SG, DC, CS were funded by U.S. EPA. BH was funded by TNC. RF was funded by RI Sea Grant.
Conflict of Interest Statement
The authors declare that the research was conducted in the absence of any commercial or financial relationships that could be construed as a potential conflict of interest.
Acknowledgments
We acknowledge the following individuals for their dedicated efforts collecting data from the field and conducting laboratory analyses: A. Gerber-Williams, A. Pimenta, A. Kopacsi, and many others. We thank Steven Brown for contributions to the initial concept and the RI Chapter of TNC for the time of field staff. We thank the internal EPA technical reviewers A. Oczkowski, R. McKinney, and G. Cicchetti for their thoughtful comments and W. Munns for critical review of the manuscript, as well as three external reviewers. We thank Rhode Island Sea Grant who funded RWF to work on this project. Also, we thank Dr. Scott Nixon who was part of the original team that helped design this study including the in situ chambers. Mention of trade names or commercial products does not constitute endorsement or recommendation for use by the U.S. Environmental Protection Agency. This report has been reviewed by the U.S. EPA's National Health and Environmental Effects Research Laboratory, Atlantic Ecology Division, Narragansett, Rhode Island, and approved for publication. Approval does not signify that the contents necessarily reflect the views and policies of the Agency. This is Contribution number ORD-013985.
References
Beck, M. W., Brumbaugh, R. D., Airoldi, L., Carranza, A., Coen, L. D., Crawford, C., et al. (2011). Oyster reefs at risk and recommendations for conservation, restoration, and management. Bioscience 61, 107–116. doi: 10.1525/bio.2011.61.2.5
Carmichael, R. H., Walton, W., Clark, H., and Ramcharan, C. (2012). Bivalve-enhanced nitrogen removal from coastal estuaries. Can. J. Fish. Aquat. Sci. 69, 1131–1149. doi: 10.1139/f2012-057
Coen, L. D., Brumbaugh, R. D., Bushek, D., Grizzle, R., Luckenbach, M. W., Posey, M. H., et al. (2007). Ecosystem services related to oyster restoration. Mar. Ecol. Prog. Ser. 341, 303–307. doi: 10.3354/meps341303
Cornwell, J. C., Kemp, M. W., and Kana, T. M. (1999). Denitrification in coastal ecosystems: methods, environmental controls, and ecosystem level controls, a review. Aquatic Ecol. 33, 41–54. doi: 10.1023/A:1009921414151
Correll, D. L., Jordan, T. E., and Weller, D. E. (1992). Nutrient flux in a landscape: effects of coastal land use and terrestrial community mosaic on nutrient transport to coastal waters. Estuaries 15, 431–442. doi: 10.2307/1352388
Diaz, R. J., and Rosenberg, R. (2008). Spreading dead zones and consequences for marine ecosystems. Science 321, 926–929. doi: 10.1126/science.1156401
Dumbauld, B. R., Ruesink, J. L., and Rumrill, S. S. (2009). The ecological role of bivalve shellfish aquaculture in the estuarine environment: a review with application to oyster and clam culture in West Coast (USA) estuaries. Aquaculture 290, 196–223. doi: 10.1016/j.aquaculture.2009.02.033
Eyre, B. D., Maher, D. T., and Squire, P. (2013). Quantity and quality of organic matter (detritus) drives N2 effluxes (net denitrification) across seasons, benthic habitats, and estuaries. Glob. Biogeoch. Cyc. 27, 1083–1095. doi: 10.1002/2013GB004631
Eyre, B. D., Rysgaard, S., Dalsgaard, T., and Christensen, P. B. (2002). Comparison of isotope pairing and N2:Ar methods for measuring sediment denitrification—assumption, modifications, and implications. Estuaries 25, 1077–1087. doi: 10.1007/BF02692205
Fennel, K., Brady, D., DiToro, D., Fulweiler, R. W., Gardner, W. S., Giblin, A., et al. (2009). Modeling denitrification in aquatic sediments. Biogeochemistry 93, 159–178. doi: 10.1007/s10533-008-9270-z
Fulweiler, R. W., Nixon, S. W., Buckley, B. A., and Granger, S. L. (2008). Net sediment N2 fluxes in a coastal marine system—experimental manipulations and a conceptual model. Ecosystems 11, 1168–1180. doi: 10.1007/s10021-008-9187-3
Groffman, P. M., and Hanson, G. C. (1997). Wetland denitrification: influence of site quality and relationships with wetland delineation protocols. Soil Sci. Soc. Amer. J. 61, 323–329. doi: 10.2136/sssaj1997.03615995006100010047x
Hauxwell, J., Cebrián, J., Furlong, C., and Valiela, I. (2001). Macroalgal canopies contribute to eelgrass (Zostera marina) decline in temperate estuarine ecosystems. Ecology 82, 1007–1022. doi: 10.2307/2679899
Heiss, E. M., Fields, L., and Fulweiler, R. W. (2012). Directly measured net denitrification rates in offshore New England sediments. Cont. Shelf Res. 45, 78–86. doi: 10.1016/j.csr.2012.06.002
Higgins, C. B., Stephenson, K., and Brown, B. L. (2011). Nutrient bioassimilation capacity of aquacultured oysters: quantification of an ecosystem service. J. Environ. Qual. 40, 271–277. doi: 10.2134/jeq2010.0203
Higgins, C. B., Tobias, C., Piehler, M. F., Smyth, A. R., Dame, R. F., Stephenson, K., et al. (2013). Effect of aquacultured oyster biodeposition on sediment N2 production in Chesapeake Bay. Mar. Ecol. Prog. Ser. 473, 7–27. doi: 10.3354/meps10062
Holyoke, R. (2008). Biodeposition and Biogeochemical in Shallow, Mesohaline Sediments of Chesapeake Bay. Ph.D. dissertation, University of Maryland, College Park, MD.
Horrigan, S. G., and Capone, D. G. (1985). Rates of nitrification and nitrate reduction in nearshore marine sediments at near ambient substrate concentrations. Mar. Chem. 16, 317–327. doi: 10.1016/0304-4203(85)90053-2
Howarth, R. W. (1988). Nutrient limitation of net primary production in marine ecosystems. Annual Rev. Ecol. Syst. 19, 89–110. doi: 10.1146/annurev.es.19.110188.000513
Humphries, A. T., and La Peyre, M. K. (2015). Oyster reef restoration supports increased nekton biomass and potential commercial fishery value. PeerJ 3, e1111. doi: 10.7717/peerj.1111
Humphries, A. T., La Peyre, M. K., Kimball, M. E., and Rozas, L. P. (2011). Testing the effect of habitat structure and complexity on nekton assemblages using experimental oyster reefs. J. Exp. Mar. Biol. Ecol. 409, 172–179. doi: 10.1016/j.jembe.2011.08.017
Hurlbert, S. H. (1984). Pseudoreplication and the design of ecological field experiments. Ecol. Monographs 54, 187–211. doi: 10.2307/1942661
Jenkins, M. C., and Kemp, W. M. (1984). The coupling of nitrification and denitrification in two estuarine sediments. Limnol. Oceanogr. 29, 609–619. doi: 10.4319/lo.1984.29.3.0609
Kana, T. M., Darkangelo, C., Hunt, M. D., Oldham, J. B., Bennett, G. E., and Cornwell, J. C. (1994). Membrane inlet mass spectrometer for rapid high-precision determination of N2, O2, and Ar in environmental water samples. Anal. Chem. 66, 4166–4170. doi: 10.1021/ac00095a009
Katz, D. R., Cantwell, M. G., Sullivan, J. C., Perron, M. M., Burgess, R. M., Ho, K. T., et al. (2013). Factors regulating the accumulation and spatial distribution of the emerging contaminant triclosan in the sediments of an urbanized estuary: Greenwich Bay, Rhode Island, USA. Sci. Total Environ. 443, 123–133. doi: 10.1016/j.scitotenv.2012.10.052
Kellogg, M. L., Cornwell, J. C., Owens, M. S., and Paynter, K. T. (2013). Denitrification and nutrient assimilation on a restored oyster reef. Mar. Ecol. Prog. Ser. 480, 1–19. doi: 10.3354/meps10331
Kellogg, M. L., Smyth, A. R., Luckenbach, M. W., Carmichael, R. H., Brown, B. L., Cornwell, J. C., et al. (2014). Use of oysters to mitigate eutrophication in coastal waters. Est. Coast. Shelf Sci. 151, 156–168. doi: 10.1016/j.ecss.2014.09.025
Kemp, W. M., Sampou, P., Caffrey, J., Mayer, M., Henriksen, K., and Boynton, W. R. (1990). Ammonium recycling versus denitrification in Chesapeake Bay sediments. Limnol. Oceanogr. 35, 1545–1563. doi: 10.4319/lo.1990.35.7.1545
Kieskamp, W. M., Lohse, L., Epping, E., and Helder, W. (1991). Seasonal variation in denitrification rates and nitrous oxide fluxes in intertidal sediments of the western Wadden Sea. Mar. Ecol. Prog. Ser. 72, 145–151. doi: 10.3354/meps072145
Kirby, M. X. (2004). Fishing down the coast: historical expansion and collapse of oyster fisheries along continental margins. Proc. Nat. Acad. Sci. U.S.A. 101, 13096–13099. doi: 10.1073/pnas.0405150101
La Peyre, M. K., Serra, K. T., Joyner, T. A., and Humphries, A. T. (2015). Assessing shoreline exposure and oyster habitat suitability maximizes potential success for restored oyster reefs. PeerJ 3:e1317. doi: 10.7717/peerj.1317
Laursen, A. E., and Seitzinger, S. P. (2002). Measurement of denitrification in rivers: an integrated, whole reach approach. Hydrobiologia 485, 67–81. doi: 10.1023/A:1021398431995
Meyer, D. L., Townsend, E. C., and Thayer, G. W. (1997). Stabilization and erosion control value of oyster cultch for intertidal marsh. Rest. Ecol. 5, 93–99. doi: 10.1046/j.1526-100X.1997.09710.x
Moran, S., Stachelhaus, S., Kelly, R., and Brush, M. (2014). Submarine groundwater discharge as a source of dissolved inorganic nitrogen and phosphorus to coastal ponds of Southern Rhode Island. Estuaries Coasts 37, 104–118. doi: 10.1007/s12237-013-9663-7
Nelson, K. A., Leonard, L. A., Posey, M. H., Alphin, T. D., and Mallin, M. A. (2004). Using transplanted oyster (Crassostrea virginica) beds to improve water quality in small tidal creeks: a pilot study. J. Exp. Mar. Biol. Ecol. 298, 347–368. doi: 10.1016/s0022-0981(03)00367-8
Newell, R. I. E. (2004). Ecosystem influences of natural and cultivated populations of suspension-feeding bivalve molluscs: a review. J. Shellfish Res. 23, 51–61. Available online at: http://darc.cms.udel.edu/ibog/newellecobivalve2.pdf
Nixon, S. W. (1995). Coastal marine eutrophication: a definition, social causes, and future concerns. Ophelia 41, 199–219. doi: 10.1080/00785236.1995.10422044
Nizzoli, D., Bartoli, M., Cooper, M., Welsh, D. T., Underwood, G. J., and Viaroli, P. (2007). Implications for oxygen, nutrient fluxes and denitrification rates during the early stage of sediment colonisation by the polychaete Nereis spp. in four estuaries. Estuarine Coast. Shelf Sci. 75, 125–134. doi: 10.1016/j.ecss.2007.03.035
Paerl, H. W. (1997). Coastal eutrophication and harmful algal blooms: importance of atmospheric deposition and groundwater as new nitrogen and other nutrient sources. Limnol. Oceanogr. 42, 1154–1165. doi: 10.4319/lo.1997.42.5_part_2.1154
Peterson, C. H., Grabowski, J. H., and Powers, S. P. (2003). Estimated enhancement of fish production resulting from restoring oyster reef habitat: quantitative valuation. Mar. Ecol. Prog. Ser. 264, 249–264. doi: 10.3354/meps264249
Piehler, M., and Smyth, A. (2011). Habitat-specific distinctions in estuarine denitrification affect both ecosystem function and services. Ecosphere 2, art12. doi: 10.1890/es10-00082.1
Powell, E. N., Klinck, J. M., Alcox, K. A., Hoffmann, E. E., and Morson, J. M. (2012). The rise and fall of Crassostrea virginica oyster reefs: the role of disease and fishing in their demise and a vignette on their recovery. J. Mar. Res 70, 505–558. doi: 10.1357/002224012802851878
Prairie, Y. T. (1996). Evaluating the predictive power of regression models. Can. J. Fisheries Aquat. Sci. 53, 490–492. doi: 10.1139/f95-204
R Core Development Team (2015). R: A Language and Environment for Statistical Computing. Vienna: R Foundation for Statistical Computing.
Rabalais, N. N., Turner, R. E., and Wiseman, W. J. (2002). Gulf of Mexico hypoxia, aka “The dead zone.” Ann. Rev. Ecol. System. 33, 235–263. doi: 10.1146/annurev.ecolsys.33.010802.150513
Reeburgh, W. S. (1969). Observations of gases in Chesapeake Bay sediments. Limnol. Oceanogr. 14, 368–375. doi: 10.4319/lo.1969.14.3.0368
Rose, J. M., Bricker, S. B., and Ferreira, J. G. (2015). Comparative analysis of modeled nitrogen removal by shellfish farms. Mar. Poll. Bull. 91, 185–190. doi: 10.1016/j.marpolbul.2014.12.006
Rysgaard, S., Christensen, P. B., and Nielsen, L. P. (1995). Seasonal variation in nitrification and denitrification in estuarine sediment colonized by benthic microalgae and bioturbating infauna. Mar. Ecol. Prog. Ser. 126, 111–121. doi: 10.3354/meps126111
Rysgaard, S., Risgaard-Petersen, N., and Sloth, N. P. (1996). Nitrification, denitrification, and nitrate ammonification in sediments of two coastal lagoons in Southern France. Hydrobiologia 329, 133–141. doi: 10.1007/BF00034553
Ryther, J. H., and Dunstan, W. M. (1971). Nitrogen, phosphorus, and eutrophication in the coastal marine environment. Science 171, 1008–1013. doi: 10.1126/science.171.3975.1008
Seitzinger, S., Harrison, J. A., Böhlke, J., Bouwman, A., Lowrance, R., Peterson, B., et al. (2006). Denitrification across landscapes and waterscapes: a synthesis. Ecol. Appl. 16, 2064–2090. doi: 10.1890/1051-0761(2006)016[2064:dalawa]2.0.co;2
Sisson, G. M., Kellogg, M. L., Luckenbach, M. W., Lipcius, R. N., Colden, A. M., Cornwell, J. C., et al. (2011). Assessment of Oyster Reefs in Lynnhaven River as a Chesapeake Bay TDML Best Management Practice. Virginia Institute of Marine Science, Glouster Point, VA.
Smith, V. H. (2003). Eutrophication of freshwater and coastal marine ecosystems a global problem. Environ. Sci. Poll. Res. 10, 126–139. doi: 10.1065/espr2002.12.142
Smyth, A. R., Piehler, M. F., and Grabowski, J. H. (2015). Habitat context influences nitrogen removal by restored oyster reefs. J. Appl. Ecol. 52, 716–725. doi: 10.1111/1365-2664.12435
Smyth, A. R., Thompson, S. P., Siporin, K. N., Gardner, W. S., McCarthy, M. J., and Piehler, M. F. (2013). Assessing nitrogen dynamics throughout the estuarine landscape. Estuaries Coasts 36, 44–55. doi: 10.1007/s12237-012-9554-3
Valiela, I., Foreman, K., LaMontagne, M., Hersh, D., Costa, J., Peckol, P., et al. (1992). Couplings of watersheds and coastal waters: sources and consequences of nutrient enrichment in Waquoit Bay, Massachusetts. Estuaries 15, 443–457. doi: 10.2307/1352389
Valiela, I., McClelland, J., Hauxwell, J., Behr, P. J., Hersh, D., and Foreman, K. (1997). Macroalgal blooms in shallow estuaries: controls and ecophysiological and ecosystem consequences. Limnol. Oceanogr. 42, 1105–1118. doi: 10.4319/lo.1997.42.5_part_2.1105
Vitousek, P. M., Aber, J. D., Howarth, R. W., Likens, G. E., Matson, P. A., Schindler, D. W., et al. (1997). Human alteration of the global nitrogen cycle: sources and consequences. Ecol. Appl. 7, 737–750. doi: 10.1890/1051-0761(1997)007[0737:haotgn]2.0.co;2
Keywords: water quality, nitrogen cycle, habitat restoration, shellfish, sediment flux, ecosystem function, management trade-offs, TMDL
Citation: Humphries AT, Ayvazian SG, Carey JC, Hancock BT, Grabbert S, Cobb D, Strobel CJ and Fulweiler RW (2016) Directly Measured Denitrification Reveals Oyster Aquaculture and Restored Oyster Reefs Remove Nitrogen at Comparable High Rates. Front. Mar. Sci. 3:74. doi: 10.3389/fmars.2016.00074
Received: 14 October 2015; Accepted: 28 April 2016;
Published: 12 May 2016.
Edited by:
Jörg Wiedenmann, University of Southampton, UKReviewed by:
Rochelle Diane Seitz, Virginia Institute of Marine Science, USABenoit Thibodeau, University of Hong Kong, China
Copyright © 2016 Humphries, Ayvazian, Carey, Hancock, Grabbert, Cobb, Strobel and Fulweiler. This is an open-access article distributed under the terms of the Creative Commons Attribution License (CC BY). The use, distribution or reproduction in other forums is permitted, provided the original author(s) or licensor are credited and that the original publication in this journal is cited, in accordance with accepted academic practice. No use, distribution or reproduction is permitted which does not comply with these terms.
*Correspondence: Austin T. Humphries, humphries@uri.edu