
- 1Ecology Department, Earth Sciences Division, Lawrence Berkeley National Laboratory, Berkeley, CA, USA
- 2Climate Science Department, Earth Sciences Division, Lawrence Berkeley National Laboratory, Berkeley, CA, USA
Trait-based microbial models show clear promise as tools to represent the diversity and activity of microorganisms across ecosystem gradients. These models parameterize specific traits that determine the relative fitness of an “organism” in a given environment, and represent the complexity of biological systems across temporal and spatial scales. In this study we introduce a microbial community trait-based modeling framework (MicroTrait) focused on nitrification (MicroTrait-N) that represents the ammonia-oxidizing bacteria (AOB) and ammonia-oxidizing archaea (AOA) and nitrite-oxidizing bacteria (NOB) using traits related to enzyme kinetics and physiological properties. We used this model to predict nitrifier diversity, ammonia (NH3) oxidation rates, and nitrous oxide (N2O) production across pH, temperature, and substrate gradients. Predicted nitrifier diversity was predominantly determined by temperature and substrate availability, the latter was strongly influenced by pH. The model predicted that transient N2O production rates are maximized by a decoupling of the AOB and NOB communities, resulting in an accumulation and detoxification of nitrite to N2O by AOB. However, cumulative N2O production (over 6 month simulations) is maximized in a system where the relationship between AOB and NOB is maintained. When the reactions uncouple, the AOB become unstable and biomass declines rapidly, resulting in decreased NH3 oxidation and N2O production. We evaluated this model against site level chemical datasets from the interior of Alaska and accurately simulated NH3 oxidation rates and the relative ratio of AOA:AOB biomass. The predicted community structure and activity indicate (a) parameterization of a small number of traits may be sufficient to broadly characterize nitrifying community structure and (b) changing decadal trends in climate and edaphic conditions could impact nitrification rates in ways that are not captured by extant biogeochemical models.
Introduction
Understanding the interaction between ecology and biogeochemistry is an important frontier in environmental microbiology. Temporal separation between cellular activity and trace gas flux measurement has hampered efforts to connect, in field studies, the composition, structure, and activity of microbial communities to the biogeochemical processes they catalyze. Given the importance of prokaryotic diversity for ecosystem function (Kassen et al., 2000), a greater understanding of how microbial communities assemble, interact with the changing environment over time is clearly required.
The application of next generation sequencing technology is continually improving our understanding of the spatial and temporal distribution of microorganisms (Caporaso et al., 2012), while metabolomics and proteomics can help contextualize biological interactions with the environment and clarify relationships within and between microbial functional groups (Kujawinski, 2011; Schneider et al., 2012). In contrast, theoretical approaches in microbial ecology have lagged significantly behind these methodological developments (Prosser et al., 2007). Unlike macrofaunal ecology (Webb et al., 2010), mathematical relationships are not routinely applied to explore the implications behind experimental observations. The theoretical background to expand numerical approaches in environmental microbiology could well follow the trait-based approach implemented in models of marine autotrophic phytoplankton (Litchman and Klausmeier, 2008; Follows and Dutkiewicz, 2011). These models have been shown to be valuable tools for understanding how communities assemble (Follows et al., 2007; Litchman et al., 2007), how they change over time (Litchman and Klausmeier, 2006), and the interdependencies between community dynamics and biogeochemistry (Dutkiewicz et al., 2009).
In the current study we expand the trait-based approach to study a critical component of the nitrogen cycle, nitrification. Nitrification, the oxidation of ammonia to nitrite and then nitrate, is a rate-limiting step in the microbially mediated N cycle (Ward, 2008). Nitrification alters the distribution of inorganic N in soil and bridges the input of NH3 from N-fixation or organic matter (OM) decomposition to its loss as N2O or N2 gas via denitrification. In addition, nitrification is closely linked to the carbon cycle as nitrifier activity determines the relative concentration of two major plant and microbial nitrogen sources: ammonia and nitrate. The availability of these two nutrients in turn affects N mineralization rates, soil OM decomposition, denitrification, plant-productivity, and N-loss through leaching or gas efflux.
The initial step of nitrification (NH3 → NO2) is catalyzed by a phylogenetically restricted group of beta- and gammaproteobacteria (Kowalchuk and Stephen, 2001) and members of the thaumarchaea (Brochier-Armanet et al., 2008). The distribution and abundance of ammonia-oxidizing bacteria (AOB) and ammonia-oxidizing archaea (AOA) in soils and sediments show broad patterns related to substrate (i.e., NH3) concentration (Erguder et al., 2009; Wertz et al., 2011), pH (He et al., 2007); (Nicol et al., 2008), OM concentrations (Könneke et al., 2005), dissolved oxygen (Bouskill et al., 2012), and temperature (Avrahami and Bohannan, 2007; Tourna et al., 2008). In addition, while studies of the ecology and biogeochemical importance of the AOA are still nascent, certain ecological trends are evident, such as the ability to nitrify at low pH and grow under oligotrophic substrate concentrations (Erguder et al., 2009; Nicol et al., 2011).
The nitrite-oxidizing bacteria (NOB) belonging to five genera (Nitrobacter, Nitrospira, Nitrococcus, Nitrospina, and Nitrotoga) catalyze the second major step of nitrification (NO2 → NO3). Few NOB have been isolated from soil and the extent of ecophysiological kinetic data for NOB significantly lags that of AOB. Additionally, PCR primers targeting the functional gene involved in nitrite oxidation (nitrite oxidoreductase) have only recently become available (Vanparys et al., 2007), which has hindered studies of NOB ecology and environmental distribution. Spatial coupling of the two reactions (NH3 and NO2 oxidation) is well known (Okabe et al., 1999; Schramm et al., 1999) and reduces the likelihood that toxic NO2 will accumulate in soils. However, these two oxidative processes can, and often do, become spatially or temporally uncoupled by fluctuating redox or low NO2 concentrations selecting against NOB activity, resulting in NO2 accumulation. In the following section, we briefly introduce the concept of disaggregating microbial functional groups by specific traits and discuss previous attempts to apply these ideas to microbial ecosystems.
Trait-Based Microbial Models
Ecosystem activity is closely aligned to the structure and function of endemic microbial communities. These communities catalyze the bulk of biogeochemical reactions related to OM decomposition and nutrient transformations. Although the majority of ecosystem models acknowledge the contribution of prokaryotes in determining the rate of C and N cycling, these models have mainly focused their mechanistic representation on the role physical processes play in regulating biogeochemical cycles. Microbial transformations are often implicitly represented (e.g., Manzoni and Porporato, 2009, and references therein; Parton et al., 1987; Jenkinson and Coleman, 2008) using a specified turnover time for various pools of soil OM (e.g., slow, intermediate, and fast turnover pools). To our knowledge, no modeling frameworks applied at regional or larger scales attempt to represent how the dynamic nature of microbial diversity and activity affects biogeochemical cycling of C, N, or other compounds.
A deterrent to the explicit representation of microbial community dynamics is a lack of understanding of how microbial communities assemble and respond to changing environmental conditions. Microbial communities are extraordinarily diverse, with thousands of different taxa seemingly inhabiting the same environment (Gans et al., 2005; Delong et al., 2006). This diversity can be attributed to a small subset of microorganisms being selected for by the prevailing environmental conditions (Hutchinson, 1961). Selection can be due to a combination of genomic and physiological traits that elevate the fitness of some organisms over their competitors. Therefore, functional diversity is a transient ecosystem property, and as environmental conditions change over time so can microbially mediated reaction rates (e.g., Carney et al., 2007). These changes can have important implications for ecosystem model structure and parameterization.
Trait-based modeling approaches have been reviewed elsewhere (McGill et al., 2006; Green et al., 2008; Webb et al., 2010) and previously applied in ecology (Laughlin, 2011). In microbiology, these models have been used to depict communities of functionally important groups (Allison, 2012) and address questions that field and laboratory experiments are unable to sufficiently answer (Monteiro et al., 2011). These trait-based approaches have attempted to numerically characterize key physiological parameters that contribute toward an ecological strategy.
Nitrifiers are ideal candidates for building and refining trait-based models. They are autotrophic with a simple metabolism largely defined by central physiological processes, such as substrate acquisition (NH3 and NO2) and substrate use efficiency (number of moles of substrate required to fix one mole of CO2). Several decades of ecophysiological studies using different nitrifiers have produced a wealth of data that can be used to mathematically characterize different nitrifier guilds. While heterotrophic organisms can also carry out nitrification (Schimel et al., 1984), at the present time, too little is understood about the distribution, importance and physiology of these organisms (De Boer and Kowalchuk, 2001). Therefore, in this manuscript we describe the development of a microbial community trait-based modeling framework (MicroTrait) to simulate the physiology and ecology of autotrophic nitrifiers (MicroTrait-N), including an explicit representation of the rates of NH3 and NO2 oxidation, N2O production, and nitrogen pool transformations. We apply MicroTrait-N to examine predicted patterns in nitrifier community diversity and activity across several geochemical gradients.
Materials and Methods
Emergent Community Ecosystem Model Description (MicroTrait-N)
MicroTrait-N resolves intra-functional group diversity of the nitrifier populations (AOB, AOA, NOB) by parameterizing multiple guilds spanning a range in the trait-space (Figure 1). Although this nitrifier model will be integrated in an ecosystem model that allows for a wide range of interactions (Tang et al., submitted), we focus here on resolving nitrifier diversity in a competitive environment across a range of conditions, including pH, O2, substrate type (NH3 or urea), and temperature. Our approach is general enough that it can be applied to nitrifier populations in freshwater and aquatic environments and flexible enough to be used within soil pores. The model is written in Matlab (Matlab R2011b, Natick, MA, USA).
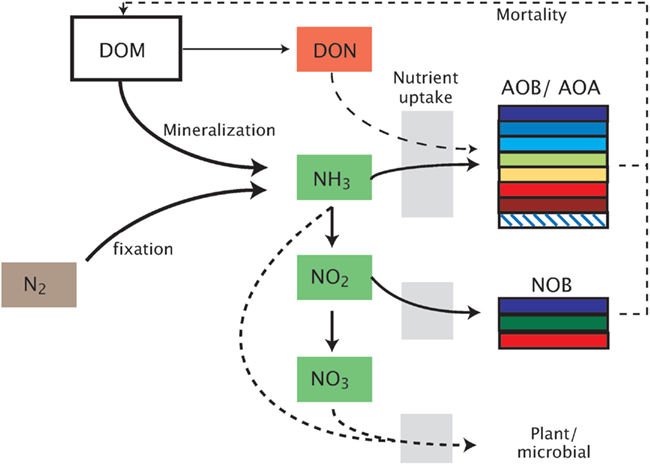
Figure 1. Schematic representation of the model. Model abbreviations. DOM, dissolved organic matter; DON, dissolved organic nitrogen; AOB/AOA, ammonia-oxidizing bacteria/archaea; NOB, nitrite-oxidizing bacteria.
Our guild approach simulates seven lineages of Betaproteobacterial AOB as individual guilds, three NOB guilds, and one AOA guild. The smaller number of NOB and AOA guilds reflects the lack of relevant ecophysiological studies of these groups. Intra-guild diversity is parameterized by allowing a range of values for each trait (Table 1), based on previous ecophysiology studies (Loveless and Painter, 1968; Suzuki, 1974; Suzuki et al., 1974; Drozd, 1976; Belser, 1979; Belser and Schmidt, 1979; Glover, 1985; Keen and Prosser, 1987; Prosser, 1989; Nishio and Fujimoto, 1990; Verhagen and Laanbroek, 1991; Laanbroek and Gerards, 1993; Jiang and Bakken, 1999; Schramm et al., 1999; Gieseke et al., 2001; Koops and Pommerening Röser, 2001; Cébron et al., 2003; Martens-Habbena et al., 2009; Schreiber et al., 2009). Further information concerning the derivation of trait values is given in the supplemental material. Given the paucity of within-guild information, we assumed a uniform probability density of trait values across each trait range. We can increase the number of guilds as more information becomes available to distinguish intra-guild diversity. We performed several types of simulations investigating the role of pH, temperature, decoupling nitrite, and ammonia oxidation, and pulsed NH3 inputs, by: (1) using the mean value of each trait; (2) performing Monte Carlo (MC) simulations to account for intra-guild diversity; and (3) running the model in equilibrium and dynamic steady state cycle modes to characterize the impact of temporal forcing variation on predicted emergent microbial community structure.
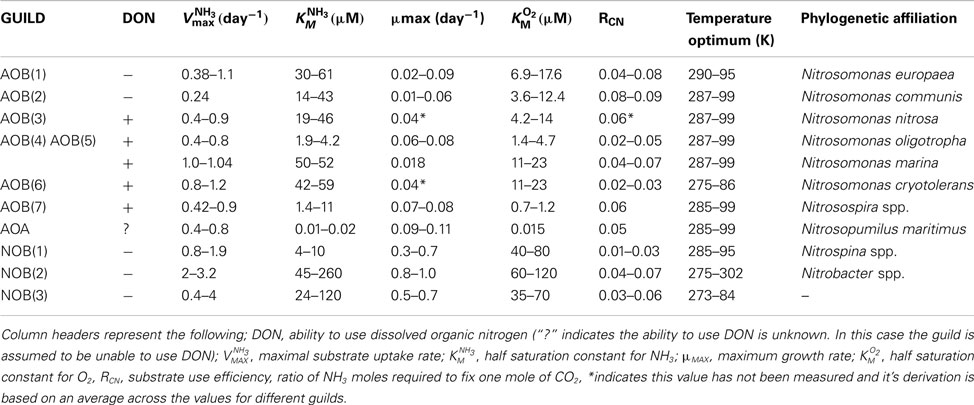
Table 1. Trait values across the different guilds.
Representing Autotrophy
In the model, the biomass of each nitrifier guild is represented with five variables: (1) total cell biomass (denoted BT, which may represent the ammonia-oxidizing organism (AOO, i.e., AOB + AOA) as BTA or the NOB, BTN); (2) carbon biomass (BC); (3) nitrogen biomass (BN); (4) Cellular quotas for carbon (QC); and (5) cellular quotas for nitrogen (QN). The latter two are defined relative to total biomass (i.e., QC = BC/BT; QN = BN/BT). Carbon biomass increases by fixing CO2 through the ribulose-bisphosphate enzyme using energy produced during the oxidation of either NH3 or NO2 (Figure 1). Cell division of the AOO and NOB is governed by Droop kinetics (Droop, 1973):
where represents the biomass quota (i.e., QC or QN) of the ith guild for the jth element. Here j represents either C or N. The minimum quota for carbon is 1 and for nitrogen is 1/13.2 (according to the Redfield Ratio). The carbon and nitrogen constraints are then applied to regulate the cell division rate (DB) with Liebig’s law of the minimum (van der Ploeg, 1999):
where is the nitrifier maximum specific growth rate (Table 1). Ammonia oxidation in AOO is modeled with Briggs–Haldane kinetics (Koper et al., 2010):
Here, is the maximum substrate (NH3) uptake rate, KM is the half saturation constant for NH3 or O2 (μM; Table 1), and is the NH3 inhibition constant for AOB (μM; Table 1). Substrate concentrations are in M (mol L−1). CO2 uptake follows Michaelis–Menten kinetics:
where is guild-specific and depends on energy yielded by ammonia oxidation and the efficiency of CO2 fixed relative to NH3 oxidized:
where (unitless) is the guild-specific substrate use efficiency (number of moles of NH3 oxidized per mole of CO2 fixed, Table 1) and represents the C:N ratio (i.e., the Redfield ratio; Redfield, 1958) of each nitrifier guild and and , which are use to reflect the autotrophic nature of the nitrifiers.
Growth of the ith AOB biomass over time is calculated as:
Here, Δ (s−1) is the first order microbial mortality rate and DA is biomass loss (M s−1) attributable to the detoxification of NO2 following the uncoupling of AOB and NOB mediated reactions (see below). Total biomass loss is the sum of that required to convert NO2 → NO and NO → N2O, and the 1/4 represents the stoichiometric relationship between biomass and NO2 detoxification (i.e., 4NO2 + CH2O → 4NO + CO2 + 3H2O; 8NO + 2CH2O → 4N2O + 2CO2 + 2H2O).
The NOB gains energy to fix CO2 to biomass via the oxidation of NO2 → NO3. NO2 uptake rate is modeled by:
where the different terms in Eq. 7 are analogous to those in Eq. 3. The uptake of CO2 occurs via the same pathway as for AOO (Eqs 4 and 5) and the biomass of the ith NOB guild varies as:
Nitrous Oxide Production
N2O is produced by AOO via two distinct pathways: (1) decomposition of the hydroxylamine intermediate and (2) the likely more significant mechanism of NO2 detoxification (Figure A1 in Appendix; Frame and Casciotti, 2010; Kool et al., 2011; Stein and Klotz, 2011). Under the first pathway, N2O production is modeled as a linearly related fraction of hydroxylamine decomposition (Frame and Casciotti, 2010). The second pathway simulates the detoxification of accumulated NO2 as the two steps of nitrification become uncoupled. This decoupling can occur because NOB have a lower affinity for O2 than the AOB; therefore as O2 is consumed during nitrification (or in low O2 environments), the two reactions may become spatially or temporally uncoupled. NO2 toxicity stimulates a detoxification pathway converting NO2 to N2O via NO. This detoxification pathway is potentially the more significant mechanism by which AOB produce N2O. AOA have recently been shown to produce N2O (Santoro et al., 2011), although the mechanism has not yet been elucidated. Therefore, in the present version of the model we predict AOA N2O production using the same relationships as for AOB.
As NO2 concentrations become toxic to AOO, their growth and NH3 uptake decline. We represent these transitions by modifying an organism’s affinity for NH3 as a function of NO2, NO, and O2 concentrations:
where is the base NH3 affinity, is the affinity constant for NO2 or NO during detoxification, and [C] represents the concentration (M) of either NO2 or NO. Energy for detoxification is assumed to come from the degradation of microbial biomass resulting in the output of CO2.
Nutrient Pool Transformations
The dynamic aqueous NH3 concentration ([NH3] (M) depends on a balance between losses from oxidation uptake into biomass of AOO and NOB and inputs resulting from biomass breakdown during detoxification summed across the total number of AOO guilds (nA) and NOB guilds (nN):
where the 1/4 represents the stoichiometry of the detoxification reaction using biomass for energy. The dynamic NO2 concentration depends on uptake by NOB to generate energy and losses via detoxification by AOB:
Model Evaluation
Resolution of nitrifier diversity across geochemical gradients
We tested MicroTrait-N by examining how nitrifier diversity varies across geochemical gradients in pH, substrate concentration [i.e., (NH3)], and temperature and compared predictions of this diversity against published studies. Accuracy of modeled communities was gaged by relating the steady state modeled nitrifier diversity to its likely phylogeny based on literature sources of the derived trait values. In addition, an evenness statistic (Ji) is ascribed to each community;
where represents the relative proportion of the ith species, and S is the species richness (Mulder et al., 2008). The evenness statistic varies between 0 and 1, with 1 indicating an equal contribution of each guild to the total biomass. The model also predicts rates of NH3 oxidation and N2O production that we report as 30 days running averages.
Physicochemical impacts on nitrifier diversity and activity
We applied a step-wise approach to analyze the impacts of geochemical variables, temporal dynamics of substrate inputs, and combinations of these variables on nitrifier diversity and activity. The five groups of modeling scenarios include sensitivity analyses of the impacts of (i) pH; (ii) temperature; (iii) decoupling during NO2 detoxification; and (iv) dynamic substrate inputs. For the fifth modeling scenario, (v) we computed predicted community structure with a limited set of available observations.
pH impacts. pH is a determinant of nitrifier diversity, in part, due to its regulation of NH3 concentrations. The NH4:NH3 ratio increases as pH decreases (Li et al., 2012), possibly selecting for nitrifiers adapted to low substrate concentrations. We performed model simulations across pH gradients spanning neutral to slightly acidic conditions (7.8–4.5). For each guild, the model was run with an integration time of 6 months, which allowed the community biomass to come to a steady state. Simulations were initialized with 1 × 10⁻⁵ M NH3 and non-limiting concentrations of O2 and CO2 (both 1 M × 10−3 M). Two further substrate pulses (of 1 × 10⁻⁶ NH3) following 2 and 4 months were necessary to prevent the communities becoming substrate limited and maintain them at steady state.
Temperature impacts. Temperature has also been shown to play an important role in determining the diversity of ammonia-oxidizing communities in terrestrial and aquatic ecosystems (Erguder et al., 2009; Prosser, 2011). We applied in the model a temperature-activity relationship based on previously published data (Ratkowsky et al., 2005; Follows et al., 2007) that accounts for a different temperature optima across the guilds (Table 1). We simulated a temperature range of 5 to 30°C in 5°C increments under initial conditions of NH3 = 5 × 10⁻⁵ M and pH = 7.8.
Decoupling nitrification reactions. We simulated the forced reduction of NO2 to N2O during AOO detoxification by initializing the model to steady state over 6 months under initial conditions of 1 × 10⁻⁵ M NH3, pH = 7.8 and temperature = 20°C. At steady state, the NOB activity was turned off and then simulations were run for a further 6 months. A simultaneous control experiment extended the steady state for a further 6 months maintaining NOB activity.
Pulsed substrate inputs. NH3 availability is considered to be a major determinant of AOO diversity (Bouskill et al., 2011; Prosser, 2011) and the rate of N2O efflux (Elberling et al., 2010). Nitrifiers show wide physiological breadth with respect to enzyme kinetics (Vmax and Km) and different communities dominate based on the magnitude of substrate inputs (Mahmood et al., 2006). We tested the impact of NH3 availability by simulating community diversity and activity in response to pulsed NH3 input events. Under a constant pH (7.8) and temperature (25°C), NH3 was initially input at a concentration of 1 × 10⁻⁶ M and increased on 2-month cycles to 5 × 10⁻⁵ M.
Comparisons with observed data. We tested the baseline MicroTrait-N predictions by comparing against published data from five Alaskan ecosystems (Petersen et al., 2012). That dataset combines nitrification rate measurements with a quantification of the different nitrifier groups (AOB and AOA) facilitating a direct comparison with the output of our model. Petersen et al. (2012) also report a comprehensive list of chemical data, which satisfy the input requirements of the simulation’s initial conditions. Furthermore, in contrast to our earlier simulations evaluating community composition at a fixed substrate concentration and low pH (down to 4.5), this dataset represents low pH soils (4.8–4.3) with high substrate concentrations. For these simulations initial conditions are given in Table A1 in Appendix with temperature = 15°C and simulations were run for 6 months. The model was initialized with mean trait values and then simulations were replicated using the MC approach and five analogs per guild (with each analog representing a stochastically chosen set of trait values across the uniform probability distribution. For comparison, data from two of the sites are replicated using an MC code with a normal distribution. Using the normalized distribution of traits produces little effect on the model output. See appendix).
Results
Physicochemical Impacts on Nitrifier Diversity and Activity
In this subsection we describe results from our modeling scenarios and comparison of predicted data with observations.
pH impacts
We simulated a pH gradient from approximately neutral (pH = 7.8) to acidic (pH = 4.5) conditions and recorded diversity and activity (NH3 oxidation rate and N2O production). During the hydrolysis reaction of NH3, the ratio NH4:NH3 increased hyperbolically as pH decreased. Thus, at pH < 5, the extremely low [NH3] encouraged the growth of oligotrophic ammonia oxidizers. Both baseline (i.e., fixed trait values, Figures 2A,B) and MC (Figures 2C,D) approaches showed a decline in AOB community evenness with decreasing pH. The highest evenness values are predicted around neutral values where AOB guilds 7 [AOB(7)] and 4 [AOB(4)] dominate. As pH decreases, community diversity declines until the AOA guild dominates. Although both simulations had similar trends in diversity, the multiple analog experiments (Figures 2C,D) predicted more variability in community diversity, as evidenced by more variable evenness values. Predicted nitrifier activity (as indicated by NH3 oxidation rates and N2O production) also declined with decreasing pH from a maximum NH3 oxidation rate of 1.9 M N day−1 to less than 0.1 M N day−1. Predicted N2O production was linearly related to NH3 oxidation (data not shown, r = 0.98, p = 0.001, slope = 0.94) indicating the AOB and NOB reactions were coupled regardless of the pH and N2O was primarily by hydroxylamine decomposition.
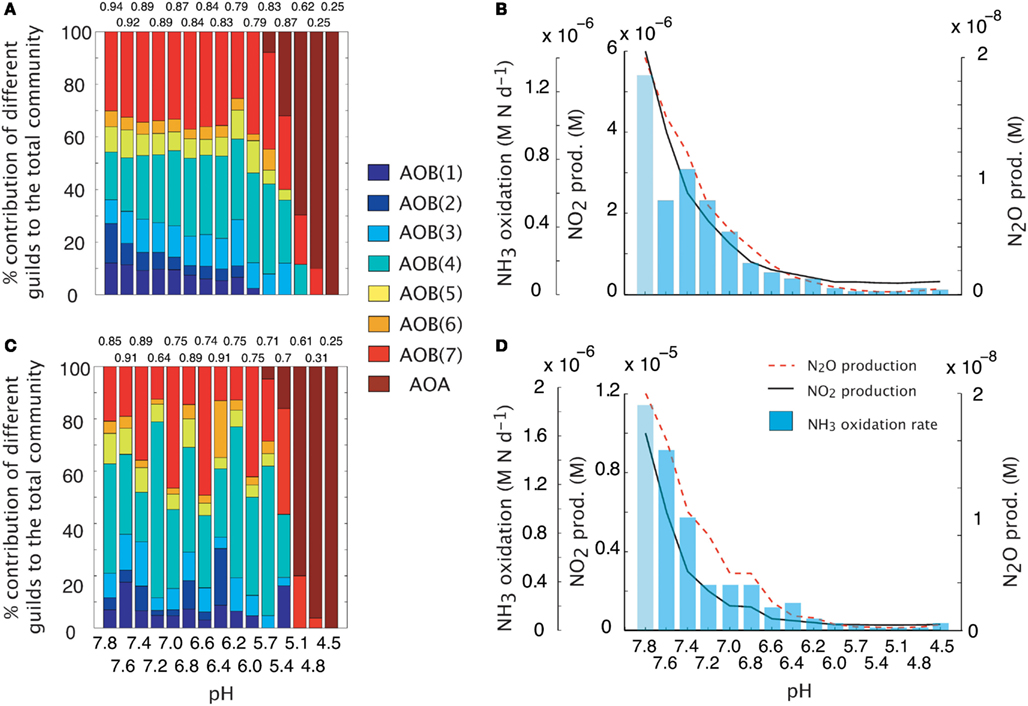
Figure 2. Simulations of AOO diversity and activity across a pH gradient. Community evenness values are given above the stacked bars. (A) Community diversity (proportion of total biomass) predictions using mean trait values. (B) Simulated nitrifier activity (NH3 oxidation, NO2 production, N2O production) using mean trait values. (C) Community diversity (proportion of total biomass) predictions using Monte Carlo simulations of multiple AOO analogs (n = 5 analogs per guild). (D) Simulated nitrifier activity (NH3 oxidation, NO2 production, N2O production) using Monte Carlo simulations of multiple AOB analogs (n = 5 analogs per guild).
Temperature impacts
Maximal rates of ammonia oxidation were simulated at 25°C (Figure 3B). Maximal oxidation rates coincided with the highest community evenness. At low temperature, AOO communities were dominated by the cold-adapted AOB(6) guild (Table 1, Figure 3A), which represents Nitrosmonas cryotolerans. The AOA guild was also important at this temperature (Figure 3A). With increasing temperatures up to 25°C, the AOB(3) and AOB(7) guilds became more competitive and began to dominate the community. When the temperature reached 30°C, the AOB(1) guild dominated. N2O production mirrored that of NH3 oxidation indicating that N2O production resulted from hydroxylamine decomposition under these conditions.
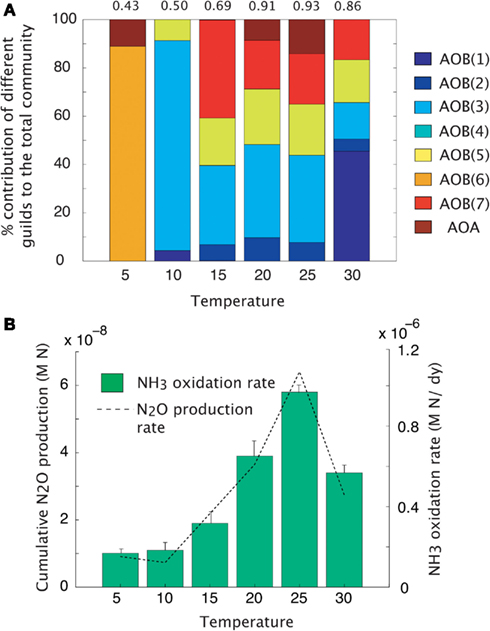
Figure 3. Mean trait-value AOO community diversity and activity across a temperature gradient. (A) Stacked bar chart depicts community diversity as a proportional contribution to the total community biomass. The evenness value is given above the plot. (B) Rates of NH3 oxidation (bar chart) and gross N2O production (line graph). Error bars are the result of multiple simulations (n = 3).
Decoupling nitrification reactions
We simulated N2O production through two pathways described above (Figure A1 in Appendix). After running the simulations to steady state biomass, the NOB were removed allowing rapid accumulation of NO2 and invoking a detoxification response in the AOO. NO2 was rapidly converted to N2O, via NO, using cellular biomass as an energy source. This conversion resulted in a transient N2O production rate significantly higher than in the scenarios with a steady state community and when the NOB were present (ANOVA, p < 0.05; Figure 4A). Despite a higher N2O production rate in the absence of NOB, cumulative production of N2O over 6 months was significantly (ANOVA, p < 0.05) lower than when NOB were present (Figure 4B) due to the creation of an unstable half reaction (lacking NO2 oxidation) resulting in a rapid crash in AOO community biomass (data not shown).
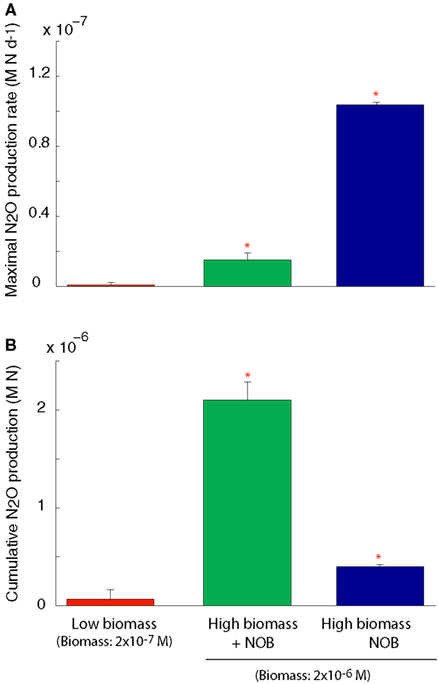
Figure 4. N2O production under a coupled AOB-NOB nitrification reaction and also as the AOB-NOB reaction becomes uncoupled and the detoxification reaction is activated. (A) Maximal rate of N2O production (B) Cumulative N2O production over the 6-month simulation. Error bars are the result of three simulations per temperature.
Pulsed substrate input
We simulated the response of our imposed simple community (seven AOB guilds; one AOA guild; and three NOB guilds) to pulsed input of substrate over a 9-month period (Figure 5). Over time, and with evenly spaced pulsed events, the evenness of the community declines slightly from 0.76 to 0.58 as one guild, AOB(7), begins to dominate. Pulses of NH3 are drawn down more quickly as the biomass of AOB increases. However, the second pulse of NH3 results in its most rapid drawdown due to a high cumulative biomass and greater diversity of AOO (Figures 5A,B). As NOB biomass increases, NO2 demand increases, and the NO2 is oxidized as rapidly as it is produced (Figure 5C). In the present simulation we did not allow for diffusion, and this resulted in an accumulation of N2O (Figure 5D), nevertheless, the rate at which it is produced reflects the pulses of NH3 into the system. The initial pulse elevates NH3 concentrations from 1 × 10⁻⁷ to 5 × 10⁻⁶ and results in a five-fold increase in the biomass of AOB(7), a four-fold increase in AOB(5), and a small response in AOB(1). As NH3 is drawn down to lower concentrations (<1 × 10⁻⁶ M) AOA briefly become the dominant nitrifiers. While AOA biomass peak when substrate concentrations are low, they are inhibited by subsequent substrate pulses.
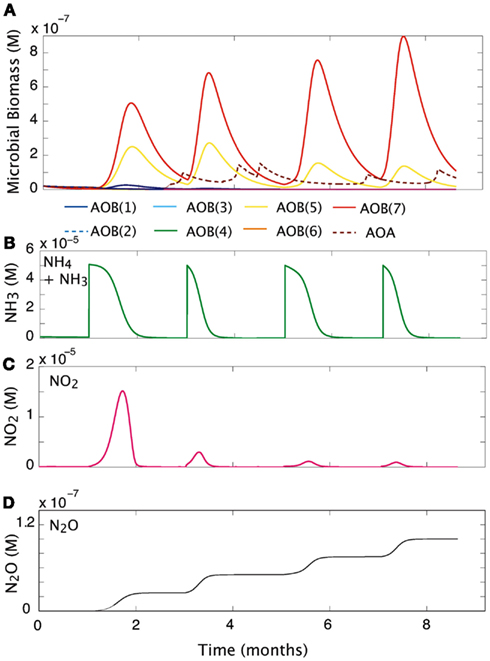
Figure 5. Community response to pulsed substrate input. (A) Changes in AOO biomass over time. (B) Substrate concentration (M). (C) Nitrite dynamics over time. (D) Production of N2O over time.
Comparison with environmental data
The dataset presented by Petersen et al. (2012) examined AOO community diversity across five-plant community types characteristic of the interior of Alaska. These soils were characterized by high substrate concentrations (range = 7.3 × 10⁻³ to 0.1 M NH3) and low pH (4.3–4.8). These observations therefore provide a comparison to our earlier examination of a pH gradient with a fixed substrate concentration. The model predicted that, in contrast to our previous predictions at low pH and NH3 substrate levels (Figure 2), bacteria dominated the AOO community at these sites (Figure 6A). Using mean values for traits, the Black Spruce and Bog Birch sites were dominated by AOB(7) and AOB(3) in the case of the Bog Birch site. The Tussock Grassland, Emergent Fen, and Rich Fen also showed lower evenness and were generally dominated by one guild [AOB(1)] accounting for approximately 90% of the total AOB biomass. The AOA guild was never a significant component of the community diversity under these conditions (data not shown). Within-guild diversity was represented using MC simulations that stochastically assigned traits to multiple analogs of each guild. The community composition that emerged when using this approach was different than when traits were represented by their mean values. For example, the AOA became more prominent in the MC simulations, although they were still only a relatively small proportion (2–4%) of the Fen communities and Tussock grassland (Figure 6A).
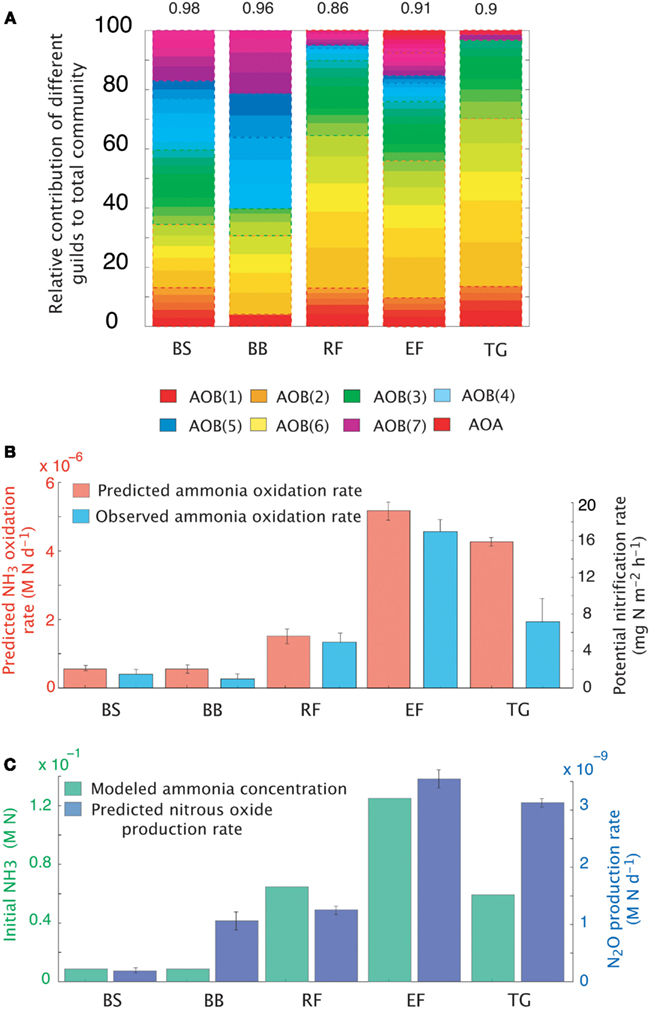
Figure 6. Simulations of the activity and diversity of AOB communities in high-latitude ecosystems. (A) Monte Carlo simulations of multiple AOB analogs (n = 5 analogs per guild) across the different sites. Each guild is represented by a distinct color. Subtle differences in the shade of that color demarcate the different analogs/guild. A box outlines the boundaries of each guild’s biomass. Evenness statistic given above the bar plots. (B) NH3 oxidation rates from just simulated and observed data. (C) Predicted rates of N2O production and measured NH3 concentrations. Error bars are the result of multiple simulations (n = 3). BS, Black Spruce; BB, Bog Birch; RF, Rich Fen; EF, Emergent Fen; TG, Tussock Grassland.
Predicted trends in NH3 oxidation rates (Figure 6B) correlated with the observed data (Figure 6B; r = 0.96, p = 0.007). The highest oxidation rates were associated with the highest NH3 concentrations at the Emergent Fen site (4.9 × 10⁻⁴ M N day−1) and with the lowest rates at the Black Spruce and Bog Birch sites (9 × 10⁻⁵ and 9 × 10⁻⁶ M N day−1 respectively). MicroTrait-N predictions of N2O production also correlated with NH3 concentrations and oxidation rates (Figure 6C), albeit not significantly (r = 0.69, p = 0.19), and were 85 times higher at the Emergent Fen site (3.6 × 10⁻⁶ M N day−1) than the Black Spruce (4.3 × 10⁻⁸ M N day−1).
Discussion
Oxidation of NH3 to NO3 is an important process that couples N-inputs and losses via denitrification and influences the availability of N in terrestrial and marine environments (Ward, 2008; Prosser, 2011) with important implications for carbon cycling (Doney et al., 2007). A better understanding of the ecological factors that determine the activity and diversity of the chemoautotrophic nitrifiers will therefore improve our understanding of N-transformations and N-emissions. To that end we describe here a model simulating nitrifier community development as a function of environmental conditions, allowing both community diversity and the rate of nitrification to change across environmental gradients.
Guild Characterization
MicroTrait-N simulates nitrifier diversity using a guild model loosely based on phylogenetic affiliations (Koops and Pommerening Röser, 2001), with differences in key ecophysiological characteristics (e.g., DON usage, KM values). Several of the results across gradients showed plausible representation of the dominant nitrifiers guilds emerging on the basis of environmental conditions (discussed below). Our guild characterization recognizes several guilds of the Nitrosomonas [AOB(1-6)], one guild of the Nitrosospira [AOB(7)] and the AOA, and three guilds of the NOB. The guilds resolve broadly into oligotrophic and copiotrophic groups (Kassen et al., 2000; Lauro et al., 2009). For example, the AOB(5) and AOB(7) guilds have copiotrophic-like characteristics, responding rapidly to substrate pulses (Figure 5A), while the AOA guild is only competitive as substrate is either drawn down to concentrations ≤1 μM (Figure 5A) or when pH reduces NH3 availability (Figure 2).
The MicroTrait-N model structure is currently weighted in favor of guilds with cultured members and likely under-represents the importance of the AOA. The AOA are known to be in high abundance in both oceanic (Bouskill et al., 2012) and terrestrial (Leininger et al., 2006) environments. However, while it is likely that marine AOA are chemoautotrophic organisms and play an important role in marine nitrification, AOA possibly span a more complicated functional space in terrestrial systems. Attempts to draw correlations between the abundance of terrestrial AOA and NH3 oxidation rates have produced mixed results (Di et al., 2009); (Jia and Conrad, 2009). In MicroTrait-N, parameterization of AOA kinetics is extrapolated from a few published cultures (Martens-Habbena et al., 2009; Lehtovirta-Morley et al., 2011). The model consequentially represents the AOA as oligotrophs, dominating nitrifying conditions under low NH3 concentrations, and becoming outcompeted or possibly inhibited under higher NH3. The AOA:AOB relationship provides some support for the idea that AOA are oligotrophic, with ratios increasing as substrate concentrations decrease (Mosier and Francis, 2008; Bouskill et al., 2012), while AOA have generally been reported in low abundance within engineered systems of high NH3 concentrations (Wells et al., 2009). However, the AOA are also abundant in terrestrial ecosystems with high NH3 concentrations (Verhamme et al., 2011). This diversity might suggest that the physiological breadth of the AOA has yet to be fully uncovered, and that the notion of the AOA as oligotrophic K-strategists might be challenged through isolation of organisms from high NH3 environments. On the other hand, several studies have demonstrated metabolic diversity of the terrestrial AOA (i.e., mixotrophy; Mußmann et al., 2011), and have proposed that although the abundance of the AOA is high, their contribution to ammonia oxidation is perhaps minimal. Currently, MicroTrait-N is only capable of representing organisms growing autotrophically, and does not represent the abundance of organisms with alternative metabolisms. Therefore, if an appreciable proportion of the AOA community at neutral pH is not actively oxidizing ammonia, they will not be predicted in the current model structure. Further studies into the physiology of the AOA will likely yield data that should help to constrain the models.
Geochemical Gradient Simulations
MicroTrait-N attempts to predict trends in community diversity across gradients in substrate concentration, pH, and temperature.
pH impacts
Few studies offer an experimental analog to the simulations presented here, however, Nicol et al. (2008) examined AOA and AOB dynamics along a pH gradient (7.5–4.9) in an agricultural soil. The results of that study did not necessarily support predictions from our simulations (e.g., the AOA were observed to be the numerically dominant nitrifiers across neutral to acidic conditions), however several similarities occurred. Quantification of transcript abundance found the AOA:AOB ratio decreased with increasing pH, suggesting that the relative importance of the AOB to ammonia oxidation increases with increasing pH. Furthermore, Nicol et al. (2008) also noted the taxonomic diversity of AOB to decrease with decreasing pH. This relationship was mainly attributable to the loss of most of the Nitrosomonas species and several of the Nitrosospira clusters. Additionally, at pH ≤ 5.0 the Nitrosospira were the dominant bacterial nitrifying group. Our simulations reproduced some of these observations, including a drop in bacterial diversity and an increasing prominence of the AOB(7) guild (for which kinetic parameters were derived from the Nitrosospira) with decreasing pH.
The dominance of the AOA guild at low pH is supported by several studies (Nicol et al., 2008; Gubry-Rangin et al., 2010). However, there is also evidence of the AOA dominating nitrifier groups across a range of pH (from 8.7 to 3.5; Gubry-Rangin et al., 2011). It is not clear if this dominance is due to a physiological adaptation to low pH or to substrate availability. Nitrification rates have previously been shown to be high at low pH where rates of mineralization (and hence substrate availability) are high (Booth et al., 2005), however, (Gubry-Rangin et al., 2011) did not explicitly measure substrate concentrations in their study.
Temperature impacts
MicroTrait-N also simulates the relationship between temperature and the kinetics of the ammonia-monoxygenase enzyme, which purportedly has a stronger effect on the ammonia oxidation rate than substrate availability (Groeneweg et al., 1994). The MicroTrait-N relationship between temperature and activity (ammonia oxidation) was based on a previously published square-root relationship for the growth rate of bacteria (Ratkowsky et al., 1983, 2005). In the present model, nitrifier diversity and activity was highest at 25°C while the rate of N2O production tracked the rate of ammonia oxidation. Several laboratory and field experiments have recorded a significant positive relationship between temperature and the activity of nitrifiers (Stark, 1996; Jiang and Bakken, 1999; Avrahami and Bohannan, 2007; Bouskill et al., 2011) with a few studies noting that the relationship continues up to and above 30°C (Stark and Firestone, 1996). Understanding the relationship between temperature and nitrification is crucial to predicting future N2O effluxes (Avrahami and Bohannan, 2009) and future simulations should account for complex interactions between temperature, substrate, and soil moisture, all of which play a significant role in N2O fluxes (Avrahami and Bohannan, 2009).
Decoupling nitrification reactions
N2O is a long-lived greenhouse gas and stratospheric ozone depleting substance (Bange, 2008). The atmospheric mixing ratio of N2O has increased 20% since 1750 (MacFarling Meure et al., 2006) with terrestrial ecosystems the principle sources of N2O emissions (Pérez et al., 2001). The annual contribution of nitrification to the global N2O budget is currently unknown, however, in previous models the ratio of N2O formed to NH3 oxidized is generally about 0.1% (Frame and Casciotti, 2010). This relationship does not account for differences in the pathways of N2O production via nitrification (Frame and Casciotti, 2010).
In the current model, we simulated N2O production via NO2 detoxification and hydroxylamine decomposition. The maximal rate of N2O production was recorded under NO2 detoxification, and was approximately 150 times higher than it had been directly before NOB removal and seven times higher than the N2O production rate when NO2 did not accumulate (i.e., NOB were present and N2O was produced by hydroxylamine decomposition). This result might suggest that NO2 detoxification substantially increased N2O production by ammonia oxidizers upon uncoupling of the nitrification reactions. However, the toxic effect of NO2 reduces AOO biomass to the point where the populations crash and NH3 oxidation declines. This biomass change is reflected in the cumulative N2O production data over the 6 month simulation, which is approximately 5 times lower than that formed during full nitrification (i.e., hydroxylamine decomposition).
These model predictions are supported by previous experimental work. For example, Graham et al. (2007) observed evidence of chaotic instability in the AOB-NOB relationship resulting in significant accumulation of NO2 in a chemostat experiment. Furthermore, Frame and Casciotti (2010) examined pathways of N2O production in the marine ammonia oxidizer, Nitrosomonas marina. They found that the presence of excess NO2 in the growth medium increased N2O yields by an average of 70–87%, while stable isotope and 15N-site preference measurements determined that nitrifier-denitrification (analogous to our detoxification pathway) was responsible for the majority of N2O production at low oxygen (Frame and Casciotti, 2010).
Comparison with environmental data
We also tested our model against site-collected data from a recent study in a high-latitude site (Petersen et al., 2012). Petersen et al. (2012) sampled five-plant communities characteristic of interior Alaska, and measured the abundance of functional genes affiliated with nitrification (i.e., bacterial and archaeal ammonia monooxygenase) and potential nitrification rates. The sites were characterized by high ammonium concentrations (0.2–2.9 g m−2) and low pH (4.8–4.3). These sites therefore present a contrast to the earlier pH gradient analysis under a lower substrate concentration. In our pH gradient simulation the AOA dominated the low pH possibly due to low substrate availability. Conversely, at higher substrate concentrations Petersen et al. (2012) found AOB to be the dominant nitrifier in these Alaskan soil plots and the AOB amoA gene abundance best explained observed nitrification rates. The AOA were only minor components of the AOO communities. Recreating the initial conditions from data collected in Alaska (Carney et al., 2007; Petersen et al., 2012), we resolved plausible trends in both relative community composition (i.e., AOB biomass was higher than that of the AOA) and NH3 oxidation rates. Predicted NH3 oxidation rates correlated with NH3 concentrations. That the AOB dominated these communities over the AOA supports the earlier data suggesting AOO community composition is largely determined by substrate concentrations. N2O production generally tracked NH3 oxidation, indicating that N2O was predominantly produced via hydroxylamine decomposition. The exception was at the Bog Birch site where predicted N2O production was higher than a rate consistent with hydroxylamine decomposition. This result is significant given predictions of higher N2O production in high-latitude ecosystems dependent on N-availability (Elberling et al., 2010) and further work is warranted to understand these MicroTrait-N predictions.
In addition to replicating field studies, a major objective of any modeling approach is to test existing hypotheses. For example, our mechanistic model may be used to test existing ecological theory of the controls on ecosystem processes (in this case nitrification). At the present time, two competing hypotheses describe the relationship between community structure and ecosystem processes: The “diversity” hypothesis and the “mass-ratio” hypothesis (Grime, 1998; Green et al., 2008; Laughlin, 2011).
The “diversity hypothesis” postulates that the richness of functional groups determines the rate of ecosystem processes by a complementary association between different functional groups (e.g., Tilman et al., 1996; Laughlin, 2011). On the other hand, the “mass-ratio” hypothesis proposes that ecosystem processes are controlled by the relative abundance of different functional groups.
Our results show that these two hypotheses are both valid but at different stages of the evolving nitrifier ecosystem. Organisms achieving maximal fitness under the initial conditions can rapidly increase their biomass to dominate the nitrification process. Other guilds decline sometimes to extinction. These dynamics seemingly lend support to the “mass-ratio” hypothesis. However, as conditions change (i.e., as substrate concentrations fall), the diversity of the community becomes more important, as guilds more suited to the new conditions become numerically prominent and dominate nitrification. At the present time, we are unaware of any field studies in microbial ecology that exclusively test these theories in situ. The functional diversity of microbial communities, and redundancy in those communities, in addition to limitations in current methods limitations, make it difficult to attribute activity to specific groups. These limitations might be overcome in future through continued development of isotope labeling and spectroscopy methods (Hall et al., 2010) and transcriptomics (Moran et al., 2012).
Conclusion
Trait-based microbial ecology can potentially link the observations of experimental environmental microbiology, theoretical energy, and mass exchange considerations, and quantitative modeling with an emphasis on depicting microbial diversity across spatial and temporal scales. Previous applications of the microbial trait-based approach have been successful in predicting rates of primary productivity (Follows et al., 2007), heterotrophic activity (Hall et al., 2008), and litter decomposition (Allison, 2012). We demonstrate here that trait-based representation of nitrifiers can be used to connect community diversity with activity, improve understanding of environmental controls on NH3 oxidation, and test hypotheses centered around the ecology of NH3-oxidizers and N2O production, issues that temporal and financial restrictions on field studies are often unable to address. An important avenue for future research is to focus on whether the integration of these microbiological diversity modules into ecosystem models can improve site, regional and global predictions of carbon and nutrient cycling.
Conflict of Interest Statement
The authors declare that the research was conducted in the absence of any commercial or financial relationships that could be construed as a potential conflict of interest.
Acknowledgments
This work was supported by Laboratory Directed Research and Development (LDRD) funding from Lawrence Berkeley National Laboratory provided by the Director, Office of Science, Office of Biological and Environmental Research of the US Department of Energy under Contract No. DE-AC02-05CH11231, and by the Next-Generation Ecosystem Experiments (NGEE Arctic) project, supported by the Office of Biological and Environmental Research in the DOE Office of Science under Contract No. DE-AC02-05CH11231.Part of this work was funded through the Department of Energy, Office of Biological and Environmental Research, Genomic Science Program under contract number DE-AC02-05CH11231.
References
Allison, S. D. (2012). A trait-based approach for modelling microbial litter decomposition. Ecol. Lett. 15, 1058–1070.
Avrahami, S., and Bohannan, B. (2007). Response of Nitrosospira sp. strain AF-like ammonia oxidizers to changes in temperature, soil moisture content, and fertilizer concentration. Appl. Environ. Microbiol. 73, 1166.
Avrahami, S., and Bohannan, B. J. M. (2009). N2O emission rates in a California meadow soil are influenced by fertilizer level, soil moisture and the community structure of ammonia-oxidizing bacteria. Global Change Biol. 15, 643–655.
Bange, H. B. (2008). “Gaseous nitrogen compounds (NO, N2O, N2, NH3) in the ocean,” in Nitrogen in the Marine Environment, eds D. G. Capone, D. A. Bronk, M. R. Mulholland, and E. J. Carpenter (San Diego: Academic Press), 51–93.
Belser, L. W., and Schmidt, E. L. (1979). Serological diversity within a terrestrial ammonia-oxidizing population. Appl. Environ. Microbiol. 36. 589–593.
Booth, M. S., Stark, J. M., and Rastetter, E. (2005). Controls on nitrogen cycling in terrestrial ecosystems: a synthetic analysis of literature data. Ecol. Monogr. 75, 139–157.
Bouskill, N. J., Eveillard, D., Chien, D., Jayakumar, A., and Ward, B. B. (2012). Environmental factors determining ammonia-oxidizing organism distribution and diversity in marine environments. Environ. Microbiol. 14, 714–729.
Bouskill, N. J., Eveillard, D., O’Mullan, G., Jackson, G. A., and Ward, B. B. (2011). Seasonal and annual reoccurrence in betaproteobacterial ammonia-oxidizing bacterial population structure. Environ. Microbiol. 13, 872–886.
Brochier-Armanet, C., Boussau, B., Gribaldo, S., and Forterre, P. (2008). Mesophilic Crenarchaeota: proposal for a third archaeal phylum, the Thaumarchaeota. Nat. Rev. Microbiol. 6, 245–252.
Caporaso, J. G., Lauber, C. L., Walters, W. A., Berg-Lyons, D., Huntley, J., Fierer, N., et al. (2012). Ultra-high-throughput microbial community analysis on the Illumina HiSeq and MiSeq platforms. ISME J. 6, 1621–1624.
Carney, K., Hungate, B., Drake, B., and Megonigal, J. (2007). Altered soil microbial community at elevated CO2 leads to loss of soil carbon. Proc. Natl. Acad. Sci. U.S.A. 104, 4990.
Cébron, A., Berthe, T., and Garnier, J. (2003). Nitrification and nitrifying bacteria in the lower Seine River and estuary (France). Appl. Environ. Microbiol. 69, 7091.
De Boer, W., and Kowalchuk, G. (2001). Nitrification in acid soils: micro-organisms and mechanisms. Soil Biol. Biochem. 33, 853–866.
Delong, E. F., Preston, C. M., Mincer, T., Rich, V., Hallam, S. J., Frigaard, N.-U., et al. (2006). Community genomics among stratified microbial assemblages in the ocean’s interior. Science 311, 496–503.
Di, H., Cameron, K., Shen, J., Winefield, C., O’Callaghan, M., Bowatte, S., et al. (2009). Nitrification driven by bacteria and not archaea in nitrogen-rich grassland soils. Nat. Geosci. 2, 621–624.
Doney, S., Mahowald, N., Lima, I., Feely, R., Mackenzie, F., Lamarque, J., et al. (2007). Impact of anthropogenic atmospheric nitrogen and sulfur deposition on ocean acidification and the inorganic carbon system. Proc. Natl. Acad. Sci. U.S.A. 104, 14580.
Drozd, J. W. (1976). Energy coupling and respiration in Nitrosomonas europaea. Arch. Microbiol. 101, 257–262.
Dutkiewicz, S., Follows, M., and Bragg, J. (2009). Modeling the coupling of ocean ecology and biogeochemistry. Global Biogeochem. Cycles 23.
Elberling, B., Christiansen, H., and Hansen, B. (2010). High nitrous oxide production from thawing permafrost. Nat. Geosci. 3, 332–335.
Erguder, T. H., Boon, N., Wittebolle, L., Marzorati, M., and Verstraete, W. (2009). Environmental factors shaping the ecological niches of ammonia-oxidizing archaea. FEMS Microbiol. Rev. 33, 855–869.
Follows, M. J., and Dutkiewicz, S. (2011). Modeling diverse communities of marine microbes. Annu. Rev. Mar. Sci. 3, 427–451.
Follows, M. J., Dutkiewicz, S., Grant, S., and Chisholm, S. W. (2007). Emergent biogeography of microbial communities in a model ocean. Science 315, 1843–1846.
Frame, C. H., and Casciotti, K. L. (2010). Biogeochemical controls and isotopic signatures of nitrous oxide production by a marine ammonia-oxidizing bacterium. Biogeosciences 7, 2695–2709.
Gans, J., Wolinsky, M., and Dunbar, J. (2005). Computational improvements reveal great bacterial diversity and high metal toxicity in soil. Science 309, 1387–1390.
Gieseke, A., Purkhold, U., Wagner, M., Amann, R., and Schramm, A. (2001). Community structure and activity dynamics of nitrifying bacteria in a phosphate-removing biofilm. Appl. Environ. Microbiol. 67, 1351.
Glover, H. (1985). The relationship between inorganic nitrogen oxidation and organic carbon production in batch and chemostat cultures of marine nitrifying bacteria. Arch. Microbiol. 142, 45–50.
Graham, D., Knapp, C., Van Vleck, E., Bloor, K., Lane, T., and Graham, C. (2007). Experimental demonstration of chaotic instability in biological nitrification. ISME J. 1, 385–393.
Green, J. L., Bohannan, B. J. M., and Whitaker, R. J. (2008). Microbial biogeography: from taxonomy to traits. Science 320, 1039–1043.
Grime, J. P. (1998). Benefits of plant diversity to ecosystems: immediate, filter and founder effects. J. Ecol. 86, 902–910.
Groeneweg, J., Sellner, B., and Tappe, W. (1994). Ammonia oxidation in Nitrosomonas at NH3 concentrations near Km: effects of pH and temperature. Water Res. 28, 2561–2566.
Gubry-Rangin, C., Hai, B., Quince, C., Engel, M., Thomson, B. C., James, P., et al. (2011). Niche specialization of terrestrial archaeal ammonia oxidizers. Proc. Natl. Acad. Sci. U.S.A. 108, 21206–21211.
Gubry-Rangin, C., Nicol, G. W., and Prosser, J. I. (2010). Archaea rather than bacteria control nitrification in two agricultural acidic soils. FEMS Microbiol. Ecol. 74, 566–574.
Hall, E. K., Neuhauser, C., and Cotner, J. B. (2008). Toward a mechanistic understanding of how natural bacterial communities respond to changes in temperature in aquatic ecosystems. ISME J. 2, 471–481.
Hall, E. L., Maixner, F., Franklin, O., Daims, H., Richter, A., and Battin, T. (2010). Linking microbial and ecosystem ecology using ecological stoichiometry: a synthesis of conceptual and empirical analysis. Ecosystems 14, 261–273.
He, J., Shen, J., Zhang, L., Zhu, Y., Zheng, Y., Xu, et al. (2007). Quantitative analyses of the abundance and composition of ammonia-oxidizing bacteria and ammonia-oxidizing archaea of a Chinese upland red soil under long-term fertilization practices. Environ. Microbiol. 9, 2364–2374.
Jenkinson, D. S., and Coleman, K. (2008). The turnover of organic carbon in subsoils. Part 2. Modelling carbon turnover. Eur. J. Soil Sci. 59, 400–413.
Jia, Z., and Conrad, R. (2009). Bacteria rather than Archaea dominate microbial ammonia oxidation in an agricultural soil. Environ. Microbiol. 11, 1658–1671.
Jiang, Q. Q., and Bakken, L. R. (1999). Nitrous oxide production and methane oxidation by different ammonia-oxidizing bacteria. Appl. Environ. Microbiol. 65, 2679–2684.
Kassen, R., Buckling, A., Bell, G., and Rainey, P. (2000). Diversity peaks at intermediate productivity in a laboratory microcosm. Nature 406, 508–512.
Keen, G., and Prosser, J. (1987). Steady-state and transient growth of autotrophic nitrifying bacteria. Arch. Microbiol. 147, 73–79.
Könneke, M., Bernhard, A., José, R., Walker, C., Waterbury, J., and Stahl, D. (2005). Isolation of an autotrophic ammonia-oxidizing marine archaeon. Nature 437, 543–546.
Kool, D. M., Dolfing, J., Wrage, N., and Van Groenigen, J. W. (2011). Nitrifier denitrification as a distinct and significant source of nitrous oxide from soil. Soil Biol. Biochem. 43, 174–178.
Koops, H., and Pommerening Röser, A. (2001). Distribution and ecophysiology of the nitrifying bacteria emphasizing cultured species. FEMS Microbiol. Ecol. 37, 1–9.
Koper, T. E., Stark, J. M., Habteselassie, M. Y., and Norton, J. M. (2010). Nitrification exhibits Haldane kinetics in an agricultural soil treated with ammonium sulfate or dairy-waste compost. FEMS Microbiol. Ecol. 74, 316–322.
Kowalchuk, G. A., and Stephen, J. R. (2001). Ammonia-oxidizing bacteria: a model for molecular microbial ecology. Annu. Rev. Microbiol. 55, 485–529.
Kujawinski, E. B. (2011). The impact of microbial metabolism on marine dissolved organic matter. Annu. Rev. Mar. Sci. 3, 567–599.
Laanbroek, H. J., and Gerards, S. (1993). Competition for limiting amounts of oxygen between Nitrosomonas europaea and Nitrobacter winogradskyi grown in mixed continuous cultures. Arch. Microbiol. 159, 453–459.
Laughlin, D. C. (2011). Nitrification is linked to dominant leaf traits rather than functional diversity. J. Ecol. 99, 1091–1099.
Lauro, F., McDougald, D., Thomas, T., Williams, T., Egan, S., Rice, S., et al. (2009). The genomic basis of trophic strategy in marine bacteria. Proc. Natl. Acad. Sci. U.S.A. 106, 15527.
Lehtovirta-Morley, L. E., Stoecker, K., Vilcinskas, A., Prosser, J. I., and Nicol, G. W. (2011). Cultivation of an obligate acidophilic ammonia oxidizer from a nitrifying acid soil. Proc. Natl. Acad. Sci. U.S.A. 108, 15892–15897.
Leininger, S., Urich, T., Schloter, M., Schwark, L., Qi, J., Nicol, G., et al. (2006). Archaea predominate among ammonia-oxidizing prokaryotes in soils. Nature 442, 806–809.
Li, L., Lollar, B. S., Li, H., Wortmann, U. G., and Lacrampe-Couloume, G. (2012). Ammonium stability and nitrogen isotope fractionations for systems at 20–70 °C and pH of 2–13: applications to habitability and nitrogen cycling in low-temperature hydrothermal systems. Geochim. Cosmochim. Ac. 84, 280–296.
Litchman, E., Klausmeier, C. A., Miller, J. R., Schofield, O. M., and Falkowski, P. G. (2006). Multi-nutrient, multi-group model of present and future oceanic phytoplankton communities. Biogeosciences 3, 585–606.
Litchman, E., Klausmeier, C., Schofield, O., and Falkowski, P. (2007). The role of functional traits and trade-offs in structuring phytoplankton communities: scaling from cellular to ecosystem level. Ecol. Lett. 10, 1170–1181.
Litchman, E., and Klausmeier, C. A. (2008). Trait-based community ecology of phytoplankton. Annu. Rev. Ecol. Evol. Syst. 39, 615–639.
Loveless, J. E., and Painter, H. A. (1968). The influence of metal ion concentrations and pH value on the growth of a Nitrosomonas strain isolated from activated sludge. J. Gen. Microbiol. 52, 1–14.
MacFarling Meure, C., Etheridge, D., Trudinger, C., Steele, P., Langenfelds, R., van Ommen, T., et al. (2006). Law Dome CO2, CH4 and N2O ice core records extended to 2000 years BP. Geophys. Res. Lett. 33.
Mahmood, S., Freitag, T. E., and Prosser, J. I. (2006). Comparison of PCR primer-based strategies for characterization of ammonia oxidizer communities in environmental samples. FEMS Microbiol. Ecol. 56, 482–493.
Manzoni, S., and Porporato, A. (2009). Soil carbon and nitrogen mineralization: theory and models across scales. Soil Biol. Biochem. 41, 1355–1379.
Martens-Habbena, W., Berube, P., Urakawa, H., la Torre De, J., and Stahl, D. (2009). Ammonia oxidation kinetics determine niche separation of nitrifying Archaea and Bacteria. Nature 461, 976–979.
McGill, B., Enquist, B., Weiher, E., and Westoby, M. (2006). Rebuilding community ecology from functional traits. Trends Ecol. Evol. (Amst.) 21, 178–185.
Monteiro, F. M., Dutkiewicz, S., and Follows, M. J. (2011). Biogeographical controls on the marine nitrogen fixers. Global Biogeochem. Cycles 25, GB2003.
Moran, M. A., Satinsky, B., Gifford, S. M., Luo, H., Rivers, A., Chan, L.-K., et al. (2012). Sizing up metatranscriptomics. ISME J.
Mosier, A., and Francis, C. (2008). Relative abundance and diversity of ammonia-oxidizing archaea and bacteria in the San Francisco Bay estuary. Environ. Microbiol. 10, 3002–3016.
Mulder, C. P. H., Bazeley-White, E., Dimitrakopoulos, P. G., Hector, A., Scherer-Lorenzen, M., and Schmid, B. (2008). Specieis evenness and productivity in experimental plant communities. Oikos 107, 50–63.
Mußmann, M., Brito, I., Pitcher, A., Damsté, J. S. S., Hatzenpichler, R., Richter, A., et al. (2011). Thaumarchaeotes abundant in refinery nitrifying sludges express amoA but are not obligate autotrophic ammonia oxidizers. Proc. Natl. Acad. Sci. U.S.A. 108, 16771–16776.
Nicol, G., Leininger, S., Schleper, C., and Prosser, J. (2008). The influence of soil pH on the diversity, abundance and transcriptional activity of ammonia oxidizing archaea and bacteria. Environ. Microbiol. 10, 2966–2978.
Nicol, G., Leininger, S., and Schleper, C. (2011). “Distribution and activity of ammonia-oxidizing archaea in natural environments” in Nitrification, eds B. B. Ward, D. J. Arp, and M. G. Klotz (Washington: ASM Press), 157–178.
Nishio, T., and Fujimoto, T. (1990). Kinetics of nitrification of various amounts of ammonium added to soils. Soil Biol. Biochem. 22, 51–55.
Okabe, S., Satoh, H., and Watanabe, Y. (1999). In situ analysis of nitrifying biofilms as determined by in situ hybridization and the use of microelectrodes. Appl. Environ. Microbiol. 65, 3182.
Parton, W. J., Schimel, D. S., Cole, C. V., and Ojima, D. S. (1987). Analysis of factors controlling soil organic matter levels in Great Plains grasslands. Soil Sci. Soc. Am. J. 51, 1173–1179.
Pèrez, T., Trumbore, S. E., Tyler, S. C., Matson, P. A., Ortiz-Monasterio, I., Rahn, T., et al. (2001). Identifying the agricultural imprint on the global N2O budget using stable isotopes. J. Geophys. Res. 106, 9869–9878.
Petersen, D. G., Blazewicz, S. J., Firestone, M., Herman, D. J., Turetsky, M., and Waldrop, M. (2012). Abundance of microbial genes associated with nitrogen cycling as indices of biogeochemical process rates across a vegetation gradient in Alaska. Environ. Microbiol. 14, 993–1008.
Prosser, J. I., Bohannan, B. J. M., Curtis, T. P., Ellis, R. J., Firestone, M. K., Freckleton, R. P., et al. (2007). The role of ecological theory in microbial ecology. Nat. Rev. Micro. 5, 384–392.
Prosser, J. (2011). “Soil nitrifiers and nitrification,” in Nitrification, eds B. B. Ward, D. J. Arp, and M. G. Klotz (Washington: ASM Press), 347–383.
Ratkowsky, D. A., Lowry, R. K., McMeekin, T. A., Stokes, A. N., and Chandler, R. E. (1983). Model for bacterial culture growth rate throughout the entire biokinetic temperature range. J. Bacteriol. 154, 1222–1226.
Ratkowsky, D. A., Olley, J., and Ross, T. (2005). Unifying temperature effects on the growth rate of bacteria and the stability of globular proteins. J. Theor. Biol. 233, 351–362.
Redfield, A. C. (1958). The biological control of chemical factors in the environment. Am. Sci. 46, 205–221.
Santoro, A. E., Buchwald, C., McIlvin, M. R., and Casciotti, K. L. (2011). Isotopic signature of N2O produced by marine ammonia-oxidizing archaea. Science 333, 1282–1285.
Schimel, J. P., Firestone, M. K., and Killham, K. S. (1984). Identification of heterotrophic nitrification in a sierran forest soil. Appl. Environ. Microbiol. 48, 802–806.
Schneider, T., Keiblinger, K. M., Schmid, E., Sterflinger-Gleixner, K., Ellersdorfer, G., Roschitzki, B., et al. (2012). Who is who in litter decomposition? Metaproteomics reveals major microbial players and their biogeochemical functions. ISME J. 6, 1749–1762.
Schramm, A., De Beer, D., Van Den Heuvel, J., Ottengraf, S., and Amann, R. (1999). Microscale distribution of populations and activities of Nitrosospira and Nitrospira spp. along a macroscale gradient in a nitrifying bioreactor: quantification by in situ hybridization and the use of microsensors. Appl. Environ. Microbiol. 65, 3690.
Schreiber, F., Loeffler, B., Polerecky, L., Kuypers, M. M. M., and de Beer, D. (2009). Mechanisms of transient nitric oxide and nitrous oxide production in a complex biofilm. ISME J. 3, 1301–1313.
Stark, J. M., and Firestone, M. K. (1996). Kinetic characteristics of ammonium-oxidizer communities in a California oak woodland-annual grassland. Soil Biol. Biochem. 28, 1307–1317.
Stein, L. Y., and Klotz, M. G. (2011). Nitrifying and denitrifying pathways of methanotrophic bacteria. Biochem. Soc. Trans. 39, 1826–1831.
Suzuki, I. (1974). Mechanisms of inorganic oxidation and energy coupling. Ann. Rev. Microbiol. 28, 85–102.
Suzuki, I., Dular, U., and Kwok, S. (1974). Ammonia or ammonium ion as substrate for oxidation by Nitrosomonas europaea cells and extracts. J. Bacteriol. 120, 556.
Tilman, D., Wedin, D., and Knops, J. (1996). Productivity and sustainability influenced by biodiversity in grassland ecosystems. Nature 379, 718–720.
Tourna, M., Freitag, T., Nicol, G., and Prosser, J. (2008). Growth, activity and temperature responses of ammonia-oxidizing archaea and bacteria in soil microcosms. Environ. Microbiol. 10, 1357–1364.
van der Ploeg, R. R., Bohm, W., and Kirkham, M. B. (1999). On the origin of the theory of mineral nutrition of plants and the law of the minimum. Soil Sci. Soc. Am. J. 63, 1055–1062.
Vanparys, B., Spieck, E., Heylen, K., Wittebolle, L., Geets, J., Boon, N., and De Vos, P. (2007). The phylogeny of the genus Nitrobacter based on comparative rep-PCR, 16S rRNA and nitrite oxidoreductase gene sequence analysis. Syst. Appl. Microbiol. 30, 297–308.
Verhagen, F., and Laanbroek, H. (1991). Competition for ammonium between nitrifying and heterotrophic bacteria in dual energy-limited chemostats. Appl. Environ. Microbiol. 57, 3255.
Verhamme, D. T., Prosser, J. I., and Nicol, G. W. (2011). Ammonia concentration determines differential growth of ammonia-oxidising archaea and bacteria in soil microcosms. ISME J. 5, 1067–1071.
Ward, B. B. (2008). “Nitrification in Marine Systems,” in Nitrogen in the Marine Environment, eds D. G. Capone, D. A. Bronk, M. R. Mulholland, and E. J. Carpenter (San Diego: Academic Press), 199–261.
Webb, C. T., Hoeting, J. A., Ames, G. M., Pyne, M. I., and LeRoy Poff, N. (2010). A structured and dynamic framework to advance traits-based theory and prediction in ecology. Ecol. Lett. 13, 267–283.
Wells, G., Park, H., Yeung, C., Eggleston, B., Francis, C., and Criddle, C. (2009). Ammonia-oxidizing communities in a highly aerated full-scale activated sludge bioreactor: betaproteobacterial dynamics and low relative abundance of Crenarchaea. Environ. Microbiol. 11, 2310–2328.
Wertz, S., Leigh, A. K. K., and Grayston, S. J. (2011). Effects of long-term fertilization of forest soils on potential nitrification and on the abundance and community structure of ammonia oxidizers and nitrite oxidizers. FEMS Microbiol. Ecol. 79, 142–154.
Appendix
Materials and Methods
Derivation of trait values
Numerical values for five different traits [KM(NH3), KM(O2), VMAX(NH3), μmax, RC:N] were taken from ecophysiological studies following an extensive literature review (Loveless and Painter, 1968; Suzuki, 1974; Suzuki et al., 1974; Drozd, 1976; Glover, 1985; Belser and Schmidt, 1979; Keen and Prosser, 1987; Prosser, 1989; Nishio and Fujimoto, 1990; Verhagen and Laanbroek, 1991; Laanbroek and Gerards, 1993; Jiang and Bakken, 1999; Schramm et al., 1999; Gieseke et al., 2001; Koops and Pommerening Röser, 2001; Cébron et al., 2003; Martens-Habbena et al., 2009; Schreiber et al., 2009). Where possible the traits were derived from the same study, however, efforts were made to ensure that the similar methodologies were used to calculate trait values (e.g., under similar pH and temperature). The different ecophysiological traits were measured in batch cultures of strains of Nitrosomonas, Nitrosospira, Nitrosopumilus, Nitrososphaera and Nitrosotalea.
– KM(NH3)/KM(O2)/VMAX: Enzyme kinetics (e.g., affinity constant and uptake) were calculated under substrate saturation conditions (see: Loveless and Painter, 1968; Suzuki et al., 1974; Drozd, 1976; Martens-Habbena et al., 2009). Affinity constants have previously been measured in whole cells as well as cell extracts and oxygen concentrations measured using oxygen electrodes (Suzuki et al., 1974). Enzyme uptake can be calculated using ammonia microprofiles and fitting to the Michaelis–Menton equation (e.g., Schramm et al., 1999). In the case of the AOA, Nitrosopumilus maritimus, affinity constants were derived using oxygen microsensors (Martens-Habbena et al., 2009), from multiple oxygen traces. Maximum uptake rate was also calculated under substrate saturation. In general, media with defined ammonia concentrations were sub-sampled over time and substrate concentrations determined fluorometrically. Uptake rates were calculated from oxygen profiles and fitted to a Michaelis Menton equation (Martens-Habbena et al., 2009).
– μmax: Maximum specific growth rate was generally estimated by measuring the evolution of NO2 as a proxy for growth (e.g., Loveless and Painter, 1968; Keen and Prosser, 1987). NO2 increases exponentially during growth and the slope of a semi-logarithmic plot of product evolution against substrate concentration is equivalent to specific growth rate.
– RC:N: The carbon yield from nitrification was determined in continuous or chemostat cultures (e.g., Belser, 1979; Belser and Schmidt, 1979; Glover, 1985; Keen and Prosser, 1987) by measuring cell number (e.g., using a spectrometric bacterial counter) and the production (AOB), or draw down (NOB), of NO2.
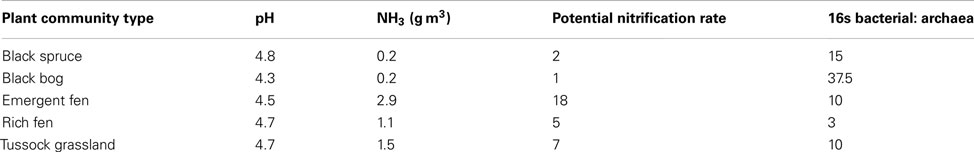
Table A1. Initial inputs for model simulation of the Petersen dataset.
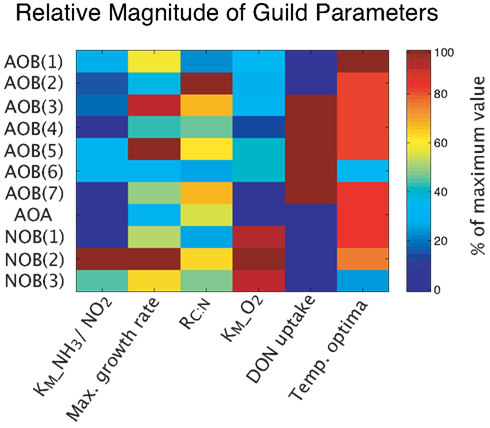
Figure A1. Relative magnitude of guild parameters.
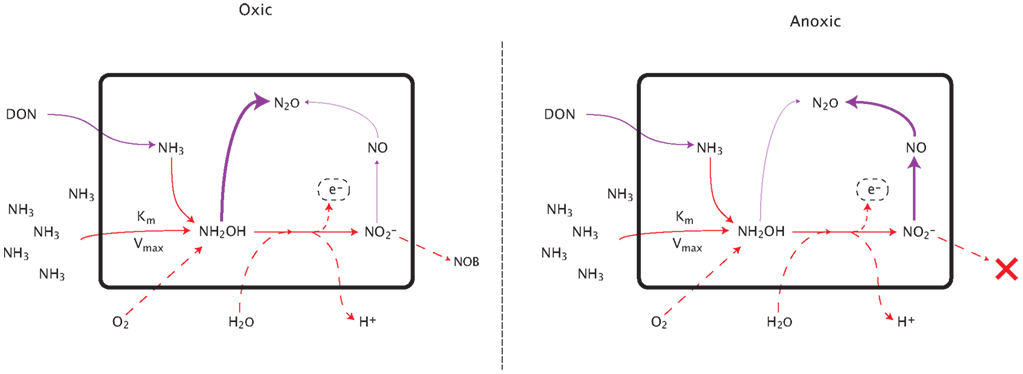
Figure A2. Pathways of nitrous oxide production during nitrification. See text for detailed explanation.
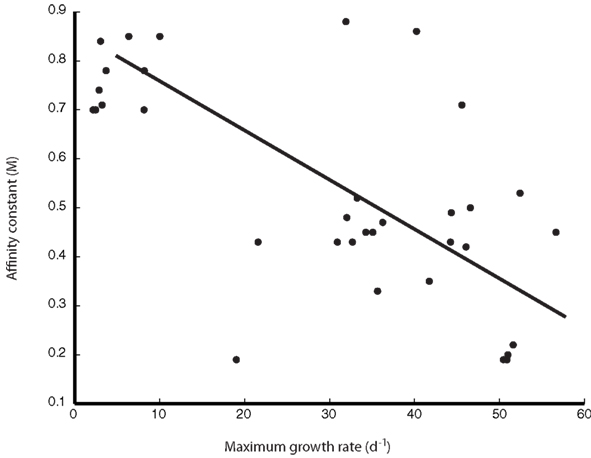
Figure A3. Explicit relationship between trait parameters KM and μmax.
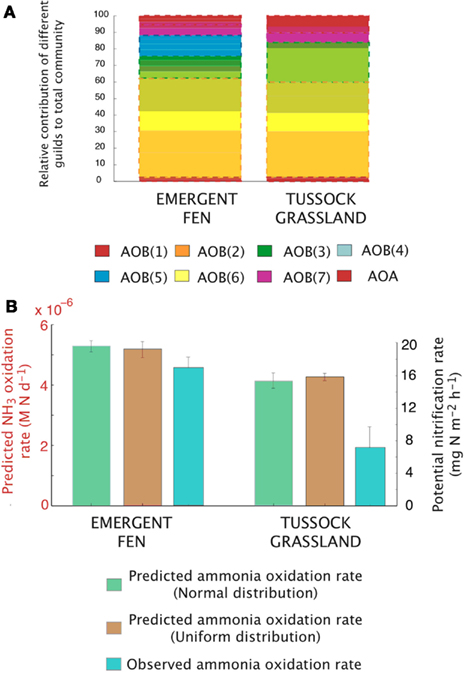
Figure A4. Simulations of the activity and diversity of AOB communities in high-latitude ecosystems. (A) Simulations of multiple AOB analogs (n = 5 analogs per guild) across the different sites. These simulations are based on a normalized distribution of trait values. Each guild is represented by a distinct color. Subtle differences in the shade of that color demarcate the different analogs/guild. A box outlines the boundaries of each guild’s biomass. Evenness statistic given above the bar plots. (B) Experimental observations reproduced from Petersen et al. (2012), showing the trends in potential nitrification rates under a normal distribution, a uniform distribution, and the observed NH3 oxidation rates.
Keywords: nitrogen cycle, models, biological, geochemistry, mathematical modeling, nitrification
Citation: Bouskill NJ, Tang J, Riley WJ and Brodie EL (2012) Trait-based representation of biological nitrification: model development, testing, and predicted community composition. Front. Microbio. 3:364. doi: 10.3389/fmicb.2012.00364
Received: 03 July 2012; Paper pending published: 16 August 2012;
Accepted: 25 September 2012; Published online: 18 October 2012.
Edited by:
Bess B. Ward, Princeton University, USAReviewed by:
J. Michael Beman, University of California, Merced, USADaniel Laughlin, University of Waikato, New Zealand
Copyright: © 2012 Bouskill, Tang, Riley and Brodie. This is an open-access article distributed under the terms of the Creative Commons Attribution License, which permits use, distribution and reproduction in other forums, provided the original authors and source are credited and subject to any copyright notices concerning any third-party graphics etc.
*Correspondence: Nicholas J. Bouskill, Ecology Department, Earth Sciences Division, Lawrence Berkeley National Laboratory, Berkeley, CA 94720, USA. e-mail: njbouskill@lbl.gov