 Fawad Yousuf1,2Gloria Kim1,2Shahamat Tauhid1,2Bonnie I. Glanz1,3Renxin Chu1,2Subhash Tummala1,2Brian C. Healy1,3
 Rohit Bakshi1,2,3,4*
- 1Department of Neurology, Brigham and Women’s Hospital, Harvard Medical School, Boston, MA, USA
- 2Laboratory for Neuroimaging Research, Brigham and Women’s Hospital, Harvard Medical School, Boston, MA, USA
- 3Partners Multiple Sclerosis Center, Brigham and Women’s Hospital, Harvard Medical School, Boston, MA, USA
- 4Department of Radiology, Brigham and Women’s Hospital, Harvard Medical School, Boston, MA, USA
Objective: To test a new version of the Magnetic Resonance Disease Severity Scale (v.3 = MRDSS3) for multiple sclerosis (MS), incorporating cortical gray matter lesions (CLs) from 3T magnetic resonance imaging (MRI).
Background: MRDSS1 was a cerebral MRI-defined composite scale of MS disease severity combining T2 lesion volume (T2LV), the ratio of T1 to T2LV (T1/T2), and whole brain atrophy [brain parenchymal fraction (BPF)]. MRDSS2 expanded the scale to include cerebral gray matter fraction (GMF) and upper cervical spinal cord area (UCCA). We tested the contribution of CLs to the scale (MRDSS3) in modeling the MRI relationship to clinical status.
Methods: We studied 51 patients [3 clinically isolated syndrome, 43 relapsing-remitting, 5 progressive forms, age (mean ± SD) 40.7 ± 9.1 years, Expanded Disability Status Scale (EDSS) score 1.6 ± 1.7] and 20 normal controls by high-resolution cerebrospinal MRI. CLs required visibility on both fluid-attenuated inversion-recovery (FLAIR) and modified driven equilibrium Fourier transform sequences. The MACFIMS battery defined cognitively impaired (n = 18) vs. preserved (n = 33) MS subgroups.
Results: EDSS significantly correlated with only BPF, UCCA, MRDSS2, and MRDSS3 (all p < 0.05). After adjusting for depressive symptoms, the cognitively impaired group had higher severity of MRI metrics than the cognitively preserved group in regard to only BPF, GMF, T1/T2, MRDSS1, and MRDSS2 (all p < 0.05). CL number was not significantly related to EDSS score or cognition status.
Conclusion: CLs from 3T MRI did not appear to improve the validity of the MRDSS. Further studies employing advanced sequences or higher field strengths may show more utility for the incorporation of CLs into composite scales.
Introduction
Multiple sclerosis (MS) was historically considered a disease targeting CNS white matter, but a growing body of histopathologic and neuroimaging studies have shown involvement of the cerebral cortical and deep gray matter tissue (1–6).
Magnetic resonance imaging (MRI) is an essential tool in clinical MS care including its role in diagnosis and longitudinal monitoring to assess lesions and atrophy of the brain and spinal cord (7, 8). Composite MRI scales are a proposed platform to comprehensively define structural changes related to MS (9–15).
For example, we have developed a Magnetic Resonance Disease Severity Scale, which, in its first version (MRDSS1) (11, 12), included three cerebral measures of MS involvement: T2 hyperintense lesion volume (T2LV, a non-specific measure of overall lesion burden) (16), the ratio of T1 hypointense lesion volume to T2LV (T1/T2, representing the destructive potential of lesions) (15), and normalized whole brain volume (representing whole brain atrophy) (17). MRDSS1 offers more concurrent validity and longitudinal sensitivity than the individual measures on their own (11, 12). In a second version of the scale (MRDSS2), we added measures of cerebral gray matter and spinal cord atrophy, which led to a higher correlation with physical disability than MRDSS1 (13). MRDSS2 also showed a relationship to cognitive dysfunction (13), tested because of the importance of cognition impacting on quality of life (18).
Among the range of newly discovered pathologic changes in MS gray matter, foci of demyelination in the cortical gray matter (cortical lesions, CLs) are of growing interest in representing a core aspect of disease pathogenesis (3, 19, 20). CLs occur early in the MS disease course and are related to physical disability and cognitive impairment (14, 21–32). In this study, we tested the validity of a third version of the MRDSS (MRDSS3) incorporating CLs, compared to the previous versions.
Materials and Methods
Subjects
Demographic, clinical, and MRI characteristics of all subjects are summarized in the Table 1. The recruitment methods and inclusion criteria have been described in our previous study (13), from which subjects were drawn for this study, after removing 14 subjects because of technically inadequate MRI scans for CL analysis. As a result, this study included 51 patients with MS and 20 normal controls. Each patient underwent a neurologic examination by an MS specialist, including assessment of expanded disability status scale (EDSS) score (33) and timed 25-foot walk (T25FW) (34). All patients also underwent cognitive testing (see below). Informed consent was obtained from all subjects. This study was approved by our hospital’s institutional review board.
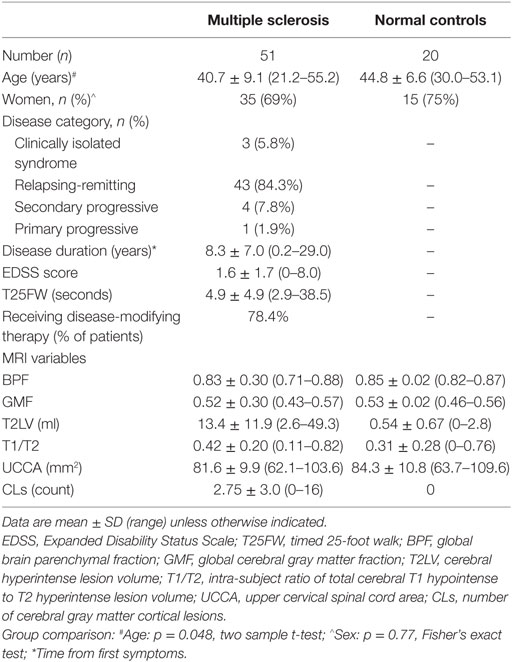
Table 1. Demographic and clinical data.
Cognitive Assessment
Neuropsychological evaluation, as detailed in our previous studies (13, 35), employed the Minimal Assessment of Cognitive function in MS (MACFIMS) battery (36). Patients were also evaluated for depressive symptoms using the Center for Epidemiologic Studies Depression (CES-D) scale (37) to adjust for the effect of depression on the relationship between MRI and cognition. Due to the small sample size of the NC group, regression-based norms were acquired using a distinct set of data to control for demographic factors (age, sex, education, and ethnicity), and T-scores were calculated (13). We considered a T-score of 35 or less as an impairment on any of the MACFIMS elements, permitting subdivision of the MS group into either cognitively impaired (n = 18) or cognitively preserved (n = 33), based on abnormality of two or more elements of the MACFIMS.
MRI Acquisition
All subjects underwent MRI on the same scanner (3T Signa; General Electric, Milwaukee, WI, USA) using a consistent acquisition protocol. Brain and cervical spinal cord MRI was performed with the following relevant parameters: brain: coronal 3D modified driven equilibrium Fourier transform (MDEFT) covering the whole head: TR = 7.9 ms, TE = 3.14 ms, flip angle = 15°, slice thickness = 1.6 mm, pixel size = 0.938 × 0.938 mm; axial T2-weighted fast fluid-attenuated inversion-recovery (FLAIR): TR = 9000 ms, TE = 151 ms, TI = 2250 ms, slice thickness = 2 mm, pixel size = 0.976 × 0.976 mm; spinal cord: axial T2-weighted fast spin-echo images of the entire spinal cord: TR = 6117 ms, TE = 110 ms, slice thickness = 3 mm (no inter-slice gaps), pixel size = 0.937 × 0.937 mm. The FLAIR sequence was chosen for the depiction of CLs, based on the effectiveness shown in our previous study (27). We also paired the FLAIR with a high-resolution T1-weighted sequence per our previous strategy to assure accuracy of the identification of CLs and limit false positives (27). The MDEFT was chosen as the T1-weighted sequence, given its effectiveness in gray vs. white structural tissue definition (38) and its high sensitivity to MS lesions, based on our previous work (38).
MRI Analysis
MRI Scan Processing
To facilitate the analysis of CLs using concurrent review of FLAIR and MDEFT scans, the two image sets were brought into the same anatomic plane and matched to the same voxel size by post-processing of the MDEFT scans to match the FLAIR scans. The coronal MDEFT scans were first re-sliced into the axial plane using Jim software (v. 7; Xinapse Systems, West Bergholt, UK, http://www.xinapse.com). The axial MDEFT scans were then co-registered to the native axial FLAIR scans using SPM software (v. 12; Wellcome Department of Cognitive Neurology, London, UK, http://www.fil.ion.ucl.ac.uk/spm/) (39). All MRI analysis was conducted in a blinded fashion without the knowledge of demographic and clinical details.
Cortical Lesion Analysis
The number of CLs was assessed in each case by concurrent review of the co-registered FLAIR and MDEFT sequences in the axial plane in Jim 7. Based on our previously described method (27), CLs were defined as appearing both hyperintense on FLAIR and hypointense on MDEFT images. The lesion was also required to involve at least part of the cerebral cortex on the MDEFT scan. Therefore, juxtacortical lesions, which were seated exclusively in white matter while abutting the cortex, were excluded. No attempt was made to classify CLs into subtypes (40), as this was felt to be technically challenging and beyond the scope of the study. Assessment was made by a reading panel of two trained observers (Fawad Yousuf and Gloria Kim); their findings were confirmed by an experienced observer (Shahamat Tauhid). Any disagreements were evaluated by a senior observer (Rohit Bakshi). Examples of MRI-defined CLs are shown in Figures 1–5. The mean (SD) number of CL in the MS patients was 2.75 (3.0). The specific numbers of CLs found in each subject were 0 lesions (n = 4); 1 (n = 17), 2 (n = 11), 3 (n = 9), 4 (n = 2), 5 (n = 1), 6 (n = 4), 9 (n = 1), 12 (n = 1), and 16 (n = 1).
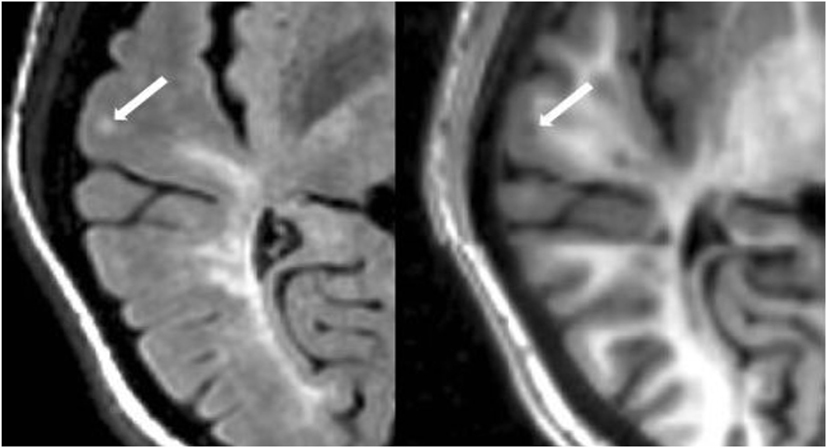
Figure 1. Fluid-attenuated inversion-recovery scan (left) demonstrating a hyperintense lesion (arrow) that is confirmed on the co-registered modified driven equilibrium Fourier transform scan (right) to show hypointensity (arrow) and involve the cerebral cortex. This is from a patient with relapsing-remitting MS (34-year-old woman, disease duration = 1 year, Expanded Disability Status Scale score = 1.5).
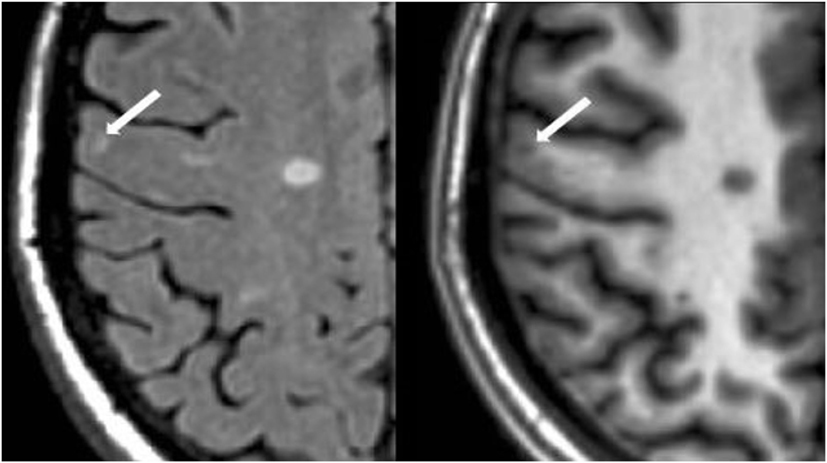
Figure 2. Fluid-attenuated inversion-recovery scan (left) demonstrating a hyperintense lesion (arrow) that is confirmed on the co-registered modified driven equilibrium Fourier transform scan (right) to show hypointensity (arrow) and involve the cerebral cortex. This is from a patient with relapsing-remitting MS (29-year-old woman, disease duration = 11 years, Expanded Disability Status Scale score = 2).
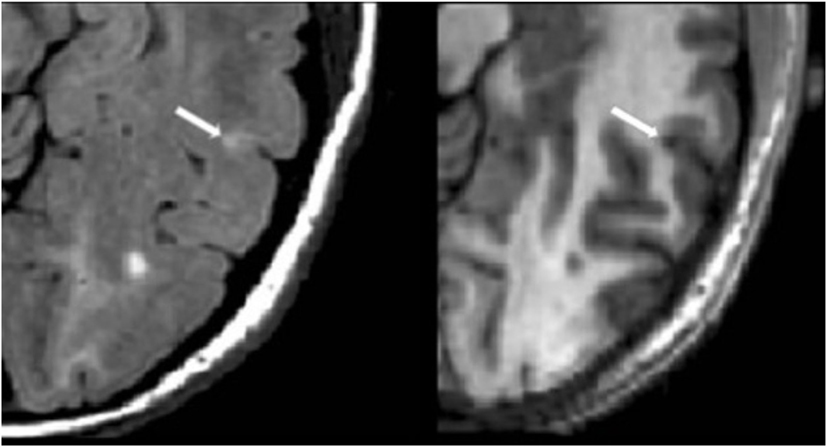
Figure 3. Fluid-attenuated inversion-recovery scan (left) demonstrating a hyperintense lesion (arrow) that is confirmed on the co-registered modified driven equilibrium Fourier transform scan (right) to show hypointensity (arrow) and involve the cerebral cortex. This is from a patient with relapsing-remitting MS (42-year-old woman, disease duration = 10 years, Expanded Disability Status Scale score = 0).
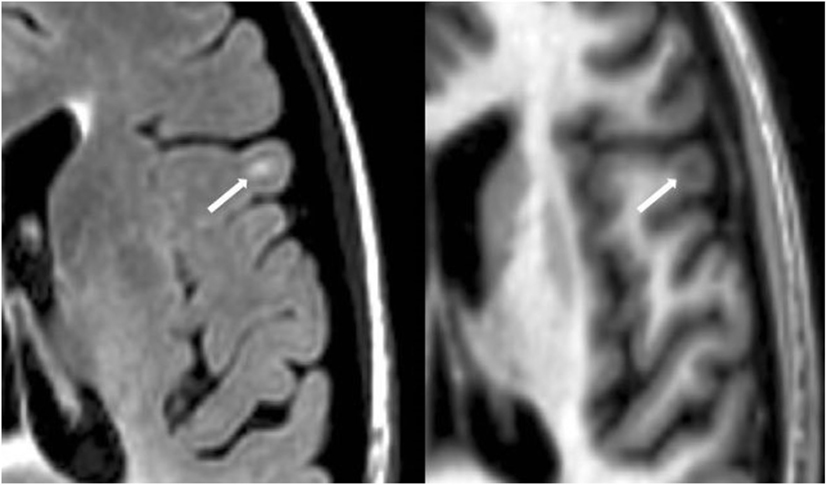
Figure 4. Fluid-attenuated inversion-recovery scan (left) demonstrating a hyperintense lesion (arrow) that is confirmed on the co-registered modified driven equilibrium Fourier transform scan (right) to show hypointensity (arrow) and involve the cerebral cortex. This is from a patient with relapsing-remitting MS (40-year-old woman, disease duration = 4 years, Expanded Disability Status Scale score = 3.5).
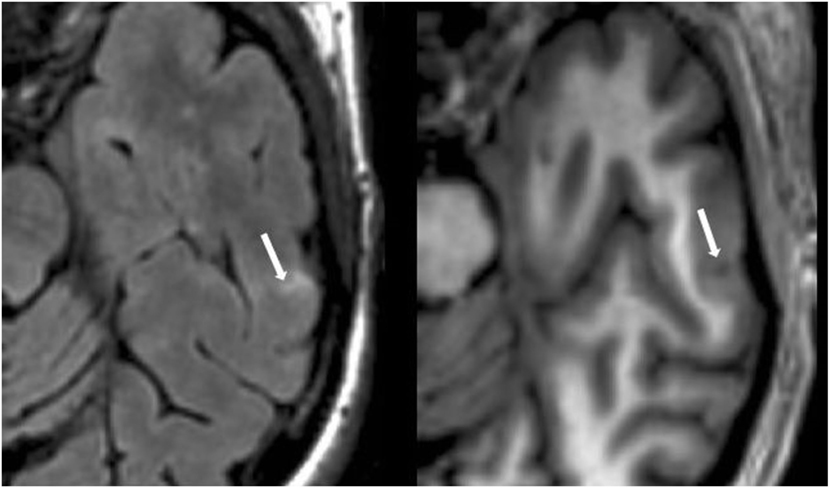
Figure 5. Fluid-attenuated inversion-recovery scan (left) demonstrating a hyperintense lesion (arrow) that is confirmed on the co-registered modified driven equilibrium Fourier transform scan (right) to show hypointensity (arrow) and involve the cerebral cortex. This is from a patient with relapsing-remitting MS (44-year-old woman, disease duration = 12 years, Expanded Disability Status Scale score = 3).
Reliability Analysis
Ten randomly chosen MS subjects were reanalyzed to determine intra-rater and inter-rater reliability for the quantification of CLs. Counts of CLs showed high reliability. The mean coefficient of variation was 3.67% within the same rater and 6.47% between the two raters. Regarding intra-class correlation coefficients (ICCs), the intra-rater ICC was 0.98 (model: one-way), and the inter-rater ICC was 0.99 (model: two-way absolute agreement). All three counts agreed for 7 out of the 10 scans, and all scans with 0 or 1 CLs were scored the same. Furthermore, the maximum departure between was 3 lesions, and this was in the subjects with a large number of lesions.
Other MRI Analysis
The MRI analysis methodology used to derive lesion volumes, whole brain and gray matter tissue fractions, and upper cervical spinal cord area (UCCA) has been described previously (13). Briefly, cerebral lesion volumes were based on expert identification from FLAIR (T2 hyperintense lesions) and MDEFT (T1 hypointense lesions) followed by semiautomated contouring. Cerebral tissue compartment fractions were derived from MDEFT scans using a validated statistical parametric mapping pipeline (41) to calculate normalized whole brain parenchymal fraction (BPF) and gray matter (GMF) parenchymal fractions. A semiautomated contouring tool (42) served as the foundation for the calculation of UCCA from C2–C5, normalized to cord length, using our highly reliable and validated pipeline on T2 axial images (43).
Creation of the MRDSS Versions
Previous versions of MRDSS (MRDSS1 and MRDSS2)
We have separately described the rationale for the MRDSS1 (11, 12) and MRDSS2 (13). Because of the restricted range of the current MS sample, we relied on d-scores to define the MRDSS versions. We have separately described the method for calculating dMRDSS1 and dMRDSS2 in the present sample based on d-scores (13). dMRDSS1 was calculated as:
We defined a d-score to be the observed value minus the mean of the variable in the healthy controls divided by the SD of the variable in the MS sample. For the T2LV and T1/T2, the mean of the healthy controls was calculated only in subjects with non-zero values for each measure. The variables comprising dMRDSS2 differed from dMRDSS1 in two ways: (1) substitution of GMF for BPF and (2) the addition of spinal cord data. dMRDSS2 was calculated as:
MRDSS3
The variables comprising dMRDSS3 differed from dMRDSS2 only by the addition of counts of CLs. dMRDSS3 was calculated as:
The following formula was used to calculate the d-score for CLs:
Statistics
Demographic data between groups were compared by using a two sample t-test for continuous outcomes and Fisher’s exact test for dichotomous outcomes. Correlations between MRI and neurologic disability in the MS group were assessed using Spearman’s rank correlation coefficients. MRI metrics in the cognition groups were compared by two sample t-tests; linear regression was used to adjust for depression (CES-D scores) in these MRI-cognitive comparisons. Correlations among the MRI measures were assessed using Spearman’s rank correlation coefficients. A p-value less than 0.05 was considered significant.
Results
Correlation between MRI and Disability in the MS Group
We tested the relationship between physical disability (EDSS score) and the three versions of MRDSS along with all the available component MRI measures of brain and spinal cord involvement, as shown in Tables 2 and 4. EDSS showed significant weak-to-moderate correlations, to a similar degree, with BPF, UCCA, dMRDSS2, and dMRDSS3 (all p < 0.05).
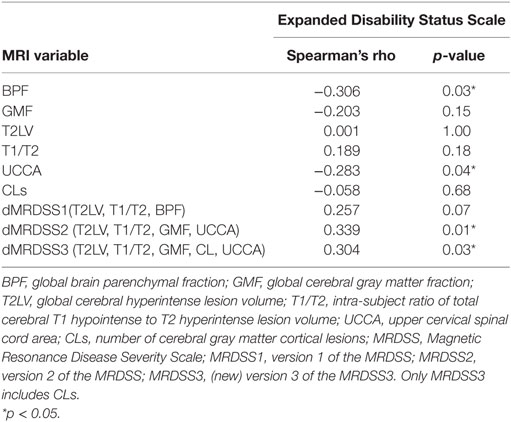
Table 2. MRI and neurologic disability correlations in the entire multiple sclerosis group (n = 51).
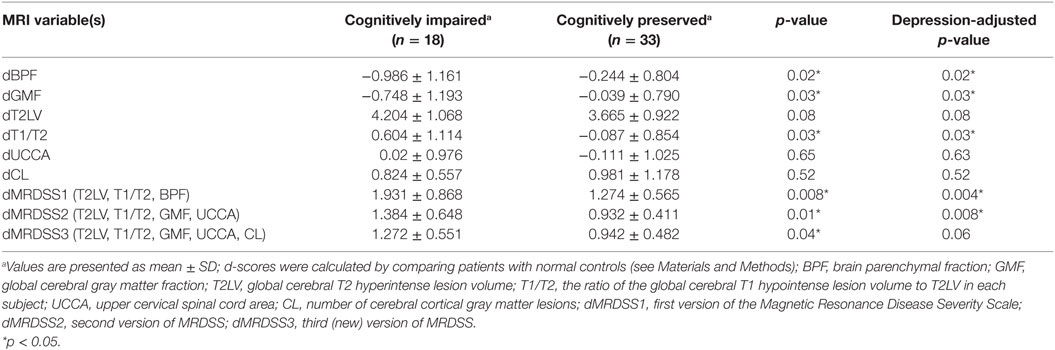
Table 3. MRI findings vs. cognitive status in the entire multiple sclerosis group (n = 51).
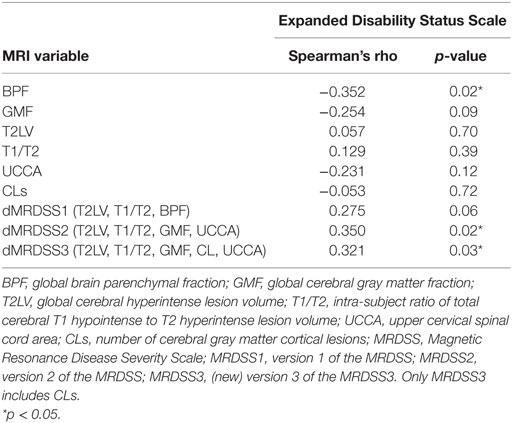
Table 4. MRI and neurologic disability correlations in patients with relapsing-remitting or secondary progressive multiple sclerosis (n = 47).
MRI Findings vs. Cognitive Status in the MS Group
The individual MRI measures as well as the three versions of the MRDSS were compared between the cognitively impaired and the cognitively preserved MS subjects as shown in Tables 3 and 5. BPF, GMF, T1/T2, dMRDSS1, and dMRDSS2 showed higher severity in the cognitively impaired group than the cognitively preserved group both before and after adjusting for depressive symptoms (all p < 0.05). dMRDSS3 also showed more severity in the cognitively impaired group as compared to the cognitively preserved before adjusting for depression (p = 0.04); however, the significance was lost after adjustment for depression.
MS Subgroup Analysis
Given the heterogeneous composition of the MS group with regard to clinical course/disease subtype, we also assessed whether the main findings would change with elimination of the four patients with either clinically isolated demyelinating syndromes or primary progressive MS. In the remaining 47 patients (who had either relapsing-remitting or secondary progressive MS), the above results remained similar to the full cohort (Tables 4 and 5).
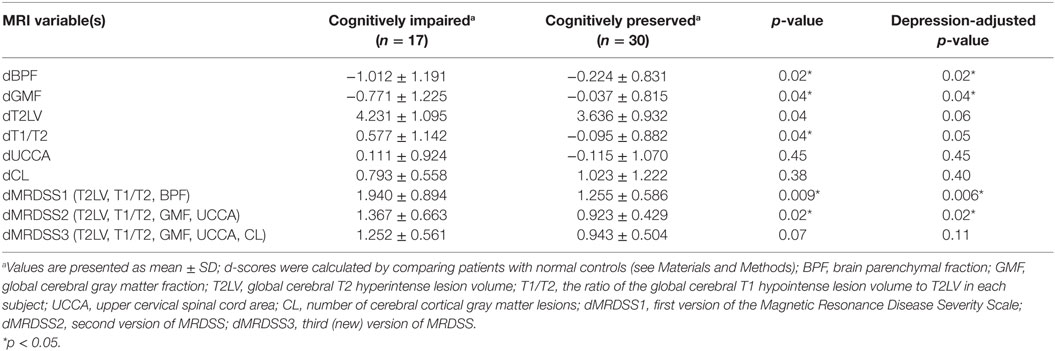
Table 5. MRI findings vs. cognitive status in patients with relapsing-remitting or secondary progressive multiple sclerosis (n = 47).
MRI to MRI Correlations
Individual MRI measures were compared with each other for correlations (Table 6). Significant relationships were shown between GMF and BPF (r = 0.795, p < 0.001) and between T1/T2 and T2LV (r = 0.299, p = 0.033). CL count was not correlated with any of the other MRI measures (all p > 0.05).
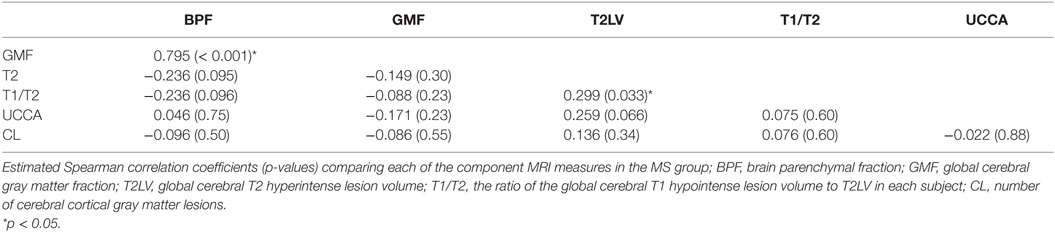
Table 6. MRI to MRI correlations in the entire multiple sclerosis group (n = 51).
Discussion
The purpose of our study was to test the role of CLs in adding validity to the MRDSS in defining a relationship between MRI and clinical status in patients with MS. As measures of validity, we assessed physical disability and cognitive impairment. The main findings were that the new version of MRDSS with the addition of CLs (MRDSS3) did not increase the strength of relationships between MRI and clinical status vs. previous versions of MRDSS, in this cross-sectional study.
Our findings were most likely driven by the fact that CLs on their own were not related to EDSS score or cognitive status. There are two previous studies that failed to show a relationship between CL count and EDSS score (44, 45). Whereas, studies that have assessed CL volume have shown closer relationships to EDSS score (22–25, 27). Similarly, previous studies have shown an inconsistent relationship between CL count and cognitive dysfunction, with some studies showing a relationship (14, 25–31, 45), while another study failed to do so (46).
In agreement with our previous study (13), our results emphasized the association between brain/spinal cord atrophy and physical disability and the link between brain atrophy or the destructive potential of brain lesions (T1/T2) and cognitive status. Brain atrophy has long been known to link well to both cognitive impairment and physical disability in MS (47–56). Similarly, spinal cord atrophy has been closely linked to physical disability in patients with MS (13, 42, 57–61).
Furthermore, the cerebral ratio of T1 hypointense to T2 hyperintense lesion load (T1/T2) showed a link to cognitive status in the present study. The persistence of T1 hypointense lesions in patients with MS has long been known to indicate severe destructive pathology corresponding to irreversible demyelination and axonal loss (62, 63). Also, the extent of chronic T1 hypointense lesions in the brain is well correlated with MS related disability (64), whereas an analogous marker of severe CLs is not readily available. However, this is not to diminish the contribution of gray matter involvement to cognition. It is important to note that gray matter atrophy (as assessed by GMF) also linked to cognitive status to a similar extent vs. T1/T2. These results point to the components of both white matter and gray matter pathology in regard to cognitive dysfunction in patients with MS, in keeping with previous observations (65, 66).
We noted some interesting results in the assessment of correlation of the MRI metrics to each other in the MS group. The two cerebral atrophy measures (BPF, GMF) correlated with each other as did the two cerebral lesion measures (T2LV vs. T1/T2). However, spinal cord volume, as estimated by UCCA, did not correlate with any measures of brain involvement. This observation adds to a growing body of evidence suggesting the topographic independence of these two sites of disease activity (59) and the resulting complementary information obtained by considering both brain and spinal cord MRI metrics (13, 67). This divergence is also consistent with previous work showing genetic susceptibility, or immune signatures may confer a specific risk for spinal cord lesions (68, 69). Another interesting finding was the lack of correlation between cerebral lesions and cerebral measures of atrophy. This is a well-known phenomenon when analyzing MS disease course, which may relate to a divergence between inflammatory and neurodegenerative features of the disease in a subset of patients (70). Finally, we also noted a lack of correlation between CLs and measures of cerebral white matter lesions (T2LV or T1/T2). Our findings are in agreement with a previous study (23). When found to be significant in other previous studies, such correlations have remained weak to moderate (21, 22, 24, 25, 27, 28, 30, 44).
However, our study is not without limitations, and the findings should be considered preliminary. First, we would highlight the fact that the average CL count was low in our study as compared to previous studies (21–28, 30, 44, 46, 71). This may relate to several factors inherent in the characteristics of the cohort or technical issues. For example, our patients were mildly disabled, on average, and largely receiving disease-modifying therapy. Our sample was dominated by relapsing-remitting, rather than progressive, forms of the disease. Thus, the degree of cortical involvement may have been limited. The MRI acquisition relied on two types of routine pulse sequences at 3T, without advanced techniques, such as double inversion-recovery (45, 72) and phase-sensitive inversion-recovery (73–75). However, our techniques fell within a clinically feasible high-resolution routine, which should have some value for assessing CLs. We also did not perform 7T field strength MRI to boost the sensitivity in the detection of CLs (25, 76–79). Other strategies, such as increasing the sample size, adding CL volume assessments (22–25, 27, 30), and evaluating CL subtypes (31), may show more utility for improving the validity of the measurement of CLs. It is important to therefore conclude that future studies are necessary to confirm and extend our results.
Author Contributions
FY, GK, and STauhid: acquisition of data and drafting of the manuscript. BG, RC, and STummala: acquisition of data, editing and approval of the manuscript. BH: statistical analysis and drafting of the manuscript. RB: conceiving the study, obtaining funding, and drafting of the manuscript.
Conflict of Interest Statement
The authors declare that the research was conducted in the absence of any commercial or financial relationships that could be construed as a potential conflict of interest.
Acknowledgments
We thank Dr. Antonia Ceccarelli, Dr. Ashish Arora, and Dr. Mohit Neema for valuable contributions to early stages of this project. This work was presented in preliminary form at the 2016 annual meeting of the American Academy of Neurology, Vancouver, Canada.
Funding
This study was supported in part by a research grant to Dr. Bakshi from the National Multiple Sclerosis Society (RG 4354-A-2).
References
1. Calabrese M, Magliozzi R, Ciccarelli O, Geurts JJ, Reynolds R, Martin R. Exploring the origins of grey matter damage in multiple sclerosis. Nat Rev Neurosci (2015) 16(3):147–58. doi: 10.1038/nrn3900
2. Klaver R, De Vries HE, Schenk GJ, Geurts JJ. Grey matter damage in multiple sclerosis: a pathology perspective. Prion (2013) 7(1):66–75. doi:10.4161/pri.23499
3. Pirko I, Lucchinetti CF, Sriram S, Bakshi R. Gray matter involvement in multiple sclerosis. Neurology (2007) 68(9):634–42. doi:10.1212/01.wnl.0000250267.85698.7a
4. Filippi M, Rocca MA. MR imaging of gray matter involvement in multiple sclerosis: implications for understanding disease pathophysiology and monitoring treatment efficacy. AJNR Am J Neuroradiol (2010) 31(7):1171–7. doi:10.3174/ajnr.A1944
5. Sethi V, Yousry T, Muhlert N, Tozer DJ, Altmann D, Ron M, et al. A longitudinal study of cortical grey matter lesion subtypes in relapse-onset multiple sclerosis. J Neurol Neurosurg Psychiatry (2016) 87:750–3. doi:10.1136/jnnp-2015-311102
6. Ceccarelli A, Rocca MA, Neema M, Martinelli V, Arora A, Tauhid S, et al. Deep gray matter T2 hypointensity is present in patients with clinically isolated syndromes suggestive of multiple sclerosis. Mult Scler (2010) 16(1):39–44. doi:10.1177/1352458509350310
7. Bakshi R, Dandamudi VS, Neema M, De C, Bermel RA. Measurement of brain and spinal cord atrophy by magnetic resonance imaging as a tool to monitor multiple sclerosis. J Neuroimaging (2006) 15(4 Suppl):30S–45S. doi:10.1177/1051228405283901
8. Filippi M, Rocca MA, Arnold DL, Bakshi R, Barkhof F, De Stefano N, et al. EFNS guidelines on the use of neuroimaging in the management of multiple sclerosis. Eur J Neurol (2006) 13(4):313–25. doi:10.1111/j.1468-1331.2006.01543.x
9. Kosa P, Komori M, Waters R, Wu T, Cortese I, Ohayon J, et al. Novel composite MRI scale correlates highly with disability in multiple sclerosis patients. Mult Scler Relat Disord (2015) 4(6):526–35. doi:10.1016/j.msard.2015.08.009
10. Wolinsky JS, Narayana PA, Johnson KP. United States open-label glatiramer acetate extension trial for relapsing multiple sclerosis: MRI and clinical correlates. Mult Scler (2001) 7(1):33–41. doi:10.1177/135245850100700107
11. Bakshi R, Neema M, Healy BC, Liptak Z, Betensky RA, Buckle GJ, et al. Predicting clinical progression in multiple sclerosis with the magnetic resonance disease severity scale. Arch Neurol (2008) 65(11):1449–53. doi:10.1001/archneur.65.11.1449
12. Moodie J, Healy B, Buckle G, Gauthier S, Glanz B, Arora A, et al. Magnetic resonance disease severity scale (MRDSS) for patients with multiple sclerosis: a longitudinal study. J Neurol Sci (2012) 315(1):49–54. doi:10.1016/j.jns.2011.11.040
13. Bakshi R, Neema M, Tauhid S, Healy BC, Glanz BI, Kim G, et al. An expanded composite scale of MRI-defined disease severity in multiple sclerosis: MRDSS2. Neuroreport (2014) 25(14):1156–61. doi:10.1097/WNR.0000000000000244
14. Nelson F, Poonawalla AH, Datta S, Banuelos RC, Rahbar MH. Association of multiple sclerosis related cognitive impairment with an MRI-derived composite score. J Mult Scler (2015) 2:1. doi:10.4172/2376-0389.1000124
15. Kim G, Tauhid S, Dupuy SL, Tummala S, Khalid F, Healy BC, et al. An MRI-defined measure of cerebral lesion severity to assess therapeutic effects in multiple sclerosis. J Neurol (2016) 263(3):531–8. doi:10.1007/s00415-015-8009-8
16. Bakshi R, Thompson AJ, Rocca MA, Pelletier D, Dousset V, Barkhof F, et al. MRI in multiple sclerosis: current status and future prospects. Lancet Neurol (2008) 7(7):615–25. doi:10.1016/S1474-4422(08)70137-6
17. Sharma J, Sanfilipo MP, Benedict RH, Weinstock-Guttman B, Munschauer FE, Bakshi R. Whole-brain atrophy in multiple sclerosis measured by automated versus semiautomated MR imaging segmentation. AJNR Am J Neuroradiol (2004) 25(6):985–96.
18. Glanz BI, Healy BC, Rintell DJ, Jaffin SK, Bakshi R, Weiner HL. The association between cognitive impairment and quality of life in patients with early multiple sclerosis. J Neurol Sci (2010) 290(1):75–9. doi:10.1016/j.jns.2009.11.004
19. Calabrese M, Favaretto A, Martini V, Gallo P. Grey matter lesions in MS: from histology to clinical implications. Prion (2013) 7(1):20–7. doi:10.4161/pri.22580
20. Seewann A, Kooi EJ, Roosendaal SD, Pouwels PJ, Wattjes MP, Van der Valk P, et al. Postmortem verification of MS cortical lesion detection with 3D DIR. Neurology (2012) 78(5):302–8. doi:10.1212/WNL.0b013e31824528a0
21. Calabrese M, Rocca MA, Atzori M, Mattisi I, Bernardi V, Favaretto A, et al. Cortical lesions in primary progressive multiple sclerosis A 2-year longitudinal MR study. Neurology (2009) 72(15):1330–6. doi:10.1212/WNL.0b013e3181a0fee5
22. Calabrese M, Agosta F, Rinaldi F, Mattisi I, Grossi P, Favaretto A, et al. Cortical lesions and atrophy associated with cognitive impairment in relapsing-remitting multiple sclerosis. Arch Neurol (2009) 66(9):1144–50. doi:10.1001/archneurol.2009.174
23. Calabrese M, Rocca MA, Atzori M, Mattisi I, Favaretto A, Perini P, et al. A 3-year magnetic resonance imaging study of cortical lesions in relapse-onset multiple sclerosis. Ann Neurol (2010) 67(3):376–83. doi:10.1002/ana.21906
24. Calabrese M, Poretto V, Favaretto A, Alessio S, Bernardi V, Romualdi C, et al. Cortical lesion load associates with progression of disability in multiple sclerosis. Brain (2012) 135(10):2952–61. doi:10.1093/brain/aws246
25. Harrison DM, Roy S, Oh J, Izbudak I, Pham D, Courtney S, et al. Association of cortical lesion burden on 7-T magnetic resonance imaging with cognition and disability in multiple sclerosis. JAMA Neurol (2015) 72(9):1004–12. doi:10.1001/jamaneurol.2015.1241
26. Lazeron RH, Langdon DW, Filippi M, van Waesberghe JH, Stevenson VL, Boringa JB, et al. Neuropsychological impairment in multiple sclerosis patients: the role of (juxta) cortical lesion on FLAIR. Mult Scler (2000) 6(4):280–5. doi:10.1177/135245850000600410
27. Mike A, Glanz BI, Hildenbrand P, Meier D, Bolden K, Liguori M, et al. Identification and clinical impact of multiple sclerosis cortical lesions as assessed by routine 3T MR imaging. AJNR Am J Neuroradiol (2011) 32(3):515–21. doi:10.3174/ajnr.A2340
28. Roosendaal SD, Moraal B, Pouwels PJ, Vrenken H, Castelijns JA, Barkhof F, et al. Accumulation of cortical lesions in MS: relation with cognitive impairment. Mult Scler (2009) 15(6):708–14. doi:10.1177/1352458509102907
29. Rovaris M, Filippi M, Minicucci L, Iannucci G, Santuccio G, Possa F, et al. Cortical/subcortical disease burden and cognitive impairment in patients with multiple sclerosis. AJNR Am J Neuroradiol (2000) 21(2):402–8.
30. Papadopoulou A, Müller-Lenke N, Naegelin Y, Kalt G, Bendfeldt K, Kuster P, et al. Contribution of cortical and white matter lesions to cognitive impairment in multiple sclerosis. Mult Scler (2013) 19(10):1290–6. doi:10.1177/1352458513475490
31. Nelson F, Datta S, Garcia N, Rozario NL, Perez F, Cutter G, et al. Intracortical lesions by 3T magnetic resonance imaging and correlation with cognitive impairment in multiple sclerosis. Mult Scler (2011) 17(9):1122–9. doi:10.1177/1352458511405561
32. Bakshi R, Ariyaratana S, Benedict RH, Jacobs L. Fluid-attenuated inversion recovery magnetic resonance imaging detects cortical and juxtacortical multiple sclerosis lesions. Arch Neurol (2001) 58(5):742–8. doi:10.1001/archneur.58.5.742
33. Kurtzke JF. Rating neurologic impairment in multiple sclerosis an expanded disability status scale (EDSS). Neurology (1983) 33(11):1444–52. doi:10.1212/WNL.33.11.1444
34. Fischer JS, Rudick RA, Cutter GR, Reingold SC. The multiple sclerosis functional composite measure (MSFC): an integrated approach to MS clinical outcome assessment. Mult Scler (1999) 5(4):244–50. doi:10.1177/135245859900500409
35. Stankiewicz JM, Glanz BI, Healy BC, Arora A, Neema M, Benedict RH, et al. Brain MRI lesion load at 1.5 T and 3T versus clinical status in multiple sclerosis. J Neuroimaging (2011) 21(2):e50–6. doi:10.1111/j.1552-6569.2009.00449.x
36. Benedict RH, Cookfair D, Gavett R, Gunther M, Munschauer F, Garg N, et al. Validity of the minimal assessment of cognitive function in multiple sclerosis (MACFIMS). J Int Neuropsychol Soc (2006) 12(4):549–58. doi:10.1017/S1355617706060723
37. Carleton RN, Thibodeau MA, Teale MJ, Welch PG, Abrams MP, Robinson T, et al. The center for epidemiologic studies depression scale: a review with a theoretical and empirical examination of item content and factor structure. PLoS One (2013) 8(3):e58067. doi:10.1371/journal.pone.0058067
38. Ceccarelli A, Jackson JS, Tauhid S, Arora A, Gorky J, Dell’Oglio E, et al. The impact of lesion in-painting and registration methods on voxel-based morphometry in detecting regional cerebral gray matter atrophy in multiple sclerosis. AJNR Am J Neuroradiol (2012) 33(8):1579–85. doi:10.3174/ajnr.A3083
39. Maes F, Collignon A, Vandermeulen D, Marchal G, Suetens P. Multimodality image registration by maximization of mutual information. IEEE Trans Med Imaging (1997) 16(2):187–98. doi:10.1109/42.563664
40. Kidd D, Barkhof F, McConnell R, Algra PR, Allen IV, Revesz T. Cortical lesions in multiple sclerosis. Brain (1999) 122(Pt 1):17–26. doi:10.1093/brain/122.1.17
41. Dell’Oglio E, Ceccarelli A, Glanz BI, Healy BC, Tauhid S, Arora A, et al. Quantification of global cerebral atrophy in multiple sclerosis from 3T MRI using SPM: the role of misclassification errors. J Neuroimaging (2015) 25(2):191–9. doi:10.1111/jon.12194
42. Horsfield MA, Sala S, Neema M, Absinta M, Bakshi A, Sormani MP, et al. Rapid semi-automatic segmentation of the spinal cord from magnetic resonance images: application in multiple sclerosis. Neuroimage (2010) 50(2):446–55. doi:10.1016/j.neuroimage.2009.12.121
43. Kim G, Khalid F, Oommen VV, Tauhid S, Chu R, Horsfield MA, et al. T1-vs. T2-based MRI measures of spinal cord volume in healthy subjects and patients with multiple sclerosis. BMC Neurol (2015) 15:124. doi:10.1186/s12883-015-0387-0
44. Bagnato F, Salman Z, Kane R, Auh S, Cantor FK, Ehrmantraut M, et al. T1 cortical hypointensities and their association with cognitive disability in multiple sclerosis. Mult Scler (2010) 16(10):1203–12. doi:10.1177/1352458510377223
45. Kolber P, Montag S, Fleischer V, Luessi F, Wilting J, Gawehn J, et al. Identification of cortical lesions using DIR and FLAIR in early stages of multiple sclerosis. J Neurol (2015) 262(6):1473–82. doi:10.1007/s00415-015-7724-5
46. Rocca MA, De Meo E, Amato MP, Copetti M, Moiola L, Ghezzi A, et al. Cognitive impairment in paediatric multiple sclerosis patients is not related to cortical lesions. Mult Scler (2015) 21(7):956–9. doi:10.1177/1352458514557303
47. Houtchens MK, Benedict RH, Killiany R, Sharma J, Jaisani Z, Singh B, et al. Thalamic atrophy and cognition in multiple sclerosis. Neurology (2007) 69(12):1213–23. doi:10.1212/01.wnl.0000276992.17011.b5
48. Sanfilipo MP, Benedict RH, Sharma J, Weinstock-Guttman B, Bakshi R. The relationship between whole brain volume and disability in multiple sclerosis: a comparison of normalized gray vs. white matter with misclassification correction. Neuroimage (2005) 26(4):1068–77. doi:10.1016/j.neuroimage.2005.03.008
49. Amato MP, Razzolini L, Goretti B, Stromillo ML, Rossi F, Giorgio A, et al. Cognitive reserve and cortical atrophy in multiple sclerosis A longitudinal study. Neurology (2013) 80(19):1728–33. doi:10.1212/WNL.0b013e3182918c6f
50. Benedict RH, Carone DA, Bakshi R. Correlating brain atrophy with cognitive dysfunction, mood disturbances, and personality disorder in multiple sclerosis. J Neuroimaging (2004) 14(3 Suppl):36S–45S. doi:10.1111/j.1552-6569.2004.tb00277.x
51. Koenig KA, Sakaie KE, Lowe MJ, Lin J, Stone L, Bermel RA, et al. Hippocampal volume is related to cognitive decline and fornicial diffusion measures in multiple sclerosis. Magn Reson Imaging (2014) 32(4):354–8. doi:10.1016/j.mri.2013.12.012
52. Kuceyeski AF, Vargas W, Dayan M, Monohan E, Blackwell C, Raj A, et al. Modeling the relationship among gray matter atrophy, abnormalities in connecting white matter, and cognitive performance in early multiple sclerosis. AJNR Am J Neuroradiol (2015) 36(4):702–9. doi:10.3174/ajnr.A4165
53. Lazeron RH, Boringa JB, Schouten M, Uitdehaag BM, Bergers E, Lindeboom J, et al. Brain atrophy and lesion load as explaining parameters for cognitive impairment in multiple sclerosis. Mult Scler (2005) 11(5):524–31. doi:10.1191/1352458505ms1201oa
54. Shiee N, Bazin PL, Zackowski KM, Farrell SK, Harrison DM, Newsome SD, et al. Revisiting brain atrophy and its relationship to disability in multiple sclerosis. PLoS One (2012) 7(5):e37049. doi:10.1371/journal.pone.0037049
55. Sicotte NL, Kern KC, Giesser BS, Arshanapalli A, Schultz A, Montag M, et al. Regional hippocampal atrophy in multiple sclerosis. Brain (2008) 131(Pt 4): 1134–41. doi:10.1093/brain/awn030
56. Inglese M, Oesingmann N, Casaccia P, Fleysher L. Progressive multiple sclerosis and gray matter pathology: an MRI perspective. Mt Sinai J Med (2011) 78(2):258–67. doi:10.1002/msj.20247
57. Rocca MA, Horsfield MA, Sala S, Copetti M, Valsasina P, Mesaros S, et al. A multicenter assessment of cervical cord atrophy among MS clinical phenotypes. Neurology (2011) 76(24):2096–102. doi:10.1212/WNL.0b013e31821f46b8
58. Lin X, Tench CR, Evangelou N, Jaspan T, Constantinescu CS. Measurement of spinal cord atrophy in multiple sclerosis. J Neuroimaging (2004) 14(3 Suppl):20S–6S. doi:10.1111/j.1552-6569.2004.tb00275.x
59. Cohen AB, Neema M, Arora A, Dell’Oglio E, Benedict RH, Tauhid S, et al. The relationships among MRI-defined spinal cord involvement, brain involvement, and disability in multiple sclerosis. J Neuroimaging (2012) 22(2):122–8. doi:10.1111/j.1552-6569.2011.00589.x
60. Schlaeger R, Papinutto N, Panara V, Bevan C, Lobach IV, Bucci M, et al. Spinal cord gray matter atrophy correlates with multiple sclerosis disability. Ann Neurol (2014) 76(4):568–80. doi:10.1002/ana.24241
61. Oh J, Seigo M, Saidha S, Sotirchos E, Zackowski K, Chen M, et al. Spinal cord normalization in multiple sclerosis. J Neuroimaging (2014) 24(6):577–84. doi:10.1111/jon.12097
62. Zivadinov R, Bakshi R. Role of MRI in multiple sclerosis I: inflammation and lesions. Front Biosci (2004) 9:665–83. doi:10.2741/1251
63. Van Walderveen MA, à Nijeholt GJ, Ader HJ, Jongen PJ, Polman CH, Castelijns JA, et al. Hypointense lesions on T1-weighted spin-echo magnetic resonance imaging: relation to clinical characteristics in subgroups of patients with multiple sclerosis. Arch Neurol (2001) 58(1):76–81. doi:10.1001/archneur.58.1.76
64. Truyen L, Van Waesberghe JH, Van Walderveen MA, Van Oosten BW, Polman CH, Hommes OR, et al. Accumulation of hypointense lesions (“black holes”) on T1 spin-echo MRI correlates with disease progression in multiple sclerosis. Neurology (1996) 47(6):1469–76. doi:10.1212/WNL.47.6.1469
65. Sanfilipo MP, Benedict RH, Weinstock-Guttman B, Bakshi R. Gray and white matter brain atrophy and neuropsychological impairment in multiple sclerosis. Neurology (2006) 66(5):685–92. doi:10.1212/01.wnl.0000201238.93586.d9
66. Giorgio A, De Stefano N. Cognition in multiple sclerosis: relevance of lesions, brain atrophy and proton MR spectroscopy. Neurol Sci (2010) 31(Suppl 2):S245–8. doi:10.1007/s10072-010-0370-x
67. Bot JC, Barkhof F, Polman CH, à Nijeholt GL, De Groot V, Bergers E, et al. Spinal cord abnormalities in recently diagnosed MS patients added value of spinal MRI examination. Neurology (2004) 62(2):226–33. doi:10.1212/WNL.62.2.226
68. Sombekke MH, Lukas C, Crusius JB, Tejedor D, Killestein J, Arteta D, et al. HLA-DRB1* 1501 and spinal cord magnetic resonance imaging lesions in multiple sclerosis. Arch Neurol (2009) 66(12):1531–6. doi:10.1001/archneurol.2009.278
69. Stromnes IM, Cerretti LM, Liggitt D, Harris RA, Goverman JM. Differential regulation of central nervous system autoimmunity by TH1 and TH17 cells. Nat Med (2008) 14(3):337–42. doi:10.1038/nm1715
70. Tauhid S, Neema M, Healy BC, Weiner HL, Bakshi R. MRI phenotypes based on cerebral lesions and atrophy in patients with multiple sclerosis. J Neurol Sci (2014) 346(1–2):250–4. doi:10.1016/j.jns.2014.08.047
71. Calabrese M, Favaretto A, Poretto V, Romualdi C, Rinaldi F, Mattisi I, et al. Low degree of cortical pathology is associated with benign course of multiple sclerosis. Mult Scler (2013) 19(7):904–11. doi:10.1177/1352458512463767
72. Fartaria MJ, Bonnier G, Roche A, Kober T, Meuli R, Rotzinger D, et al. Automated detection of white matter and cortical lesions in early stages of multiple sclerosis. J Magn Reson Imaging (2016) 43(6):1445–54. doi:10.1002/jmri.25095
73. Favaretto A, Poggiali D, Lazzarotto A, Rolma G, Causin F, Gallo P. The parallel analysis of phase sensitive inversion recovery (PSIR) and double inversion recovery (DIR) images significantly improves the detection of cortical lesions in multiple sclerosis (MS) since clinical onset. PLoS One (2015) 10(5):e0127805. doi:10.1371/journal.pone.0127805
74. Sethi V, Yousry TA, Muhlert N, Ron M, Golay X, Wheeler-Kingshott C, et al. Improved detection of cortical MS lesions with phase-sensitive inversion recovery MRI. J Neurol Neurosurg Psychiatry (2012) 83(9):877–82. doi:10.1136/jnnp-2012-303023
75. Nelson F, Poonawalla AH, Hou P, Huang F, Wolinsky JS, Narayana PA. Improved identification of intracortical lesions in multiple sclerosis with phase-sensitive inversion recovery in combination with fast double inversion recovery MR imaging. AJNR Am J Neuroradiol (2007) 28(9):1645–9. doi:10.3174/ajnr.A0645
76. Nielsen AS, Kinkel RP, Tinelli E, Benner T, Cohen-Adad J, Mainero C. Focal cortical lesion detection in multiple sclerosis: 3 tesla DIR versus 7 tesla FLASH-T2. J Magn Reson Imaging (2012) 35(3):537–42. doi:10.1002/jmri.22847
77. Tallantyre EC, Morgan PS, Dixon JE, Al-Radaideh A, Brookes MJ, Morris PG, et al. 3 Tesla and 7 Tesla MRI of multiple sclerosis cortical lesions. J Magn Reson Imaging (2010) 32(4):971–7. doi:10.1002/jmri.22115
78. Bluestein KT, Pitt D, Sammet S, Zachariah CR, Nagaraj U, Knopp MV, et al. Detecting cortical lesions in multiple sclerosis at 7T using white matter signal attenuation. Magn Reson Imaging (2012) 30(7):907–15. doi:10.1016/j.mri.2012.03.006
Keywords: brain, cortical lesions, multiple sclerosis, cognition, brain atrophy, MRI, physical disability, spinal cord
Citation: Yousuf F, Kim G, Tauhid S, Glanz BI, Chu R, Tummala S, Healy BC and Bakshi R (2016) The Contribution of Cortical Lesions to a Composite MRI Scale of Disease Severity in Multiple Sclerosis. Front. Neurol. 7:99. doi: 10.3389/fneur.2016.00099
Received: 14 April 2016; Accepted: 13 June 2016;
Published: 29 June 2016
Edited by:
Mike P. Wattjes, VU University Medical Center, NetherlandsReviewed by:
Carsten Lukas, Ruhr-University Bochum, GermanyVeronica Popescu, Rehabilitation and MS Centre Overpelt, Belgium
Copyright: © 2016 Yousuf, Kim, Tauhid, Glanz, Chu, Tummala, Healy and Bakshi. This is an open-access article distributed under the terms of the Creative Commons Attribution License (CC BY). The use, distribution or reproduction in other forums is permitted, provided the original author(s) or licensor are credited and that the original publication in this journal is cited, in accordance with accepted academic practice. No use, distribution or reproduction is permitted which does not comply with these terms.
*Correspondence: Rohit Bakshi, rbakshi@post.harvard.edu