
- Department of Psychology, New York University, New York, NY, USA
The classical concept of efference copies in the context of internal forward models has stimulated productive research in cognitive science and neuroscience. There are compelling reasons to argue for such a mechanism, but finding direct evidence in the human brain remains difficult. Here we investigate the dynamics of internal forward models from an unconventional angle: mental imagery, assessed while recording high temporal resolution neuronal activity using magnetoencephalography. We compare two overt and covert tasks; our covert, mental imagery tasks are unconfounded by overt input/output demands – but in turn necessitate the development of appropriate multi-dimensional topographic analyses. Finger tapping (studies 1 and 2) and speech experiments (studies 3–5) provide temporally constrained results that implicate the estimation of an efference copy. We suggest that one internal forward model over parietal cortex subserves the kinesthetic feeling in motor imagery. Secondly, observed auditory neural activity ∼170 ms after motor estimation in speech experiments (studies 3–5) demonstrates the anticipated auditory consequences of planned motor commands in a second internal forward model in imagery of speech production. Our results provide neurophysiological evidence from the human brain in favor of internal forward models deploying efference copies in somatosensory and auditory cortex, in finger tapping and speech production tasks, respectively, and also suggest the dynamics and sequential updating structure of internal forward models.
Introduction
How do motor and sensory systems interact with cognitive systems to allow for an effective exchange of information between input and output operations? One of the influential theories proposed to address this challenge of mapping between potentially disparate “representational coordinate systems” builds on the concept of internal forward models. Forward models incorporate at their core the presupposition that neural systems internally simulate motor (output) commands and predict their perceptual consequences (for review see Wolpert and Ghahramani, 2000). This concept has – since the elaboration of the notions of efference copy and “corollary discharge” by von Holst and Mittelstaedt (1950, 1973), based on suggestions by von Helmholtz (1910) – elicited considerable theoretical interest and stimulated experimental research in neuroscience, including in motor control (for reviews see Miall and Wolpert, 1996; Kawato, 1999; Wolpert and Ghahramani, 2000), perception (e.g., Sommer and Wurtz, 2006; for review see Sommer and Wurtz, 2008), and different aspects of cognition (for reviews see Blakemore and Decety, 2001; Grush, 2004; Desmurget and Sirigu, 2009). Most direct evidence for forward models has been obtained in animal preparations (e.g., Troyer and Doupe, 2000; Sommer and Wurtz, 2002) or patient studies (e.g., Desmurget et al., 2009). Evidence for this important mechanism from healthy human participants is rare, although data from a variety of behavioral (e.g., Sabes, 2000) and cognitive neuroscience experiments are providing tantalizing hints (e.g., Salmelin et al., 2000; Houde et al., 2002; van Wassenhove et al., 2005; Skipper et al., 2007).
Multiple internal forward models have been hypothesized in the online control of speech production. Guenther and colleagues have proposed an elegant architecture, the Directions Into Velocities of Articulators (DIVA) model, to account for speech production and motor learning in articulation (Guenther, 1995; Guenther et al., 1998, 2006). In their model, an efference copy of a motor command is used to constrain further motor preparation (Guenther et al., 1998) and an additional auditory efference copy is used to predict the possible auditory outcome (Guenther et al., 2006). Similar models are proposed by Houde (Houde et al., 2007; Ventura et al., 2009) and Rauschecker and Scott (2009). We further elaborate a possible motor control dynamics in Figure 1. The red shaded area highlights the proposed two internal forward models. The first model estimates what the motor state would be after executing the target motor commands. The second model predicts the sensory consequences induced by the estimation of first forward model. In speech production, the status of the vocal apparatus is estimated by the first, the auditory output is predicted by the second model. The motor state is further updated following the signal calculated by taking account of three inputs (in green shaded area): the motor prediction from the first forward model, the somatosensory feedback, and the desired motor state which would compensate the discrepancy between the target auditory output, and actual auditory feedback.
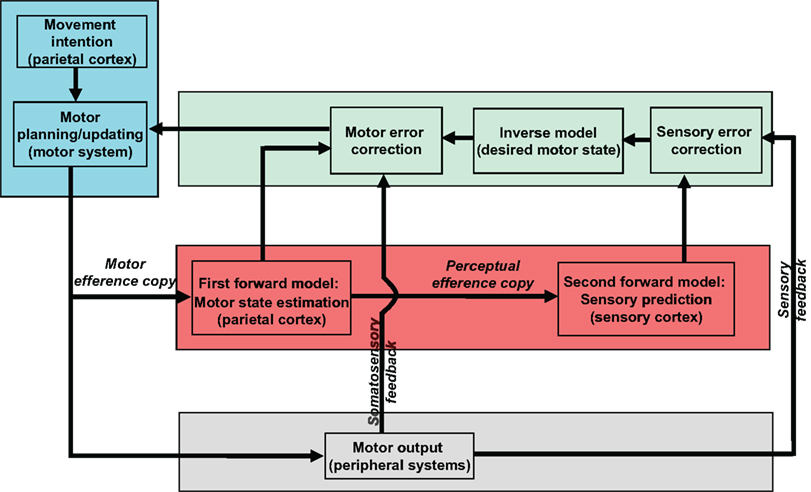
Figure 1. The model of motor control based on internal forward models and feedback. Four different components are included. The motor commands are first planned according to the intended movement (the blue shaded area). While the planned signal is sent to the peripheral motor system (the gray shaded area) to execute, a copy of such signal (motor efference copy) is available for the first internal forward model to estimate the following motor state (in red shaded area). A second efference copy, perceptual efference copy, is send to the second internal forward model to predict the perceptual consequence of such motor estimation (in red shaded area). The motor state will be updated according to both the estimated motor state and predicted perceptual consequence as well as the actual somatosensory and perceptual feedback (the green shaded area).
In the experiments described here, we assessed the dynamics of the proposed internal forward models from a new, unconventional perspective: we used a high temporal resolution recording technique, magnetoencephalography (MEG), while participants execute mental imagery paradigms in two different domains (finger tapping, overt and covert speech). We pursued a parallel agenda. First, because the neurophysiological activity underlying mental imagery is not precisely time-locked, we developed a paradigm and analysis that permit the characterization of the neuronal patterns underlying imagery. We first explored the utility of this approach using a simple finger tapping/motor imagery study. This provided temporally constrained data for the interpretation of the neural basis of motor imagery based on the dynamics of the first internal forward model (Figure 1). Next, we replicated and extended this approach using imagery in speech perception and production, testing the dynamics of the second internal forward model. The data provide neurophysiological evidence in favor of an internal forward model in the context of covert speech production, and specifically, a time-locked auditory efference copy.
Mental imagery is a widely investigated aspect of cognition, and research on this topic has provided important insights into the nature of mental representation and has provoked significant debate in psychology and the cognitive sciences (Pylyshyn, 1981, 2003; Kosslyn, 1994; Kosslyn et al., 2001). With the advent of non-invasive recording techniques, many imagery studies have been revisited in the context of neuroimaging. For example, motor imagery studies have an established history (e.g., Jeannerod, 1995; Parsons et al., 1995; Porro et al., 1996; Pfurtscheller and Neuper, 1997). The essence of mental imagery is to induce a quasi-perceptual subjective experience without external stimulus input (perceptual imagery) or overt action (motor imagery). The central assumption – that people can simulate perception and action internally (Hesslow, 2002) – is supported by multiple lines of evidence. In particular, a parietal–frontal network that mediates motor control is activated during motor imagery (Porro et al., 1996, 2000; Deiber et al., 1998; Lotze et al., 1999; Gerardin et al., 2000; Ehrsson et al., 2003; Hanakawa et al., 2003; Dechent et al., 2004; Meister et al., 2004) and activity in perception-related cortical areas is observed during visual imagery (e.g., Wheeler et al., 2000; Ishai et al., 2002; Ganis et al., 2004; Mazard et al., 2005; Slotnick et al., 2005) and auditory imagery (e.g., Zatorre et al., 1996; Wheeler et al., 2000; Schürmann et al., 2002; Halpern et al., 2004; Aleman et al., 2005; Bunzeck et al., 2005; Kraemer et al., 2005).
A recent theory proposes that motor awareness is not merely the result of action execution, but includes the somatosensory consequences estimated internally from the efference copy of planned motor commands, in posterior parietal regions (Desmurget and Sirigu, 2009). Grush (2004) further proposes, based on the notion of a Kalman filter, that the proprioceptive and kinesthetic sensations produced during motor imagery are the consequences of emulation of planned motor commands. Indeed, a direct electrical stimulation study has demonstrated that the intention to move can be transformed to the false belief of moving by increasing the intensity of electrical cortical stimulation over parietal regions (Desmurget et al., 2009). In that case, it remained unclear whether motor awareness was caused by high stimulation intensity or prolonged activation of neural assemblies in posterior parietal cortex. Hence, temporally constrained evidence can provide a novel test for the hypothesis that the kinesthetic feeling in motor imagery is caused by the internal prediction of motor status from an efference copy – the estimation results of the first internal forward model (Figure 1).
A critical assumption of the theory concerns the sequential updating structure of forward models (Kawato, 1999; Hesslow, 2002; Schubotz, 2007). Specifically, a sensory consequence can be predicted based on the previous internal estimate, and this process can be iterated ad infinitum. One example of such recurrent estimation, in the context of speech production, can be found based on the proposed model (Figure 1), namely the hypothesis of an auditory efference copy used to evaluate the auditory consequences of articulation, as the result of the second internal forward model, subsequent to the estimation of articulatory motor commands. Some evidence has already been marshaled to support the existence of an auditory efference copy in speech production. For example, overt speech usually has dampening effects on simultaneously presented auditory stimuli (Numminen et al., 1999; Curio et al., 2000; Houde et al., 2002), and such speaking-induced response suppression has been argued to point to auditory efference copies. Recently, it has been demonstrated that the tasks of lipreading and covert speech can induce a similar suppression of the auditory responses to pure tones (Kauramaki et al., 2010). In a different type of design, when auditory feedback generated by self-produced speech was blocked by white noise, associative auditory cortex activity (possibly the auditory efference copy) was still present in PET results (Paus et al., 1996). We submit that it is challenging to provide direct evidence supporting the existence of auditory efference copies during overt articulation. Covert speech, or articulation imagery, on the other hand, could constitute a suitable protocol to investigate the forward model and recurrent estimation predictions, because of the absence of auditory feedback and proprioceptive cues. On the premise that motor commands are formed during articulation imagery, the potential auditory consequences can then be estimated in such an imagery task.
We used mental imagery paradigms while recording whole-head MEG, with two goals. First, we tested the estimation of motor commands in finger motor imagery and articulation motor imagery. Finger tapping experiments (Experiments 1 and 2) and speech production experiments (Experiments 3–5) were conducted to provide temporally constrained results in the investigation of whether the estimation of an efference copy during motor planning subserves the kinesthetic feeling in motor imagery (the results of the first internal forward model). Our guiding hypothesis is that activity in parietal regions will be observed during motor imagery, and that what underlies the kinesthetic feeling is the computation of estimating the somatosensory consequence from the efference copy. Second, we investigated the viability of an auditory efference copy (the results of the second internal forward model) in speech production (Experiments 3–5). We hypothesized that the auditory consequences of articulation imagery should be visible in auditory cortex, similar to the activity evoked by auditory stimuli, and should be observed after the response latency of motor imagery. MEG was used in all experiments because its temporal resolution and suitable spatial resolution provide neurophysiological data at an appropriate granularity.
Materials and Methods
Participants
Twelve volunteers (six males, mean age 27.4 years, range 20–42 years) participated in Experiments 1 and 2, ten volunteers (four males, mean age 26.7 years and range 19–42 years) participated in Experiments 3 and 4 and eight volunteers (seven males, mean age 27.0 years and range 22–42 years) participated in Experiment 5, after providing written informed consent. Four volunteers participated in all experiments. All participants were compensated. All participants were right handed, with no history of neurological disorders. This study was approved by the University of Maryland Institutional Review Board (IRB); the data were acquired in the University of Maryland Cognitive Neuroscience of Language Laboratory.
Materials
A 1-kHz 50 ms duration sinusoidal tone was used as an auditory cue in Experiments 1–4. In Experiment 5, four pictures were projected on a screen (inside the MEG shielded room) as visual cues. Each image was presented foveally, against a black background, and subtended less than 3° visual angle. All stimuli were presented using PsyScope software (Version 1.2.5). A non-magnetic microphone was used in Experiments 3–5 to record vocalizations. The times at which the amplitude of vocal signals reached the default threshold in the software were used as markers to label the onset of speech movement and obtain reaction times.
Experimental Procedure
In Experiments 1 and 2 (finger tapping; Figures 2A,B), two blocks with different tasks (“execution” and “imagery”) were run. In the execution task block, participants were asked to press a button (six using their right thumb, six using their right index finger). In the imagery task block, participants were asked to imagine the same button press movement, from a kinesthetic first-person perspective. Experiments 1 and 2 were designed to exploit the temporal resolution of MEG and attempt to isolate in time the salient internal aspects of the task. Therefore, we incorporated auditory cues, to “anchor” the responses in time and space. In Experiment 1, participants were asked to respond after a single tone cue at a comfortable pace and were encouraged to respond at a similar pace across trials. In Experiment 2, a series of three tones were presented with a constant inter-stimulus interval (ISI) of 1 s. Participants were asked to respond after the third tone, following the temporal interval formed by the preceding tones. This provides an even more constrained temporal pacing cue.
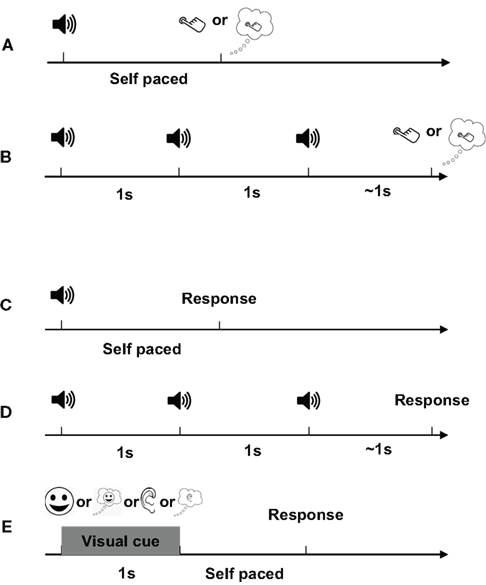
Figure 2. Experimental design. A single trial in each experiment is depicted. (A) Experiment 1. The trial begins with a 50-ms 1-kHz tone and participants respond either by pressing a button (execution) or by imagining pressing a button (imagery), at a constant, comfortable pace. (B) Experiment 2. Three 50-ms 1-kHz sinusoidal tones occur in a sequence at a constant pace (1/s). Participants are instructed to attend to the tempo of the tones and asked to respond either by pressing a button or by imaging pressing a button with the same pace. (C,D) Experiments 3 and 4. The procedure was identical to Experiments 1 and 2, respectively, except the tasks were different. Four different tasks that are pre-determined in each block are included in each experiment and presented in fixed order: articulation (A), articulation imagery (IA), hearing (H), and hearing imagery (IH). In A and IA, participants are instructed to either pronounce or imagine pronouncing the syllable [da]. In H, participants are instructed to passively listen to the vocalization of syllable [da] that are either in a male or female voice, in a random order. In IH, participants are instructed to imagine hearing the voice by opposite sex that they just heard in H. Notice that in Experiments 3 and 4, there is no preceding cue before the auditory stimuli in the hearing task. (E) Experiment 5. Four different pictures are used to indicate different tasks. In each trial, the visual cue is on screen for 1 s. Participants are instructed to respond after the offset of visual cues.
Experiments 3–5 (Figures 2C–E) included four task blocks (articulation, articulation imagery, hearing, and hearing imagery). In the overt articulation task block, participants were asked to pronounce the syllable [da] (minimizing jaw movement). In the covert articulation task block, participants were asked to imagine pronouncing the same syllable. In the overt hearing task, participants passively listened to auditory signals [da], with half of the trials in a male voice, half a female voice (sampling rate of 44100 Hz, 16 bit resolution, 500 ms duration). All sounds were equalized [root mean square (RMS) energy] and adjusted to sound pressure level of ∼70 dB SL. In the hearing imagery block, participants were instructed to imagine hearing the opposite sex saying the same syllable that they just heard (i.e., male participants imagine female voice and vice versa). The procedures of Experiments 3 and 4 were the same as Experiments 1 and 2, respectively, except that in the overt hearing block, auditory stimuli were presented without any preceding cues.
Because of possible auditory adaptation or the potential interaction between hearing and articulation when using auditory cues, four different visual cues (each indicating one task) were used in Experiment 5 (Figure 2E). The visual cues were presented for 1 s and participants instructed to respond after the offset of visual cues. The tasks were the same as in Experiments 3 and 4.
In all five experiments, each task block consisted of 100 trials. The intervals between trials were randomized between 1500 and 2500 ms in Experiments 1 and 2, and between 2500 and 4000 ms in Experiments 3–5 with 500 ms increments. Participants were encouraged to respond at a similar pace across trials and blocks in each experiment.
MEG Recording
Neuromagnetic signals were measured using a 160-channel whole-head axial gradiometer system (KIT, Kanazawa, Japan). Five electromagnetic coils were attached to a participant’s head to monitor head position during MEG recording. The locations of the coils were determined with respect to three anatomical landmarks (nasion, left and right preauricular points) on the scalp using 3D digitizer software (Source Signal Imaging, Inc.) and digitizing hardware (Polhemus, Inc.). The coils were localized with respect to the MEG sensors, at both the beginning and the end of the experiment. The mean distance between pre- and post-experiment coil location was less than 5 mm with SEM less than 0.62 mm in all experiments. Such small distance demonstrated that the head positions did not change much throughout the experiments.
Before the main experiment, participants listened to a 250-Hz and 1-kHz 50 ms sinusoidal tone (ISI randomized between 750 and 1550 ms), with 100 repetitions for each stimulus frequency. Auditory-evoked responses were examined, and the auditory M100 was identified. The auditory M100 is a prominent and robust response, observed around 100 ms after auditory stimulus onset and has been a widely investigated auditory MEG response (for review see Roberts et al., 2000). The characteristic topographic map associated with the M100 was identified for each participant. These auditory spatial patterns were used to verify whether participants were in an advantageous recording position.
The MEG data were acquired with a sampling rate of 1000 Hz, filtered online between DC and 200 Hz, with a notch at 60 Hz. Raw data were noise-reduced offline using the time-shifted PCA method (de Cheveigné and Simon, 2007). In each condition, a 2000-ms time period that was time locked to the auditory cue (in Experiments 1 and 3) or time locked to the last tone onset (in Experiments 2 and 4) or time locked to the offset of visual cue (Experiment 5) was extracted and averaged over all the trials for each participant (cue-locked). In a different analysis, a 1000-ms epoch time locked to the button press (in Experiments 1 and 2 execution tasks only) or time locked to the onset of vocalization (in Experiments 3–5 articulation tasks only) was extracted and averaged (execution-locked). Trials with amplitudes >3 pT (∼5%) were considered artifacts and discarded. The averages were low-pass filtered with cutoff frequency of 30 Hz.
MEG Analysis
The overt execution response in the cue-locked epochs was identified based on peaks in the RMS of field strength across 157 channels. Because previous studies suggest that the time courses for completing motor execution and imagery are comparable (Decety and Michel, 1989; Decety et al., 1989; Sirigu et al., 1995, 1996), under the assumption that the kinesthetic feeling is elicited at a similar latency as the latency of an overt execution response, the imagery response was identified by peaks in the RMS waveform within the same latency range of execution for each participant.
To assess the topographic similarity across time between the (overt) execution and (covert) imagery responses, a multivariate measurement technique (“angle test of response similarity”) first developed by Tian and Huber (2008) was used, in which the geometric distance (angle) between activity patterns is quantified. This technique permits the assessment of spatial similarity in electrophysiological experiments (Huber et al., 2008; Tian and Huber, 2008; Davelaar et al., submitted) and a toolbox is available online (Tian et al., submitted). This same data-analytic approach has been applied, as well, in fMRI research (Mitchell et al., 2008; Braze et al., 2010) and neural network modeling (Hinton and Shallice, 1991). Each topography is considered as a high dimensional vector, where the number of dimensions equals the number of sensors in MEG recording. The angle between the two vectors represents the difference between two topographic patterns (Figure 3A). The cosine value of this angle, which can be calculated from the dot product of two response vectors (Tian and Huber, 2008) is the angle measure between two topographic patterns (between angle measure), where 1 stands for exact match (angle equals 0) and −1 stands for opposite (angle equals π). In this project, the goal was to detect the occurrence of a specific topography (e.g., whether the auditory-like topography pattern exists after the imagery articulation). Hence, the target topography was selected as a template  and the response in an experimental condition
  was compared to this template at each time instance to obtain the between angle measure across entire time course (Eq. 1).
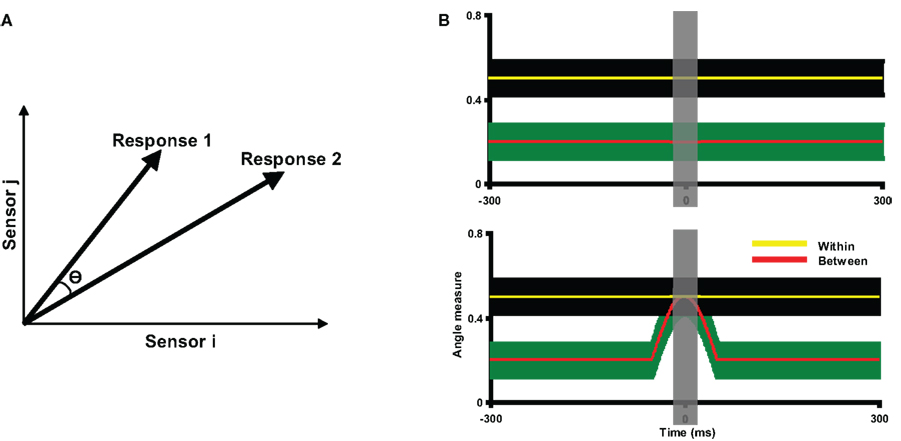
Figure 3. Description of angle measure and two hypothetical results of angle tests. (A) The angle measure in the angle test of response similarity. For the purposes of illustration, each high dimensional neural response pattern is represented by a two-dimensional vector. The similarity between the two topographies is indicated by the angle (θ) between them: the smaller the angle θ, the more similar the two response patterns. When two topographies are perfectly matched, θ equals 0. The angle measure (cosine value of θ) is computed, ranging from −1 to 1, where 1 stands for perfectly matched. (B) Two hypothetical results of angle tests, plotted as angle measures against time. The yellow and red lines represents the mean within angle measures and mean between angle measures across participants, with the color shaded areas surrounding the lines indicating the two standard error of the mean (SEM). The gray vertical shaded area around time 0 indicates the time window within which the data are averaged for further statistical tests. Two lines are separated throughout the entire time course of the measurement in the top plot, indicating the two response patterns are different; whereas the mean between angle measures overlap with the within angle measures in the bottom plot, indicating the two response patterns are statistically indistinguishable around time 0.
The between angle measure is statistically assessed by comparing to a null hypothesis (i.e., the angle between two topographies greater than chance). The experiment was separated into two halves and the between and within (null hypothesis) angle measures were calculated based on the average patterns found for each half for each participant. To understand the nature of these calculations, consider a comparison between a condition X and a template topography T selected at a given latency in a response A across the experimental halves (1 and 2) with 10 individuals in the experiment. The null hypothesis within angle measure at time t for the first individual is found by averaging the X1(t)/X2(t) angle measure with the A1(t)/A2(t) angle measure, and the between angle measure at time t is found by averaging the T2/X1(t) angle measure with the T1/X2(t) angle measure (T1 and T2 are the templates selected at a same latency in response A1 and A2, respectively). The same values are calculated for the other nine individuals at each time instance, and then the 10 within and 10 between angle measures are used to obtain the mean and confidence interval of within and between angle measures waveforms. Two hypothetical situations are depicted in Figure 3B. In the top plot, the within and between angle measures are separated throughout the entire time course, whereas in the bottom plot, the between angle measure approaches the within angle measure around the time 0. At the time of overlap, the topographic pattern is not distinguishable from the template, and therefore implicates at least overlapping neuronal populations. The response similarity/difference was assessed by a random effect analysis (angle test) using a paired t-test between the within and between angle measures across participants on the data averaged within a time window indicated by the gray shaded areas. Significant results of such paired t-tests indicate that the topography was different from the template, whereas the null results suggests that the two topographic patterns were similar around time 0 or that there was not enough power to detect the difference. In the presence of null results, additional t-tests can be carried out around other time points to assess power issues.
In Experiments 1 and 2, the angle test was first evaluated by using the execution-locked (button press) and cue-locked (auditory stimulus) response patterns in the overt execution task. Because these two responses differ only in the way of averaging, there should be either no or at best small differences between them. Next, the activity pattern of the execution response was compared to the imagery responses across time to assess the differences between the neural substrates underlying execution and motor imagery. The imagery response was also compared to the response patterns prior to execution, to explore the relationship between the neural systems that underlie kinesthetic feeling in imagery and motor intention.
In Experiments 3–5, whether similar neural substrates underlie articulation and imagery was assessed by evaluating response pattern similarity using the same multivariate technique. Next, the overt hearing responses were compared to the (covert) hearing imagery responses to determine whether auditory imagery and perception share similar neural substrates.
Finally, crucially, the hearing responses were compared to the response pattern after articulation imagery, to test the presence of an auditory efference copy in the context of recurrent estimation of the second forward model.
Equivalent current dipole (ECD) analysis (Hämäläinen et al., 1993) was used to model the cortical sources of observed activity patterns in the execution and imagery tasks. Dipole fitting was performed following a common procedure (Lounasmaa et al., 1996; Salmelin et al., 2000; Vihla et al., 2006; Hultén et al., 2008) using MEG160 software (MEG Laboratory 2.001M, Yokogawa Corporation, Eagle Technology Corporation, Kanazawa Institute of Technology). The dipole patterns in the surface contour maps were identified visually around peak latencies. The ECDs were determined by selecting the subset of sensors at the time at which the clearest dipole pattern was observed in each condition. The location (three dimensions), orientation (two dimensions), and magnitude (one dimension) were estimated for each ECD. A 90% goodness-of-fit was adopted as the criterion for accepting ECDs. Only one participant’s structural MRI was available. Therefore, the position of averaged ECDs were superimposed on the ICBM 152 brain template (Mazziotta et al., 2001) for visualization.
Results
Because of fundamental similarities of the results in Experiments 1 and 2 and Experiments 3–5, the figures of Experiments 1 and 4 are included in main text; other figures can be found in Supplementary Material.
Finger Tapping: Experiments 1 and 2
Waveform responses and topographies: imagery versus execution
The execution and imagery neural response latencies were determined by identifying the peaks in the RMS waveforms. The execution responses were identified following the typical M100/200 auditory response in Experiment 1 and around 1000 ms after the last tone in Experiment 2. The execution response latencies were similar to behavioral median reaction times (Table 1). The imagery response latencies were selected by the peaks in RMS waveforms around the determined execution latencies (Table 1).
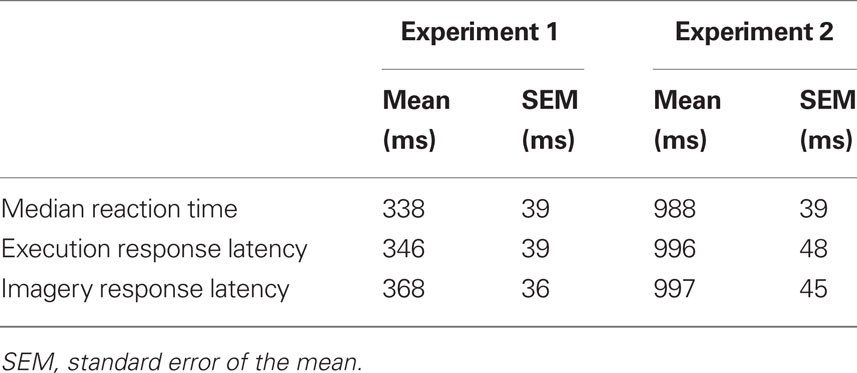
Table 1. Behavioral and neural responses latencies in Experiments 1 and 2.
The amplitudes of the imagery responses were smaller than the execution responses in Experiments 1 and 2. Response waveforms from one typical participant in Experiment 1 are shown in Figure 4. The peak amplitudes of the responses occurred around 550 ms in both tasks: the execution response peaked at 550 ms (Figure 4A), and the imagery response peaked at 545 ms, though with smaller amplitude (Figure 4B). The peak amplitudes of the responses in Experiment 2 occurred around 1200 ms, with peaks at 1238 ms in the execution task, and 1244 ms in the imagery task, though again with smaller amplitude (Figure S1 in Supplementary Material). All responses latencies were in the similar range of median reaction time (530 ms in Experiment 1 and 1182 ms in Experiment 2) for this participant.
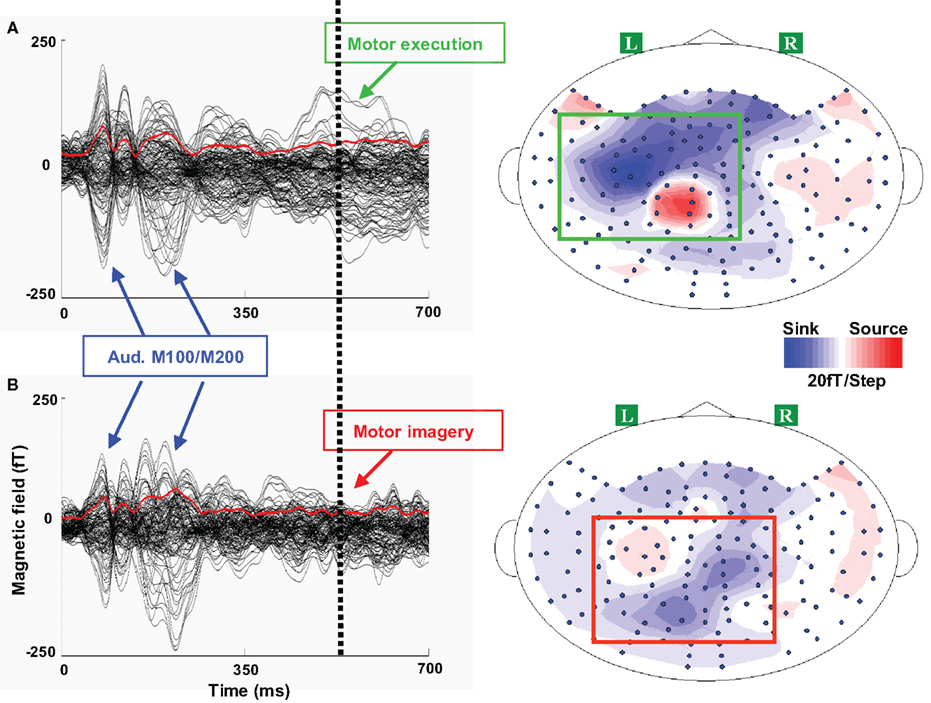
Figure 4. Waveforms and topographies of execution and imagery responses in Experiment 1. One typical participant’s responses are presented for each response. A 700 ms responses are plotted beginning with the single tone onset. In each waveform plot, 124 sensors are included (excluding the sensors in the front whose signal-to-noise ratio is low) and each black line represents the time course of response of one sensor. The red line in each plot represents the root mean square (RMS) of field strength across all sensors. The dotted vertical line represents the median reaction time in the execution task. A clear dipole pattern was obtained for each response, where the red and blue colors represent the direction of magnetic field coming out of (source) or going into (sink) the skull. (A) Left, waveform of execution response. Three peaks were observed: the first two peaks around 100 and 200 ms were the auditory M100/200 complex, whereas the third peak around 550 ms was presumably the execution response. Right, the activity patterns in the execution task. The topography of execution response displayed a dipole pattern (highlighted in a green box) over the left frontal area, which presumably reflects the neural activity in the primary motor cortex evoked by the right finger movement. (B) Left, waveform of imagery response. After the auditory responses, only a weak response was observed, compared with the execution response during the similar time. Right, the activity patterns in imagery tasks. Compared to the activity patterns in the execution task, the response patterns in the imagery task (highlighted in a red box) exhibit more posterior responses over left parietal region.
After determining the response latencies in the waveform data, the activity patterns were examined. In the execution tasks, the spatial activity pattern was left lateralized over frontal lobe, consistent for all 12 participants, presumably reflecting activity in motor cortex evoked by right finger movement. There were no differences between the execution responses in Experiments 1 and 2, nor between the responses of participants using their thumb or index finger to respond.
The activity patterns in the imagery task were different from those of the execution task, and individual differences appeared among participants. In Experiment 1, 11 of 12 participants showed more posterior activity in the imagery task when compared to individual execution responses, whereas only one participant showed more anterior and medial activity patterns. A typical participant’s topographies in Experiment 1 are depicted in Figure 4 (right plots). The imagery response shows a more posterior pattern over parietal regions (bottom right plot, dipole pattern highlighted in a red box) compared with the execution response (top right plot, dipole pattern highlighted in a green box). Similar results were obtained in Experiment 2, where 10 of 12 participants showed more posterior activity in the imagery task and 2 participants showed more anterior and medial dipole patterns (for a typical participant’s topographies in Experiment 2, see Figure S1 in Supplementary Material).
“Angle Test” for execution responses
The group analyses were performed using the angle test to confirm the activity pattern differences observed by visual inspection in individual participants. Before assessing the similarity between imagery and execution responses, the angle test was first examined using the execution responses in cue-locked averages and execution-locked averages. Because the topographies of execution responses should be very similar regardless of the way of averaging, the angle measures between these two responses as determined by our analytic procedure should be comparable to the null hypothesis. The topography of execution response in the execution-locked average was selected as a template for each participant. The cue-locked epoch was compared to this execution response template. As depicted in Figure 5A, the between angle measure was significantly smaller prior to or after the execution onset in Experiment 1. However, the between angle measure between the cue-locked and execution-locked activity patterns began to overlap with the within angle measure as time approached the execution onset (time 0). Similar results were obtained in Experiment 2 (Figure S2A in Supplementary Material). That is, the topography of cue-locked response became similar to the execution response template. A time window of 20 ms was selected around the peak time of execution and a paired t-test was carried out on the time-averaged data. No significant differences were found between the within angle measure and between angle measure in either Experiment 1, [t(11) = −1.47, p = 0.17], or Experiment 2 [t(11) = 0.72, p = 0.49]. Two additional paired t-tests were carried out around the times 100 ms before and after the time 0 to demonstrate that there was enough power [t(11) = 8.74 p < 0.001; t(11) = 2.89, p < 0.05 in Experiment 1, t(11) = 2.92, p < 0.05; t(11) = 2.38, p < 0.05 in Experiment 2].
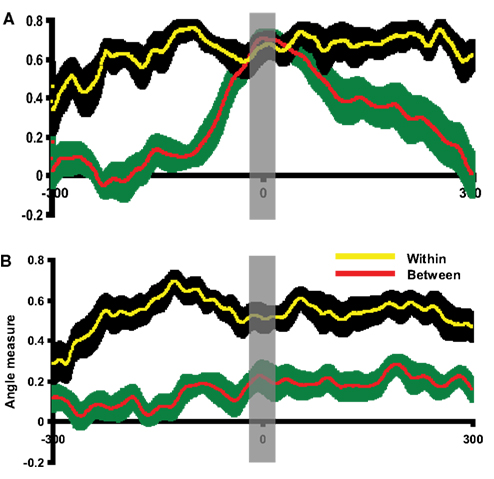
Figure 5. Evaluation of the angle test and assessment of pattern similarity between execution and imagery responses. The results of pattern analyses across participants in Experiment 1 are shown. (A) Evaluating the angle test of response similarity using execution responses. This plot depicted the between angle measures comparing execution responses in execution-locked and cue-locked epochs (red) and within angle measures (yellow). The x-axis is centered at the peak time of execution response in cue-lock epoch. (B) Angle test between execution and imagery responses. This plot depicted the between angle measure comparing execution and imagery responses (red) and within angle measure (yellow). The x-axis is centered at the peak time of imagery response. In all plots, the yellow line and black shaded areas represent the mean and two SEM of the within angle measures, whereas the red line and green shaded areas represent the mean and two SEM of the between angle measures. Results in all plots are depicted 300 ms prior to and after the response peak times. In (A), the between angle measures approach the within angle measures only around the execution peak. In (B), the between angle measures were smaller than the within angle measures across time course. The gray vertical shaded areas centered at time 0 represent the 20 ms time window used for statistical tests.
The quantitative similarity of the activity patterns surrounding the execution peak latency contrasts with the difference demonstrated elsewhere across the time course revealed by the angle test of response similarity, suggesting that this multivariate analysis technique can identify whether two activity patterns are similar (null results) or different (between angle measure were significantly smaller than within angle measure). Therefore, the same activity pattern analysis was used to assess the similarities between the imagery and execution responses across participants.
Assessment of pattern similarity between imagery and execution across participants
Having demonstrated that our technique is a valid approach to formally assess the similarity between activity patterns, the angle measure between mental imagery and execution was calculated. In this case, execution responses were selected as templates in each condition for each participant. The imagery epoch was compared to this execution template. As illustrated in Figure 5B, the between angle measures were significantly smaller than within angle measures throughout the entire time course in Experiment 1. Similar results obtained for Experiment 2 (Figure S2B in Supplementary Material). A paired t-test was carried out on data averaged within the 20 ms time window centered on peak latency of the imagery response. The between angle measure was significantly smaller than within angle measure in Experiment 1 [t(11) = 2.98, p < 0.05] and Experiment 2 [t(11) = 3.81, p < 0.01]. That is, the topographic patterns associated with mental imagery activity were significantly different from those of the execution patterns. This quantitative group analysis supports the topographic differences in imagery and execution observed by visual inspection (Figure 4).
Source localization analysis: imagery versus execution dipole modeling
The results support the view that different neural substrates are mediating movement execution and the kinesthetic feeling in motor imagery. The source location of imagery responses was further analyzed by calculating the relative distance between the ECDs of imagery and execution responses. The ECDs of execution and imagery responses were modeled for each individual participant. The distance was calculated by subtracting ECD positions of the execution response from the imagery response. These distances are displayed in Figure 6 by plotting the individual distances against a common reference point (point 0; each participant’s execution-related dipole fit). The source space dipole analysis supports the findings suggested by the topographic patterns, namely of more posterior activity during imagery responses. In Experiment 1 (Figure 6A), 11 out of 12 participants presented more posterior ECDs, whereas only one participant showed a more anterior and medial ECD (mean distance (mm) = [9.9, −27.1, −14.9]1 and SEM (mm) = [6.1, 6.6, 5.3]). Similar results were obtained in Experiment 2 (Figure S3 in Supplementary Material), where 10 out of 12 participants had more posterior ECD locations (mean distance (mm) = [10.9, −23.6, −11.6] and SEM (mm) = [5.0, 5.0, 8.1]). The finger motor representation in Brodmann area 4a is located at [−46, −16, 51] in Talairach coordinates (Talairach and Tournoux, 1988), defined by the cytoarchitectonic maximum probabilistic map using in fMRI (Eickhoff et al., 2005; Sharma et al., 2008). Based on the relative distance between the execution and imagery responses, the mean imagery responses are located in inferior parietal cortex (Brodmann area 40) near anterior intraparietal sulcus, as illustrated in Figure 6B (Experiment 1: [−36.1 ± 6.1, −43.1 ± 6.6, 36.1 ± 5.3]; Experiment 2: [−35.1 ± 5.0, −39.6 ± 5.0, 39.4 ± 8.1]). In sum, visual inspection, waveform data, pattern analysis, and dipole fitting provide consistent evidence showing that different neural substrates mediate motor imagery and motor execution. The kinesthetic feeling in motor imagery is by hypothesis associated with parietal activity, presumably underlying the estimation of motor status from an efference copy.
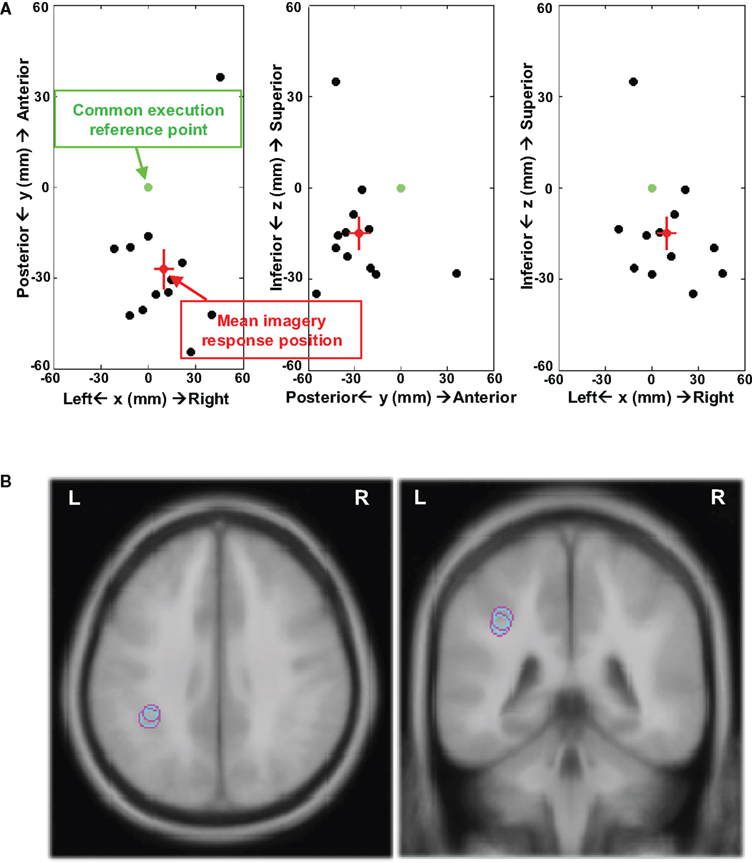
Figure 6. Distance between ECDs of execution and imagery responses. (A) 2D plots in xy (axial), yz (sagittal), and xz (coronal) plains of distances between the individual imagery response and execution response in Experiment 1. All the distances between individual ECD positions for imagery response and execution response were calculated and these distances were plotted from a common reference point for all 12 participants. The coordinates used in all plots are arbitrary, which is defined by centering on the common reference point. The x-axis is left–right (right positive), y-axis is posterior–anterior (anterior positive), and z-axis is inferior–superior (superior positive). The green point at [0, 0, 0] is the common reference point and the distance between this reference point and each blank point represents the distance from individual ECD position for imagery response to ECD position for execution response. The distance from the red point to the reference point represents the mean distance between ECD positions for execution response to ECD positions of imagery response across 12 participants and the two SEM are depicted in red lines in each direction. (B) The mean ECD locations of imagery responses in Experiments 1 and 2 (axial and coronal view) registering on an ICBM 152 brain template. The imagery responses were located in inferior parietal cortex near anterior intraparietal sulcus.
Motor intention and execution: Time course of ECDs
The activity underlying the kinesthetic feeling in motor imagery has been demonstrated to differ from that underpinning motor execution. Inferior parietal activity is implicated in the imagery task, which is potentially the neural correlate of kinesthetic feeling. However, whether movement intention versus kinesthetic feeling in imagery are mediated by similar parietal cortex regions but differ in their temporal characteristics is unclear. To pursue this, the responses in Experiment 2 were examined, as they offer a window that included a longer time period before the execution. To illustrate, one participant’s responses as modeled by dipole source localization appeared ∼90 ms prior to the execution response (co-registered on the T1-weighted anatomical MRI of that participant). As seen in Figure 7A, the ECD of the “movement intention response” was located in intraparietal sulcus ([−22.6, −62.5, 33.0]). Interestingly, as shown in Figure 7B, the imagery response was also located in a similar intraparietal sulcus region ([−26.6, −56.9, 26.1]), indicating that the motor intention and motor imagery processes may involve similar or overlapping neural substrates.
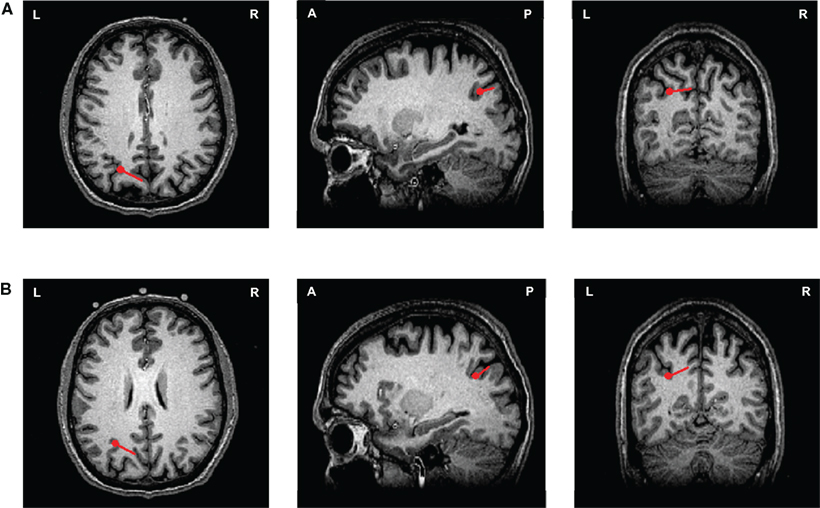
Figure 7. ECDs of movement intention and motor imagery responses from one participant in Experiment 2. Two ECDs were modeled and displayed on an individual’s T1-weighted anatomical MRI images (axial, sagittal, and coronal views) in execution and imagery tasks for one participant. The red points represent the location of the ECDs and the direction and length of the red lines represent the direction and the magnitude of the dipole projected on two-dimensional planes. (A) The ECD of movement intention response. The ECD of movement intention occurred 90 ms before the execution latency, where it is located in the in intraparietal sulcus. (B) The ECD of imagery response. The ECD of imagery response was also located in the similar intraparietal sulcus region.
Assessment of neural pattern similarity associated with kinesthetic feeling in imagery and motor intention in execution
The dipole fitting results suggest a possible relationship between the neural systems for motor intention and the kinesthetic feeling in imagery. A group analysis was carried out to explore this further. All participants’ execution data were visually inspected prior to the execution latency and the clearest dipolar pattern was selected around the peak time (movement intention peak) closest to the execution response. The intervals between the intention responses and execution responses varied among participants (mean = 231.3 ms, SEM = 31.9 ms). The short interval between the movement intention and execution is presumably because of the simple task and the temporally constrained experimental design. The auditory cued paradigm requires participants to intend to move in a precise time window, while the simple button pressing task does not require complex movement planning. Consequently, the movement intention is close to the latency of execution and the preparation responses after the motor intention responses were not apparent.
We tested the relationship between activity patterns of imagery responses and movement intention by the established pattern analysis. The template was selected at the peak latency of the imagery response for each participant. The execution epoch was compared with this template. Each participant’s angle measure data were centered at their individual latency of movement intention response, to normalize individual differences in activity timing. As seen in Figure 8A, only around the center did the difference between the within and between angle measure diminish; the between angle measure was significantly lower than the within angle measure elsewhere. A paired t-test was carried out on averaged data obtained by applying a 20-ms time window around the peak latency of intention response. No significant difference was obtained between within and between angle measure [t(11) = −0.09, p = 0.93]. Two additional paired t-tests were carried out around the times 50 ms before and after the time 0 to demonstrate there was enough power [t(11) = 3.22, p < 0.01; t(11) = 3.54, p < 0.005].
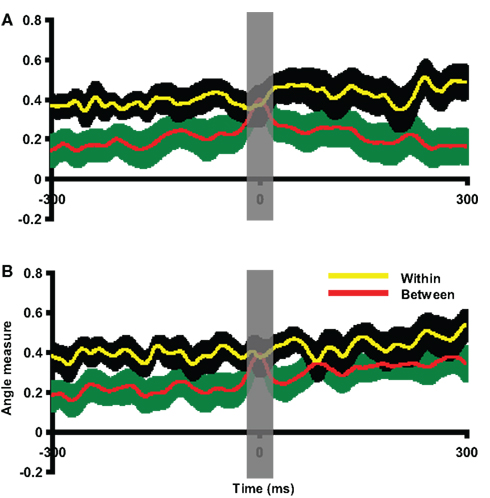
Figure 8. Assessment of pattern similarity between responses of motor intention and responses in motor imagery. The results of pattern analyses across participants in Experiment 2 are shown. (A) Group activity pattern analysis between responses of motor intention in execution and kinesthetic feeling in imagery. The x-axis was centered at the latency of intention response in execution task. (B) Group activity pattern analysis between intention responses in execution and imagery tasks. The x-axis is centered at the latency of intention response in imagery task. In both plots, the yellow line and black shaded areas represent the mean and two SEM of the within angle measure, whereas the red line and green shaded areas represent the mean and two SEM of the between angle measure. The results in all plots are 300 ms prior to and after the response peak times. Both between angle measures approach the within angle measures around the intention response latencies. The gray vertical shaded areas centered at the peak latency of intention response time 0 represent 20 ms time window used for statistical tests.
Although we implemented temporally constrained cued paradigms and analyses, the similar parietal activity patterns between motor intention in the execution task and the kinesthetic feeling in the imagery task could be the results of different activity timing in the different tasks. That is, the parietal activity observed in the imagery task could be a delayed response of motor intention. Moreover, the intentional response, similar as the one in execution tasks, should be also observed in imagery task, because the efference copy can only be available after the motor intention. Therefore, a group analysis was carried out to test the response pattern similarity between the motor intention in both execution and imagery conditions. All participants’ imagery data were visually inspected prior to the imagery responses and the clearest dipole pattern was selected around the peak time (movement intention peak time in imagery) closest to the imagery response. The intervals between the intention responses and imagery responses (mean = 233.42 ms, SEM = 13.70 ms) were similar to the interval in execution condition. The motor intention response in the execution condition was selected as the template for each participant. The imagery epoch was compared with this template at each time point. Each participant’s between angle measures were centered at their individual intention latency in imagery condition to normalize individual differences in activity timing. As seen in Figure 8B, the difference between the within and between angle measures diminish around the center. A paired t-test was carried out on averaged data obtained by applying a 20-ms time window around the intention latency in imagery. No significant difference was obtained between within and between angle measures [t(11) = 0.33, p = 0.75]. Two additional paired t-tests were carried out around the times 50 ms before and after the time 0 to demonstrate there was enough power [t(11) = 3.73 p < 0.005; t(11) = 3.70, p < 0.005]. Notice that the between angle measure remained at a relatively high level 100 ms after the intention responses latency. That is presumably a result of similar activity patterns during the following imagery responses that had large disparities in response latency among individuals.
The group pattern analyses demonstrate the compelling similarity between the responses elicited by mental imagery and the movement intention responses. The data suggest that the motor intention responses occur ∼230 ms before motor execution, consistent with the hypothesis that conscious motor intention occurs around 250 ms before movement or imagery, as a result of the neural activity in posterior parietal cortex (Desmurget and Sirigu, 2009). However, the responses subsequent to the motor intention diverge in the execution and imagery tasks. The motor commands are carried out in primary motor cortex in the execution condition, but the efference copy of these motor commands is, by hypothesis, “estimated” in posterior parietal cortex, in similar parietal regions that arguably generate the motor intention, and the kinesthetic feeling in imagery is generated as the results of this estimation.
Overt Versus Covert Speech: Experiments 3–5
The articulation response latencies of each participant were determined by the peaks in the RMS waveforms (around the median reaction time) and imagery response latencies were determined by identifying the prominent responses around the articulation latencies (Table 2). Topographies of responses for all tasks were visually inspected at selected latencies. The multivariate angle test was used to assess the similarity between response topographies across participants. The data patterns were similar in Experiments 3–5.
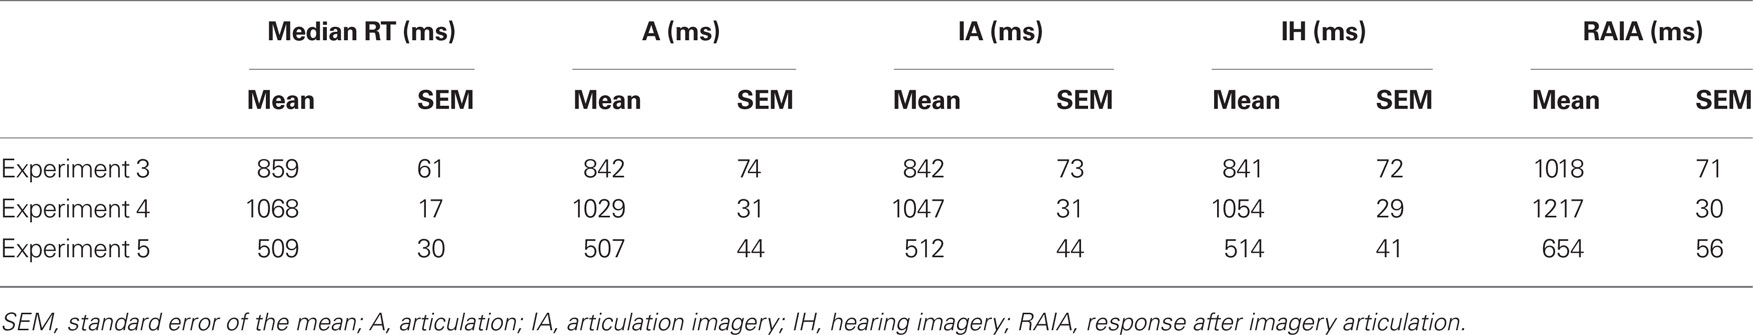
Table 2. Behavioral and neural responses latencies in Experiments 3–5.
Overt and Covert articulation
The activity patterns of the overt and covert articulation at selected latencies were examined. For the overt articulation task (Figure 9A, left plot), the execution responses appeared on the bilateral frontal areas for all participants, presumably reflecting the activity in the primary motor cortex evoked by the movement of the tongue (recall that participants were asked to articulate with moving the jaw as little as possible, to reduce potential movement artifacts; tongue movement becomes the principal articulator movement). The activity patterns for the imagery task (Figure 9A, right plot) were different from execution response, with time-locked activation appearing in parietal cortex. Similar results were obtained in Experiments 3 and 5 (see Figures S4A and S6A in Supplementary Material; no apparent response profile was obtained for two participants in Experiment 3).
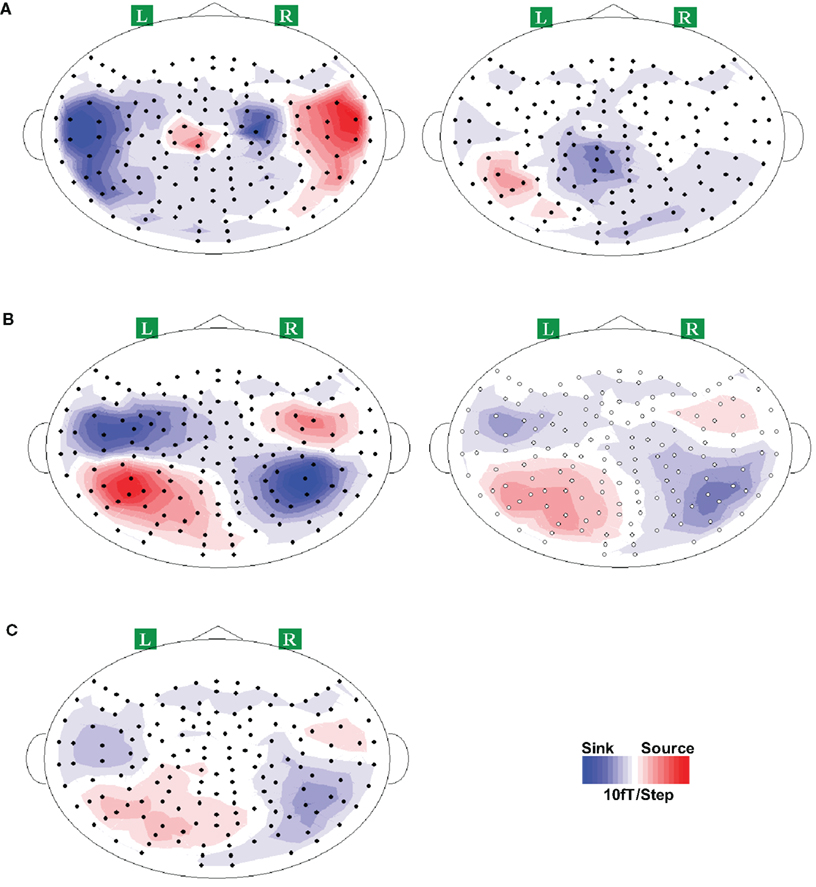
Figure 9. Response topographies of all conditions in Experiment 4. Grand average topographies across all participants are presented for demonstration purpose only. Clear dipole patterns were obtained for each response, where the red and blue colors represent the direction of magnetic field coming out of (source) and going into (sink) the skull. (A) Activity patterns of articulation (left) and articulation imagery (right). Two dipoles patterns were obtained bilaterally over frontal area for articulation, whereas one dipole was observed in articulation imagery task, where it located in left parietal area. (B) Topographies of hearing (left) and hearing imagery (right) responses. Typical auditory responses of two dipoles over bilateral temporal cortex were observed in hearing task. Similarly, bilateral temporal activations were also occurred in imagery hearing task. (C) Topography of response after articulation imagery. This response pattern is similar as the auditory response (immediate above).
The between angle measures between overt and covert articulation responses were calculated. In this case, the articulation response was selected as the template for each participant. The covert epoch was compared to this execution template. As shown in Figure 10A, the between angle measures in Experiment 4 were significantly smaller than within angle measures throughout the entire time course. Similar results were obtained for Experiments 3 and 5 (Figures S5A and S7A in Supplementary Material). A paired t-test was carried out on data averaged within the 20 ms time window centered on the peak latency of the imagery response. The between angle measures were significantly smaller than within angle measures [t(9) = 3.31, p < 0.01 in Experiment 3, t(9) = 2.53, p < 0.05 in Experiment 4 and t(7) = 5.42, p < 0.01 in Experiment 5]. This suggests that the covert articulation patterns were significantly different from the articulation responses, consistently in Experiments 3–5. Both the results of visual inspection and quantitative pattern analyses show that articulation motor imagery did not activate primary motor cortex but more posterior parietal areas, consistent with the results obtained in Experiments 1 and 2 for finger movement.
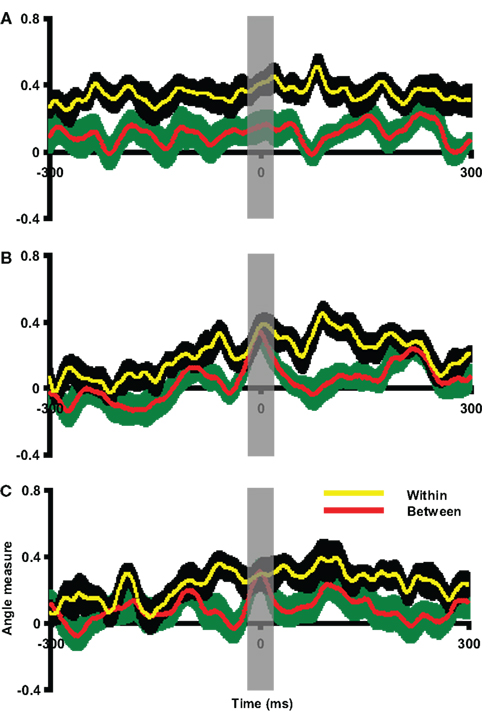
Figure 10. Assessment of pattern similarity between overt and covert responses in Experiment 4. The angle measures were depicted against time in all plots, in which the red line and green shaded areas represent the mean and two SEM of between angle measures, whereas the yellow line and black shaded areas represent the mean and two SEM of within angle measures. The x-axis is centered at the peak latency of imagery responses (covert articulation, covert hearing and response after covert articulation in each plot). The results in all plots are 300 ms prior to and after the response latency. (A) Overt versus covert articulation. The between angle measures were smaller than the within angle measures across time course. (B) Overt versus covert hearing. The between angle measures approach the within angle measures only around the covert hearing response latency. (C) Hearing versus responses after covert articulation. The between angle measures approach the within angle measures only around the latency of responses after imagery articulation. The gray vertical shaded areas centered at time 0 represent the 20 ms time window used for statistical tests.
Overt and Covert hearing
The activity patterns of “overt and covert hearing” (auditory stimulation versus auditory imagery) at selected latencies in Experiments 3–5 were examined. Because no differences were found between the responses to male and female vocalizations, the overt hearing responses were obtained by averaging across voice types. In sharp contrast to the articulation imagery data, similar responses for overt and covert hearing tasks were observed in most participants, over bilateral temporal areas, presumably reflecting the activity in auditory cortex (Figure 9B for Experiment 4; see Figures S4B and S6B in Supplementary Material for Experiments 3 and 5).
The group pattern analysis was used to evaluate spatial similarity between overt and covert hearing responses. In this case, the overt hearing response was selected as the template for each participant. The auditory imagery epoch was compared to this template. As shown in Figure 10B, the between angle measures were significantly smaller than the within angle measures throughout the entire time course except during the time of the imagery response latency. Similar results were obtained in Experiments 3 and 5 (Figures S5B and S7B in Supplementary Material). A paired t-test was carried out on data averaged within the 20-ms time window centered on the peak latency of the imagery response. The between angle measures did not differ from the within angle measures [t(9) = 0.85, p = 0.42 in Experiment 3, t(9) = 0.48, p = 0.64 in Experiment 4 and t(7) = 1.62, p = 0.15 in Experiment 5]. Two additional paired t-tests were carried out around the times 50 ms before and after the time 0 to demonstrate there was enough power [t(9) = 3.48, p < 0.01; t(9) = 2.28, p < 0.05 in Experiment 3, t(9) = 2.71, p < 0.05; t(9) = 2.27, p < 0.05 in Experiment 4, and t(7) = 3.81, p < 0.01; t(7) = 2.65, p < 0.05 in Experiment 5]. That is, the topographic patterns evoked by overt and covert hearing were similar to each other at the times constrained by the task, consistently across Experiments 3–5. The results of visual inspection and pattern analyses thus argue that similar auditory cortical fields mediate both overt auditory perception and auditory imagery.
Key comparison: responses after imagery articulation versus overt Hearing
The critical issue for testing the dynamics of the forward models, namely the possible perceptual consequences predicted by covert articulation, was investigated by inspecting the responses following the covert articulation responses (response after imagery articulation, RAIA). The RAIA was observed in almost all participants (two participants did not obtain any apparent responses, one in Experiment 3, one in Experiment 5) over bilateral temporal areas (Figure 9C; for Experiments 3 and 5, see Figures S4C and S6C in Supplementary Material) The latencies of RAIA are shown in Table 2, and the interval between the RAIA and the IA responses were in the range of actual hearing response latencies (mean = 175.4 ms, SEM = 21.1 ms in Experiment 3; mean = 170.4 ms, SEM = 18.1 ms in Experiment 4; and mean = 141.5 ms, SEM = 22.6 ms in Experiment 5).
The multivariate angle test was used to assess whether the RAIA were similar to auditory responses across participants. In this case, the individual hearing response was selected as the template for each participant. The articulation imagery epoch was compared to this template. As seen in Figure 10C, the between angle measures were significantly smaller than the within angle measures throughout the entire time course except during the time of the RAIA response latency. Similar results were obtained in Experiments 3 and 5 (see Figures S5C and S7C in Supplementary Material). A paired t-test was carried out on data averaged within the 20-ms time window centered on peak latency of the RAIA. The between angle measures did not differ from the within angle measures [t(9) = 0.72, p = 0.49 in Experiment 3; t(9) = 0.01, p = 0.99 in Experiment 4; and t(7) = 1.49, p = 0.18 in Experiment 5]. Two additional paired t-tests were carried out around the times 50 ms before and after the time 0 to demonstrate there was enough power [t(9) = 4.38, p < 0.01; t(9) = 4.92, p < 0.001 in Experiment 3, t(9) = 2.36, p < 0.05; t(9) = 3.23, p < 0.05 in Experiment 4, and t(7) = 5.80, p < 0.001; t(7) = 2.47, p < 0.05 in Experiment 5]. That is, crucially, the topographic patterns of the hearing responses and the RAIA were similar to each other, consistently across Experiments 3–5. The results supported the view that auditory cortex is activated after covert articulation, and this auditory-like response is most likely the predicted perceptual consequence as the estimation of an auditory efference copy in the second internal forward model.
Discussion
In the five connected MEG studies reported here, three findings emerge that support the dynamics in our proposed structure of internal forward models (Figure 1). First, in time-cued finger tapping experiments (designed in part to develop and validate the approach to investigating mental imagery in electrophysiology) we discovered that motor imagery draws on a different neuronal substrate from motor execution under the same temporal constraints. Imagery is associated with parietal activity. This pattern was replicated for overt versus covert (imagined) speech, suggesting that it is a more general property of motor imagery, and that the kinesthetic feeling is the result of estimation in an internal forward model. Second, we confirmed that auditory imagery, unlike motor imagery, implicates auditory cortex in a manner very similar to overt auditory perception. Given the similar findings on visual imagery in the literature, our data are consistent with a principled perceptual versus motor imagery distinction. Third, and most critically, we observed compelling evidence for an essential aspect of internal forward models: immediately subsequent (i.e., temporally adjacent) to imagined articulation, we observe evidence for auditory cortex activation. Since there was no auditory stimulus in that condition – one in which participants engaged in an imaginary motor task – the most constrained interpretation is that there is a recurrent estimation in a second internal forward model that predicts the anticipated auditory targets in covert speech production, via an auditory efference copy.
The Importance of Parietal Cortex
Despite predictable individual differences across participants, the topographies of the imagery responses consistently – and during a similar time window across all experiments – exhibited more posterior activity patterns than execution-related patterns, specifically over parietal regions. Dipole modeling analyses confirmed that the neural sources of the imagery responses were located in parietal cortex, near anterior intraparietal sulcus (Experiments 1 and 2). Our findings support the conjecture that the kinesthetic feeling in motor imagery is associated with the parietal activity that underlies the estimation of somatosensory consequences (motor efference copy in Figure 1). Moreover, the patterns of auditory activation observed after covert articulation supports the assumption of recurrent perceptual estimation that the auditory consequences are simulated (or estimated) after the planned motor commands (perceptual efference copy in Figure 1).
Our temporally constrained MEG results converge with the observation of parietal activity during motor imagery obtained in PET studies (Decety et al., 1994; Deiber et al., 1998) and fMRI studies (Lotze et al., 1999; Gerardin et al., 2000; Ehrsson et al., 2003; Hanakawa et al., 2003; Dechent et al., 2004; Meister et al., 2004). Furthermore, our data suggest that the kinesthetic feeling is associated with activity in parietal cortex, which agrees with previous findings suggesting the importance of inferior and posterior parietal cortex during motor imagery in neurological lesion studies (Sirigu et al., 1996) and direct stimulation studies (Desmurget et al., 2009). The MEG data provide more direct evidence to support the position that the kinesthetic feeling is induced by estimating the motor status from a motor efference copy.
Motor Imagery, Motor Intention/Planning
We investigated the similarity between the neural systems mediating motor intention and motor imagery (Experiments 1 and 2). Several studies (Snyder et al., 1997; Thoenissen et al., 2002; Desmurget et al., 2009) suggest that motor intention is mediated by the posterior parietal cortex (for reviews see Crammond, 1997; Andersen and Buneo, 2002). Interestingly, the posterior parietal region that subserves the motor intention overlaps with the proposed areas where an efference copy is evaluated and the motor status is predicted (Desmurget and Sirigu, 2009). Our results demonstrate that neural activity in parietal cortex was observed prior to both execution and imagery responses, which is in agreement with motor intention studies (Snyder et al., 1997; Quiroga, 2006; Desmurget et al., 2009). Moreover, the observation of posterior parietal activity at the time of motor imagery responses supports the hypothesis that the generation of movement intention and estimation of motor status are carried out in the similar parietal areas (Desmurget et al., 2009), but with different temporal characteristics. That is, similar spatial but different temporal neural activities suggest that similar neural substrates underlie the processes of both functions at different times.
Auditory Perception, Auditory Imagery, and Auditory Efference Copies
The resemblance of neural responses in auditory imagery and auditory perception (Experiments 3–5) agrees with findings that similar neural substrates mediate auditory perception and imagery in fMRI studies (Zatorre et al., 1996; Wheeler et al., 2000; Schürmann et al., 2002; Halpern et al., 2004; Aleman et al., 2005; Bunzeck et al., 2005; Zatorre et al., 2009). That is, perceptual neural systems are engaged to generate the representation during “covert perception” or imagery.
Although the pattern similarity between overt stimulation, covert imagery, and the implicated auditory efference copy was quantified by a multivariate method, the limited spatial resolution of the method prevents more granular quantification of the neural ensembles that mediate them. High spatial resolution techniques, such as fMRI, are needed to assess this question (Zatorre and Halpern, 2005). Moreover, mental imagery is surely a complex process that must involve distributed neural systems (Mellet et al., 1998; Handy et al., 2004; Mechelli et al., 2004; Sack et al., 2008). In fact, neurological evidence suggests that intact perceptual cortex is not sufficient for mental imagery (Moro et al., 2008). In addition, task demands and content can modulate the neural mechanisms that mediate the mental imagery (Kosslyn and Thompson, 2003; Kraemer et al., 2005), and attentional factors also influence the depth of imagery and perceptual processing in a hierarchical neural architecture (Moscovitch et al., 1994; Roland and Gulyas, 1994; Sakai and Miyashita, 1994; Mellet et al., 1998).
Critically for the hypothesis under investigation, auditory cortex was activated after articulation imagery in Experiments 3–5, even though no external stimuli or possible overt feedback was available. Such an auditory efference copy was presumably elicited after (∼170 ms) the estimation of somatosensory consequences caused by articulatory motor commands. Similar results were obtained in fMRI studies in which activity was observed in left Spt (posterior Sylvian fissure at the parietal–temporal boundary) during both hearing and covert rehearsal (Hickok et al., 2003). Cumulatively, the results converge with audio-visual multisensory integration theories positing that an abstract auditory representation (auditory efference copy) can be induced by visual presentation of a face and that following auditory stimuli can be affected (see Jaaskelainen, 2010 for recent discussion of AV integration models; Sams et al., 1991; van Wassenhove et al., 2005; Von Kriegstein and Giraud, 2006; Skipper et al., 2007; Poeppel et al., 2008). Moreover, the results align well with a model that accounts for auditory verbal hallucinations in schizophrenia patients (for review see Frith, 2005): auditory verbal hallucinations are explained as the results of erroneous interpretations of self-generated vocalizations. That is, patients fail to predict the consequence of their own articulation, but attribute them to the external causes. Indeed, Ford and colleagues found that the suppression of N1 responses to auditory stimuli during speaking and inner speech was absent in schizophrenia patients (Ford et al., 2001a,b, 2007).
Our results provide rather direct evidence to support the existence of auditory efference copies that could underlie multisensory integration and the causes of verbal hallucination in schizophrenia patients. We take the most compelling empirical finding to be the auditory-like responses about 170 ms after the estimation of the somatosensory consequences of planned articulation.
Conflict of Interest Statement
The authors declare that the research was conducted in the absence of any commercial or financial relationships that could be construed as a potential conflict of interest.
Acknowledgments
We would like to thank Jeffrey Walker for his excellent technical support, Jean Mary Zarate for her help on registering MEG ECDs on ICBM 152 MRI template, and Katherine Yoshida and Michael D’Zmura for comments on the manuscript. Thanks, as well, to our reviewers for thoughtful and spirited critical feedback. This study is supported by MURI ARO #54228-LS-MUR.
Footnote
- ^This mean distance was calculated by averaging the distance obtained by subtracting ECD positions for execution responses from imagery response within individual participant, presented in the form of [x, y, z], where x-axis is left–right (right positive), y-axis is posterior–anterior (anterior positive), and z-axis is inferior–superior (superior positive), relative to the ECD positions for execution responses. The same analysis was applied in calculation of the mean distance in Experiment 2.
References
Aleman, A., Formisano, E., Koppenhagen, H., Hagoort, P., de Haan, E. H. F., and Kahn, R. S. (2005). The functional neuroanatomy of metrical stress evaluation of perceived and imagined spoken words. Cereb. Cortex 15, 221–228.
Andersen, R. A., and Buneo, C. A. (2002). Intentional maps in posterior parietal cortex. Annu. Rev. Neurosci. 25, 189–220.
Blakemore, S. J., and Decety, J. (2001). From the perception of action to the understanding of intention. Nat. Rev. Neurosci. 2, 561–567.
Braze, D., Mencl, W., Tabor, W., Pugh, K., Todd Constable, R., Fulbright, R., Magnuson, J., Van Dyke, J., and Shankweiler, D. (2010). Unification of sentence processing via ear and eye: an fMRI study. Cortex. doi: 10.1016/ J. Cortex. 2009.11.005 [Epub ahead of print].
Bunzeck, N., Wuestenberg, T., Lutz, K., Heinze, H. J., and Jancke, L. (2005). Scanning silence: mental imagery of complex sounds. Neuroimage 26, 1119–1127.
Curio, G., Neuloh, G., Numminen, J., Jousmaki, V., and Hari, R. (2000). Speaking modifies voice-evoked activity in the human auditory cortex. Hum. Brain Mapp. 9, 183–191.
Decety, J., Jeannerod, M., and Prablanc, C. (1989). The timing of mentally represented actions. Behav. Brain Res. 34, 35–42.
Decety, J., and Michel, F. (1989). Comparative analysis of actual and mental movement times in two graphic tasks. Brain Cogn. 11, 87–97.
Decety, J., Perani, D., Jeannerod, M., Bettinardi, V., Tadary, B., Woods, R., Mazziotta, J. C., and Fazio, F. (1994). Mapping motor representations with positron emission tomography. Nature 371, 600–602.
Dechent, P., Merboldt, K. D., and Frahm, J. (2004). Is the human primary motor cortex involved in motor imagery? Cogn. Brain Res. 19, 138–144.
de Cheveigné, A., and Simon, J. Z. (2007). Denoising based on time-shift PCA. J. Neurosci. Methods 165, 297–305.
Deiber, M. P., Ibañez, V., Honda, M., Sadato, N., Raman, R., and Hallett, M. (1998). Cerebral processes related to visuomotor imagery and generation of simple finger movements studied with positron emission tomography. Neuroimage 7, 73–85.
Desmurget, M., Reilly, K. T., Richard, N., Szathmari, A., Mottolese, C., and Sirigu, A. (2009). Movement intention after parietal cortex stimulation in humans. Science 324, 811.
Desmurget, M., and Sirigu, A. (2009). A parietal–premotor network for movement intention and motor awareness. Trends Cogn. Sci. 13, 411–419.
Ehrsson, H. H., Geyer, S., and Naito, E. (2003). Imagery of voluntary movement of fingers, toes, and tongue activates corresponding body-part-specific motor representations. J. Neurophysiol. 90, 3304–3316.
Eickhoff, S. B., Stephan, K. E., Mohlberg, H., Grefkes, C., Fink, G. R., Amunts, K., and Zilles, K. (2005). A new SPM toolbox for combining probabilistic cytoarchitectonic maps and functional imaging data. Neuroimage 25, 1325–1335.
Ford, J., Gray, M., Faustman, W., Roach, B., and Mathalon, D. (2007). Dissecting corollary discharge dysfunction in schizophrenia. Psychophysiology 44, 522–529.
Ford, J. M., Mathalon, D. H., Kalba, S., Whitfield, S., Faustman, W. O., and Roth, W. T. (2001a). Cortical responsiveness during inner speech in schizophrenia: an event-related potential study. Am. J. Psychiatry 158, 1914.
Ford, J. M., Mathalon, D. H., Kalba, S., Whitfield, S., Faustman, W. O., and Roth, W. T. (2001b). Cortical responsiveness during talking and listening in schizophrenia: an event-related brain potential study. Biol. Psychiatry 50, 540–549.
Ganis, G., Thompson, W. L., and Kosslyn, S. M. (2004). Brain areas underlying visual mental imagery and visual perception: an fMRI study. Cogn. Brain Res. 20, 226–241.
Gerardin, E., Sirigu, A., Lehericy, S., Poline, J.-B., Gaymard, B., Marsault, C., Agid, Y., and Le Bihan, D. (2000). Partially overlapping neural networks for real and imagined hand movements. Cereb. Cortex 10, 1093–1104.
Grush, R. (2004). The emulation theory of representation: motor control, imagery, and perception. Behav. Brain Sci. 27, 377–396.
Guenther, F. H. (1995). Speech sound acquisition, coarticulation, and rate effects in a neural network model of speech production. Psychol. Rev. 102, 594–620.
Guenther, F. H., Ghosh, S. S., and Tourville, J. A. (2006). Neural modeling and imaging of the cortical interactions underlying syllable production. Brain Lang. 96, 280–301.
Guenther, F. H., Hampson, M., and Johnson, D. (1998). A theoretical investigation of reference frames for the planning of speech movements. Psychol. Rev. 105, 611–633.
Halpern, A. R., Zatorre, R. J., Bouffard, M., and Johnson, J. A. (2004). Behavioral and neural correlates of perceived and imagined musical timbre. Neuropsychologia 42, 1281–1292.
Hämäläinen, M., Hari, R., Ilmoniemi, R. J., Knuutila, J., and Lounasmaa, O. V. (1993). Magnetoencephalography – theory, instrumentation, and applications to noninvasive studies of the working human brain. Rev. Mod. Phys. 65, 413–497.
Hanakawa, T., Immisch, I., Toma, K., Dimyan, M. A., Van Gelderen, P., and Hallett, M. (2003). Functional properties of brain areas associated with motor execution and imagery. J. Neurophysiol. 89, 989–1002.
Handy, T. C., Miller, M. B., Schott, B., Shroff, N. M., Janata, P., Van Horn, J. D., Inati, S., Grafton, S. T., and Gazzaniga, M. S. (2004). Visual imagery and memory: do retrieval strategies affect what the mind s eye sees? Eur. J. Cogn. Psychol. 16, 631–652.
Hesslow, G. (2002). Conscious thought as simulation of behaviour and perception. Trends Cogn. Sci. 6, 242–247.
Hickok, G., Buchsbaum, B., Humphries, C., and Muftuler, T. (2003). Auditory–motor interaction revealed by fMRI: speech, music, and working memory in area Spt. J. Cogn. Neurosci. 15, 673–682.
Hinton, G. E., and Shallice, T. (1991). Lesioning an attractor network: investigations of acquired dyslexia. Psychol. Rev. 98, 74–95.
Houde, J., Nagarajan, S., and Heinks-Maldonado, T. (2007). Dynamic cortical imaging of speech compensation for auditory feedback perturbations. J. Acoust. Soc. Am. 121, 3045.
Houde, J. F., Nagarajan, S. S., Sekihara, K., and Merzenich, M. M. (2002). Modulation of the auditory cortex during speech: an MEG study. J. Cogn. Neurosci. 14, 1125–1138.
Huber, D. E., Tian, X., Curran, T., O’Reilly, R. C., and Woroch, B. (2008). The dynamics of integration and separation: ERP, MEG, and neural network studies of immediate repetition effects. J. Exp. Psychol. 34, 1389–1416.
Hultén, A., Vihla, M., Laine, M., and Salmelin, R. (2008). Accessing newly learned names and meanings in the native language. Hum. Brain Mapp. 30, 976–989.
Ishai, A., Haxby, J. V., and Ungerleider, L. G. (2002). Visual imagery of famous faces: effects of memory and attention revealed by fMRI. Neuroimage 17, 1729–1741.
Jaaskelainen, I. (2010). The role of speech production system in audiovisual speech perception. Open Neuroimag. J. 4, 30–36.
Kauramaki, J., Jaaskelainen, I., Hari, R., Mottonen, R., Rauschecker, J., and Sams, M. (2010). Lipreading and covert speech production similarly modulate human auditory-cortex responses to pure tones. J. Neurosci. 30, 1314.
Kawato, M. (1999). Internal models for motor control and trajectory planning. Curr. Opin. Neurobiol. 9, 718–727.
Kosslyn, S. M. (1994). Image and Brain: The Resolution of the Imagery Debate. Cambridge, MA: MIT Press.
Kosslyn, S. M., Ganis, G., and Thompson, W. L. (2001). Neural foundations of imagery. Nat. Rev. Neurosci. 2, 635–642.
Kosslyn, S. M., and Thompson, W. L. (2003). When is early visual cortex activated during visual mental imagery? Psychol. Bull. 129, 723–746.
Kraemer, D. J. M., Macrae, C. N., Green, A. E., and Kelley, W. M. (2005). Musical imagery sound of silence activates auditory cortex. Nature 434, 158.
Lotze, M., Montoya, P., Erb, M., Hulsmann, E., Flor, H., Klose, U., Birbaumer, N., and Grodd, W. (1999). Activation of cortical and cerebellar motor areas during executed and imagined hand movements: an fMRI study. J. Cogn. Neurosci. 11, 491–501.
Lounasmaa, O. V., Hamalainen, M., Hari, R., and Salmelin, R. (1996). Information processing in the human brain: magnetoencephalographic approach. Proc. Natl. Acad. Sci. U.S.A. 93, 8809–8815.
Mazard, A., Laou, L., Joliot, M., and Mellet, E. (2005). Neural impact of the semantic content of visual mental images and visual percepts. Cogn. Brain Res. 24, 423–435.
Mazziotta, J., Toga, A., Evans, A., Fox, P., Lancaster, J., Zilles, K., Woods, R., Paus, T., Simpson, G., and Pike, B. (2001). A probabilistic atlas and reference system for the human brain: International Consortium for Brain Mapping (ICBM). Philos. Trans. R. Soc. Lond., B, Biol. Sci. 356, 1293.
Mechelli, A., Price, C. J., Friston, K. J., and Ishai, A. (2004). Where bottom-up meets top-down: neuronal interactions during perception and imagery. Cereb. Cortex 14, 1256–1265.
Meister, I. G., Krings, T., Foltys, H., Boroojerdi, B., Müller, M., Töpper, R., and Thron, A. (2004). Playing piano in the mind: an fMRI study on music imagery and performance in pianists. Cogn. Brain Res. 19, 219–228.
Mellet, E., Petit, L., Mazoyer, B., Denis, M., and Tzourio, N. (1998). Reopening the mental imagery debate: lessons from functional anatomy. Neuroimage 8, 129–139.
Miall, R. C., and Wolpert, D. M. (1996). Forward models for physiological motor control. Neural Netw. 9, 1265–1279.
Mitchell, T. M., Shinkareva, S. V., Carlson, A., Chang, K. M., Malave, V. L., Mason, R. A., and Just, M. A. (2008). Predicting human brain activity associated with the meanings of nouns. Science 320, 1191.
Moro, V., Berlucchi, G., Lerch, J., Tomaiuolo, F., and Aglioti, S. M. (2008). Selective deficit of mental visual imagery with intact primary visual cortex and visual perception. Cortex 44, 109–118.
Moscovitch, M., Behrmann, M., and Winocur, G. (1994). Do PETS have long or short ears? Mental imagery and neuroimaging. Trends Neurosci. 17, 292.
Numminen, J., Salmelin, R., and Hari, R. (1999). Subject’s own speech reduces reactivity of the human auditory cortex. Neurosci. Lett. 265, 119–122.
Parsons, L. M., Fox, P. T., Downs, J. H., Glass, T., Hirsch, T. B., Martin, C. C., Jerabek, P. A., and Lancaster, J. L. (1995). Use of implicit motor imagery for visual shape discrimination as revealed by PET. Nature 375, 54–58.
Paus, T., Perry, D. W., Zatorre, R. J., Worsley, K. J., and Evans, A. C. (1996). Modulation of cerebral blood flow in the human auditory cortex during speech: role of motor-to-sensory discharges. Eur. J. Neurosci. 8, 2236–2246.
Pfurtscheller, G., and Neuper, C. (1997). Motor imagery activates primary sensorimotor area in humans. Neurosci. Lett. 239, 65–68.
Poeppel, D., Idsardi, W. J., and van Wassenhove, V. (2008). Speech perception at the interface of neurobiology and linguistics. Philos. Trans. R. Soc. Lond., B, Biol. Sci. 363, 1071.
Porro, C. A., Cettolo, V., Francescato, M. P., and Baraldi, P. (2000). Ipsilateral involvement of primary motor cortex during motor imagery. Eur. J. Neurosci. 12, 3059–3063.
Porro, C. A., Francescato, M. P., Cettolo, V., Diamond, M. E., Baraldi, P., Zuiani, C., Bazzocchi, M., and di Prampero, P. E. (1996). Primary motor and sensory cortex activation during motor performance and motor imagery: a functional magnetic resonance imaging study. J. Neurosci. 16, 7688–7698.
Pylyshyn, Z. (1981). The imagery debate: analogue media versus tacit knowledge. Psychol. Rev. 88, 16–45.
Pylyshyn, Z. (2003). Return of the mental image: are there really pictures in the brain? Trends Cogn. Sci. 7, 113–118.
Quiroga, Q. (2006). Movement intention is better predicted than attention in the posterior parietal cortex. J. Neurosci. 26, 3615.
Rauschecker, J., and Scott, S. (2009). Maps and streams in the auditory cortex: nonhuman primates illuminate human speech processing. Nat. Neurosci. 12, 718–724.
Roberts, T. P. L., Ferrari, P., Stufflebeam, S. M., and Poeppel, D. (2000). Latency of the auditory evoked neuromagnetic field components: stimulus dependence and insights toward perception. J. Clin. Neurophysiol. 17, 114–129.
Roland, P. E., and Gulyas, B. (1994). Visual imagery and visual representation. Trends Neurosci. 17, 281.
Sabes, P. N. (2000). The planning and control of reaching movements. Curr. Opin. Neurobiol. 10, 740–746.
Sack, A. T., Jacobs, C., De Martino, F., Staeren, N., Goebel, R., and Formisano, E. (2008). Dynamic premotor-to-parietal interactions during spatial imagery. J. Neurosci. 28, 8417.
Sakai, K., and Miyashita, Y. (1994). Visual imagery: an interaction between memory retrieval and focal attention. Trends Neurosci. 17, 287.
Salmelin, R., Schnitzler, A., Schmitz, F., and Freund, H. J. (2000). Single word reading in developmental stutterers and fluent speakers. Brain 123, 1184.
Sams, M., Aulanko, R., Hämäläinen, M., Hari, R., Lounasmaa, O., Lu, S., and Simola, J. (1991). Seeing speech: visual information from lip movements modifies activity in the human auditory cortex. Neurosci. Lett. 127, 141–145.
Schubotz, R. (2007). Prediction of external events with our motor system: towards a new framework. Trends Cogn. Sci. 11, 211–218.
Schürmann, M., Raij, T., Fujiki, N., and Hari, R. (2002). Mind’s ear in a musician: where and when in the brain. Neuroimage 16, 434–440.
Sharma, N., Jones, P. S., Carpenter, T. A., and Baron, J. C. (2008). Mapping the involvement of BA 4a and 4p during motor imagery. Neuroimage 41, 92–99.
Sirigu, A., Cohen, L., Duhamel, J. R., Pillon, B., Dubois, B., Agid, Y., and Pierrot-Deseilligny, C. (1995). Congruent unilateral impairments for real and imagined hand movements. Neuroreport 6, 997–1001.
Sirigu, A., Duhamel, J.-R., Cohen, L., Pillon, B., Dubois, B., and Agid, Y. (1996). The mental representation of hand movements after parietal cortex damage. Science 273, 1564–1568.
Skipper, J. I., van Wassenhove, V., Nusbaum, H. C., and Small, S. L. (2007). Hearing lips and seeing voices: how cortical areas supporting speech production mediate audiovisual speech perception. Cereb. Cortex. 17, 2387–2399.
Slotnick, S. D., Thompson, W. L., and Kosslyn, S. M. (2005). Visual mental imagery induces retinotopically organized activation of early visual areas. Cereb. Cortex 15, 1570–1583.
Snyder, L. H., Batista, A. P., and Andersen, R. A. (1997). Coding of intention in the posterior parietal cortex. Nature 386, 167–170.
Sommer, M. A., and Wurtz, R. H. (2002). A pathway in primate brain for internal monitoring of movements. Science 296, 1480.
Sommer, M. A., and Wurtz, R. H. (2006). Influence of the thalamus on spatial visual processing in frontal cortex. Nature 444, 374–377.
Sommer, M. A., and Wurtz, R. H. (2008). Brain circuits for the internal monitoring of movements. Annu. Rev. Neurosci. 31, 317–338.
Talairach, J., and Tournoux, P. (1988). Co-planar Stereotaxic Atlas of the Human Brain. New York: Thieme.
Thoenissen, D., Zilles, K., and Toni, I. (2002). Differential involvement of parietal and precentral regions in movement preparation and motor intention. J. Neurosci. 22, 9024.
Tian, X., and Huber, D. (2008). Measures of spatial similarity and response magnitude in MEG and scalp EEG. Brain Topogr. 20, 131–141.
Troyer, T. W., and Doupe, A. J. (2000). An associational model of birdsong sensorimotor learning I. Efference copy and the learning of song syllables. J. Neurophysiol. 84, 1204–1223.
van Wassenhove, V., Grant, K. W., and Poeppel, D. (2005). Visual speech speeds up the neural processing of auditory speech. Proc. Natl. Acad. Sci. U.S.A. 102, 1181.
Ventura, M., Nagarajan, S., and Houde, J. (2009). Speech target modulates speaking induced suppression in auditory cortex. BMC Neurosci. 10, 58.
Vihla, M., Laine, M., and Salmelin, R. (2006). Cortical dynamics of visual/semantic vs. phonological analysis in picture confrontation. Neuroimage 33, 732–738.
von Helmholtz, H. (1910). Handbuch der physiologischen Optik, 3rd Edn, eds A. Gullstrand, J. von Kries and W. Nagel (Hamburg: Voss).
von Holst, E., and Mittelstaedt, H. (1950). Daz Reafferenzprinzip. Wechselwirkungen zwischen Zentralnerven-system und Peripherie. Naturwissenschaften 37, 467–476.
von Holst, E., and Mittelstaedt, H. (1973). “The reafference principle,” in The Behavioral Physiology of Animals and Man: The Collected Papers of Erich von Holst (R. Martin, Trans.) (Coral Gables, FL: University of Miami Press), 139–173.
Von Kriegstein, K., and Giraud, A. (2006). Implicit multisensory associations influence voice recognition. PLoS Biol. 4, e326. doi: 10.1371/journal.pbio.0040326.
Wheeler, M. E., Petersen, S. E., and Buckner, R. L. (2000). Memory’s echo: vivid remembering reactivates sensory-specific cortex. Proc. Natl. Acad. Sci. U.S.A. 97, 11125–11129.
Wolpert, D. M., and Ghahramani, Z. (2000). Computational principles of movement neuroscience. Nat. Neurosci. 3, 1212–1217.
Zatorre, R. J., and Halpern, A. R. (2005). Mental concerts: musical imagery and auditory cortex. Neuron 47, 9–12.
Zatorre, R. J., Halpern, A. R., and Bouffard, M. (2009). Mental reversal of imagined melodies: a role for the posterior parietal cortex. J. Cogn. Neurosci. 22, 775–789.
Keywords: efference copy, corollary discharge, imagined speech, motor, articulation, auditory cortex, parietal cortex, MEG
Citation: Tian X and Poeppel D (2010) Mental imagery of speech and movement implicates the dynamics of internal forward models. Front. Psychology 1:166. doi: 10.3389/fpsyg.2010.00166
Received: 05 August 2010;
Accepted: 20 September 2010;
Published online: 21 October 2010
Edited by:
Barry Horwitz, National Institutes of Health, USAReviewed by:
Iiro P. Jääskeläinen, University of Helsinki, FinlandHeikki Lyytinen, University of Jyväskylä, Finland
Copyright: Copyright © 2010 Tian and Poeppel. This is an open-access article subject to an exclusive license agreement between the authors and the Frontiers Research Foundation, which permits unrestricted use, distribution, and reproduction in any medium, provided the original authors and source are credited.
*Correspondence: Xing Tian, Department of Psychology, New York University, 6 Washington Pl. Suite 275, New York, NY 10003, USA. e-mail: xing.tian@nyu.edu