
- 1 Department of Psychology, University of Victoria, Victoria, BC, Canada
- 2 Institute for Neural Computation, University of California, San Diego, CA, USA
Why do some faces appear more similar than others? Beyond structural factors, we speculate that similarity is governed by the organization of faces located in a multi-dimensional face space. To test this hypothesis, we morphed a typical face with an atypical face. If similarity judgments are guided purely by their physical properties, the morph should be perceived to be equally similar to its typical parent as its atypical parent. However, contrary to the structural prediction, our results showed that the morph face was perceived to be more similar to the atypical face than the typical face. Our empirical studies show that the atypicality bias is not limited to faces, but extends to other object categories (birds) whose members share common shape properties. We also demonstrate atypicality bias is malleable and can change subject to category learning and experience. Collectively, the empirical evidence indicates that perceptions of face and object similarity are affected by the distribution of stimuli in a face or object space. In this framework, atypical stimuli are located in a sparser region of the space where there is less competition for recognition and therefore, these representations capture a broader range of inputs. In contrast, typical stimuli are located in a denser region of category space where there is increased competition for recognition and hence, these representation draw a more restricted range of face inputs. These results suggest that the perceived likeness of an object is influenced by the organization of surrounding exemplars in the category space.
Introduction
In Figure 1, we see the faces of two well known actors (Robert Downey Jr. and George Clooney) and the morph face created by averaging the two parent images together. The morph face presents a curious puzzle: although the morph “child” face receives equal contributions from its celebrity parents, it bears a stronger likeness to one parent than to the other. In this example, most people would agree that the morph face looks more like Robert Downey Jr. If the image is a 50/50 morph of George Clooney and Robert Downey Jr., what are the factors that drive perceptions toward one interpretation of morph face toward one parent image over the other?
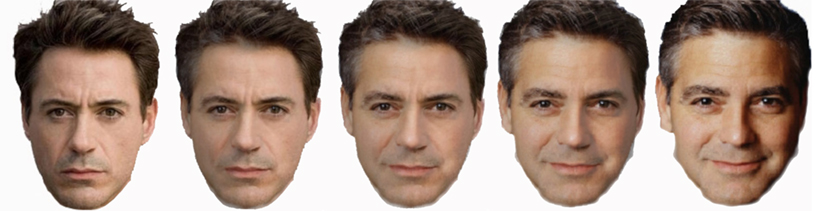
Figure 1. Images of movie actors Robert Downey Jr. (far left photo) and George Clooney (far right photo) and their 75%/25% (left middle), 50% /50% (middle) and 25%/75% (right middle) morph images.
In this paper, we propose that perceptions of the averaged morph can be affected by the distinctiveness of its parents. According to the atypicality bias account, when pitted against one another, the atypical parent will exert more influence on the morphed image than the typical parent. In our framework, we conceptualize face representations as attractor fields that compete for activation of the face input. Activation of a face representation is determined by the degree of fit between the face stimulus and face representation. We hypothesize that due to their location in face space, atypical faces have broader attractor fields than typical faces. In this paper, we examine the atypicality bias generalizes to other categories besides faces. Finally, we also explore the learning trajectory of the atypicality bias and investigate how our perceptions of what’s typical and what’s atypical change as function of learning and category experience.
Faces in Euclidean Face Space
By the time most people reach adulthood, they are able to recognize upwards of thousands if not tens of thousands of faces. A critical question is how are face representations organized in memory to support recognition that is fast, effortless, and relatively error-free. It has been proposed that faces are organized in a hyper-dimensional, Euclidean coordinate system, or “face space” as defined by the perceptual dimensions of the face stimulus (Valentine, 1991). The precise dimensions of face space are not explicitly specified, but presumably correspond to the physical properties of the face, such as the length and width of the face contour, size, and shape of its eyes, nose, and mouth features, etc. Faces that share similar values on a given dimension are clustered closer together and faces with disparate values farther apart. A particular face is localized at a specific coordinate location in face space based on its dimensional values. Although conceptually separable, face dimensions are assumed to be perceptually integrated (Garner, 1974) or holistic (Tanaka and Farah, 2003), such that it is difficult to attend to one dimension (e.g., distance between the eyes) without attending to the other dimensions (e.g., shape of the eyes, spacing between the nose and mouth).
At the origin of face space lies the prototypical face that represents the mean values along these dimensions. Evidence for prototype abstraction comes from empirical studies showing that participants are more likely to falsely recognize a never-before-seen prototype dot pattern (Posner and Keele, 1968) or face (Cabeza et al., 1999) than a previously studied pattern or face. Face typicality varies as a function of distance from the origin of the space. In this coordinate system, typical or average looking faces are located near the prototypical face at the center and less typical or more unusual looking faces are located in more peripheral regions A critical assumption of the face space model is that face representations are normally distributed such that there is a higher density of typical face exemplars at the origin and a decreasing proportion of atypical face exemplars with increasing distance from the origin. Consequently, typical faces are assumed to be less distinctive in memory due to heightened competition from neighboring typical face representations. In contrast, atypical faces have fewer neighbors, are exposed to less competition, and are therefore more distinctive.
The empirical results are consistent with the face space account of distinctiveness. For example, Bartlett et al. (1984) and Going and Read (1974) demonstrated that highly distinctive faces are recognized more accurately than faces rated low in distinctiveness. Whereas atypical faces are faster to recognize due to their distinctiveness, they are slower to be categorized as “faces” due to their deviation from the face category prototype (Johnston and Ellis, 1995). The atypicality face advantage has been demonstrated for the recognition of newly familiarized faces (Light et al., 1979; Bartlett et al., 1984; Vokey and Read, 1992) and famous faces (Valentine and Bruce, 1986). Rhodes et al. (1997) showed that face caricatures, in which the features of a face are exaggerated relative to the average face prototype, are recognized more readily than anti-caricatures, in which distinctive features of a face are diminished relative to the prototype. This view is consistent with Lewis’ (2004) Face-Space-R model, where the recognition of a specific face is determined by the number and proximity of neighboring face exemplars in the space. In summary, the collective evidence supports the predictions of the face space model where the clustering of representations in face space renders typical faces less memorable and atypical faces more memorable in recognition.
The face space concept has been explored in aftereffects paradigms where prolonged exposure to an adapting face stimulus causes a systematic bias in the perception of a subsequent test face (for a recent review, see Webster and MacLeod, 2011). For example, adapting to a contracted face causes a normal face to appear expanded (Webster and MacLin, 1999), an Asian face to appear more Caucasian (Webster et al., 2004) and a male face to appear more female (Rhodes et al., 2004; Webster et al., 2004). Identity-specific aftereffects have been demonstrated in which exposure to an individual face enhances recognition of the face lying directly opposite to adapting face in face space (i.e., its anti-face; Leopold et al., 2001). For instance, adapting to a face with a narrow eyes and a small, pointed chin (e.g., Fred) will enhance the perception of a face with broad eyes and a large rounded chin (e.g., anti-Fred). To account for face-specific adaptation effects, it has been proposed the faces lie on the trajectory defined by individual face, the prototypical face, and the “anti-faces” on opposite side of face space and this family of faces is systematically affected by the adaptation manipulation, such that adapting to anti-Fred renders the prototypical face to appear more like Fred. Critically, adaptation effects do not generalize to other faces that are proximal to the target face in face space, but are located off the trajectory (Leopold et al., 2001; Rhodes and Jeffery, 2006). Collectively, results from face aftereffects studies provide compelling evidence that faces are stored in a multi-dimensional face space with the prototypical face lying at its origin.
A second prediction of the face space model is that the similarity of a face stimulus is a linear function of its distance in Euclidean space (Shepard, 1964). That is, the closer a face input is to a stored face representation, the more likely it is to be identified with that face. Face morphs provide a good test of the Euclidean prediction. In the morphing process, two faces are graphically averaged to produce a “child” morph face. The physical face morph varies as a function of the relative contributions of the parent images. For example, an 80/20 morph that receives an 80% contribution from Parent A and 20% contribution from Parent B will lie closer to Parent A than Parent B in face space and should therefore bear a stronger resemblance to the Parent A image. The 50/50 morph face (i.e., a morph face that receives equal contribution from both parent faces) presents an interesting test of recognition because it lies an equal distance from both parent faces and, therefore, should be perceived as equally similar to both parents. As discussed in the next section, although the Euclidean predictions of similarity are straightforward, the empirical evidence suggests that the nearest neighbor is not the only factor that determines how similar (or different) two faces appear.
Faces and the Atypicality Bias
Tanaka et al. (1998) used a delayed match-to-sample task to test the assumption of the attractor field model that distinctive category members possess larger attractor fields than typical members. Tanaka et al. (1998) identified a set of eight typical and eight distinctive faces through pilot testing and morphed each typical face with each distinctive face of the same gender (Figure 2). To construct a morph of the atypical and typical parent faces, corresponding control points were identified on the two parent images (e.g., the corner of the left eye on Parent Face Image 1 and Parent Face Image 2). The number of control points for facial features were kept constant, with 12 points on the mouth, 7 points on each eye, 6 points on the nose, 5 points on each eyebrow, and 22 points for the outline of the face. According to the level of morphing, new control points for the morph face were defined by moving the specified distance along the vector connecting the control points in parent images. The locations of intervening pixels were linearly interpolated across the surface based on the position of the nearest control point (Wolberg, 1990). A fade process was then employed in which the brightness values for each corresponding pixel were weighted according to the contribution of each parent image.
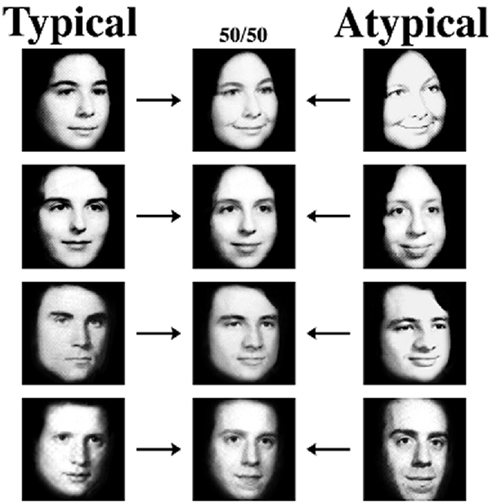
Figure 2. Examples of the atypical and typical female and male faces and their 50/50 morph faces used in the Tanaka et al. (1998) study.
This procedure yielded eights morphs, each containing an equal physical contribution from its two “parents” (one typical, one distinctive). The Tanaka et al. (1998) paradigm tested whether the morph face would be judged more similar to the atypical parent, as would be predicted by the attractor field model. On each trial, a pair of parent faces was presented on opposing sides of the computer screen for 2.5 s. The parents were replaced with the morph of the pair for 1 s, after which the morph disappeared, and participants indicated whether it more closely resembled the parent presented on the right or the parent presented on the left. The measure of interest was the percentage of trials on which the atypical parent was chosen. In the most straightforward version of the task (Tanaka et al., 1998, Experiment 1), participants indicated that the atypical parent was more similar to the morph on 60% of trials, significantly greater than the 50% (chance) level that would be expected if the morph appeared equally similar to the typical and atypical parents.
Was the atypical parent chosen more often than the typical parent because it was perceived to be more similar to the morph or simply because it was more memorable than the typical parent? To address this question, Tanaka et al., 1998, Experiment 2) added an “unrelated” condition in which two parent stimuli were followed by the morph of a different set of parents. When participants viewed related morphs, they selected the atypical parent on 63% of trials, replicating the atypicality bias. When viewing unrelated morphs, however, they chose the typical parent on 60% of trials. This result suggested that the atypicality bias observed in Experiment 1 and the related condition of Experiment 2 were not due to preferential choosing of the more memorable parent; if memorability alone drove responses, an atypicality bias would be expected in the unrelated condition as well. Instead, a typicality bias was observed, a sensible result given that a randomly selected morph is likely to be more similar to a typical face than an atypical face. Experiment 3 demonstrated an atypicality bias when the morph and parents were presented simultaneously, providing further evidence that the phenomenon is perceptually driven rather than memory-driven.
A second goal of Experiment 3 was to examine the perceptual locus of the atypicality bias. Given that typical faces are assumed to be recognized on the basis of configural properties while atypical faces are often perceived as such based on a particular distinctive feature, inversion provides a means of measuring the relative contributions of each type of processing to the atypicality bias. Because inversion is thought to disrupt configural more than featural processing, the atypicality bias should be attenuated with inverted stimuli to the extent that configural processing underlies the effect. Tanaka et al. (1998) added test blocks in which the stimuli were inverted and observed an atypicality bias that was significant (55%) but diminished relative to the magnitude of the effect for upright faces (62%). Tanaka et al. (1998) concluded that both configural and featural processing play a role in the perception that the morph is more similar to the atypical parent.
In the attractor field model, the attractor basin surrounding each stimulus is demarcated by a boundary signifying a point in similarity space at which a stimulus input will activate either of two representations with equal probability. The disparity in the similarities of the morph to its typical and atypical parents suggests that the boundary between the parents is not located at their midpoint. Where, then, does the boundary or point of subjective equality (PSE) between a typical and an atypical exemplar lie? Tanaka et al., 1998, Experiment 4) explored this issue by creating morphs with unequal contributions from the typical and atypical parent (e.g., 55% typical, 45% atypical, 60/40%, 65/35%; see Figure 3). The combination at which a morph is judged equally similar to the typical and atypical parent provides an indication of the relative distance of the attractor boundary from each parent. Interpolating from the atypicality bias observed in the various morph combination conditions, Tanaka et al. (1998) concluded that a morph containing a 63% contribution from its typical parent and a 37% contribution from its atypical parent is the PSE where the morph is perceived to bear equal resemblance to both parents. This outcome suggests a boundary at roughly two-thirds of the distance between the atypical and the typical parent for the face stimuli used by Tanaka and colleagues.
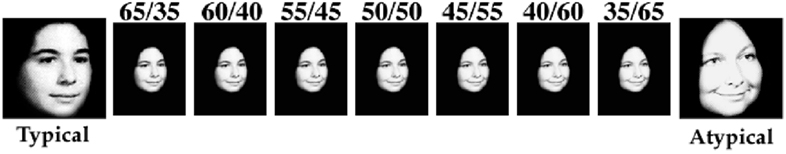
Figure 3. Example of the continuum of morph faces produced by image averaging a typical and atypical face pair. Morph faces in the continuum were produced in 5% intervals ranging from 35% contribution from the atypical (typical) parent to 65%.
Tanaka and Corneille (2007) tested a simple yet important prediction of the attractor field model: if a morph is considered more similar to its atypical parent than its typical parent, it should be more difficult to discriminate from its atypical parent than its typical parent. Because 50/50 morphs are highly distinct from both parents and can be identified as such with near-ceiling accuracy, the comparisons of interest concerned morphs with unequal contributions. For example, a 70% atypical, 30% typical morph should be more difficult to discriminate from its atypical parent than a 30% atypical, 70% typical morph should be to discriminate from its typical parent. This prediction falls out of the assumption that atypical exemplars possess the largest attractor fields: the probability that a morph positioned some distance from its atypical parent will fall within the large field of that atypical parent is greater than the probability that a morph positioned the same distance from its typical parent will fall within that typical parent’s smaller field.
Tanaka and Corneille, 2007, Experiment 1 tested this prediction with a sequential same-different task in which a parent face was presented for 2 s, a blank screen appeared for 1 s, and the same parent (“same” trials) or a morph with 50, 60, 70, or 80% contribution from that parent (“different” trials) was presented for 1 s. Participants judged whether the second face was the same as or different than the first. Consistent with the attractor field model hypothesis, participants were more accurate in saying “different” when typical parents were paired with 60, 70, and 80% typical morphs than when atypical parents were paired with 60, 70, and 80% atypical morphs. A simultaneous version of the task (Tanaka and Corneille, 2007, Experiment 2) produced similar results.
Non-Euclidean Face Space and Krumhansl’s Distance-Density Hypothesis
The foregoing results (Tanaka et al., 1998; Tanaka and Corneille, 2007) emphasize an important distinction between physical similarity and psychological similarity in face perception. Faces that are physically equivalent to each other as measured by their Euclidean distance in face space are not necessarily perceived as psychologically equivalent. In our work, we found that the atypical face, located in a sparser region of face space with fewer and more distant neighbors, exerts more influence on the morph than the typical face situated in a densely populated region with many close-by neighbors. The main message of the atypicality findings is that the surrounding category context in which the faces are found contributes to their perceived similarity.
Krumhansl’s (1978) distance-density hypothesis provides a parsimonious account of how perceived similarity is affected by physical and category factors. In her approach, similarity is determined by two components: (1) the inter-point distance between two exemplars and (2) the spatial density of representations surrounding the exemplars. As applied to faces and face space, these independent contributions are conceptualized in the equation below,
where the psychological similarity is calculated based on the Euclidean distance between face1 and face2, d(face1, face2), the spatial density of exemplars surrounding face1, δ(face1), and face2, δ(face2), and the relative weights, α and β, assigned to those densities. Density (δ) is calculated as the summed difference between the target exemplar and all exemplars in the stimulus domain such that near neighbors will have a larger impact on density than far neighbors. The distance-density hypothesis predicts that if two pairs of faces are equivalent to one another in their Euclidean distance d, the pair located in the sparser, less dense region of the face space will be perceptually more similar to each other than the pair situated in a denser region. The morphing evidence confirms this prediction. Although the 50/50 morph is equidistant from the atypical and typical face in similarity space, subjects judged the morph face as bearing a stronger resemblance to the atypical parent than the typical face.
Attractor Fields, Face Spaces, and Recognition
To account for the atypicality bias, we conceptualized face representations as attractor fields (Hopfield, 1992). According to this scheme, memory representations, such as familiar faces, form stable points in the face space that carve valleys or basins in its landscape (Tank and Hopfield, 1987). In recognition, analogous to a raindrop moving downhill to minimize its gravitational energy, the to be recognized face stimulus decreases its computational energy by following the path that leads to the nearest attractor basin in representational space. Following this approach, the stimulus need not be a perfect fit with its underlying representation, only a close enough approximation to fall within the boundaries of the attractor field’s basin. The potential activation of any given representation will therefore be directly proportional to the size or span of its attractor field (e.g., representations with large attractor fields will capture a broader range of stimulus inputs).
The attractor basins of visually similar faces are spatially close together in face space whereas faces that are distinct are far apart. The size of the attractor basin determines its influence on face space inputs. Face representations with relatively large attractor fields exert a broad influence on face space and have the potential to capture face inputs possess. Representations with smaller attractor fields have a more limited influence over face inputs. As shown in Figure 4, the Euclidean relationships between faces are preserved in the model where the morph face is shown as being equidistant from its typical and atypical parent faces. However, the atypicality bias is the result of the broader attractor field of the atypical face whose influence extends over a greater region of face space. Thus, a 50/50 morph that is situated between a typical and atypical parent face is more likely to fall into the basin of the atypical parent. As mentioned above, the attractor influence of the atypical parent extended to about 37/63% boundary in one of our experiments, suggesting a point of so-called subjective equality where a morph is equally likely to categorized as more similar to its typical parent or its atypical parent.
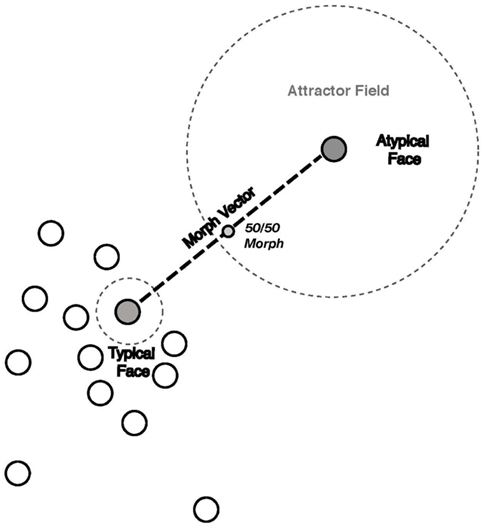
Figure 4. Diagram of the attractor field model. The atypical and typical representations of interest are depicted as filled gray circles. Located in a sparse sub-region of face space, the atypical face representation has a larger attractor field relative to the smaller attractor field of the typical representation situated in a denser sub-region. The morph vector is indicated by the dashed line connecting the atypical and typical parent face representations and morph representations are located along the vector. The 50/50 morph is located at the midpoint of the vector and is equal in its physical distance from its atypical and typical parent representations. The atypicality bias is the result of the 50/50 morph lying closer to attractor boundary of the atypical representation than the typical representation.
Atypicality Bias for Non-Face Objects
There has been considerable debate as to whether the cognitive processes and neural substrates for face recognition are specific to faces or whether these processes are employed in the recognition of other expert objects (Kanwisher, 2000; Tarr and Gauthier, 2000). A related question is whether the organization of face representations in face space significantly differs from the organization of objects in object space. Structurally, all faces share the same internal features (i.e., eyes, nose, and mouth) arranged in a similar spatial configuration (i.e., the eyes are above the nose which is above the mouth). Therefore, recognition of an individual face depends on the fine-tuned discrimination of its facial features and their spatial configuration. If the typicality effect is dependent on the arrangement of face representations in memory at this subordinate level of visual analysis, it is plausible that atypicality effect may be exclusive to faces.
Although most objects (e.g., “chair,” “bird,” “car”) are fastest to be recognized at the basic level of categorization (Rosch et al., 1976; Grill-Spector and Kanwisher, 2005; Mack et al., 2009), objects are identifiable at the specific, subordinate level (e.g., “rocking chair,” “sparrow,” “Volkswagon”) on the basis of their structural properties. There is sufficient structural variation within an object category such that some members are regarded as bearing a stronger resemblance to the prototypical category shape than other members (Jolicoeur et al., 1984; Murphy and Brownell, 1985). The structural typicality is reflected in category responses where the typical exemplars (e.g., robin, sparrow) are faster to verify as category members (e.g., bird) than less typical exemplars (e.g., penguins, ostriches; Jolicoeur et al., 1984; Murphy and Brownell, 1985). Hence, the grain of resolution is sufficient to arrange non-face objects in a similarity space that is equivalent to faces. Moreover, the organization of object spaces may follow a similar pattern of distribution as faces where there is a higher density of typical objects located at the origin of the space and sparser density of atypical objects at the periphery.
To assess the structure of non-face object spaces, typicality ratings were collected for the car and bird exemplars to determine the typical and atypical members of these categories. The typical and atypical exemplars were then morphed together (see Figure 5). A naive group of participants judged whether the morphed object more closely resembled the atypical object parent or the typical object parent. The prediction was that if the typicality effect is special to faces, participants should be just as likely to judge the bird or automobile morph more similar to its typical or atypical parent. On the other hand, if the perception of objects, like faces, is influenced by structural typicality, participants should demonstrate an atypicality bias for the birds and automobiles. Tanaka and Corneille, 2007, Experiment 3) found a significant atypicality bias for both birds (66%) and cars (58%), extending the phenomenon to non-face objects. These findings indicate that the notion of a similarity space applies to birds and cars (and, presumably, to many other object classes beyond faces) and suggests that the attractor field model is applicable to non-face object classes in which a given exemplar may be placed along a continuum of typicality.
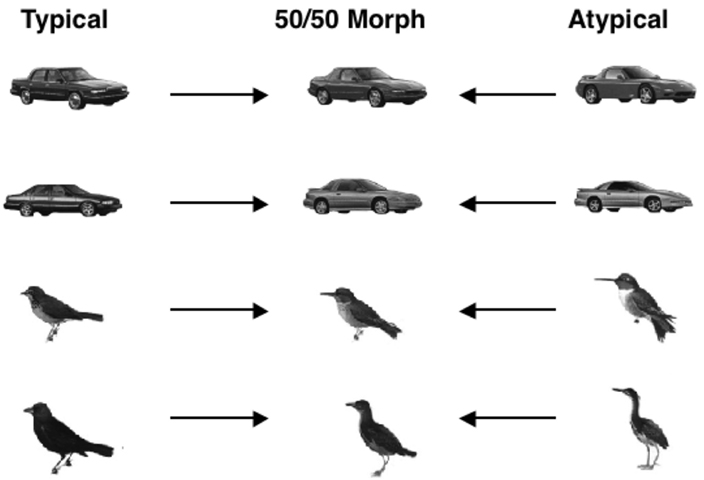
Figure 5. Examples of birds and car exemplars rated high or low in typicality and their 50/50 morphs used in Tanaka and Corneille (2007) study.
Acquisition of the Atypicality Bias
How do atypical exemplars come to attract a wider range of inputs than typical exemplars? The dynamic systems approach was intuitively appealing to us for several reasons. First, it stresses the qualities of the time-dependent, ever changing representational states of the perceptual system that respond spontaneously to the environmental inputs (Beer, 2000; Spencer and Schöner, 2003). Second, dynamic systems are also stable in that their behaviors are consistent and predictable and flexible in that they can accommodate and change in response to new learning experiences. This characterization seems well suited to describe the face recognition system that is constantly warped and molded to encode and incorporate new face memories. Third, dynamics systems preserve the physical and psychological properties of face space. Kantner and Tanaka(in press) proposed that the physical structure of items alone cannot drive the atypicality bias because their distinctiveness is a function of their physical relationship to other category members. Until the category structure is learned, then, there should be little or no basis for perceiving certain items as less typical than others.
Kantner and Tanaka tested the hypothesis that the atypicality bias emerges only after category learning has occurred. Because natural categories such as those used in previous studies of the atypicality bias are known to participants from everyday experience, Kantner and Tanaka created artificial stimuli called “blobs” whose category structure could be learned within an experimental session. Each blob category was formed around a central prototype; typical category exemplars were created by making small deviations on the prototype while atypical members were composed of larger deviations. Each category consisted of four typical and four atypical exemplars, thus equating frequency across levels of typicality and varying only structural atypicality (in natural categories, by contrast, frequency, and typicality are often confounded).
Pilot testing using the preference task described above (e.g., Tanaka et al., 1998) established two blob categories eliciting a statistically negligible level of bias. In order to test the effects of learning on the atypicality bias, Kantner and Tanaka gave a preference task before and after participants trained to categorize members of the two categories to criterion (Experiment 1). Consistent with their hypothesis, participants showed a small, non-significant atypicality bias (52%) before category training but a significant post-training bias (58%) that was consistent in magnitude with those of experiments using natural categories.
In Experiment 2, Kantner and Tanaka demonstrated that category training per se is not necessary to induce an atypicality bias within an experimental session. They replaced the training phase in Experiment 1 with a simple pleasantness rating task and observed similar results: a small, non-significant atypicality bias (53%) before the ratings task and a significant atypicality bias after (nearly 60%). This result suggests that participants do not need be engaged in an explicit categorization task to apprehend the normative appearance of members within a category, a finding consistent with past research on implicit category learning. Further, they suggest that this form of learning is sufficient to produce an atypicality bias.
A developmental test of the atypicality effect for faces and objects
The finding that the atypicality bias can be shown to accrue with experience using artificial stimuli raises a related hypothesis concerning the developmental trajectory of the bias. Tanaka et al. (2011) predicted that children who have not gained sufficient experience with natural categories to possess a fully formed sense of the associated category structure should show a diminished or non-existent bias in perceiving members of those categories. Tanaka et al. (2011) tested this hypothesis by presenting faces, birds, and cars in a preference task to children aged 3–4, 5–6, 7–8, 9–10, and 11–12 as well as college-aged adults. Surprisingly, they found a substantial atypicality bias for faces and birds that was statistically invariant across age groups. Although the bias was stronger for birds (71%) than for faces (63%), both biases were evident from the earliest age group tested. An additional unexpected finding concerned the car stimuli, which did not produce an atypicality bias in any of the age groups. Tanaka et al. (2011) speculated that their car stimuli (normed in 1997) may not have conformed to current standards of typicality. The bird and face results, however, suggested that the mental representation of these category structures is well established even in very young children.
Modeling Attractor Fields
Can the predictions of the distance-density hypotheses be tested in a neural network model? In previous simulations, neural networks have been applied to study caricature recognition (Tanaka and Simon, 1996) and atypicality effects in face recognition processes (Burton et al., 1990; Valentine and Ferrara, 1991). Connectionist implementation has been shown to preserve the Euclidean properties of face space where structurally similar faces are located closer together in face space and structurally dissimilar face are farther apart (Burton et al., 1990; Valentine and Ferrara, 1991; Tanaka and Simon, 1996; Lewis and Johnston, 1998). In this approach, the features of a face, such as its outline, internal features, and spatial configuration are abstractly represented as feature units in a face vector. The similarity between any two face vectors can be expressed by the angle of their dot product such that similar faces will form a relatively small angle and dissimilar faces will have a relatively large angle.
As a test of the atypicality bias, Tanaka et al. (1998) constructed a neural model composed of three layers: a 10-unit input layer, a 5-unit middle (hidden) layer, and a 4-unit output layer. The typical vectors were constructed such that they differed from each other by two feature units (i.e., [1, 0, 1, 0, 1, 0, 1, 0, 1, 0], [1, 1, 0, 0, 1, 0, 1, 0, 1, 0], [1, 0, 0, 0, 1, 1, 1, 0, 1, 0]) whereas the one atypical vector differed from the typical vectors by six feature units (e.g., [0, 0.5, 0.5, 1, 0, 0.5, 1, 0, 0.5, 1]. By virtue of their vector structures, the typical vectors are located nearer the origin of face space whereas the atypical vector is located further away from the origin. In the simulation, the typical and atypical feature vectors provided the inputs to the model with each vector associated with a unique unit at the output. Training continued for 100 epochs. After learning, morph vectors were created by averaging the values of the atypical face vector with and the values of the typical feature vectors. For example, the features of Typical Feature Vector 1 [1, 0, 1, 0, 1, 0, 1, 0, 1, 0] and Atypical Feature Vector 4 [0, 0.5, 0.5, 1, 0, 0.5, 1, 0, 0.5, 1] were averaged to produce the Morph 1–4 vector of [0.5, 0.25, 0.75, 0.5, 0.5, 0.25, 1, 0, 0.75, 0.5].
The critical test of the atypicality bias was the network’s response to the morph vector. When the three typical-atypical morph vectors were presented to the network, stronger activation was produced in the atypical face output unit than of the typical face output units. Consistent with the empirical findings, the neural network showed a bias for atypical representations over typical representations. The simulation demonstrates that neural network recognition is sensitive to distribution of representations in the similarity space. These findings provide computational support for the claim that recognition is determined by the match between the input and the associated output and the density of the surrounding representations.
Bartlett and Tanaka (1998) extended the predictions of an attractor network model using real female face images. In their simulation, a 1000-dimensional Hopfield network was trained on 32 patterns consisting of Gabor filter outputs for eight typical faces and eight atypical faces, and their mirror reversed images. The network was tested by presenting the image representation of 32 female 50/50 morph faces (16 combinations of 4 typical and 4 atypical faces, plus mirror reversed images). The sustained activity pattern for each of the morph images was compared to that for its two parent images. The simulation results showed that the morphed face fell into the basin of attraction for the atypical parent face six times, whereas it never fell into the basin of attraction for the typical parent face. The remaining 26 morphed faces settled to a distinct pattern of sustained activity that differed from both parents. Of these, 22 were closer to the atypical than typical parent, two were equidistant, and two were closer to the typical than atypical parent. Overall, the attractor network would have selected the atypical parent 87.5% of the time based on Euclidean distance of the sustained activity patterns to the parent patterns. The attractor network model with real face images exhibited an atypicality bias in the sustained activity patterns for the morphed faces.
Information Maximization Hypothesis
Although a several computational models demonstrated an atypicality bias, the most parsimonious account is provided by information maximization. This account reduces the model to a simple goal of optimizing information transfer in sensory coding given the statistics of face images in the visual environment. The information maximization account is compatible with Krumhansl’s distance-density hypothesis, and generalizes this idea to a computational principle from information theory. Although the back-propagation model illustrated the general concept that an atypicality bias can emerge from the statistics of the training data, information maximization is an unsupervised learning strategy that is a more biologically plausible model of learning in the brain. Information maximization also provides a more parsimonious account than the attractor network model, which assumes that coding takes the form of sustained patterns of activity, and can take many iterations to settle. Moreover in a Hopfield attractor network, decorrelation is a component of the learning rule that is necessary in order to encode highly similar patterns (i.e., faces) as distinct patterns of sustained activity (Kanter and Sompolinsky, 1987). Decorrelation is closely related to information maximization (Bell and Sejnowski, 1997), and hence the atypicality bias that emerged in the attractor network could be related to the underlying principle of information maximization.
Information maximization is a principle from information theory (Shannon, 1948) describing a coding strategy for maximizing the information transfer capacity of a communication system by ensuring that all response levels are used with equal frequency. More response levels are allocated for high probability ranges of the input signal, and fewer response levels are allocated for low probability ranges of the input signal. In a system with limited dynamic range, information transfer is maximized by matching the response function to the cumulative probability density of the input signal.
This concept is illustrated in Figure 6, adapted from Laughlin (1981). The upper curve shows a probability density function for the magnitude of a stimulus property in the world, such as contrast level. The lower curve shows the response function that implements the information maximization strategy. In this example the output has 10 response states, corresponding to 10 “just noticeable differences” (JND) in response. The response function insures that the interval between each response level encompasses an equal area under the probability distribution for the stimulus property, so that each state is used with equal frequency. In the limit where the states are vanishingly small this response function corresponds to the cumulative probability function for stimulus intensities, which is the probability that the stimulus takes on value x or less. Note that the slope is steep where the probability density is high, and shallow where the probability density is low. As a consequence, equal changes in stimulus intensity have different effects on the response. The slope of the response function is given by the probability of the stimulus, which can lead to a number of perceptual effects, all stemming from a basic sensory coding goal of optimal information transfer.
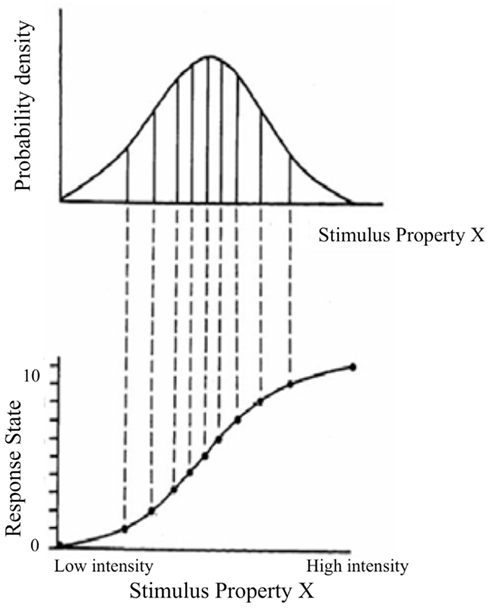
Figure 6. Illustration of information maximization principle. Adapted from Laughlin (1981).
A body of research in computational neuroscience explores how information maximization may be central principles in sensory coding early in the visual system (see Simoncelli and Olshausen, 2001 for a review). For example, Laughlin (1981) showed that luminance contrast coding in the blowfly visual system is consistent with information maximization, where the cumulative probability density of contrasts in the blowfly environment predicted depolarization of a class of cells.
These principles may be relevant to how we think about perceptual coding in higher visual processes such as face recognition as well (see Bartlett, 2007 for a review). Perceptual responses, as revealed by similarity measures and JND, may be influenced by information maximization in sensory coding. For example, face discrimination is superior for same-race than other-race faces (Walker and Tanaka, 2003), which is consistent with a perceptual transfer function that is steeper for face properties in the high density portion of the distribution in an individual’s perceptual experience (i.e., same-race faces) than for face properties in the low-density portion of the distribution (other-race faces). These concepts are also explored in Webster and MacLeod (2011).
Here we show how the information maximization principle of optimal perceptual coding would account for face typicality effects, and in particular the atypicality bias. We begin with the assumption that typical faces are from high density regions of the probability distribution for a set of physical characteristics, and that atypical faces have characteristics with lower probability on at least some dimensions, as illustrated in Figure 7A. For example, a particular physical characteristic might be distance between the eyes. Figure 7B illustrates the shape of the perceptual response function under the information maximization principle. In our example, this response function could be JND for facial identity as a function of interocular distance. The typical face is mapped to a region of the response function that is steep, and the atypical face is mapped to a region of the response function that is shallow. Due to the shape of the response function, the physical 50% morph between the typical and atypical face is projected closer to the atypical parent in the perceptual response, as shown by the dashed line onto Y-axis.
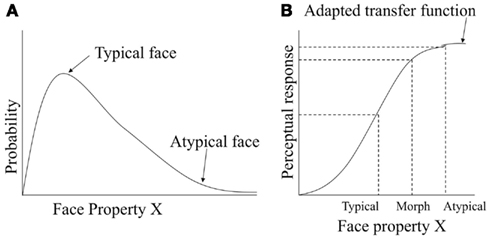
Figure 7. Information maximization account of atypicality bias. (A) Probability density function for typical and atypical faces. (B) Perceptual response for typical, atypical and the typical-atypical morph faces as predicted by adaptive transfer function.
Bartlett and Tanaka (1998) tested the assumption that images of faces rated as typical are from a higher density region of the probability distribution than images of faces rated as atypical. 62 female face images were convolved with a set of Gabor filters, which are an approximate model of the receptive fields of simple cells in primary visual cortex (Daugman, 1988). The image graylevels were passed through a bank of Gabor filters at four spatial scales (32, 26, 8, and 4 pixels per cycle) and four orientations, sampled at 255 spatial locations from the original 120 × 120 pixel images. The outputs of sine and cosine Gabor filters were squared and summed, and then the contrast was normalized by dividing by the activity across all orientations and scales at each spatial location. Such contrast normalization has been described in primary visual cortex (Heeger, 1991). Typical faces were closer to the mean face than atypical faces, when faces are represented as a bank of Gabor filter outputs. The origin of the face space was estimated as the mean across the set of 62 female faces. There was no significant difference in the distance to the mean face for the graylevel images. However, for the normalized Gabor representation, the typical faces were closer to the mean face [t(14) = 2.3, p < 0.05]. We also found that both for the original graylevel images, and for the Gabor representations of those images, there was indeed a higher density near faces rated as typical than faces rated as atypical. The mean distance of each face to its nearest neighbor in face space was compared for the eight faces rated most typical and the eight faces rated most atypical. There was a shorter distance to the first neighbor of a typical face than an atypical face for raw graylevel images [t(14) = 2.8, p < 0.05], and the difference was more pronounced for the normalized Gabor representation [t(14) = 4.3, p < 0.001]. Therefore, the optimal transfer function predicted by information maximization would have a steeper slope near the typical faces than near atypical faces, supporting the model illustrated in Figure 7B.
The infomax account makes an additional prediction. Although it is well known that faces rated as “atypical” tend to also be easier to recognize, this model predicts that subjects will be less sensitive to small perturbations in the physical properties of atypical faces. This prediction was born out by the same-different discrimination experiments of Tanaka and Corneille (2007). Sensitivity to small perturbations in the face created by morphing was significantly lower for atypical than typical faces.
A similar account applies to perceptions of morph between same-race and other-race faces. A morph stimulus that is half-way on a physical continuum between a same-race face and an other-race face is typically perceived as more similar to the other-race face (Kaping et al., 2002). This effect follows from the model shown in Figure 7B, if we assume a higher probability density of physical properties of same-race faces in an individuals perceptual experience than for the values these properties take on for other-race faces. Again, the 50% physical morph is mapped to a shallow-sloped region of the perceptual response function, and is closer to the response for other-race faces than same-race faces.
General Discussion
In this review, we describe a simple but powerful test of structural and psychological accounts of perceptual similarity. In our paradigm, two parent faces – an atypical parent face and typical parent face – are morphed together to form a child morph face that constitutes the physical average between its parents. The morph face receives a 50–50 contribution from both parents, and therefore, based on its structural (i.e., physical) properties, it should equally resemble the atypical and typical parent face. However, contrary to the structural view, participants systematically judge the morph face as bearing a stronger resemblance to the atypical parent than the typical parent. The atypicality bias indicate that perceptual similarity is not solely determined by its structural inputs, but by psychological factors related to context of those inputs and the experience of the observer.
We propose that the bias for the atypical parent can be explained by Krumhansl’s Distance-Density hypothesis in which the perceived similarity between two faces depends on their physical resemblance as well as their relative locations in the face space. According to Distance-Density hypothesis, perception of the morph stimulus is more heavily weighted toward the atypical face by virtue of its location in face space. An atypical face resides in a sparser region of face space where there is less competition for recognition than typical faces. We propose that atypical faces have broad attractor fields that allow them to capture a wider range of perceptual inputs than typical faces. Further tests of the attractor field hypothesis have shown that the atypical bias does not reflect a memory bias for more atypical, distinctive items (Tanaka et al., 1998, Experiment 3) but indicates a perceptual insensitivity to changes in an atypical face relative to changes in a typical face (Tanaka and Corneille, 2007, Experiment 1). Nor is atypicality bias “special” to faces, but extends to the perception of non-face objects, such as birds (Tanaka and Corneille, 2007, Experiment 2) and these “object” spaces are established relative early on in development (Tanaka et al., 2011).
Although the developmental evidence suggests that the structure of face space structure is established relatively early on in development (Nishimura, the category structure for non-face objects is more malleable and responsive to the effects of perceptual learning. In a recent study, we (Kantner and Tanaka, in press), created two category prototypes of polygon shapes (i.e., blobs) and a family of exemplars for each prototype (Curran et al., 2002); some blob exemplars were created such that they display modest variation from the family prototype (typical exemplars) whereas other blob exemplars showed greater variation (atypical exemplars). Participants were asked to judge where the morphs of the typical and atypical exemplars showed a stronger resemblance to the typical parent or the atypical parent before and after category training. Whereas participants did not show a preference for the atypical exemplar before category learning, they demonstrated a reliable atypicality bias after category learning (Kantner and Tanaka, in press). The influence of typicality bias in perceptual learning was further validated in several neural network simulations and is a general perceptual principle that can be described by information maximization theory (Bartlett and Tanaka, 1998; Bartlett, 2007). After learning atypical and typical inputs, the neural network simulations showed that atypical-typical morph inputs elicited a greater response in the atypical output unit than the typical output units. Collectively, the empirical and simulation results indicate that perceptual similarity is influenced by the physical properties, category structure, and learning histories of the stimuli.
In this paper, we argue that psychological similarity in object perception can be dissociated from physical similarity. To support this claim, we present evidence in which a morphed object that is physically equivalent to a typical and atypical parent object is perceived to be more psychologically similar to the atypical object than the typical object. These results suggest that beyond physical structure, the perceived likeness of an object is influenced by the organization of surrounding exemplars in the category space. Atypical objects exert more influence on judgments of perceived similarity than typical objects. Of course, whether an object is regarded as typical or atypical is not a priori pre-determined, but depends on the perceptual experience of the observer Thus, the atypicality bias exemplifies the constant refashioning of our perceptions through learning, and, more broadly, the influence of higher order cognitive process on the perceptual apparatus.
Conflict of Interest Statement
The authors declare that the research was conducted in the absence of any commercial or financial relationships that could be construed as a potential conflict of interest.
Acknowledgments
This research was supported by grants from the Temporal Dynamics of Learning Center (NSF Grant #SBE-0542013) and the National Science and Engineering Research Councils of Canada.
References
Bartlett, J. C., Hurry, S., and Thorley, W. (1984). Typicality and familiarity of faces. Mem. Cognit. 12, 219–228.
Bartlett, M. S., and Tanaka, J. W. (1998). An attractor field model of face representation: effects of typicality and image morphing. Paper Presented at the Psychonomics Society Satellite Symposium on Object Perception and Memory (OPAM), Dallas, TX.
Beer, R. D. (2000). Dynamical approaches to cognitive science. Trends Cogn. Sci. (Regul. Ed.) 4, 91–99.
Bell, A. J., and Sejnowski, T. J. (1997). The independent components of natural scenes are edge filters. Vision Res. 37, 3327–3338.
Burton, M., Bruce, V., and Johnston, R. A. (1990). Understanding face recognition with an interactive activation model. Br. J. Psychol. 81, 361–380.
Cabeza, R., Bruce, V., Kato, T., and Oda, M. (1999). The prototype effect in face recognition: extension and limits. Mem. Cognit. 27, 139–151.
Curran, T., Tanaka, J. W., and Weiskopf, D. (2002). An electrophysiological comparison of visual categorization and recognition memory. Cogn. Affect. Behav. Neurosci. 2, 1–18.
Daugman, J. (1988). Complete discrete 2-D Gabor transforms by neural networks for image analysis and compression. IEEE Trans. Acoust. 36, 1169–1179.
Going, M., and Read, J. D. (1974). Effects of uniqueness, sex of subject, and sex of photograph on facial recognition. Percept. Mot. Skills 39, 109–110.
Grill-Spector, K., and Kanwisher, N. (2005). Visual recognition: as soon as you know it is there, you know what it is. Psychol. Sci. 16, 152–160.
Heeger, D. (1991). “Nonlinear model of neural responses in cat visual cortex,” in Computational Models of Visual Processing, eds M. Landy and J. Movshon (Cambridge, MA: MIT Press), 119–133.
Hopfield, J. J. (1992). Neural networks and physical systems with emergent collective computational abilities. Proc. Natl. Acad. Sci. U.S.A. 79, 2554–2558.
Johnston, R. A., and Ellis, H. D. (1995). Age effects in the processing of typical and distinctive faces. Q. J. Exp. Psychol. A 48, 447–465.
Jolicoeur, P., Gluck, M. A., and Kosslyn, S. M. (1984). Pictures and names: making the connection. Cogn. Psychol. 16, 243–275.
Kanter, I., and Sompolinsky, H. (1987). Associative recall of memory without errors. Phys. Rev. A 35, 380–392.
Kantner, J., and Tanaka, J. W. (in press). Experience produces the atypicality bias in object perception. Perception.
Kaping, D., Duhamel, P., and Webster, M. A. (2002). Adaptation to natural face categories. J. Vis. 2, 128.
Krumhansl, C. L. (1978). Concerning the applicability of geometric models to similarity data: the interrelationship between similiarity and spatial density. Psychol. Rev. 85, 445–463.
Laughlin, S. (1981). A simple coding procedure enhances a neuron’s information capacity. Z. Naturforsch. C 36, 910–912.
Leopold, D. A., O’Toole, A. J., Vetter, T., and Blanz, V. (2001). Prototype-referenced shape encoding revealed by high-level after effects. Nat. Neurosci. 4, 89–94.
Lewis, M. B. (2004). Face-space-R: towards a unified account of face recognition. Vis. Cogn. 11, 29–69.
Lewis, M. B., and Johnston, R. A. (1998). Understanding caricatures of faces. Q. J. Exp. Psychol. 51(2), 321–346.
Light, L. L., Kayra-Stuart, F., and Hollander, S. (1979). Recognition memory for typical and unusual faces. J. Exp. Psychol. Hum. Learn. 5, 212–228.
Mack, M. L., Wong, A. C., Gauthier, I., Tanaka, J. W., and Palmeri, T. J. (2009). Time course of visual object categorization: fastest does not necessarily mean first. Vision Res. 49, 1961–1968.
Murphy, G., and Brownell, H. (1985). Category differentiation in object recognition: typicality constraints on the basic category advantage. J. Exp. Psychol. Learn. Mem. Cogn. 11, 70–84.
Posner, M. I., and Keele, S. W. (1968). On the gensis of abstract ideas. J. Exp. Psychol. 77, 353–363.
Rhodes, G., Byatt, G., Tremewan, T., and Kennedy, A. (1997). Facial distinctiveness and the power of caricatures. Perception 26, 207–223.
Rhodes, G., and Jeffery, L. (2006). Adaptive norm-based coding of facial identity. Vision Res. 46, 2977–2987.
Rhodes, G., Jeffery, L., Watson, T. L., Jaquet, E., Winkler, C., and Clifford, C. W. G. (2004). Orientation-contingent face aftereffects and implications for face-coding mechanisms. Curr. Biol. 14, 2119–2123.
Rosch, E., Mervis, C., Gray, W., Johnson, D., and Boyes-Braem, P. (1976). Basic objects in natural categories. Cogn. Psychol. 8, 382–439.
Shannon, C. E. (1948). A mathematical theory of communication. Bell Syst. Tech. J. 27, 379–423, 623–656.
Shepard, R. N. (1964). Attention and the metric structure of the stimulus space. J. Math. Psychol. 1, 54–87.
Simoncelli, E. P., and Olshausen, B. A. (2001). Natural image statistics and neural representation. Annu. Rev. Neurosci. 24, 1193–1216.
Tanaka, J., and Simon, V. (1996). Caricature recognition in a neural network. Vis. cogn. 3, 301–320.
Tanaka, J. W., and Corneille, O. (2007). Typicality effects in face and object perception: further evidence for the attractor field model. Percept. Psychophys. 69, 619–627.
Tanaka, J. W., and Farah, M. J. (2003). “Holistic face recognition,” in Analytic and Holistic Processes in the Perception of Faces, Objects and Scenes, Vol. 2, eds M. Peterson and G. Rhodes (New York: University Oxford Press), 53–91.
Tanaka, J. W., Giles, M., Kremen, S., and Simon, V. (1998). Mapping attractor fields in face space: the atypicality bias in face recognition. Cognition 68, 199–220.
Tanaka, J. W., Meixner, T. L., and Kantner, J. (2011). Exploring the perceptual spaces of faces, cars and birds in children and adults. Dev. Sci. 14, 762–768.
Tank, D. W., and Hopfield, J. J. (1987). Collective computation in neuron like circuits. Sci. Am. 257, 104–114.
Tarr, M. J., and Gauthier, I. (2000). FFA: a flexible fusiform area for subordinate-level visual processing automatized by expertise. Nat. Neurosci. 3, 764–769.
Valentine, T. (1991). A unified account of the effects of distinctiveness, inversion, and race in face recognition. Q. J. Exp. Psychol. 43A, 161–204.
Valentine, T., and Bruce, V. (1986). The effect of race inversion and encoding activity upon face recognition. Acta Psychol. (Amst.) 61, 259–273.
Valentine, T., and Ferrara, A. (1991). Typicality in categorization, recognition and identification: evidence from face recognition. Br. J. Psychol. 82, 87–102.
Vokey, J. R., and Read, J. D. (1992). Familiarity, memorability, and the effect of typicality on the recognition of faces. Mem. Cognit. 20, 291–302.
Walker, T. M., and Tanaka, J. W. (2003). An encoding advantage for own-race versus other-race faces. Perception 23, 1117–1125.
Webster, M. A., Kaping, D., Mizokami, Y., and Duhamel, P. (2004). Adaptation to natural facial categories. Nature 428, 557–561.
Webster, M. A., and MacLeod, D. I. (2011). Visual adaptation and face perception. Philos. Trans. R. Soc. Lond. B Biol. Sci. 366, 1702–1725.
Keywords: face perception, object perception, categorization, morphing, perceptual similarity
Citation: Tanaka JW, Kantner J and Bartlett M (2012) How category structure influences the perception of object similarity: The atypicality bias. Front. Psychology 3:147. doi: 10.3389/fpsyg.2012.00147
Received: 30 November 2011; Paper pending published: 22 December 2011;
Accepted: 24 April 2012; Published online: 06 June 2012.
Edited by:
Arnon Cahen, Ben Gurion University in the Negev, IsraelMichela C. Tacca, Heinrich-Heine University Düsseldorf, Germany
Reviewed by:
Michael B. Lewis, Cardiff University, UKCarol Lynne Krumhansl, Cornell University, USA
Copyright: © 2012 Tanaka, Kantner and Bartlett. This is an openaccess article distributed under the terms of the Creative Commons Attribution Non Commercial License, which permits non-commercial use, distribution, and reproduction in other forums, provided the original authors and source are credited.
*Correspondence: James William Tanaka, Department of Psychology, University of Victoria, Victoria, BC, Canada V8W 3P5. e-mail: jtanaka@uvic.ca