Transcriptional network growing models using motif-based preferential attachment
 Ahmed F. Abdelzaher
 Ahmad F. Al-Musawi
 Preetam Ghosh
 Michael L. Mayo
 Edward J. Perkins3
- 1Biological Networks Laboratory, Department of Computer Science, Virginia Commonwealth University, Richmond, VA, USA
- 2Thi Qar University, Al-Nasiriyah, Iraq
- 3Environmental Laboratory, US Army Engineer Research and Development Center, Vicksburg, MS, USA
Understanding relationships between architectural properties of gene-regulatory networks (GRNs) has been one of the major goals in systems biology and bioinformatics, as it can provide insights into, e.g., disease dynamics and drug development. Such GRNs are characterized by their scale-free degree distributions and existence of network motifs – i.e., small-node subgraphs that occur more abundantly in GRNs than expected from chance alone. Because these transcriptional modules represent “building blocks” of complex networks and exhibit a wide range of functional and dynamical properties, they may contribute to the remarkable robustness and dynamical stability associated with the whole of GRNs. Here, we developed network-construction models to better understand this relationship, which produce randomized GRNs by using transcriptional motifs as the fundamental growth unit in contrast to other methods that construct similar networks on a node-by-node basis. Because this model produces networks with a prescribed lower bound on the number of choice transcriptional motifs (e.g., downlinks, feed-forward loops), its fidelity to the motif distributions observed in model organisms represents an improvement over existing methods, which we validated by contrasting their resultant motif and degree distributions against existing network-growth models and data from the model organism of the bacterium Escherichia coli. These models may therefore serve as novel testbeds for further elucidating relationships between the topology of transcriptional motifs and network-wide dynamical properties.
1. Introduction
The dynamics of complex networks are derived using graph theoretical measurements that are deduced from the topology of the network entities and their relationships. For example, science collaboration networks are portrayed using nodes that represent scientists or authors, and links that connect pairs of nodes that coauthored an article (Albert and Barabási, 2002). Unlike engineered networks such as wireless sensor networks (Li et al., 2012) and airline transportation networks (Bensong et al., 2010), science collaboration networks fall under the “small world” category of complex networks due to their smaller average over the ensemble of shortest connected paths through a network. Networks subscribing to the same category, such as the World Wide Web, cell structures networks, protein–protein interaction networks, the Internet, and infectious disease networks have all been analyzed for path lengths, cluster formations, degree distributions, and evolutionary patterns (Albert et al., 1999; Albert and Barabási, 2002; Alm and Arkin, 2003; Alon, 2003; Dorogovtsev and Mendes, 2003; Newman, 2003; Barabasi and Oltvai, 2004; Wang, 2004; Meyers et al., 2005). Gene regulatory networks (GRNs) also belong to this category. Understanding the dynamical consequences implied by the architecture of GRNs has been one of the major goals in systems biology and bioinformatics, as it can provide insights into, e.g., disease dynamics and drug development (Margolin et al., 2006; Faith et al., 2007). In gene-regulatory networks, the nodes portray products of genes or transcription factor proteins within a cell, and a set of directed bonds which each denote pairs of nodes that interact by altering the activity of the target gene (Shmulevich and Dougherty, 2010) parameterized by the biological processes of translation and transcription (Feng et al., 2007). Unlike engineered communication networks [as in Ghosh et al. (2005)], GRNs exhibit a unique withstanding property – a phenomenon known as “Biological Robustness” (Kitano, 2004, 2007), which describes an ability of individual genes to adapt to and potentially resist disturbances to gene activity based, in part, on their connectivity to other genes of the network (Prill et al., 2005). Such a useful property could be potentially exploited to design engineered networks with similar communication properties (Ghosh et al., 2011; Kamapantula et al., 2012, 2014 and Kamapantula et al., under review).
Robustness in the expression patterns may arise from feed-back-based regulatory loops or arrangements between various repetitive subnetworks (Kauffman, 1993). This begs the question of whether such robustness can be attributed to some statistically significant GRN subnetwork, termed as transcriptional motifs (Alon, 2007). Transcriptional motifs may represent “building blocks” of many complex networks (Milo et al., 2002) (including GRNs), as they appear more commonly in GRNs than observed in randomized versions of these networks (Milo et al., 2002) – i.e., networks with the same number of nodes, links, and degree distribution as the principle network, but different overall topology. Although much consideration has been focused toward unfolding individual properties of transcriptional motifs, both theoretically (Magnan and Alon, 2003) and experimentally (Wu and Rao, 2010), little remains known regulating their patterns of interactions to the biological mechanisms of natural evolution.
In the supplementary materials of Milo et al. (2002), the authors enumerate all possible 3–6 node transcriptional motifs. Among the most common transcriptional motifs observed in GRNs of the model bacterium Escherichia coli (herein E. coli) and the baker’s yeast Saccharomyces cerevisiae (herein labeled Yeast), are feed-forward loops (FFLs) and bifans (BFs), which can be observed natively in Figures 1A,B. An FFL is hierarchically composed of three genes, a top-level “father” gene that regulates two “child” genes, wherein one of the child genes regulates the other. This specific topology allows for interesting dynamical consequences, such as pulses, signal delays, and irreversible speed-ups (Magnan and Alon, 2003). By contrast, BFs constitute four genes, two of which simultaneously regulate the other two; these motifs have been reported as constituents of dense overlapping regulons in the GRN “backbone” responsible for vital life functions, such as nutrient metabolism and bio-synthesis (Alon, 2007).
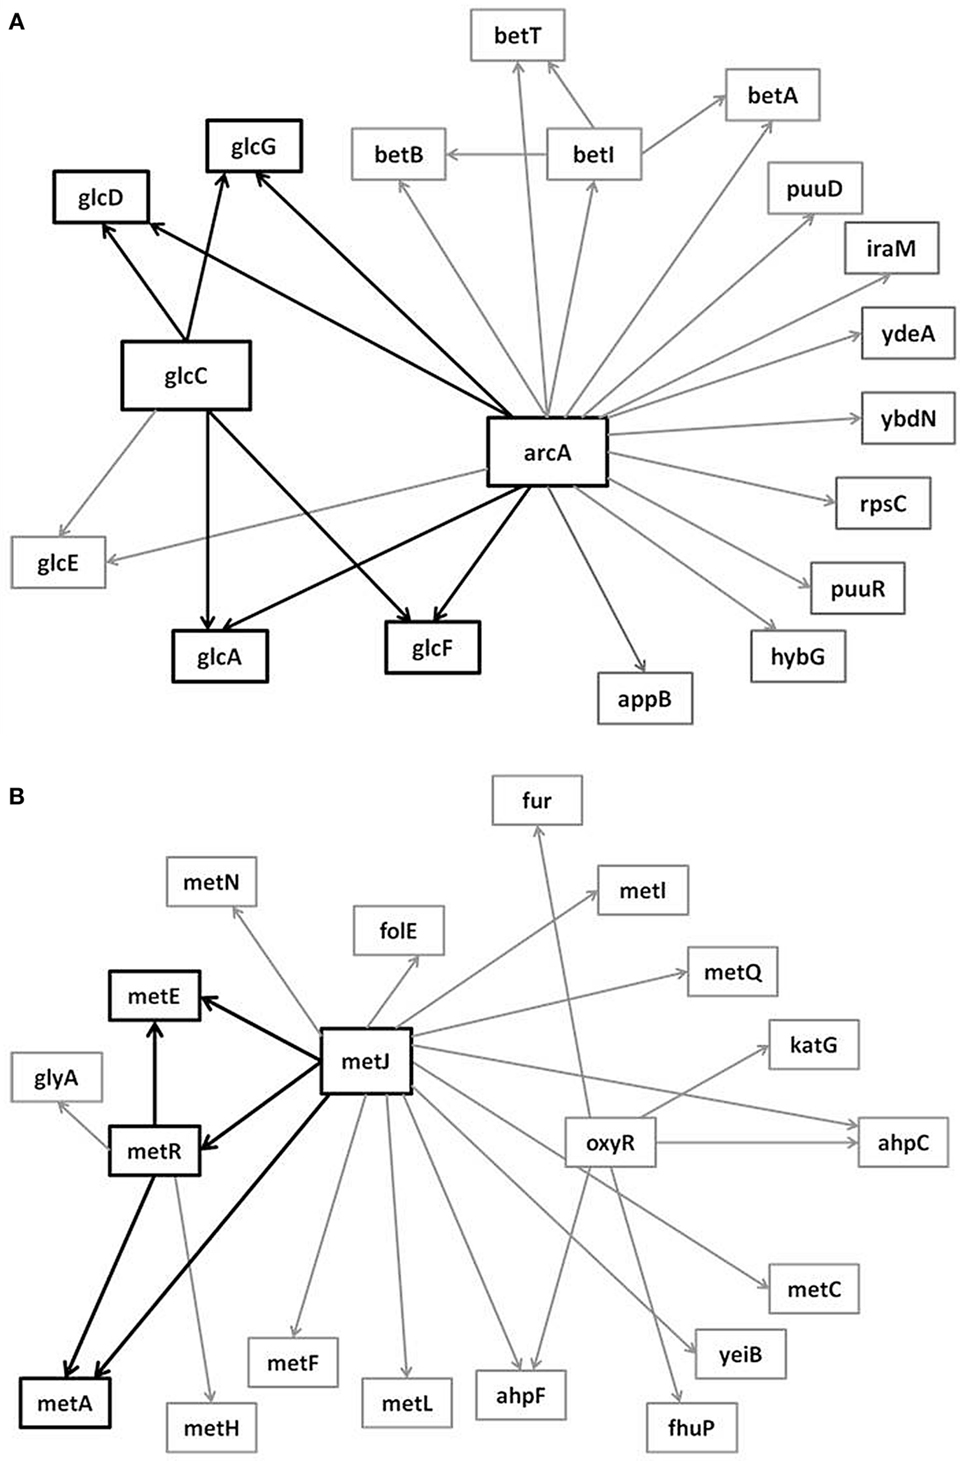
Figure 1. Embedded within sample GRN subgraphs of E. coli, the topological representation of (A) bifans. Here, transcription factors arcA and glcC co-regulate glcD and glcG. On the other hand, (B) the feed-forward loop constitutes a transcription factor (such as metJ) that regulates both a gene (metE) and another transcription factor (metR). The regulated transcription factor co-regulates the same gene (metR → metE).
It is notable to point out that many motifs are a product of the coupling between the subnetworks illustrated in Figure 2: the uplink, the downlink, and the three chain. For instance, a BF can be viewed as two downlinks coupled by sharing both child genes, while an FFL can be viewed as an uplink or a downlink sharing all three genes with a three-chain. Moreover, we have conducted computational analysis to estimate the percentages of the gene-regulatory interactions that participate in these components for an E. coli GRN. We observed that 54.7% of interactions are involved with FFLs, 82% with BFs, 99.4% by downlinks, 83.9% by uplinks and 78.3% by three-chains. Given these data for E. coli, we hypothesize that downlinks represent a primary component in the evolution of GRN topology. Despite that the impacts of motif-coupling on the functionality of GRNs remain largely mysterious, some results have been reported in this particular area. For example, investigations of gene coupling for different motif patterns have been conducted using mathematical modeling of transcription and translation in order to reveal substructure functionalities (Yung-keun and Kwang-hyun, 2007; Kim et al., 2008; Wu and Rao, 2010). Additionally, experiments have revealed that bacteria can endure a great deal of regulatory interaction rewiring via manipulation of protein-binding DNA sequences (Isalan et al., 2008).
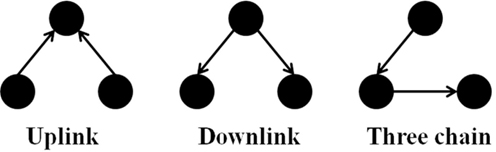
Figure 2. The three-node two-edge motif substructures.
To further understand how transcriptional motifs “interact” via regulatory bonds, we have previously studied how the individual genes of E. coli are distributed through the FFLs of its GRN (Mayo et al., 2012). There we contrasted node-motif distributions of E. coli with “randomized” networks constructed node-by-node via a preferential attachment algorithm that leveraged both linear and non-linear attachment kernels (Krapivsky et al., 2000). This modified preferential attachment algorithm resulted in FFL abundances that compared well to the overall GRN of E. coli; however, fidelity of the motif participation distribution of the nodes in the generated network was very low when compared with that from E. coli. In this paper, we extend this prior algorithm based on the following two criteria:
1. Our modified preferential attachment algorithm was oblivious to the distinction of the two different types of nodes in transcriptional networks: genes and transcription factors (TFs). Since transcriptional networks only allow TF-to-TF and TF-to-gene edges, a distinction between these biological classes that restricts allowed bonds may improve fidelity of the “grown” networks to that from E. coli or other GRNs.
2. The previous algorithm considered attachment of one node at a time to the substrate network for growth following the general premise of preferential attachment. However, this failed to generate the correct FFL motif distribution of the nodes in the grown network as compared to the GRN of E. coli. In this paper, we consider the attachment of an entire downlink motif at a time using a preferential attachment methodology. One or more of the three nodes of the incoming downlink may be shared with selected nodes in the substrate network resulting in the growth of the network by one (if two vertices are shared between the incoming downlink and substrate network) or two nodes (if one vertex is shared between the incoming downlink and substrate network) or zero nodes (if all three vertices of the incoming downlink are shared with corresponding three vertices in the substrate) at a time. The motivation for a downlink-based preferential attachment model stems from an observation that 99.4% of the nodes in the GRN of E. coli participate in downlinks.
2. Related Works
Algorithms [e.g., Mayo et al. (2012)] that generate scale-free directed networks aim to mimic a target networks’ topological properties, and are useful for understanding processes that govern dynamical formation of many complex networks. Features considered in our previous analysis were the distributions of the in-, out-, cumulative degrees, and the participation of genes in FFLs (see Methods and Materials for details) of the largest connected component of E. coli’s transcriptional-regulatory network. We consider the same features in the analysis of the proposed algorithm in this paper for comparing the generated and target networks, except for gene participation, where we consider the genes that participate in downlinks only, but not FFLs (Mayo et al., 2012). A brief description of the modified preferential attachment algorithm from Mayo et al. (2012) follows.
A candidate node in the existing substrate network of n nodes at given time – i.e., the network resultant from the sum total of all previous attachment steps – is denoted with subscript i (1 ≤ i ≤ n). The probability for this candidate node to be connected to an external (incoming) node with a directed edge incident on the external node is given by A(Ki, Ri), wherein Ki and Ri denote, respectively, its out- and in-degrees. The probability that a link is projected from the external node onto the candidate node is given by B(Ki, Ri). The probabilities of all the candidate nodes are normalized to form attachment kernels that determine whether a link is to be considered (Krapivsky et al., 2000). The formulae for three different attachment kernels considered in Mayo et al. (2012) are given in Table 1.
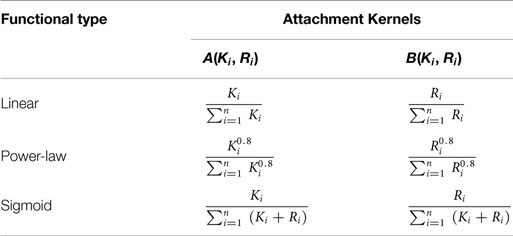
Table 1. Attachment kernels used here to “grow” networks (Mayo et al., 2012).
The algorithm from Mayo et al. (2012) allows for multiple links to be placed per attachment step; therefore, it was necessary to consider nucleation of the network from a connected 8-node candidate network at t = 0 to avoid null attachments. A candidate node is always selected at random if it has not been selected before during a single attachment. Next, a random number, d, is drawn uniformly from the interval [0,1]. If the condition d ≤ A(Ki, Ri) is satisfied, an outgoing link from the candidate node is connected to the external node. The process is then repeated for an outgoing link originating from the external node that connects to a candidate node, provided the probability satisfies d ≤ B(Ki, Ri). This process is repeated mi − 1 times wherein mi is an integer drawn at random from an exponential probability distribution:
wherein f = 0.25 and m0 ∈ {2, 3, 4} (Mayo et al., 2012).
The attachment mechanism of this algorithm is similar to that of the Barabási-Albert model (Barabási and Albert, 1999) (BA), in that it preserves the phenomenon of “the rich get richer and the poor get poorer.” For instance, a node having relatively large number of outgoing links will probably continue to increase its out-degree during attachments together with a smaller chance of connecting nodes with fewer incoming links. However, early versions of the BA model did not account for the directionality of the links; while it could not be expected to topological properties of biological networks with high fidelity, it was very successful in capturing many of their qualitative features, such as the scale-free degree distribution. By contrast, other models, such as the duplication divergence (DD) model suggested by Vázquez et al. (2003), have been used to generate model biological networks, which was later extended in Chung et al. (2003). The DD model was designed based on the fact that proteins/genes evolve through duplication followed by spasmodic mutations. However, only very few of the networks grown show resemblance to their final target structures in terms of degree distributions. The modified preferential attachment algorithm in Mayo et al. (2012) reflects a first attempt to create a directed biological network growing algorithm capable of preserving the abundance of FFLs in “grown” random networks with reasonable accuracy as compared to the largest connected component of E. coli’s transcriptional network.
3. Materials and Methods
3.1. Transcriptional Network Datasets
To evaluate the fidelity of artificially constructed networks, we sampled subnetworks from the entire body of the E. coli transcriptional network, herein referred to as “target networks.” As mentioned above, we defined two types of nodes arranged hierarchically in these GRNs, classified as either (a) genes or (b) transcription factors, and defined such that genes reflect a regulatory terminus wherein they do not regulate other nodes (i.e., have no outgoing links), and transcription factors are nodes that regulate genes. Consequently, there are three possibilities for the class of nodes that constitute a downlink motif:
1. three transcription factors (herein TTT);
2. a transcription factor regulating two genes (herein TGG); or
3. a transcription factor that regulates another transcription factor and a gene (herein TTG).
All transcriptional interactions of E. coli GRNs have been validated experimentally (Shen-Orr et al., 2002), and target networks have been rendered using GeneNetWeaver (Schaffter et al., 2011) – a bioinformatics software originally designed to evaluate the accuracy of network inference algorithms. GeneNetWeaver provides options for sampling subnetworks from the GRNs of both E. coli and S. cerevisiae. The E. coli network supported by GeneNetWeaver is composed of 23 disjoint components together encompassing 1,565 genes and 3,758 links. Here, we focus our investigations on connected GRNs; hence, we consider E. coli’s largest connected component (LCC), which itself contains 1,477 nodes and 3,671 links. Moreover, our analyses do not account for the effects of self-loops associated with transcription factors. For simplicity, we have removed them from the target networks considered here.
3.2. Vertex-Based Motif Networks and Downlink Coupling
Conventional preferential attachment models estimate the attachment probability from the degree of single candidate nodes in the target networks. However, to conceptualize a downlink-based preferential attachment method, which is a collection of nodes, we must first identify a way to express a downlink motif from the substrate network into a single, effective “lumped” node.
To achieve this we propose to apply a network transformation to the E. coli LCC, defined so that each node of the transformed network represents a downlink derived from the LCC; downlink “nodes” are connected to others with edges weighted by the number of nodes shared between the two downlink motifs. For example, two downlink motifs that share a single node would equate with two nodes connected by a single link of unit weight. Herein we term such a resultant network, a vertex-based motif network (VMN). An illustration of this graph transformation is shown in Figure 3. VMNs are therefore manifestly undirected networks. Although E. coli is sparse (Genio et al., 2011), its equivalent VMN contains many more nodes due to the approximately 278,000 downlinks supported in the network, most of which share nodes due to the hierarchical nature of the E. coli GRN. Therefore, it’s VMN is dense.
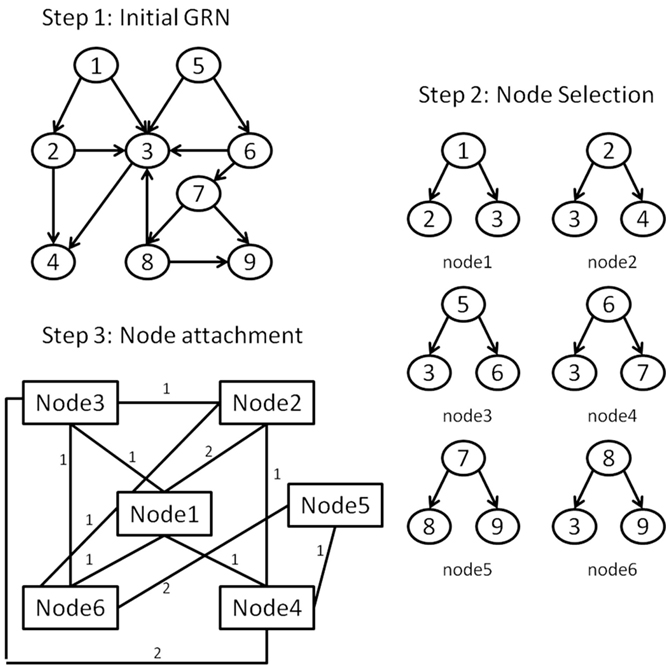
Figure 3. The steps for forming the VMN from a GRN: (Step 1) An initial GRN is considered. (Step 2) A list of the downlink structures is derived from the GRN giving each downlink structure its unique id. (Step 3) Each downlink’s constituent nodes are contrasted with every other downlink’s nodes. Downlinks form topological interactions in the VMN if they have at least one common node. The strength of the interaction is equivalent to the number of shared nodes between the corresponding downlinks.
Figure 4 contrasts differences in the total degree distributions of three sample GRN subnetworks of sizes n = 500 (right panels) with their corresponding VMNs (left panels). Some VMNs reached as much as 400-fold the number of nodes as their original subnetwork. Finally, we note that degree distributions exhibited by VMNs indicate an absence of correlation in the abundance of shared vertices among downlink motifs.
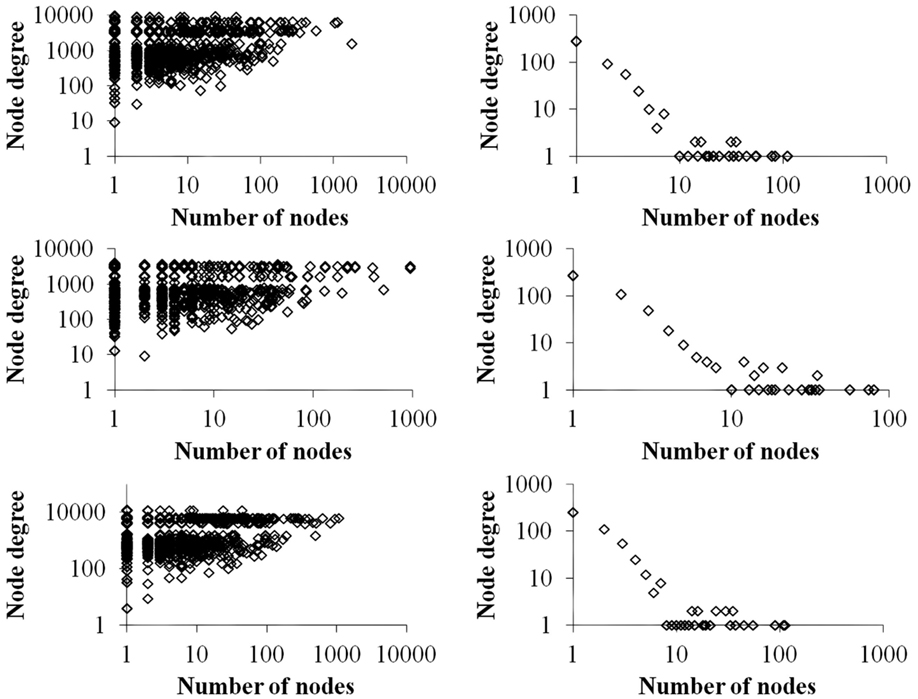
Figure 4. A plot of the number of nodes (vertical axis) vs. the cumulative degrees (horizontal axis) of VMNs (left) as compared to their respective GRNs (right).
3.3. Data Representation
Computationally, we have represented GRNs and VMNs using square matrices, respectively, labeled G and V. A GRN link from node j and incident on node k is represented by Gjk = 1, and the absence of such connection is represented by Gjk = 0, similar to an adjacency matrix. Because GRN links carry no weight, the matrix G may only hold values of 0 and 1. In G of size n, the downlink count SDL can be determined mathematically using the equation:
However, V differs from G in that it is symmetric with elements given by the weights 0, 1, 2, and 3, depending on the number of vertex overlaps between one downlink and another. Therefore, Vlm = Vml = 0 if downlinks l and m do not share any nodes, Vlm = Vml = 1 if downlinks l and m share one node, and so on.
3.4. Algorithm for Network Growth
A subnetwork of a target network, termed a “substrate,” accumulates one downlink per attachment step. Table 2 illustrates possible downlink-to-downlink attachments, as based on the number of vertices shared between a candidate and incoming downlink motif (DL). In order to determine the appropriate attachment, the following steps are considered.
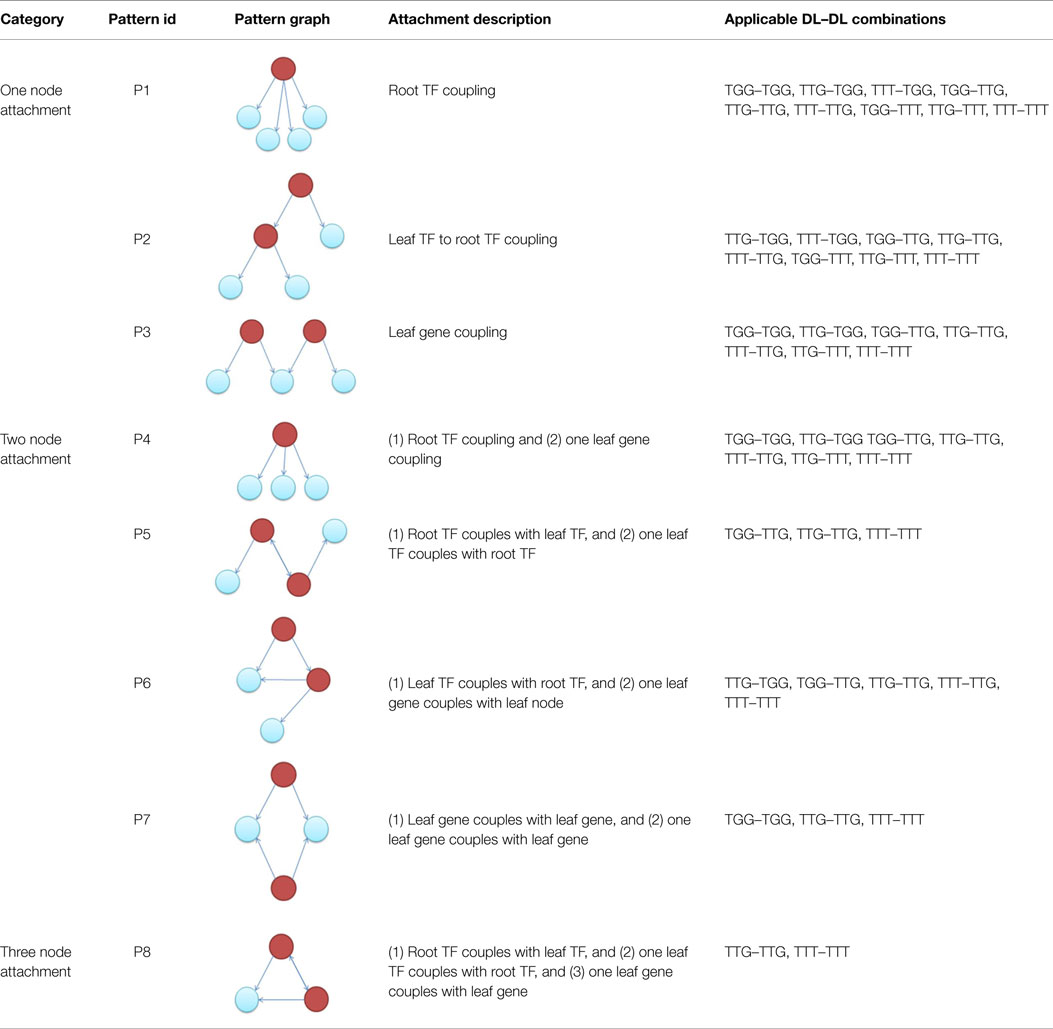
Table 2. Every type of potential downlink-to-downlink attachment.
3.4.1. Step 1 – Determine Candidate Downlink Type
In order to select an existing downlink from the substrate network as a candidate for attachment, its type needs to be specified. We denote the sums of the three downlink types as NTGG, NTTG, and NTTT, such that
Using Eq. 3, the probability that a selected candidate downlink is of type TGG, TTG, or TTT is determined by, , , and in that order. These probabilities are later used as selection kernels to determine the type of candidate downlink. A random number, r1, is generated with uniform probability on the interval r1 ∈ [0,1]. If 0 ≤ r1 < PTGG, a TGG downlink is considered as a candidate for attachment. If PTGG ≤ r1 < PTGG + PTTG, a TTG downlink is considered. Otherwise a TTT is considered for attachment.
3.4.2. Step 2 – Selection of Candidate Downlink
A VMN is created from the downlinks subscribing to the type selected in Step 1 and the preferential attachment mechanism is employed (Barabási and Albert, 1999). A random downlink l is picked with uniform probability, and its degree centrality is calculated as follows:
wherein t represents the total number of downlinks in the VMN. Next, a random number 0 ≤ r2 < 1, is compared with Cl such that if r2 < Cl, l is selected as a candidate downlink. On the other hand, if the condition is not satisfied another downlink is picked at random and the process is repeated.
3.4.3. Step 3 – The Type of Incoming Downlink
Incoming downlinks may be either of the three downlink types, generated at random with uniform probability.
3.4.4. Step 4 – The Number of Shared Nodes
A similar strategy to that of Step 1 is implemented, except that the probability distribution depends on the number of shared nodes between pairs of downlinks and not the number of each type of downlink. There are Spair = SDL (SDL – 1)/2 total cases of downlink pairs sharing nodes, each of which can share 0, 1, 2, or 3 nodes. Since our model does not account for disjoint components, we ignore the cases where downlink pairs share no nodes. We denote the number of pairs sharing 1, 2, and 3 nodes as Ns1, Ns2, and Ns3, respectively. Consequently the probabilities for node sharing can be determined by , , and . Next a third random variable 0 ≤ r3 ≤ 1 will be compared with the ranges (0, Ps1), (Ps1, Ps1 + Ps2), and (Ps1 + Ps2, Ps1 + Ps2 + Ps3), respectively, to determine the number of shared nodes as was done in Step 1.
3.4.5. Step 5 – The Attachment Pattern
Knowing the candidate downlink, the type of incoming downlink and the number of nodes to be shared (or overlapped), we can use Table 3 to proceed with an attachment. For example, having selected a candidate TGG, an incoming TTG, which will share two nodes, from Table 3 we are only allowed to proceed with three attachment patterns {P4, P5, P6}. Each pattern is given an equal probability of being chosen (here 1/3). A process similar to the random number generated in Steps 1 and 4 is used to determine which pattern will be chosen.
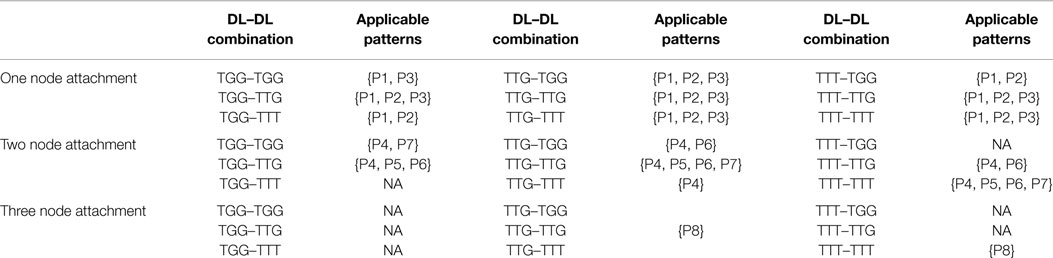
Table 3. Applicable downlink to downlink attachments for a given candidate downlink, incoming downlink, and number of vertex overlaps.
3.5. Maximum Likelihood Estimation
A key task in the analysis of many biological networks is to estimate the exponent of a power-law type degree distribution (Clauset et al., 2009). To assess the performance of our proposed algorithm, we evaluated the following relationships:
• in-degree distribution, viewed as a plot of the different in-degrees against the number of nodes possessing those in-degrees;
• out-degree distribution, viewed as a plot of the different out-degrees against the number of nodes that posses those out-degrees;
• total-degree distribution, taken as a plot of the different total-degrees against the number of nodes that posses those total-degrees; and
• distribution of genes participating in downlinks, which is the relationship between the number of downlinks, vs. the number of nodes that participate in all the different downlinks of the network.
A curve-fitting methodology is commonly used to estimate the fitted parameters; however, a least squares-based optimization algorithm may not accurately determine whether the data are power-law distributed (Hoogenboom et al., 2006; Clauset et al., 2009). To address this issue, Hoogenboom et al. (2006) presented a maximum likelihood estimation-based approach to determine whether a distribution follows a power-law. We used this method to compare best-fit values of power-law exponents for target networks with the substrate networks grown using our proposed algorithm.
4. Results and Discussion
4.1. Fidelity of the Downlink-Based Preferential Attachment Mechanism
We extracted five different target networks of 100 nodes from the E. coli LCC using the GeneNetWeaver software in the manner explained above. We extracted substrate subnetworks upon which to “grow” new networks from these target networks of relative sizes equal to 10, 20, 30, and 40 nodes. We sampled five substrates of each size, resulting in a total of 20 substrate subnetworks per target network derived from the E. coli LCC. Each substrate network was grown to a size of 100 nodes using two algorithms: (i) the attachment kernel (linear, power-law, and sigmoidal) method as presented in Mayo et al. (2012) and (ii) the downlink-based attachment mechanism explained above.
For networks generated using the downlink-based preferential attachment mechanism, we calculated the three types of downlink attachment probabilities in two ways. In the first method, termed “target attachment,” values for the fraction of downlinks of each type, PTGG, PTTG, PTTT, and fractions of downlinks that share one (), two (), and three () vertices were all calculated from the target networks derived from the E. coli LCC. This method is biased, given that we must use the structure of the biological networks to inform that of the “grown” networks. The second method, termed “substrate attachment,” calculates the same probabilities as the first method, but iteratively from the current state of the grown network. This method is unbiased, in the sense that it is ignorant of the final topology of the target network.
Degree distributions of the “grown” networks were fitted to the data using a power-law equation, and each of the two methods was compared individually to the fitted exponents of the biological networks as a measure of their fidelity. Exponents, γ, were estimated not only for in-, out-, total degree distributions (Table 4) but also for distributions relating the participation of nodes in downlink substructures (Table 5). A lower value for the difference in fitted exponents suggests a higher fidelity of the attachment model to the properties of the “target” biological network. As can be seen from Table 4, fidelity of the degree distributions between grown and target networks is higher for downlink-based attachment mechanisms as compared to the attachment kernel method of Mayo et al. (2012).
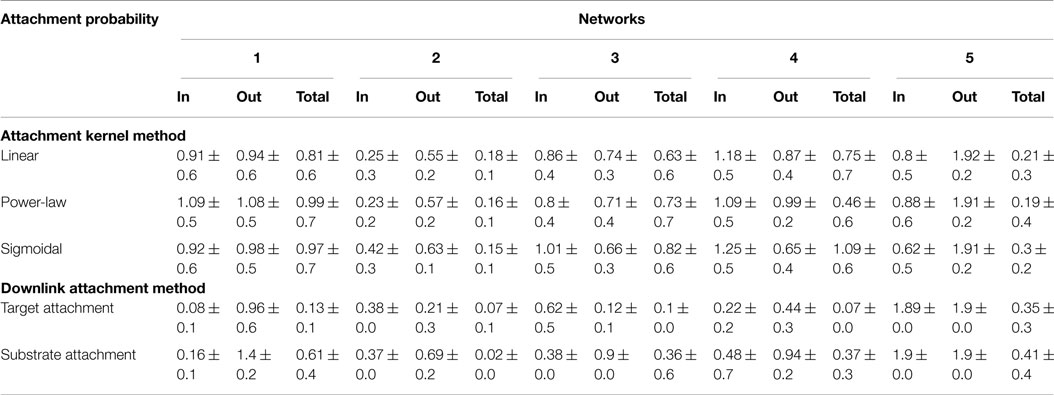
Table 4. Statistics for the difference between power-law exponents of candidate and target network’s degree distributions resulting from either the attachment kernel method reported in Mayo et al. (2012), or from the downlink attachment method reported here.
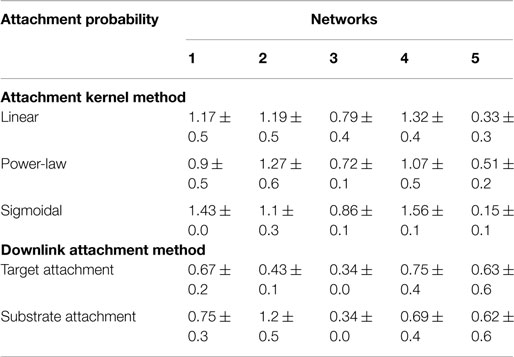
Table 5. Statistics or the difference between fitted power-law exponent for candidate and target networks’ distributions of genes participating in downlinks.
Error bounds for the distribution of nodes participating in downlink substructures show similar traits to that observed for the degree distributions. Out of the five substrates, the fifth network had marginally better distributions when grown with single node attachments for the same reasons explained above. Additionally, using the probabilities calculated from the target network (i.e., “target attachment, Tables 4 and 5) does not always lead to higher fidelity, as can be seen in the fourth and fifth networks. This is again because quite a few nodes do not participate in downlink structures and hence the probability distributions from the goal network make the counts skewed.
4.2. Evolutionary Mechanisms and Downlink-Based Network Growth
Preferential attachment mechanisms have been suggested, sometimes in addition to other mechanisms (e.g., duplication events), as models of evolutionary formation of gene-regulatory (Chung et al., 2003), protein interaction (Eisenberg and Levanon, 2003), and metabolic networks (Light et al., 2005). For gene-regulatory networks, mutations to DNA bases may alter the affinity of DNA-binding proteins or cis-regulatory modules to result in rewiring or admission of novel regulatory interactions (Erwin and Davidson, 2009). It is plausible that evolutionary mutations to DNA sequences result in creation of whole downlink transcriptional modules over a single generation, given the local nature of cis-regulatory mutation mechanisms and the potential for gene duplication events. For example, base-pair mutations can alter the availability of new binding sites, which manipulates the “distance” between interacting sites via insertion or deletion of cis-regulatory modules or sub-functionalization due to regional duplications, among others (Erwin and Davidson, 2009). At the system level, correlations between mutations over successive generations may be needed to consistently evolve new cis-regulatory modules and gene-regulatory interactions. However, even a node-by-node attachment mechanism (i.e., DNA sequence mutations that result in a single novel gene-regulatory interaction) holds potential for multiple novel gene-regulatory interactions formed over a single generation (Chung et al., 2003), which may explain the fewer nodes in the GRN observed to not participate in downlink modules. This can be linked to the error bounds generated for the fifth substrate, where results are marginally better for single node attachments; in this network only approximately 80% of the nodes participated in downlink motifs as opposed to ≥90% for networks labeled 1–4.
It is currently difficult to directly test hypotheses regarding network “growth” mechanisms due to experimental difficulties in manipulating the evolution of transcriptional networks in microorganisms such as bacteria. An attempt to experimentally emulate the “bottom up” approach employed in many attachment or duplication-based network growth mechanisms, such as the motif-based attachment method proposed in this paper, may be therefore impractical with current technologies. One alternative might be to reverse the growth process. Transcriptional regulatory networks, such as the E. coli network dataset analyzed here, serve as target states of the growth mechanisms; beginning with these fully formed networks and sequentially “deactivating” regulatory interactions between genes and transcription factors may provide valuable insight into the processes that formed them. For example, protein production could be suppressed with RNAi tailored to specific mRNA, thereby eliminating a regulatory interaction by preventing protein proliferation; another strategy could be to target a transcription factor’s activated state, perhaps by interfering with phosphorylation/dephosphorylation reactions through crosstalk (Rowland and Deeds, 2014), thus modulating its binding affinity to the correct DNA sequence and preventing gene activation. As a proof of principle, some experimental efforts have already succeeded in extensively “rewiring” E. coli’s transcriptional regulatory network (Isalan et al., 2008). Even so, future work is needed to predict dynamical consequences of adding or removing regulatory interactions specific to the attachment mechanism (in our case, regulatory interactions associated with downlink motifs), which could be evaluated using these or other experimental methods.
Recent developments in “in vitro” circuit design using microfluidic cell-free systems for the rapid prototyping of synthetic genetic networks as a “biomolecular breadboard” for molecular programing (OpenWetWare, 2014) is another promising avenue for experimentally validating the network growth principles proposed here. The biomolecular breadboards project has successfully synthesized different types of feed-forward loop motifs (Sen et al., 2014) and can be extended to design coupled FFL circuits. Similarly, such synthetic biology circuits of coupled downlink motifs can experimentally validate the dynamical consequences of our proposed network growth method thereby creating new hypotheses on whether coupled downlinks exhibit any preferences in natural selection. Currently however, this can only be achieved at a smaller scale by synthesizing small networks of connected downlinks.
5. Conclusion
We have presented a directed transcriptional network growing algorithm using the concept of motif-based preferential attachment, which allows for several new genes and regulatory interactions to be accumulated per step in the network evolution. While many existing algorithms in this area grow undirected networks using the preferential attachment model, or directed networks using the modified preferential attachment scheme with various attachment kernels, they fail to generate networks with high fidelity of motif distributions when contrasted with real-world biological networks. We have proposed using entire transcriptional motifs, which some view as “building blocks of complex networks” (Alon, 2007), as the fundamental unit of network evolution, rather than the accumulation of single genes and regulatory interactions at each potential growth opportunity. Our resulting networks built using this method exhibit higher fidelity to E. coli transcriptional networks, both in terms of degree distributions and downlink distributions.
Our algorithm accounts not only for the abundance of downlink motifs, which seem to cover most of the nodes and edges from the E. coli transcription regulatory network, but also accounts for two classes of nodes in gene-regulatory networks: genes and transcription factors. One interesting line of future work will be to understand how other transcriptional motifs and types of coupling may contribute to the overall properties of an evolved network model. Another possibility is to consider various centrality measures based on a network renormalized using VMN-based graph transformations. Nevertheless, realistic models of gene-regulatory network evolution will serve to aid future investigations into diverse phenomena, from dynamical signaling over transcriptional-regulatory networks to efforts relating network topology with biological function.
Author Contributions
PG and MM conceptualized the study; AFA and AFM implemented the algorithm and obtained results. PG, MM, AFA, AFM, and EP helped in writing the manuscript.
Conflict of Interest Statement
The authors declare that the research was conducted in the absence of any commercial or financial relationships that could be construed as a potential conflict of interest.
Acknowledgments
Funding was provided by the US Army’s Environmental Quality and Installations 6.1 Basic Research program. Opinions, interpretations, conclusions, and recommendations are those of the author(s) and are not necessarily endorsed by the U.S. Army.
References
Albert, R., and Barabási, A.-L. (2002). Statistical mechanics of complex networks. Rev. Mod. Phys. 74, 47–97. doi: 10.1103/RevModPhys.74.47
Albert, R., Jeong, H., and Arabasi, A.-L. (1999). Internet: diameter of the world-wide web. Nature 401, 130–131. doi:10.1038/43601
Alm, E., and Arkin, A. P. (2003). Biological networks. Curr. Opin. Struct. Biol. 13, 193–202. doi:10.1016/S0959-440X(03)00031-9
Alon, U. (2003). Biological networks: the tinkerer as an engineer. Science 301, 1866–1867. doi:10.1126/science.1089072
Alon, U. (2006). An Introduction to Systems Biology: Design Principles of Biological Circuits. Boca Raton, FL: Chapman & Hall/CRC. Available at: http://opac.inria.fr/record=b1120369
Alon, U. (2007). Network motifs: theory and experimental approaches. Nat. Rev. Genet. 8, 450–461. doi:10.1038/nrg2102
Barabási, A.-L., and Albert, R. (1999). Emergence of scaling in random networks. Science 286, 509–512. doi:10.1126/science.286.5439.509
Barabasi, A.-L., and Oltvai, Z. N. (2004). Network biology: understanding the cell’s functional organization. Nat. Rev. Genet. 5, 101–113. doi:10.1038/nrg1272
Bensong, C., Rouskas, G. N., and Dutta, R. (2010). Clustering methods for hierarchical traffic grooming in large-scale mesh WDM networks. IEEE/OSA J. Opt. Commun. Network. 2, 502–515. doi:10.1364/JOCN.2.000502
Chung, F., Lu, L., Dewey, T. G., and Galas, D. J. (2003). Duplication models for biological networks. J. Comput. Biol. 10, 677–687. doi:10.1089/106652703322539024
Clauset, A., Shalizi, C. R., and Newman, M. E. J. (2009). Power-law distributions in empirical data. SIAM Rev. 51, 661–703. doi:10.1137/070710111
Dorogovtsev, S. N., and Mendes, J. F. F. (2003). Evolution of Networks: From Biological Nets to the Internet and WWW (Physics). New York, NY: Oxford University Press, Inc.
Eisenberg, E., and Levanon, E. (2003). Preferential attachment in the protein network evolution. Phys. Rev. Lett. 91, 138701. doi:10.1103/PhysRevLett.91.138701
Erwin, D., and Davidson, E. (2009). The evolution of hierarchical gene regulatory networks. Nat. Rev. Genet. 10, 141–148. doi:10.1038/nrg2499
Faith, J. J., Hayete, B., Thaden, J. T., Mogno, I., Wierzbowski, J., Cottarel, G., et al. (2007). Large-scale mapping and validation of Escherichia coli transcriptional regulation from a compendium of expression profiles. PLoS Biol. 5:e8. doi:10.1371/journal.pbio.0050008
Feng, J., Jost, J., and Qian, M. (2007). Networks: From Biology to Theory. London: Springer. Available at: http://opac.inria.fr/record=b1133641
Genio, C., Gross, T., and Bassler, K. E. (2011). All scale-free networks are sparse. Phys. Rev. Lett. 107, 178701. doi:10.1103/PhysRevLett.107.178701
Ghosh, P., Mayo, M., Chaitankar, V., Habib, T., Perkins, E. J., and Das, S. K. (2011). “Principles of genomic robustness inspire fault-tolerant WSN topologies: a network science based case study,” in Pervasive Computing and Communications Workshops (PERCOM Workshops), 2011 IEEE International Conference on (Seattle, WA: IEEE), 160–165.
Ghosh, S., Ghosh, P., Basu, K., and Das, S. (2005). “Gama: an evolutionary algorithmic approach for the design of mesh-based radio access networks,” in Local Computer Networks, 2005. 30th Anniversary. The IEEE Conference on (Sydney, NSW: IEEE), 374–381.
Hoogenboom, J. P., den Otter, W. K., and Offerhaus, H. L. (2006). Accurate and unbiased estimation of power-law exponents from single-emitter blinking data. J. Chem. Phys. 125, 204713. doi:10.1063/1.2387165
Isalan, M., Lemerle, C., Michalodimitrakis, K., Horn, C., Beltrao, P., Raineri, E., et al. (2008). Evolvability and hierarchy in rewired bacterial gene networks. Nature 452, 840–845. doi:10.1038/nature06847
Kamapantula, B. K., Abdelzaher, A., Ghosh, P., Mayo, M., Perkins, E. J., and Das, S. K. (2012). “Performance of wireless sensor topologies inspired by E. coli genetic networks,” in Pervasive Computing and Communications Workshops (PERCOM Workshops), 2012 IEEE International Conference on (Lugano: IEEE), 302–307.
Kamapantula, B. K., Abdelzaher, A., Ghosh, P., Mayo, M., Perkins, E. J., and Das, S. K. (2014). Leveraging the robustness of genetic networks: a case study on bio-inspired wireless sensor network topologies. J. Ambient Intell. Humaniz. Comput. 5, 323–339. doi:10.1007/s12652-013-0180-0
Kauffman, S. A. (1993). The Origins of Order: Self Organization and Selection in Evolution. New York: Oxford University Press. Available at: http://opac.inria.fr/record=b1077782
Kim, J.-R., Yoon, Y., and Cho, K.-H. (2008). Coupled feedback loops form dynamic motifs of cellular networks. Biophys. J. 94, 359–365. doi:10.1529/biophysj.107.105106
Kitano, H. (2007). Towards a theory of biological robustness. Mol. Syst. Biol. 3, 137. doi:10.1038/nrg1471
Krapivsky, P. L., Redner, S., and Leyvraz, F. (2000). Connectivity of growing random networks. Phys. Rev. Lett. 85, 4629–4632. doi:10.1103/physrevlett.85.4629
Li, Q., Zhang, B., Fan, Z., and Vasilakos, A. V. (2012). Dynamics in small worlds of tree topologies of wireless sensor networks. J. Syst. Eng. Electron. 23, 325–334. doi:10.1109/JSEE.2012.00040
Light, S., Kraulis, P., and Elofsson, A. (2005). Preferential attachment in the evolution of metabolic networks. BMC Genomics 6:159. doi:10.1186/1471-2164-6-159
Magnan, S., and Alon, U. (2003). Structure and function of the feed-forward loop network motif. Proc. Natl. Acad. Sci. U.S.A. 100, 11980–11985. doi:10.1073/pnas.2133841100
Margolin, A. A., Nemenman, I., Basso, K., Wiggins, C., Stolovitzky, G., Favera, R. D., et al. (2006). Aracne: an algorithm for the reconstruction of gene regulatory networks in a mammalian cellular context. BMC Bioinformatics 7(Suppl. 1):S7. doi:10.1186/1471-2105-7-S1-S7
Mayo, M., Abdelzaher, A. F., Perkins, E. J., and Ghosh, P. (2012). Motif participation by genes in E. coli transcriptional networks. Front. Physiol. 3:357. doi:10.3389/fphys.2012.00357
Meyers, L. A., Pourbohloul, B., Newman, M. E. J., Skowronski, D. M., and Brunham, R. C. (2005). Network theory and sars: predicting outbreak diversity. J. Theor. Biol. 232, 71–81. doi:10.1016/j.jtbi.2004.07.026
Milo, R., Shen-Orr, S., Itzkovitz, S., Kashtan, N., Chklovskii, D., and Alon, U. (2002). Network motifs: simple building blocks of complex networks. Science 298, 824–827. doi:10.1126/science.298.5594.824
Newman, M. E. J. (2003). The structure and function of complex networks. SIAM Rev. 45, 167–256. doi:10.1137/S003614450342480
OpenWetWare. (2014). Biomolecular Breadboards: DNA Parts – OpenWetWare [accessed 15-August-2015]. Available at: http://www.openwetware.org/index.php?title=Special:Cite&page=Biomolecular_Breadboards:DNA_parts&id=772520
Prill, R. J., Iglesias, P. A., and Levchenko, A. (2005). Dynamic properties of network motifs contribute to biological network organization. PLoS Biol. 3:e343. doi:10.1371/journal.pbio.0030343
Rowland, M. A., and Deeds, E. J. (2014). Crosstalk and the evolution of specificity in two-component signaling. Proc. Natl. Acad. Sci. U.S.A. 111, 5550–5555. doi:10.1073/pnas.1317178111
Schaffter, T., Marbach, D., and Floreano, D. (2011). Genenetweaver: in silico benchmark generation and performance profiling of network inference methods. Bioinformatics 27, 2263–2270. doi:10.1093/bioinformatics/btr373
Sen, S., Kim, J., and Murray, R. (2014). “Designing robustness to temperature in a feedforward loop circuit,” in Decision and Control (CDC), 2014 IEEE 53rd Annual Conference on (Los Angeles, CA: IEEE), 4629–4634.
Shen-Orr, S. S., Milo, R., Mangan, S., and Alon, U. (2002). Network motifs in the transcriptional regulation network of Escherichia coli. Nat. Genet. 31, 64–68. doi:10.1038/ng881
Shmulevich, I., and Dougherty, E. R. (2010). Probabilistic Boolean Networks – The Modeling and Control of Gene Regulatory Networks. doi:10.1137/1.9780898717631
Vázquez, A., Flammini, A., Maritan, A., and Vespignani, A. (2003). Modeling of protein interaction networks. Complexus 1, 38–44. doi:10.1159/000067642
Wang, W. (2004). Simulating the SARS outbreak in Beijing with limited data. J. Theor. Biol. 227, 369–379. doi:10.1016/j.jtbi.2003.11.014
Wu, K., and Rao, C. V. (2010). The role of configuration and coupling in autoregulatory gene circuits. Mol. Microbiol. 75, 513–527. doi:10.1111/j.1365-2958.2009.07011.x
Keywords: motif, degree distribution, power-law, attachment kernel, transcriptional network
Citation: Abdelzaher AF, Al-Musawi AF, Ghosh P, Mayo ML and Perkins EJ (2015) Transcriptional network growing models using motif-based preferential attachment. Front. Bioeng. Biotechnol. 3:157. doi: 10.3389/fbioe.2015.00157
Received: 25 April 2015; Accepted: 25 September 2015;
Published: 12 October 2015
Edited by:
Marcio Luis Acencio, Universidade Estadual Paulista, BrazilReviewed by:
Eduardo S. Zeron, Centro de Investigacion y de Estudios Avanzados del IPN, MexicoOksana Sorokina, The University of Edinburgh, UK
Copyright: © 2015 Abdelzaher, Al-Musawi, Ghosh, Mayo and Perkins. This is an open-access article distributed under the terms of the Creative Commons Attribution License (CC BY). The use, distribution or reproduction in other forums is permitted, provided the original author(s) or licensor are credited and that the original publication in this journal is cited, in accordance with accepted academic practice. No use, distribution or reproduction is permitted which does not comply with these terms.
*Correspondence: Preetam Ghosh, pghosh@vcu.edu