Performance of rocking systems on shallow improved sand: shaking table testing
 Angelos Tsatsis
 Ioannis Anastasopoulos
- 1Laboratory of Soil Mechanics, School of Civil Engineering, National Technical University of Athens, Athens, Greece
- 2Division of Civil Engineering, School of Engineering Physics and Mathematics, University of Dundee, Dundee, UK
Recent studies have highlighted the potential benefits of inelastic foundation response during seismic shaking. According to an emerging seismic design scheme, termed rocking isolation, the foundation is intentionally under-designed to promote rocking and limit the inertia transmitted to the structure. Such reversal of capacity design may improve the seismic performance, drastically increasing the safety margins. However, the benefit comes at the expense of permanent settlement and rotation, which may threaten post-earthquake functionality. Such undesired deformation can be maintained within tolerable limits, provided that the safety factor against vertical loading FSV is adequately large. In such a case, the response is uplifting dominated and the accumulation of settlement can be limited. However, this is not always feasible as the soil properties may not be ideal. Shallow soil improvement may offer a viable solution and is therefore worth investigating. Its efficiency is related to the nature of rocking, which tends to mobilize a shallow stress bulb. To this end, a series of shaking table tests are conducted, using an idealized slender bridge pier as conceptual prototype. Two systems are studied, both lying on a square foundation of width B. The first corresponds to a lightly loaded and the second to a heavily loaded structure. The two systems are first tested on poor and ideal soil conditions to demonstrate the necessity for soil improvement. Then, the efficiency of shallow soil improvement is studied by investigating their performance on soil crusts of depth z/B = 0.5 and 1. It is shown that a z/B = 1 dense sand crust is enough to achieve practically the same performance with the ideal case of dense sand. A shallower z/B = 0.5 improvement layer may also be considered, depending on design requirements. The efficiency of the soil improvement is ameliorated with the increase of rotation amplitude, and with the number of the cycles of the seismic motion.
Introduction
According to current seismic codes, the foundation soil is not allowed to fully mobilize its strength, and plastic deformation is restricted to above-ground structural members. “Capacity” design is applied to the foundation guiding failure to the superstructure, thus, prohibiting mobilization of soil bearing capacity, uplifting and/or sliding, or any relevant combination. However, a significant body of pragmatic evidence provides robust justification that allowing strongly non-linear foundation response is not only unavoidable but may also be advantageous (Housner, 1963; Paolucci, 1997; Pecker, 1998, 2003; Gazetas et al., 2003; Gajan et al., 2005; Kawashima et al., 2007; Anastasopoulos et al., 2010a).
Non-linear soil–foundation–structure response is simulated by means of (a) Winkler-based models that capture the settlement–rotation response of the footing (Yim and Chopra, 1985; Nakaki and Hart, 1987; Allotey and El Naggar, 2003, 2007; Chen and Lai, 2003; Houlsby et al., 2005; Harden and Hutchinson, 2006; Raychowdhury and Hutchinson, 2009); (b) sophisticated macro-element models, where the entire soil–foundation system is replaced by a single element that describes the generalized force–displacement behavior of the foundation (Nova and Montrasio, 1991; Paolucci, 1997; Pedretti, 1998; Crémer, 2001; Crémer et al., 2001; Le Pape and Sieffert, 2001; Grange et al., 2008; Chatzigogos et al., 2009, 2011); and (c) finite elements (or finite differences), modeling the superstructure, the foundation, and the soil in detail (Tan, 1990; Butterfield and Gottardi, 1995; Taiebat and Carter, 2000; Gourvenec, 2007; Anastastasopoulos et al., 2010b; Anastasopoulos et al., 2011). Physical modeling has also been applied to experimentally simulate non-linear soil–foundation–structure response, by means of (a) large-scale dynamic and cyclic pushover testing, focusing on non-linear soil–foundation response (Negro et al., 2000; Faccioli et al., 2001; Antonellis et al., 2015); (b) centrifuge model testing, also taking account of non-linear superstructure response (Kutter et al., 2003; Gajan et al., 2005; Gajan and Kutter, 2008, 2009); and (c) reduced-scale cyclic pushover and shaking table testing (Paolucci et al., 2008; Shirato et al., 2008; Drosos et al., 2012).
In this framework, recent studies have investigated that the idea of exploiting inelastic foundation response in order to limit the stresses transmitted onto the superstructure during strong shaking. As schematically illustrated in Figure 1, in contrast to conventional capacity design the foundation is deliberately “under-designed” to promote rocking, limiting the inertia forces transmitted onto the superstructure. The effectiveness of such an alternative seismic design philosophy, termed as “rocking isolation” (Mergos and Kawashima, 2005), has been explored analytically and experimentally for bridge piers (Anastasopoulos et al., 2010a, 2013a) and frames (Gelagoti et al., 2012; Anastasopoulos et al., 2013b). Such “reversal” of capacity design may substantially improve the performance, drastically increasing the safety margins.
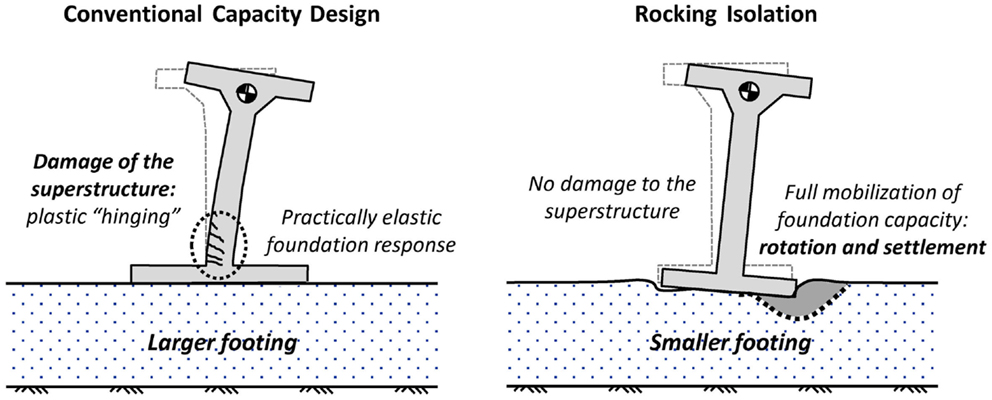
Figure 1. Conventional capacity design vs. rocking isolation. While in the first case the plastic hinge develops in the superstructure, in a rocking-isolated system the foundation capacity is fully mobilized to protect the superstructure, at the cost of foundation rotation and settlement.
Yet, this benefit comes at the expense of permanent settlement and rotation, which could threaten the serviceability of the structure. Such undesired deformation can be maintained within tolerable limits, provided that the safety factor against static (vertical) loads FSV is adequately large (Gajan et al., 2005). In such a case, the response of the foundation is uplifting dominated, and there is no substantial accumulation of cyclic settlement. The response is markedly different for lower values of FSV, becoming sinking dominated: excessive soil yielding takes place underneath the foundation, leading to accumulation of substantial settlement and permanent rotation. Evidently, ensuring an adequately large FSV in order to promote uplifting-dominated response greatly depends on the exact soil properties, which may not always be the ones that are desired. Shallow soil improvement (a concept that is commonly applicable in geotechnical engineering) may offer a viable solution to this problem.
Such a remediation technique has been introduced and experimentally investigated in Anastasopoulos et al. (2012). Based on the results of reduced-scale monotonic and cyclic pushover tests, the concept of shallow soil improvement was proven to be quite effective. Its efficiency is directly related to the nature of foundation rocking, which tends to mobilize a shallow stress bulb underneath the foundation. Although cyclic pushover testing has offered valuable evidence, the nature of seismic shaking is undeniably different. To this end, this paper goes one step further, exploring the efficiency of shallow soil improvement through reduced-scale shaking table testing.
Problem Definition and Experimental Setup
A series of reduced-scale shake table tests were conducted at the Laboratory of Soil Mechanics of the National Technical University of Athens (NTUA) to explore the efficiency of shallow soil improvement under dynamic loading. Based on the work presented in Anastasopoulos et al. (2012), a slender rocking-isolated bridge pier of height h = 9 m supported on a surface square footing of width B = 3 m is used as a conceptual prototype. Taking account of the capacity of the NTUA shaking table, a linear geometric scale of 1:20 (n = 20) was selected for the experiments, and model properties were scaled down according to relevant scaling laws (Muir Wood, 2004). In all cases examined, to focus on foundation performance, the superstructure is assumed rigid and elastic.
As schematically illustrated in Figure 2, two superstructure systems are studied: (a) System A, which is representative of a lightly loaded structure having a relatively large FSV (Figures 2A,B); and System B, being representative of a heavily loaded structure, characterized by a relatively low FSV. These two systems were selected to model distinctly different foundation performance, from uplifting-dominated (System A) to sinking-dominated response (System B). Three different soil profiles were simulated in the experiments: (a) medium (Dr = 65%) and loose (Dr = 45%) sand for System A and System B, respectively, representing poor soil conditions; (b) soil improvement by means of a shallow “crust” of dense sand, of varying depth z/B = 0.5–1; and (c) the reference case of dense (Dr = 93%) sand, representing ideal soil conditions.
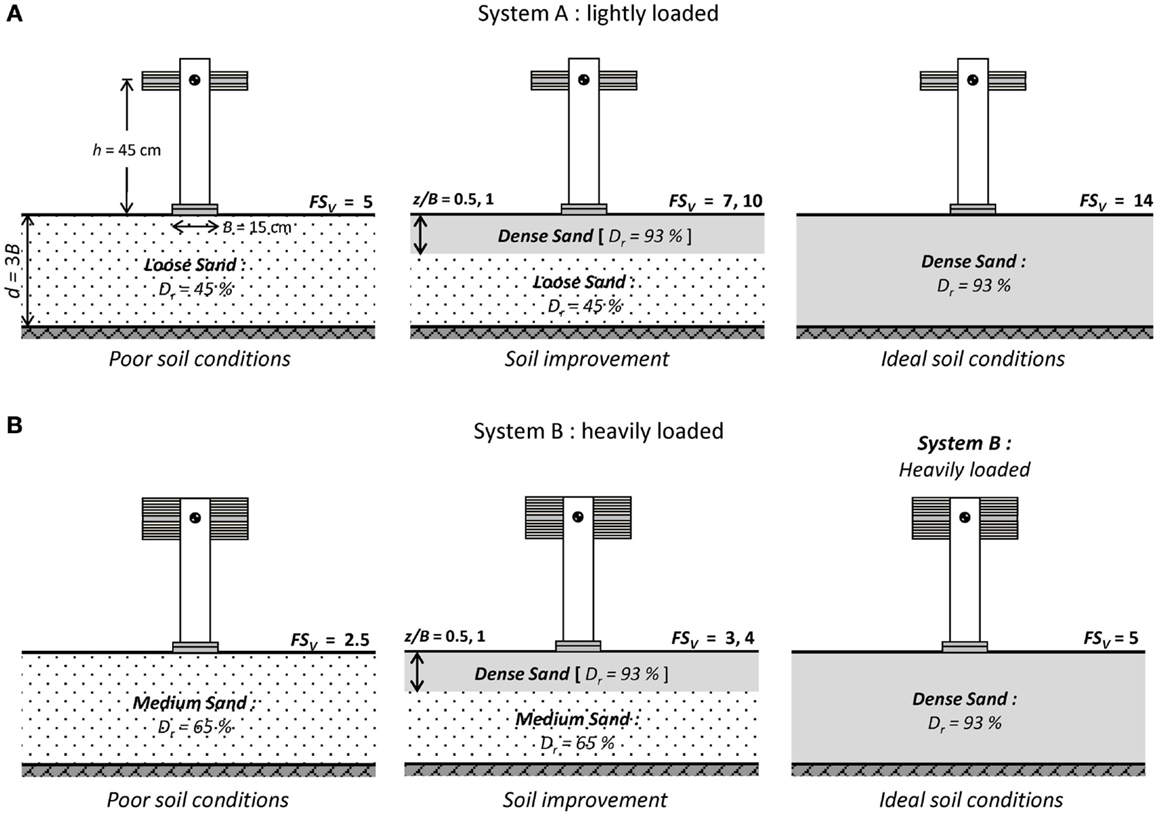
Figure 2. Definition and key parameters of the studied problem (all dimensions in model scale). Two configurations are studied: (A) a lightly loaded system and (B) a heavily loaded system. Loose and medium sand are used to represent poor soil conditions, while dense sand represents the reference case of ideal soil conditions. Soil improvement is materialized with a shallow soil crust of dense sand, of varying depth (z/B = 0.5–1).
Physical Modeling
The physical model consists of a square B = 15 cm aluminum footing, rigidly connected to a pair of rigid steel columns. The latter support a rigid aluminum slab, positioned at height h = 45 cm above the foundation level. The superstructure mass is composed of a number of steel plates, installed symmetrically above and below the aluminum slab, so as to maintain the center of mass at the same level. The mass of the model was adjusted by adding or removing steel plates. Sandpaper was placed underneath the foundation to achieve a realistically rough foundation–soil interface (corresponding to a coefficient of friction μ ≈ 0.7). The model was placed inside a rigid soil container, lying on an adequately deep sand stratum of depth d = 3B = 45 cm, and at an adequately large distance (L ≈ 5B = 75 cm) from the container walls.
The soil consists of dry-pluviated Longstone sand. The sand, characterized by a uniformity coefficient Cu = 1.42 and mean grain sized diameter D50 = 0.15 mm and, was pluviated using an automated sand raining system. The latter is a custom-built system, capable of producing sand specimens of controllable relative density Dr, with exceptional repeatability. The properties of the sand have been measured through laboratory tests, also conducted at NTUA, and are documented in Anastastasopoulos et al. (2010b). In reduced-scale testing, the stress field in the soil cannot be reproduced correctly. Given the fact that the strength of the sand is stress dependent, the reduced effective stresses in the model unavoidably lead to an increase of the mobilized friction angle φ (compared to the prototype). Such scale effects can only be avoided through centrifuge modeling, and should be carefully contemplated when interpreting 1 g test results. Even though, in the case of the investigated problem, the stresses due to the superstructure dead load are prevailing, minimizing the adverse role of scale effects.
Even though, aiming to avoid scaling-related misinterpretations, a series of vertical push tests were conducted to measure the bearing capacity of the B = 15 cm square foundation for all soil conditions examined. Based on the results of these tests, which are summarized in Table 1, the mass of the two superstructure models was adjusted to produce the desired FSV for the reference case of ideal soil conditions (i.e., for dense sand): FSV = 14 for the lightly loaded System A (materialized using a mass of 35 kg), and FSV = 5 for the heavily loaded System B (materialized using a mass of 100 kg).
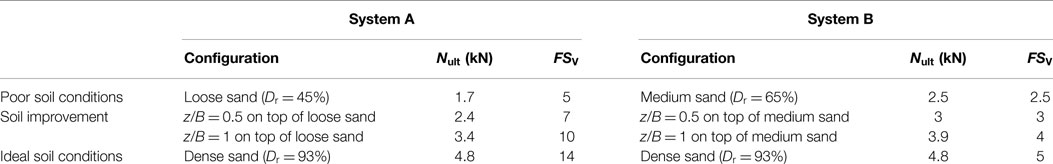
Table 1. Summary of monotonic vertical loading.
Summary of Monotonic Response
Before proceeding to the testing sequence, a brief discussion of the monotonic response of the studied systems is necessary. A detailed description of the pushover tests and their key results can be found in Anastasopoulos et al. (2012). Figure 3 summarizes the moment–rotation (μ–θ) and settlement–rotation (w–θ) response of the two systems founded on the four different soil profiles.
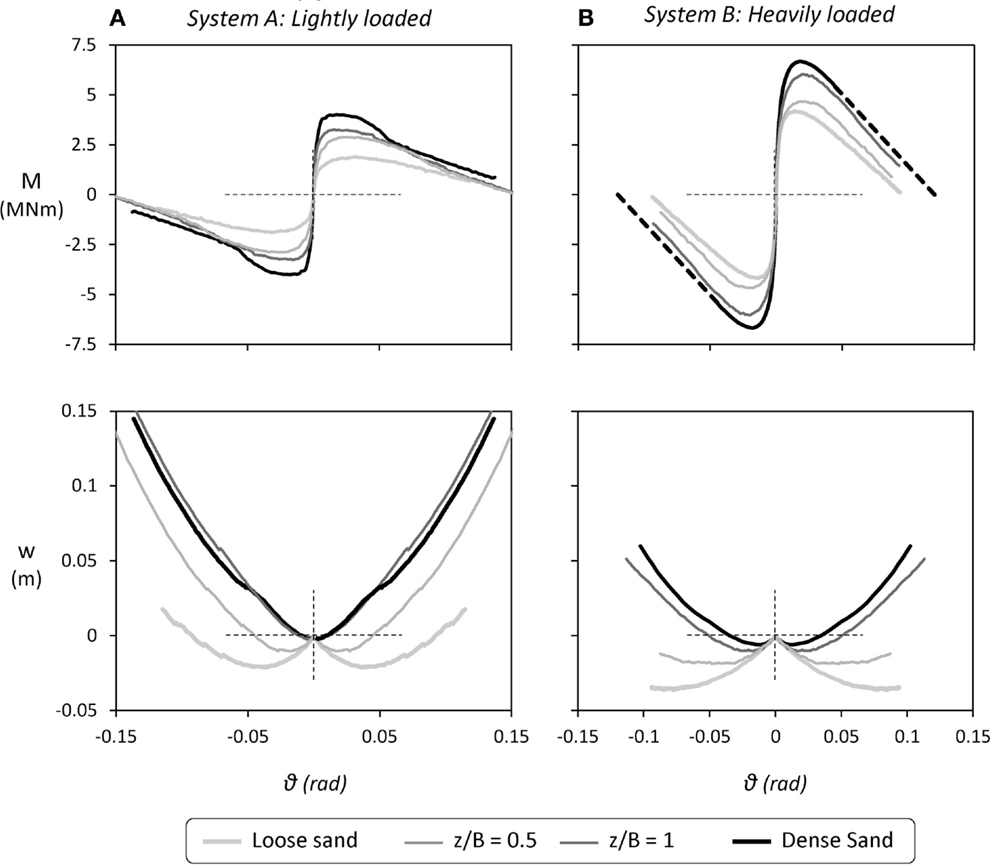
Figure 3. Summary of monotonic pushover test results for the systems studied herein: moment–rotation (M–ϑ) and settlement–rotation (w–ϑ) response as a function of soil conditions for (A) the lightly loaded System A and (B) the heavily loaded System B.
In the case of the lightly loaded System A (Figure 3A), when founded on poor soil conditions (i.e., loose sand) its maximum moment capacity reaches Mmax = 1.8 MN/m (unless otherwise stated, all results are discussed in prototype scale). Considering the dynamic response, a critical acceleration ac can be defined as the maximum acceleration that can develop at the mass of the oscillator (representing the bridge deck). For rocking-isolated systems, such as those examined herein, ac is bounded by the moment capacity of the foundation, and can be defined as follows:
Based on the above, System A founded on poor soil is characterized by a critical acceleration ac = 0.072 g. The moment capacity is substantially increased for the case of shallow soil improvement, leading to a proportional increase of the critical acceleration to ac = 0.117 g for z/B = 0.5 and ac = 0.130 g for a deeper z/B = 1 dense sand crust. The latter is still lower than the one for ideal soil conditions, ac = 0.162 g, but the efficiency of the improvement is evident. Likewise, for the heavily loaded System B (Figure 3B), the footing on poor soil conditions has a moment capacity Mmax = 4.2 MN/m, which translates to ac = 0.065 g. Applying a layer of improved soil of depth z/B = 0.5, the critical acceleration increases only slightly to ac = 0.065 g (Mmax = 4.5 MN/m). A deeper z/B = 1 soil crust is required to attain a substantial increase of the critical acceleration to ac = 0.085 g. The latter is only slightly lower than for ideal soil conditions (ac = 0.095 g), confirming the efficiency of shallow soil improvement in this case also. It is worth mentioning that an excitation with acceleration exceeding the critical acceleration of the systems does not necessarily mean collapse; the structure will topple only when the imposed rotation of the footing is larger than the maximum rotation as shown in the M–θ curves.
Most importantly, in both cases shallow soil improvement leads to a substantial reduction of the tendency for accumulation of settlement. As evidenced by the w–θ response, in both cases, the application of shallow soil improvement tends to suppress the sinking behavior of the foundation. For the lightly loaded System A in particular, a z/B = 1 soil crust is sufficient to achieve almost the same w–θ response with the reference case of ideal soil condition (dense sand), while an even shallower z/B = 0.5 crust is also quite effective. This has been confirmed by the slow-cyclic tests, which can be found in Anastasopoulos et al. (2012). On the other hand, for the heavily loaded System B, a z/B = 0.5 soil crust is clearly not enough: the response is improved but remains sinking-dominated. A deeper z/B = 1 soil improvement is needed to ensure uplifting-dominated response. Indeed, in this case, the w–θ response becomes almost identical to the case of ideal soil conditions (dense sand). The performance of the tested configurations is summarized in Table 2.
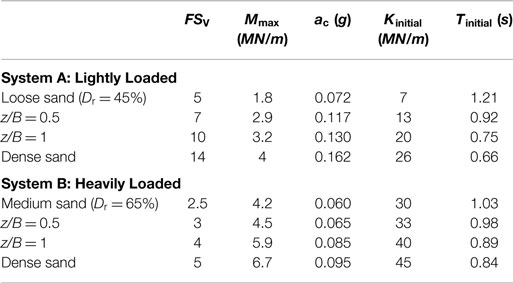
Table 2. Summary of monotonic pushover loading.
Instrumentation and Testing Sequence
The model was instrumented to allow direct recording of translational and rotational deformations, and lateral accelerations. As shown in the photos of Figure 4, wire (WDT) and laser displacement transducers (LDTs) were utilized to measure horizontal and vertical displacements.
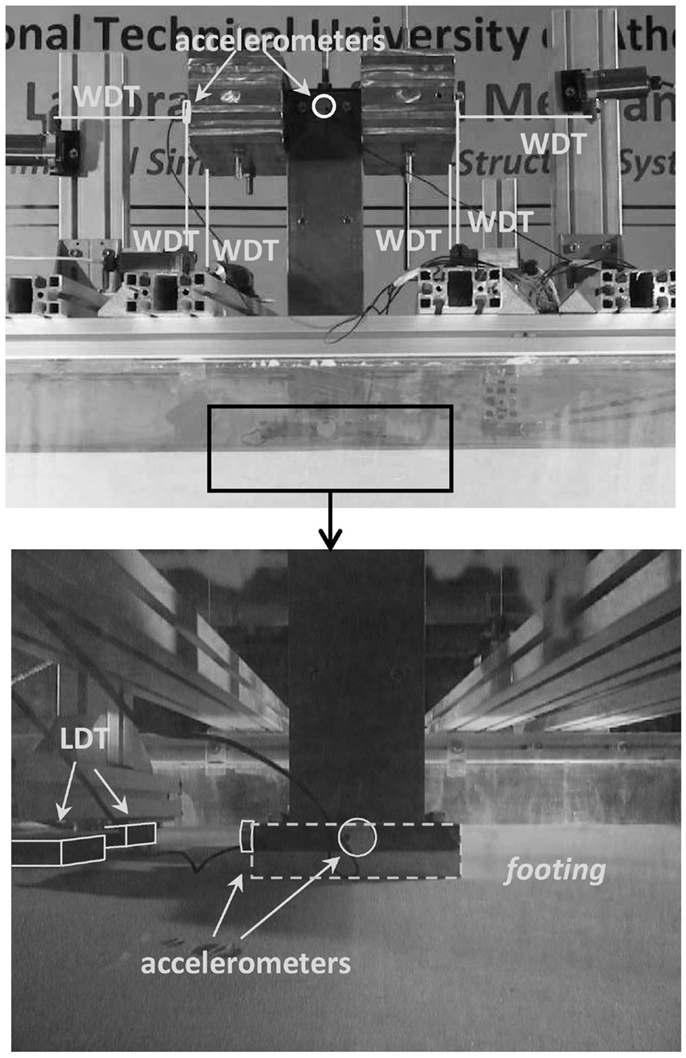
Figure 4. Photos showing the instrumentation.
Two LDTs were used to measure the sliding displacement of the footing, while two WDTs were used to record the horizontal displacement of the oscillator mass. Four additional WDTs were used to measure the vertical displacement at the four corners of the mass, in order to measure the rotation and the settlement of the physical model in both directions (the direction of loading and the transverse). Accelerometers were installed at characteristic locations, on the model (on the foundation and at mass level), and embedded within the soil at 5 cm depth: one directly underneath the foundation and another one at a distance, where free-field conditions are restored. In addition, visual data were obtained using high-definition cameras, recording both the response of the entire system, and the response of the foundation (settlement, uplift, sliding) from a closer view from behind.
The different configurations were subjected to shaking table testing, using a variety of real seismic records and artificial motions as base excitation (Figure 5). The selected seismic motions were scaled down in time (divided by √n) according to the relevant scaling laws. Three different seismic shaking sequences were imposed, as summarized in Table 3. They consist of artificial motions (sinusoidal excitations) or real records, or a combination of the two. In all cases examined, the PGA of the seismic excitations was well beyond the critical acceleration of the tested systems (progressively increasing). This was done to force the systems to behave strongly non-linear in order to explore their response in the plastic (after yielding) as well as in their metaplastic regime (after peak conditions are reached and the resistance of the footing decreases due to P–δ effects).
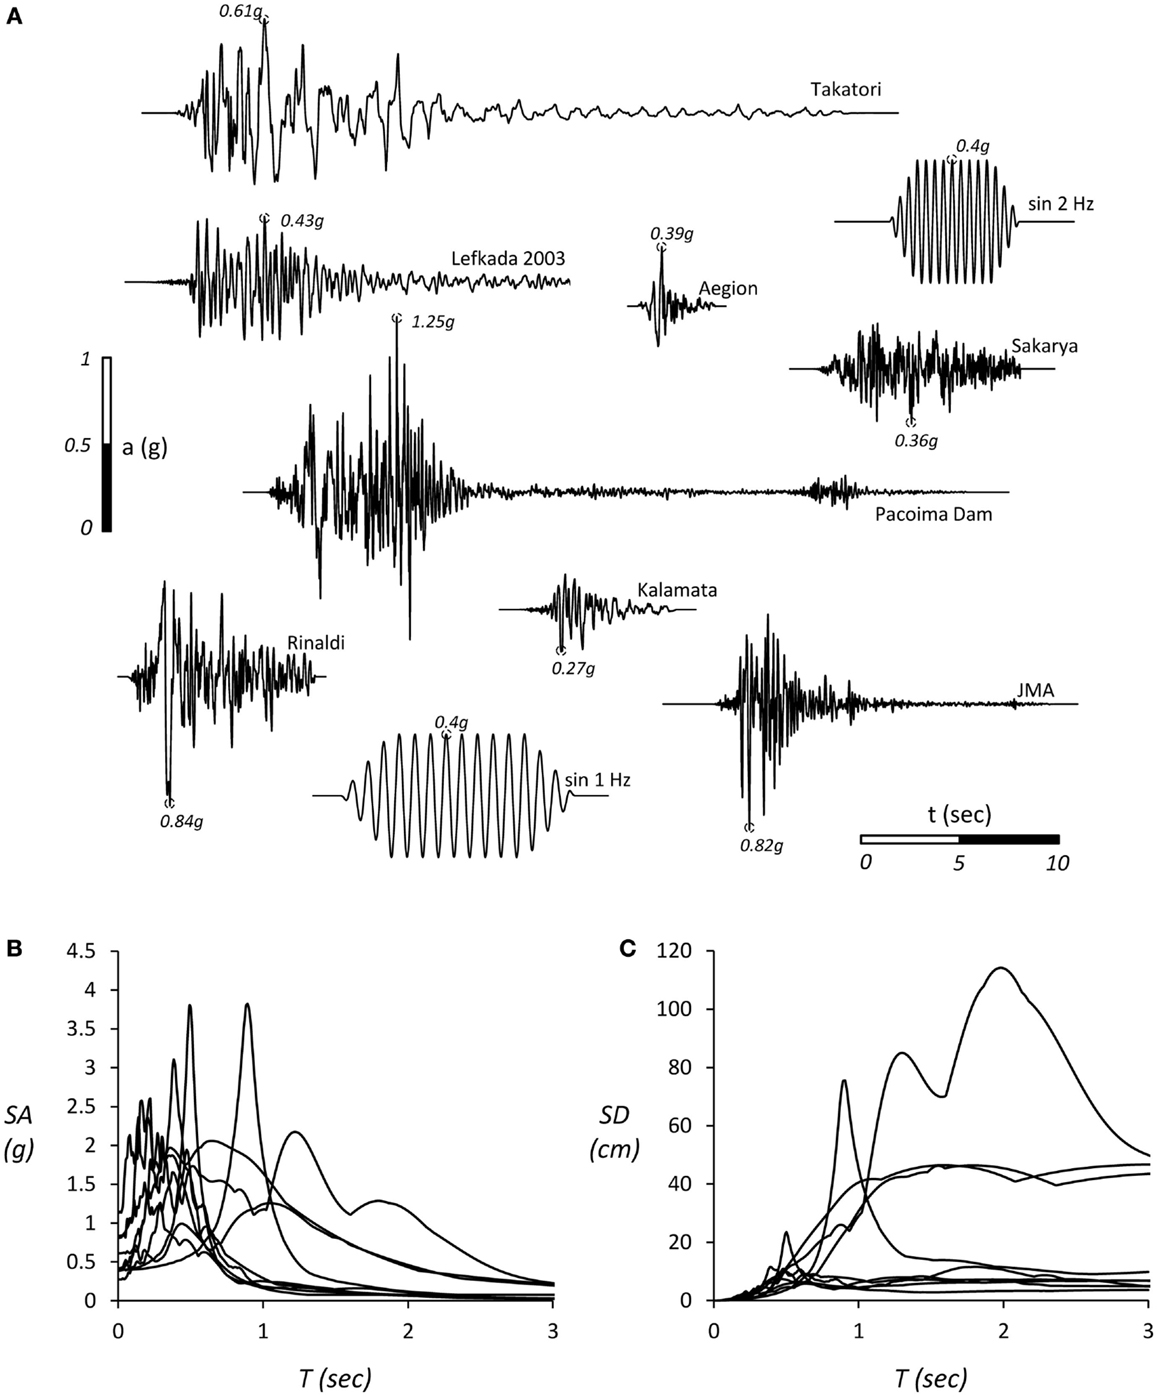
Figure 5. Real records and artificial motions used as seismic “bedrock” excitations in the shaking table tests, (A) the acceleration time histories of the excitations, (B) the elastic acceleration, and (C) displacement response spectra for 5% viscous damping ratio.
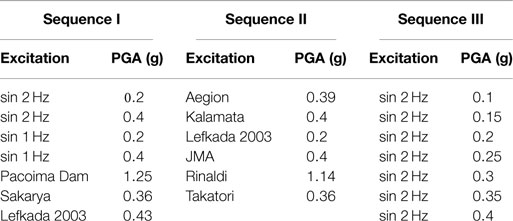
Table 3. The tree seismic shaking sequences of the shaking table tests.
Seismic Performance of the Lightly-Loaded System A
System A was subjected to the seismic excitation sequences I and II. As discussed later on, sequence III was used for System B only. In this section, selected results are presented for the lightly loaded System A, aiming to gain insight of the main features affecting its seismic performance and to assess the effectiveness of shallow soil improvement under truly dynamic conditions.
Truly Dynamic vs. Slow-Cyclic Response
In terms of monotonic and slow-cyclic pushover response, shallow soil improvement was proven to be quite effective (Anastasopoulos et al., 2012). Figure 6 summarizes the results of such testing, depicting the settlement per cycle wc as a function of the imposed cyclic rotation amplitude θc. Although this section focuses on the lightly loaded System A, the results for System B are also presented for completeness. For both systems, a z/B = 1 dense sand crust is proven enough to achieve practically the same performance as the ideal case of dense sand. For the shallower z/B = 0.5 soil improvement layer, the cyclic settlement reduction is quite evident, but the response differs substantially from the ideal case of dense sand for both systems. Even though, a shallower z/B = 0.5 soil improvement layer may be adequate, depending on design requirements. The efficiency of shallow soil improvement is ameliorated with the increase in the cyclic rotation amplitude, especially in the case of the lightly loaded system A.
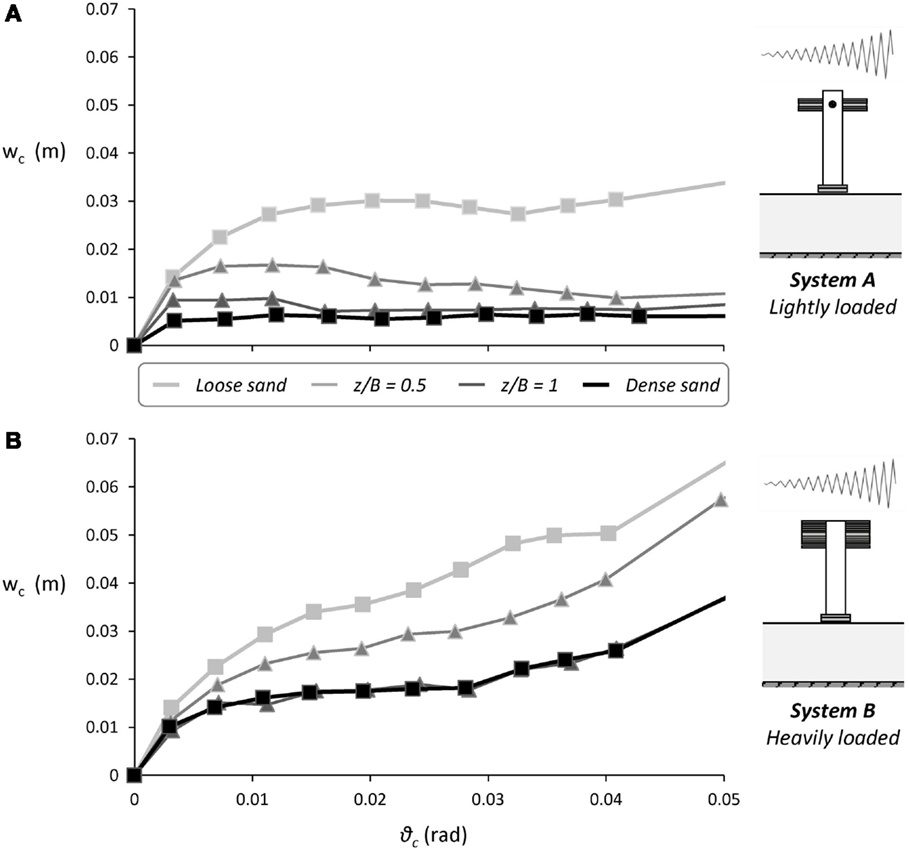
Figure 6. Slow-cyclic pushover tests results. Settlement per cycle wc as a function of cyclic rotation amplitude ϑ (A) lightly loaded System A and (B) heavily loaded System B.
Figure 7 summarizes the performance of the lightly loaded system subjected to the Aegion seismic excitation. Although the record of the 1995 Ms 6.2 Aegion (Greece) earthquake is considered as a moderate intensity seismic excitation, it does contain a single strong motion pulse of 0.39 g, which is well above the critical acceleration ac of System A for all cases considered (as previously discussed, ac ranges from 0.072 g for poor soil to 0.15 g for ideal conditions). To make things worse, due to soil amplification the maximum acceleration measured at the free field reaches 0.58 g (Figure 7A). As a result, the response of the system is highly non-linear for all cases examined. As shown in Figure 7B, the strong motion pulse of the Aegion record leads to a maximum rotation θmax of roughly 0.01 rad, which is not particularly sensitive to the soil conditions. Naturally, θmax is slightly larger for poor soil conditions (loose sand), but the differences are practically negligible. A simplified explanation for this can be derived using an equivalent linear approach: the initial natural period of the four systems that ranges between 0.66 s for the system lying on dense sand and 1.21 s for the one lying on loose sand increases substantially with the non-linear response of the rocking footing, yielding effecting periods that correspond to substantially diminished spectral accelerations in the area of the spectrum where the differences in the stiffness of the soil deposit or in the effective damping ratio do not alter the response significantly. The imposed rotation is irrecoverable when the system is founded on loose sand, with the residual rotation θres being almost the same as θmax. This is not the case for ideal soil conditions (dense sand), where θres is practically 0: the system returns to each original position. Shallow soil improvement proves quite effective in reducing the residual rotation, with the deeper z/B = 1 crust being advantageous: θres = 0.002 rad as opposed to 0.0025 rad of the shallower z/B = 0.5 crust.
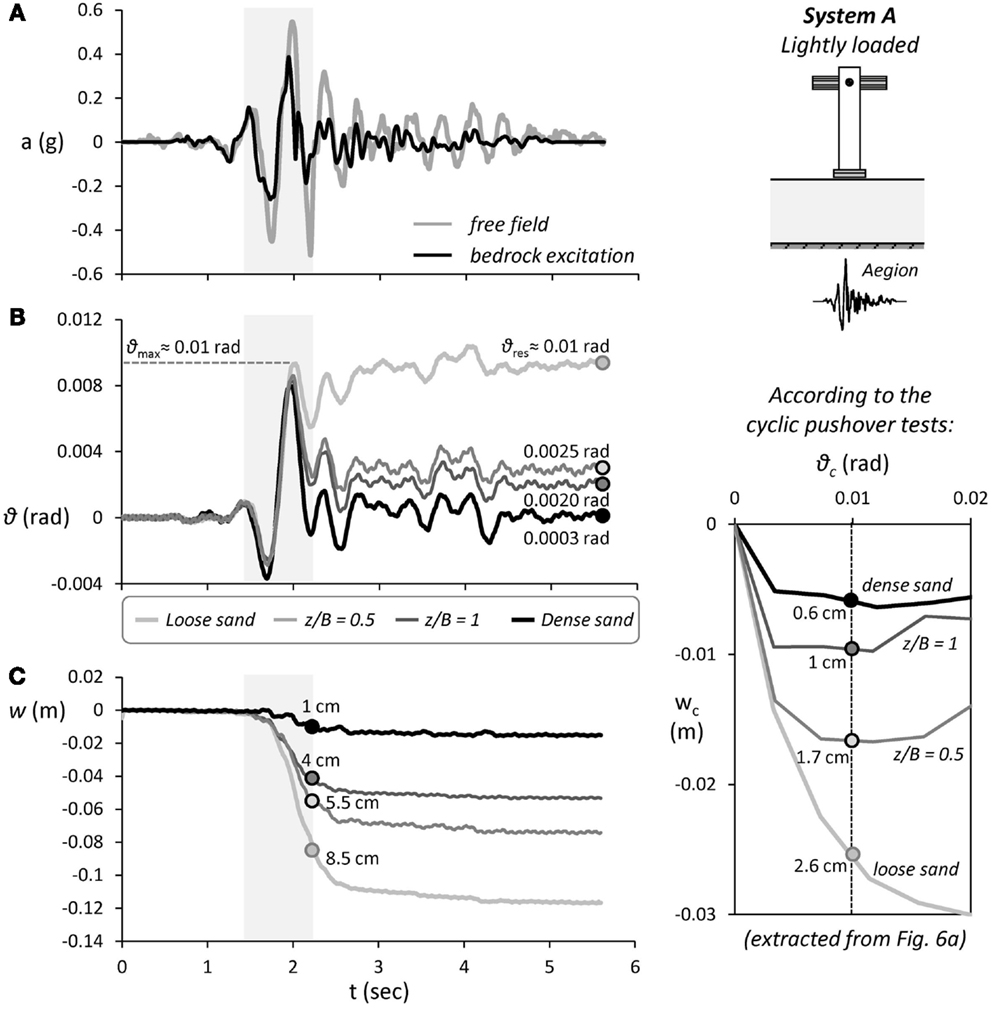
Figure 7. Seismic performance of the lightly loaded System A subjected to moderate seismic shaking using the Aegion record as excitation–comparison of shallow soil improvement with poor (loose sand) and ideal (dense sand) soil conditions. Time histories of (A) free field and base excitation, (B) foundation rotation, and (C) settlement. An extract from Figure 6A (bottom right) is also shown to allow direct comparison with the cyclic pushover tests.
As expected, under such strongly non-linear foundation response the rocking system accumulates dynamic settlement. As shown in Figure 7C, shallow soil improvement is quite effective in reducing the accumulated settlement. It should be noted that the settlement shown in this figure as well as in all the respective figures in the ensuing, corresponds to the total settlement of the footing, while the settlement of the free field is omitted. This is done because the instrument used to measure the settlement of the free field malfunctioned during some of the tests, and a meaningful comparison would not be possible. However, for the cases where it was measured, the free field settlement proved to be minor compared to the settlement of the footing. For example, for the lightly loaded system lying on the shallower crust and subjected to a sinusoidal excitation of frequency 2 Hz and amplitude 0.4 g, one of the most adverse motions, the measured free field settlement was 6.6 cm compared to the 39.2 cm for the footing. When founded on poor soil conditions (loose sand), the settlement reaches 12 cm. Applying shallow soil improvement of depth z/B = 0.5, the accumulated settlement is reduced to 7 cm, while a deeper z/B = 1 soil crust leads to further reduction of the settlement to 5 cm. Although such a value is substantially larger than the dynamic settlement under ideal soil conditions (merely 1.5 cm), the efficiency of shallow soil improvement is undeniable. Observe that the larger part of the accumulated settlement is due to the single strong motion pulse of the Aegion record. In the case of loose sand, 8.5 out of 12 cm of the total accumulated settlement take place during this pulse. The same applies to the remaining configurations, with most of the settlement taking place during that single pulse: 5.5 out of 7 cm for the z/B = 0.5 crust; 4 out of 5 cm for the z/B = 1 crust; and 1 out of 1.5 cm for the case of ideal conditions.
With the response being so straight forward, it is interesting to compare the results of the shake table tests to what would be expected on the basis of the cyclic pushover tests. Going back to Figure 6A (an extract of which is reproduced in Figure 7 to allow direct comparisons), for cyclic rotation θc = θmax ≈ 0.01 rad, the system on loose sand would accumulate cyclic settlement wc = 2.6 cm, while as we saw under truly dynamic loading it actually accumulates wdyn = 8.5 cm. Similarly, in the case of the z/B = 0.5 shallow soil improvement, the system settles wdyn = 5.5 cm as opposed to the wc = 1.7 cm, and the same applies to the z/B = 1 (wdyn = 4 cm as opposed to wc = 1 cm) and to the ideal case of dense sand (wdyn = 1 cm as opposed to wc = 0.6 cm). Hence, although qualitatively the shake table tests confirm the findings of the slow-cyclic pushover tests, from a quantitative point of view, there are very substantial differences. These differences can only be attributed to the dynamic response of the soil, which cannot possibly be captured through cyclic loading. Under dynamic loading, the deformation of the soil underneath the footing is not only due to the stresses imposed by the rocking foundation (inertia loading) but is also affected by the shear stresses that develop within the soil due to the seismic shaking itself (kinematic loading). Even in the absence of a rocking foundation, due to the developing shear stresses within the soil (kinematic loading), the sand would settle: dynamic compaction. However, compared to the free field where the soil is compacted under 0 normal stress at the surface, the soil underneath the footing is compacted under the weight of the footing, leading thus to increased settlements.
Such dynamic compaction proves to be quite intense for the case of loose (Dr = 45%) sand: wdyn–wc = 5.9 cm. In the case of dense (Dr = 93%) sand, such effects are suppressed and the differences are much lower: wdyn–wc = 0.4 cm. Things are slightly more complicated in the case of shallow soil improvement. While the dense sand crust should not be prone to such effects, underneath there is still loose sand, which will settle due to dynamic compaction. Naturally, the depth of the loose sand layer is reduced with the increase of the depth of the improvement crust: from 3B in the case of loose sand, to 2.5B for z/B = 0.5, and to 2B for z/B = 1. Since the amount of soil compaction is proportionate to the depth of the loose sand layer, there should be an analogy here as well. Starting from the previously mentioned values for loose sand (wdyn–wc = 5.9 cm), the expected values for z/B = 0.5 and z/B = 1 should be 5 cm (=6 cm × 2.5B/3B) and 4 cm (=6 cm × 2B/3B), respectively. The experimental results verify the above simplified approach with minor divergence: the difference between the dynamic settlement and the respective predicted by the slow-cyclic pushover tests is 3.8 cm for the case of z/B = 0.5 and 3 cm for the z/B = 1, with the small difference attributed to the fact that the two mechanisms that lead to footing settlement (rocking of the footing and dynamic compaction of the soil deposit under the weight of the footing) act simultaneously and therefore are coupled resulting in less settlement than if they were acting separately. Nonetheless, the results confirm that the differences in the response (compared to cyclic loading) are due to dynamic compaction of the underlying loose sand.
The Effect of Excitation Frequency
The performance of System A subjected to more intense seismic shaking, using as seismic excitation the Pacoima Dam record from the 1971 San Fernando earthquake, is summarized in Figure 8. In contrast to previous seismic excitation (Aegion), the Pacoima Dam record is definitely a very strong seismic record. Apart from its impressive PGA of 1.25 g, this record is characterized by a long duration (and hence, low frequency) directivity pulse, having an amplitude of 0.6 g (see the shaded area in Figure 8A). Given the previously discussed critical acceleration of the system on loose sand, merely ac = 0.072 g collapse should have been expected, and this is exactly what happened. The same applies to the z/B = 0.5 crust. The system managed to survive such strong shaking only when founded on dense sand, or in the case of the deeper z/B = 1 soil improvement. This alone is a very important conclusion, confirming the efficiency of the z/B = 1 shallow soil improvement in terms of survivability. The remaining discussion will focus on the two systems that did not collapse.
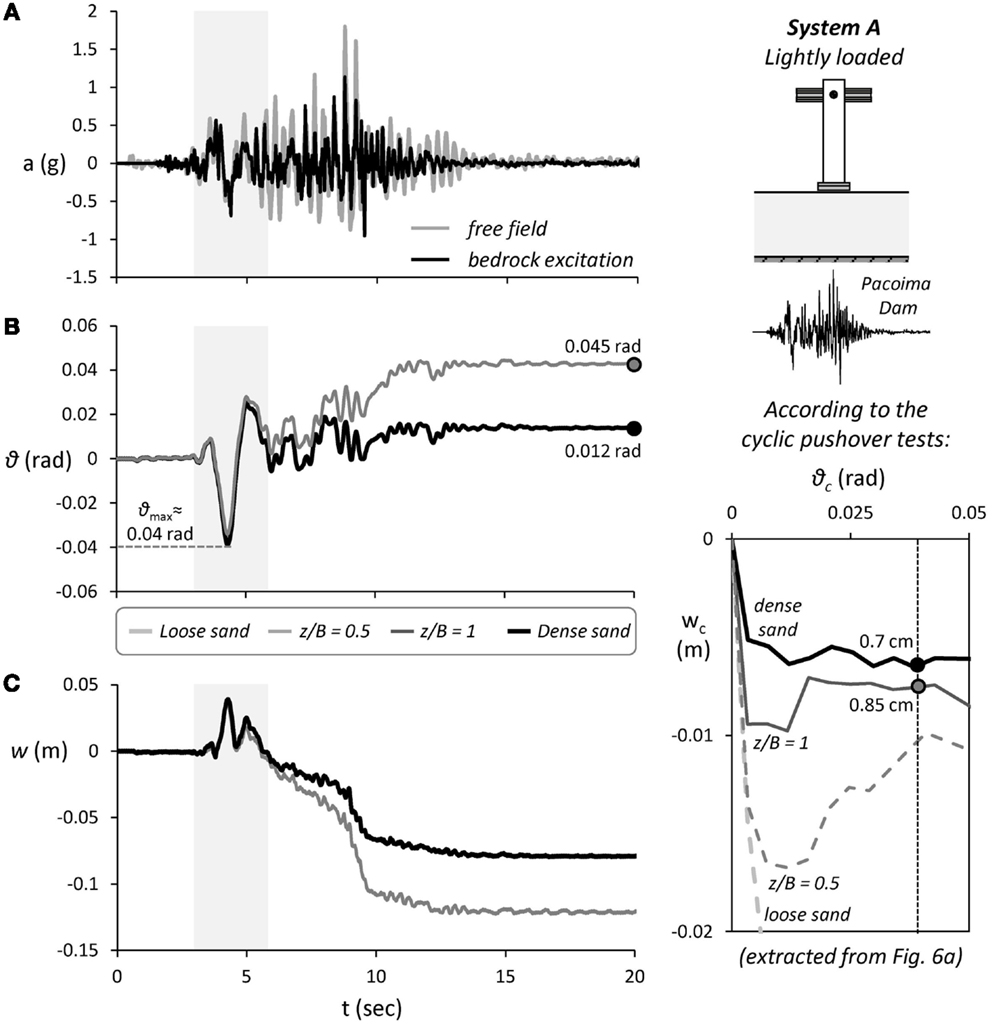
Figure 8. Seismic performance of the lightly loaded System A subjected to seismic shaking using the Pacoima dam record as excitation–comparison of shallow soil improvement with poor (loose sand) and ideal (dense sand) soil conditions. Time histories of (A) free field and base excitation, (B) foundation rotation, and (C) settlement. An extract from Figure 6A (bottom right) is also shown to allow direct comparison with the cyclic pushover tests.
The response can roughly be divided in two phases. In the first phase, which approximately lasts from t = 3 to 6 s, the previously mentioned strong directivity pulse dominates the response. With a very large period T ≈ 1.2 s, this pulse drives both systems well within their metaplastic regime, developing a maximum rotation θ ≈ 0.04 rad (Figure 8B). The second phase (for t > 6 s) is characterized by a multitude of strong motion cycles of even larger amplitude (up to 1.25 g) but of substantially smaller period, ranging from 0.1 to 0.4 s. As revealed by the free field acceleration measurements (Figure 8A), due to soil amplification, there are three acceleration peaks in excess of 1 g, with one of them reaching a PGA of 1.8 g. Under such unrealistically extreme seismic excitation, either on dense sand or on z/B = 1 soil improvement, the rocking system survives. Although the differences in θmax are again negligible, there is a substantial difference in θres = 0.045 rad for the case of z/B = 1 soil improvement, compared to 0.012 rad for ideal soil conditions.
In terms of settlement accumulation, the response is distinctly different during the two phases of the response. As illustrated in Figure 8C, during the long period directivity pulse (phase 1), the settlement is minimal in both cases. In fact, the rocking system is mainly subjected to uplifting and the accumulated settlement at t = 6 s does not exceed 1 cm. During this phase of response, the z/B = 1 crust is proven very effective, exhibiting practically identical behavior to that of the ideal case of dense sand. The performance is markedly different during the second phase, which is characterized by a multitude of strong motion cycles of larger amplitude but of much higher frequency. The settlement mainly takes place during this second phase, with the accumulated settlement reaching 8 cm for dense sand and 12 cm in the case of the z/B = 1 soil crust. It is worth reminding that the above values refer to the prototype structure. The correct scaling of both the structure (by 20 times) and of the frequency of the excitation (by 4.5 times) assure the similitude in the settlement between the prototype problem and the model. Although such scaling is not perfect in 1 g testing, it is the best that can be done and this is generally accepted in such procedures. Even though, the settlement may be affected by scale effects, as recently shown in Kokkali et al. (2015), where we compared 1 g with centrifuge model testing. The comparison indicates that the cyclic foundation settlement in 1 g testing is over-estimated. Due to the incorrect scaling of geostatic stresses, the strength and the dilative behavior of the sand are over-estimated, but the shear stiffness is under-estimated. And under cyclic loading, this leads to larger foundation settlement. This is a limitation of the presented work that should be clearly spelled out.
Let us now compare the results of the shake table tests to the “prediction” on the basis of the cyclic pushover tests. As for the previous case, an extract from Figure 6A is included in Figure 8 to facilitate the comparison. Focusing on the first phase of response, for a cyclic rotation θc = θmax ≈ 0.04 rad, the system would accumulate cyclic settlement wc = 0.7 cm and 0.85 cm, in the case dense sand and z/B = 1 soil improvement, respectively. In the shaking table tests, the dynamic settlement during the first phase is quite similar, not exceeding wdyn ≈ 1 cm. The differences are much larger during the second phase of response, with the final accumulated dynamic settlement reaching 8 cm under ideal soil conditions and almost 12 cm in the case of shallow soil improvement. In both cases, the magnitude of the accumulated settlement is larger than what would have been predicted on the basis of the cyclic pushover test results. The reasons are the same with those previously discussed, but the accumulation of settlement and the efficiency of shallow soil improvement are clearly affected by the excitation frequency.
To further clarify the role of excitation frequency, two idealized 15-cylce sinusoidal motions with a PGA of 0.2 g are used, with the only difference being the frequency: f = 1 and 2 Hz. Figure 9 compares the performance of the two cases of soil improvement with the ideal case of dense sand. Although the acceleration is exactly the same (Figure 9A), the “slower” f = 1 Hz excitation will develop larger (theoretically double) ground displacement compared to the “faster” f = 2 Hz sinus. And since the rotation of the rocking system depends largely on the ground displacement, the f = 1 Hz excitation should produce larger rotation. Indeed, as shown in the rotation time histories (Figure 9B), the rotation amplitude per cycle of the systems subjected to the f = 1 Hz sinusoidal excitation is approximately double the respective rotation when the systems are subjected to the f = 2 Hz excitation.
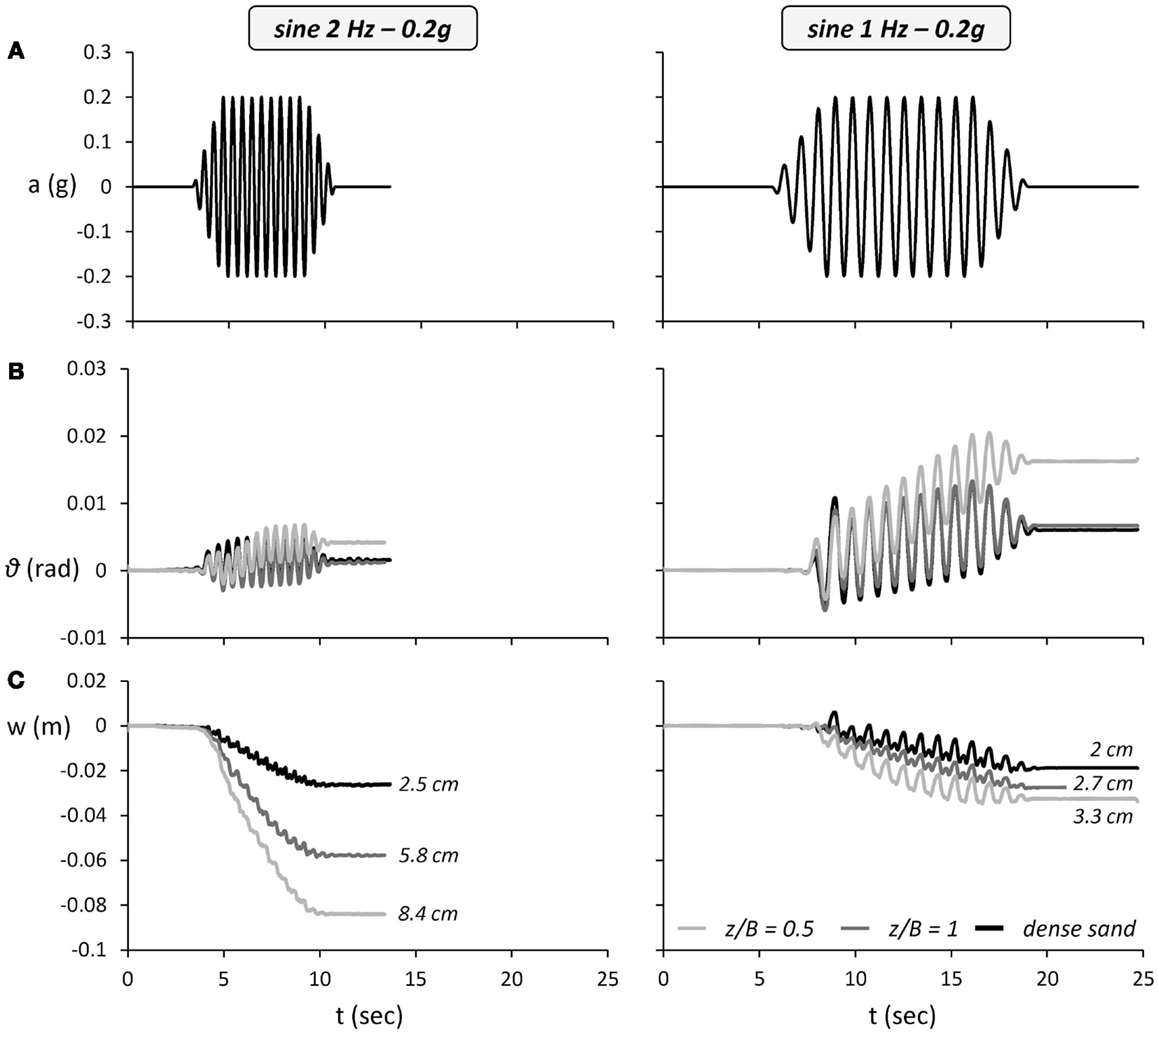
Figure 9. The effect of excitation frequency on the efficiency of shallow soil improvement. Comparison of shallow soil improvement with ideal soil conditions for the lightly loaded System A subjected to seismic shaking using two 15-cylce sinusoidal excitations of frequency f = 2 Hz (left) and f = 1 Hz (right). Time histories of (A) free field and base excitation, (B) foundation rotation, and (C) settlement.
Figure 9C compares the settlement for the two excitation frequencies. In the case of dense sand, the settlement is not particularly sensitive to the excitation frequency. The settlement w reaches 2.5 cm for the high-frequency f = 2 Hz sine, being only slightly lower (2 cm) for the lower frequency f = 1 Hz excitation. This is in accord with the cyclic pushover test results, according to which the cyclic settlement of System A on dense sand remains practically constant for 0.003 < θc < 0.03 rad. The small difference is possibly related to a limited amount of dynamic compaction, which mainly affected the f = 2 Hz sine, which was the first excitation in this seismic shaking sequence (see also Table 3).
The differences are much more pronounced for the two cases of shallow soil improvement. In both cases (i.e., z/B = 0.5 and 1.0), the accumulated settlement is much larger for the high-frequency f = 2 Hz excitation: roughly two times larger than for the low-frequency f = 1 Hz sine. This very substantial difference can not only be solely attributed to dynamic compaction of the underlying loose sand but is also related to the dependence of the efficiency of shallow soil improvement on cyclic rotation. In agreement with the results of monotonic and cyclic pushover tests, the efficiency of the crust is found to increase with rotation (the amplitude of θ for f = 1 Hz is almost twice as much for f = 2 Hz). While for smaller rotation the foundation is in full contact with the supporting soil, generating a deeper stress bulb, and hence, being affected by the underlying loose sand layer, when uplifting is initiated the effective foundation width is drastically decreased, reducing the depth of the generated stress bulb. Hence, a larger portion of the rocking-induced stresses are obtained by the “healthy” soil material of the crust, improving the performance of the system.
The Effect of the Number of the Cycles
Apart from rotation, the efficiency of shallow soil improvement is also ameliorated with the number of strong motion cycles. Figure 10 summarizes the results of seismic shaking sequence I, presenting the dynamic settlement w per cycle of motion with respect to the number of cycles, and as a function of excitation frequency and amplitude. In all cases examined, irrespective of excitation frequency or amplitude, the settlement per cycle of motion reduces with the number of cycles, thanks to soil densification underneath the footing.
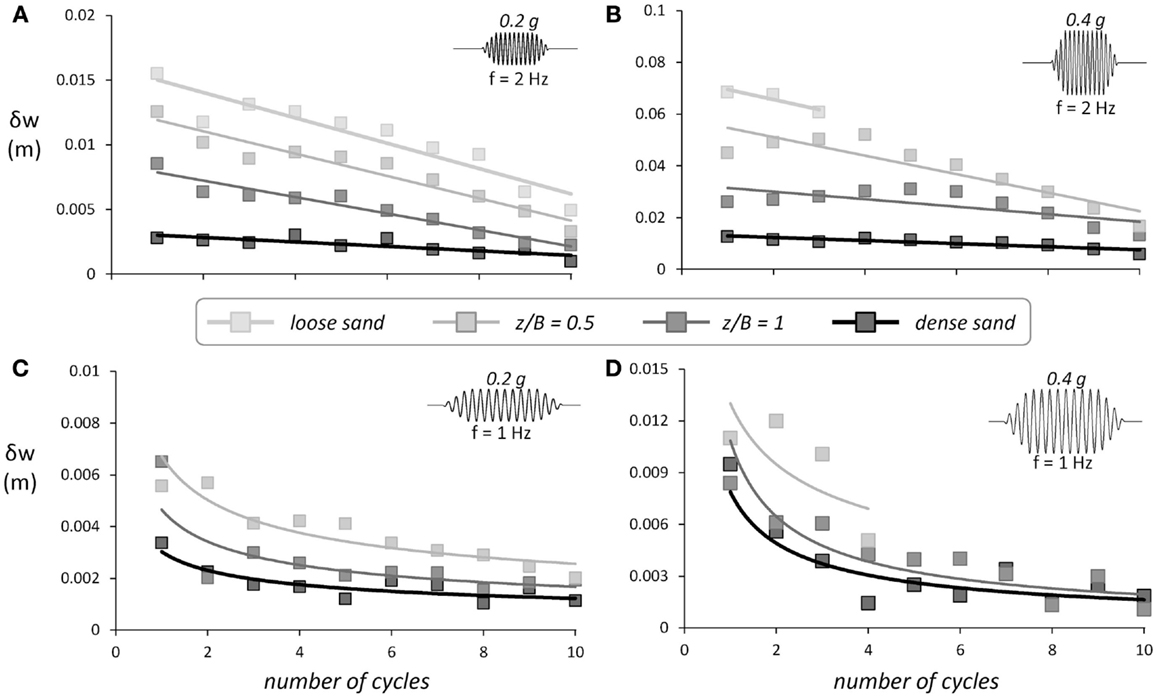
Figure 10. The effect of the number of strong motion cycles on the efficiency of shallow soil improvement. Comparison of shallow soil improvement with poor and ideal soil conditions for the lightly loaded System A. Foundation settlement per cycle for our different sinusoidal excitations: (A) f = 2 Hz, a = 0.2 g; (B) f = 2 Hz, a = 0.4 g; (C) f = 1 Hz, a = 0.2 g; and (D) f = 1 Hz, a = 0.4 g.
For the two high-frequency (f = 2 Hz) excitations, the rate of settlement δw is reduced almost linearly with the number of strong motion cycles. Quite interestingly, the decrease of δw is much more intense when the frequency of excitation is lower (f = 1 Hz). In this case, the first two or three cycles are enough to cause substantial dynamic compaction of the soil, and as a result, the remaining strong motion cycles are not leading to any substantial additional settlement. As previously discussed, the oscillation of the lightly loaded system is of significantly larger amplitude for the low-frequency sinusoidal excitation, and therefore, the first two or three cycles of large rotational amplitude are enough to compact the sand under the footing. On the contrary, the sand is continuously compacted due to small vibrations of the footing when the system is subjected to the f = 2 Hz sinusoidal excitation. Moreover, the decreasing trend of settlement accumulation should also be attributed to the rotation accumulation of the systems; as the systems unavoidably accumulate rotation toward the one side, they do not execute a symmetric cycle of rotation rather, they tend to tilt even more. Since settlement development is correlated with the compaction of the sand as the structure returns to its initial position, it is reasonable to assume that settlement accumulation is also affected by the rotation accumulation.
Synopsis and Discussion
Figure 11 summarizes the performance of the lightly loaded System A subjected to shaking sequences I and II in terms of settlement w and residual rotation θres as a function of PGA. Although the excitations were imposed in a sequence (i.e., one after the other), the results presented herein refer to values recorded during each excitation (not the cumulative ones). Therefore, the results are not to be considered representative of the performance of the system subjected to each excitation separately, but rather in a comparative manner in order to assess the efficiency of shallow soil improvement.
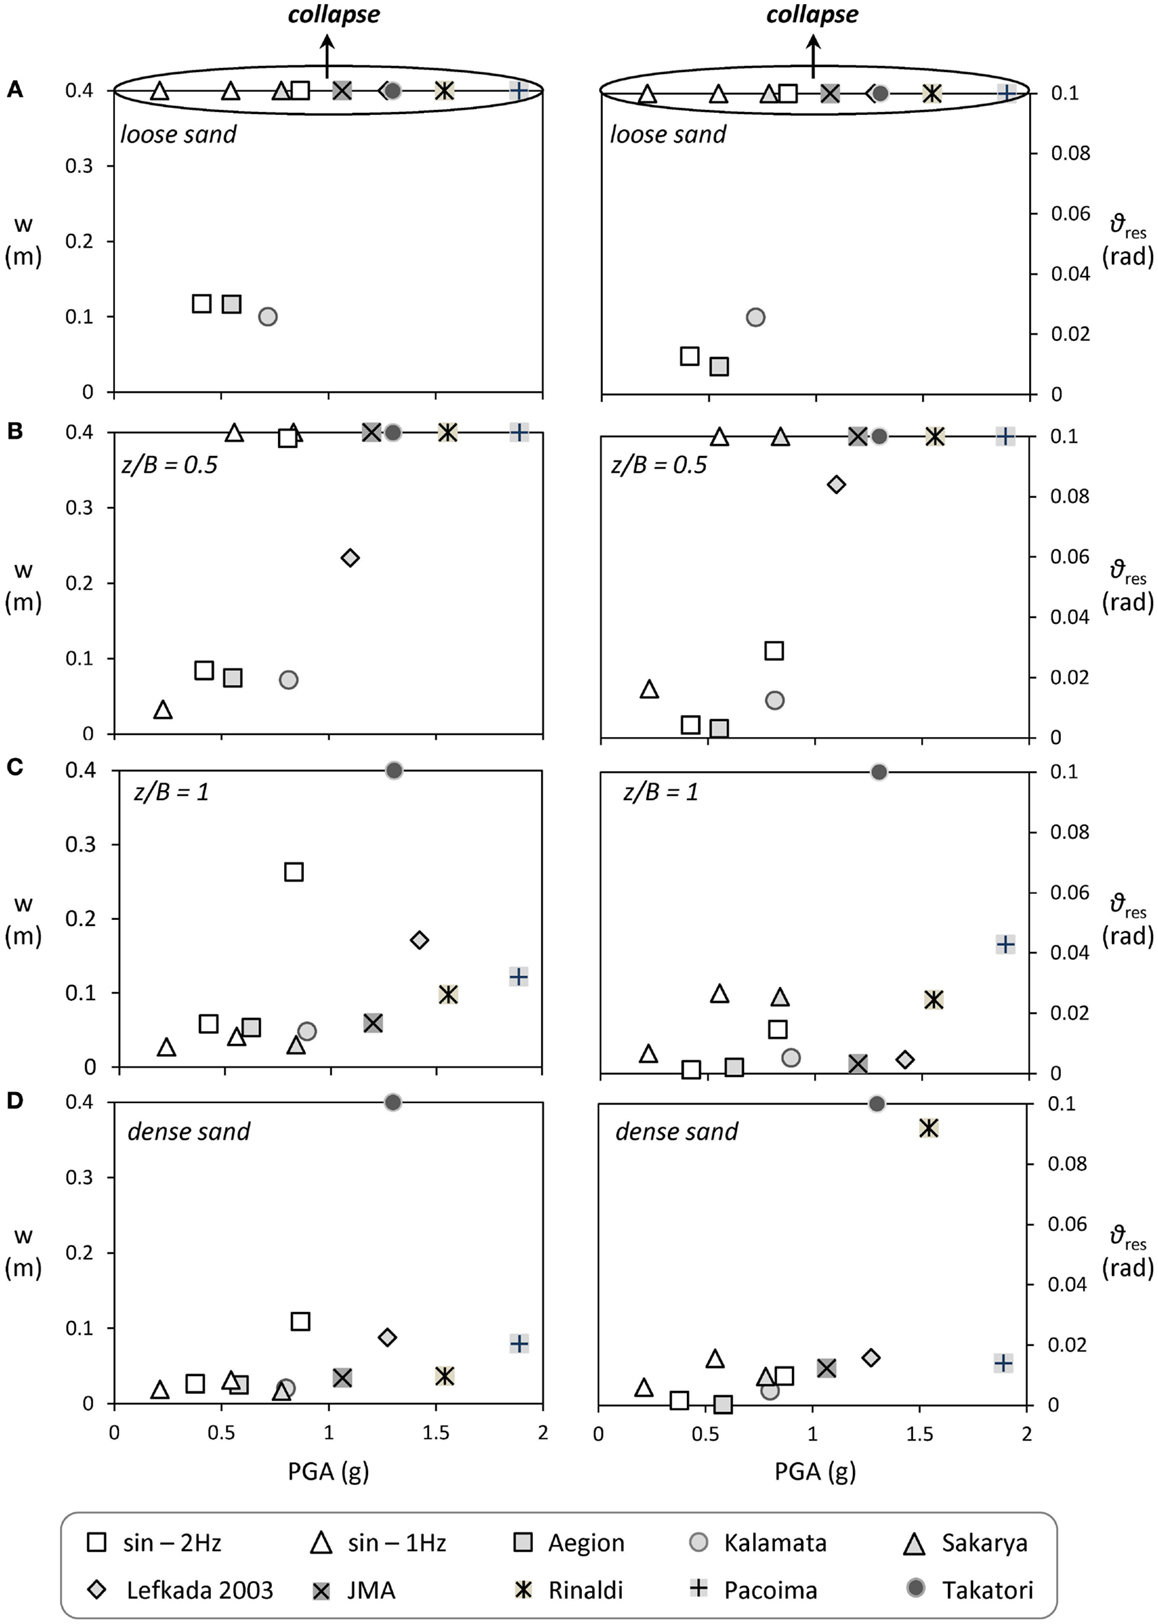
Figure 11. Synopsis of the performance of the lightly loaded System A subjected to seismic shaking sequences I and II. Settlement w (left) and residual rotation ϑres (right) as a function of PGA: (A) loose sand-poor soil conditions; (B) z/B = 0.5; (C) z/B = 1; and (D) dense sand-ideal soil conditions.
As vividly shown in Figure 11A, when the system is founded on loose sand (representative of poor soil conditions), it can only sustain 3 out of 12 seismic excitations (considering both shaking sequences). Even for these three excitations, the settlement is quite substantial (in excess of 10 cm). The improvement is quite evident for shallow soil improvement of depth z/B = 0.5 (Figure 11B). The system is able to withstand seismic excitations of PGA up to 1.1 g without toppling. Observe that the residual rotation θres is reduced by almost 50% compared to the untreated case of loose sand. However, the settlement w is not reduced to the same extent, and the system still topples in 7 out of 12 seismic excitations. A deeper z/B = 1 dense sand crust is required to decrease the settlement substantially (Figure 11C). In this case, the performance is practically the same with that of the ideal case of dense sand (Figure 11D), confirming the efficiency of shallow soil improvement with a z/B = 1 dense sand crust.
The main scope of rocking isolation is the reduction of the inertia transmitted onto the superstructure. It is therefore critical to ensure that shallow soil improvement is not canceling the isolation effect. This is confirmed Figure 12, where the acceleration amax at the oscillator mass (representing the bridge deck) is plotted as a function of the PGA of the seismic excitation (measured in the free field). The results of the shake table tests are also compared with the previously discussed critical acceleration ac, computed on the basis of the results of monotonic (static) pushover tests. In all cases examined, during the dynamic loading the footing exhibits a certain degree of overstrength (amax > ac). In fact, this overstrength is more significant as the FSV value decreases. As a result, when the system is founded on loose sand the recorded maximum acceleration is amax = 0.1 g (on average) as opposed to ac = 0.072 g: an overstrength of roughly 30%. In the case of z/B = 0.5 shallow soil improvement, the overstrength is reduced but still quite substantial: amax = 0.14 g as opposed to ac = 0.117 g, 20% of overstrength. Further increase of the depth of the improvement layer to z/B = 1 leads to further reduction of the overstrength to 12% (amax = 0.155 g while ac = 0.13 g), with the ideal case of dense sand (in which case FSV = 14) exhibiting minor, if any, overstrength. These conclusions are in full agreement with the results of slow-cyclic pushover tests (Anastasopoulos et al., 2012). The increased maximum measured accelerations could also be correlated with oscillations due to impact, a phenomenon discussed by various researchers [Chopra and Yim (1985) and Acikgoz and DeJong (2012, 2013) among others]. However, in the cases examined herein, the acceleration time histories recorded at the superstructure revealed no high-frequency oscillations that could be related to impact. This is expected since the systems rock on compliant soil rather than a rigid base.
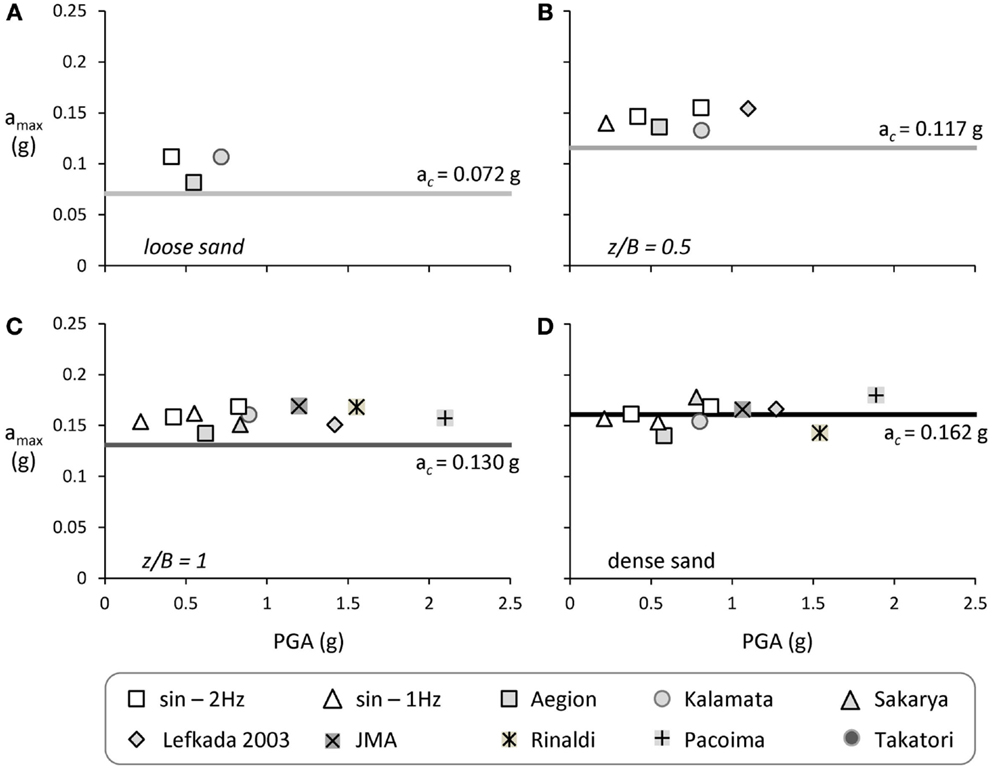
Figure 12. Synopsis of the performance of the lightly loaded System A subjected to seismic shaking sequences I and II. Maximum acceleration amax at the oscillator mass as a function of PGA: (A) loose sand-poor soil conditions; (B) z/B = 0.5; (C) z/B = 1; and (D) dense sand-ideal soil conditions.
Seismic Performance of the Heavily-Loaded System B
In this section, the seismic performance of the heavily loaded System B is discussed. In this case, the system is subjected to shaking sequence III, which is composed of sinusoidal excitations of frequency f = 2 Hz of increasing PGA (from 0.1 to 0.4 g). This different shaking sequence was used as the much lower capacity of System B did not allow shaking with the much harsher excitations of the other two sequences.
Figure 13 summarizes the performance of System B founded on the four different soil profiles (loose sand, z/B = 0.5 and 1 soil improvement, and dense sand), focusing on the residual rotation θres (Figure 13A) and settlement w (Figure 13B). Evidently, the heavily loaded system lying on loose sand is quite unstable, accumulating rather substantial rotation and settlement even for relatively low levels of PGA, and toppling for PGA = 0.4 g. In terms of residual rotation, the performance is improved rather spectacularly with shallow soil improvement, even for z/B = 0.5 (Figure 13A). For PGA < 0.4 g, the performance is almost identical to the ideal case of dense sand. However, in the case of the shallower z/B = 0.5 soil crust, System B topples for PGA = 0.5 g. Further increase of the improvement depth to z/B = 1 leads to a much more stable performance, and almost identical response with the ideal case of dense sand, even for the maximum imposed PGA.
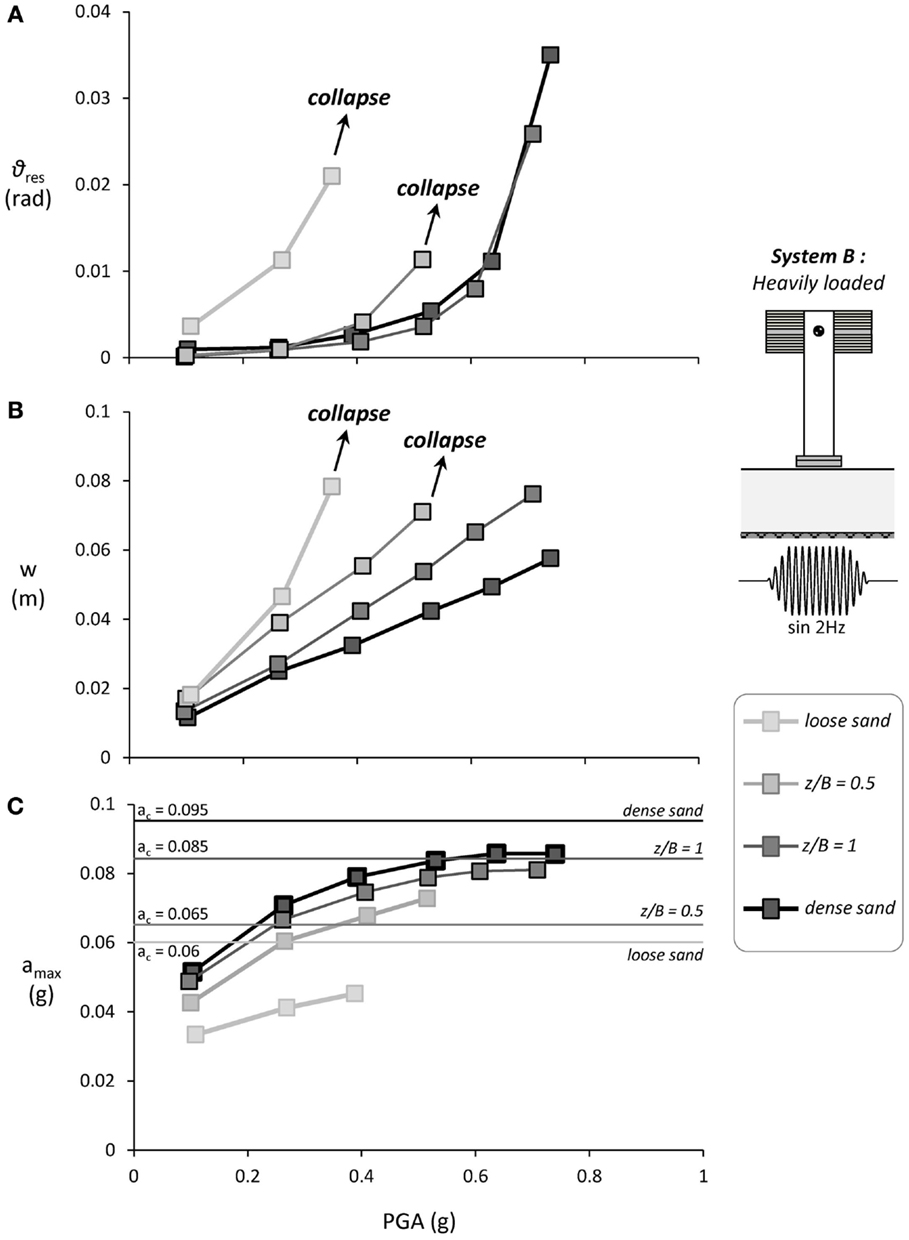
Figure 13. Synopsis of the performance of the heavily loaded System B subjected to seismic shaking sequence III: (A) residual rotation ϑres; (B) settlement w as a function of the excitation PGA (measured at the free field); and (C) maximum acceleration amax at the oscillator mass as a function of PGA and comparison with the critical acceleration ac, computed on the basis of the monotonic pushover tests.
In terms of settlement (Figure 13B), the deeper z/B = 1 soil improvement leads to a substantial improvement. A more shallow z/B = 0.5 crust is not as effective. Quite interestingly, up to a PGA of 0.2 g the system on z/B = 0.5 soil improvement settles almost the same as the one on loose sand. The efficiency of the crust starts improving for larger acceleration amplitudes, when uplifting starts to dominate the response, but soon after that the system collapses. Based on this result, it may safely be argued that such a shallow z/B = 0.5 improvement is not enough for such heavily loaded systems. On the other hand, the deeper z/B = 1 soil crust proves quite effective, with the settlement being roughly 25% larger compared to the ideal case of dense sand.
Figure 13C compares the performance in terms of maximum acceleration measured at the oscillator mass (representing the deck) as a function of PGA of the excitation (measured at the soil surface, in the free field). In stark contrast to the lightly loaded System A, where overstrength was apparent, the measured accelerations amax are much lower than the corresponding critical acceleration ac. The fact that for all four soil profiles amax increases with the excitation PGA is attributed to soil densification and to the fact that the pier is gradually tilting toward the one side resulting to increased amax on the opposite side. Quite interestingly, although System B is not reaching its ultimate moment capacity (since amax is lower than the corresponding ac), the response is profoundly non-linear as revealed by the accumulation of rotation in all cases examined (see Figure 13B). It may therefore be concluded that, although the ultimate capacity is not reached, largely non-linear soil–structure interaction (SSI) takes place, leading to a rather intense attenuation of the seismic motion for all four soil profiles examined.
Figure 14 attempts to shed more light to such effects, using the case of z/B = 1 soil improvement as an illustrative example and focusing on two sinusoidal excitations having a PGA of 0.2 and 0.25 g. For these two seismic excitations, the maximum measured acceleration at the oscillator mass is 0.073 and 0.078 g, respectively – in both cases, lower than the critical acceleration ac = 0.085 g (based on the results of monotonic pushover tests). Figure 14A illustrates the force–displacement (P–δ) response for the two cases examined, focusing on the steady state oscillation (i.e., after the first two to three cycles of motion). Although the ultimate capacity of the footing is not reached, the response is highly non-linear. Based on the illustrated loops, a very high hysteretic damping ratio ξ can be calculated, ranging between 40 and 45% for PGA = 0.2 and 0.25 g, respectively. Such non-linear response unavoidably leads to a decrease of the effective stiffness Keff of the system, and to an increase of its effective period Teff.
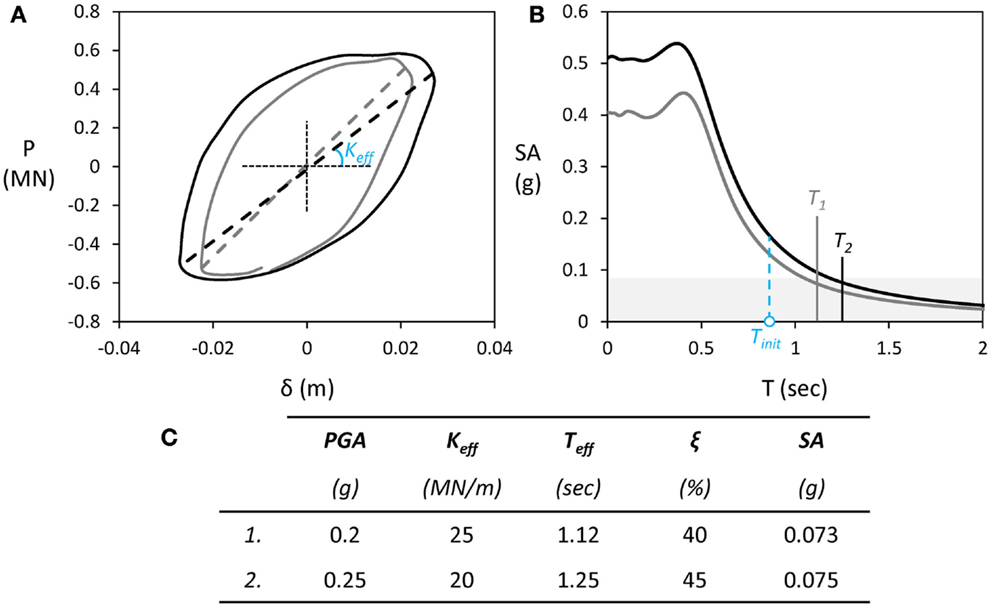
Figure 14. Attenuation due to strongly non-linear soil–structure interaction for heavily loaded system B subjected to shaking sequence III. The performance of the system on z/B = 1 soil improvement is shown as an illustrative example, focusing on two excitations with PGA = 0.2 and 0.25 g: (A) force–displacement (P–δ) response; (B) expected spectral acceleration SA as a function of effective period T; and (C) summary.
Figure 14B presents the acceleration response spectra of the measured free field acceleration at the ground surface (which is considered as the input to the rocking system) for the two excitations under consideration, accounting for the damping ratios ξ that have been calculated from the respective load–displacement loops. Based on the results of the monotonic pushover tests, the initial stiffness (i.e., for very small strains) of the system is Ko = 40 MN/m. Hence, accounting for quasi-elastic SSI (there is always some non-linearity, even before initiation of seismic shaking), the initial natural period of the rocking system is To = 0.89 s. Quite strikingly, when non-linear SSI is considered, the effective stiffness of the system drops to Keff = 24 and 20 MN/m, resulting to Teff = 1.12 and 1.25 s for PGA = 0.2 and 0.25 g, respectively (Figure 14C). This substantial increase in the effective period of the system leads to rather intense “de-amplification” of the input motion, resulting to spectral accelerations SA lower than the critical acceleration ac = 0.085 g. Based on the above simplified rationale, the expected accelerations at the oscillator mass are 0.073 and 0.075 g for PGA = 0.2 and 0.25 g, respectively, which are in very good agreement with the experimental measurements. Despite its simplicity and the fact that there are methods of non-linear analysis much more advanced, the above rationale provides an excellent prediction of the response at least for the specific cases examined herein.
Lightly vs. Heavily Loaded Systems: The Effect of De-Amplification
The previously discussed “de-amplification” proves to significantly affect response of the system. Figure 15 compares the performance of the heavily loaded System B with the lightly loaded system A, further elucidating the effect of “de-amplification.” The comparison is performed for seismic excitation with an f = 2 Hz sine having a PGA of 0.2 g.
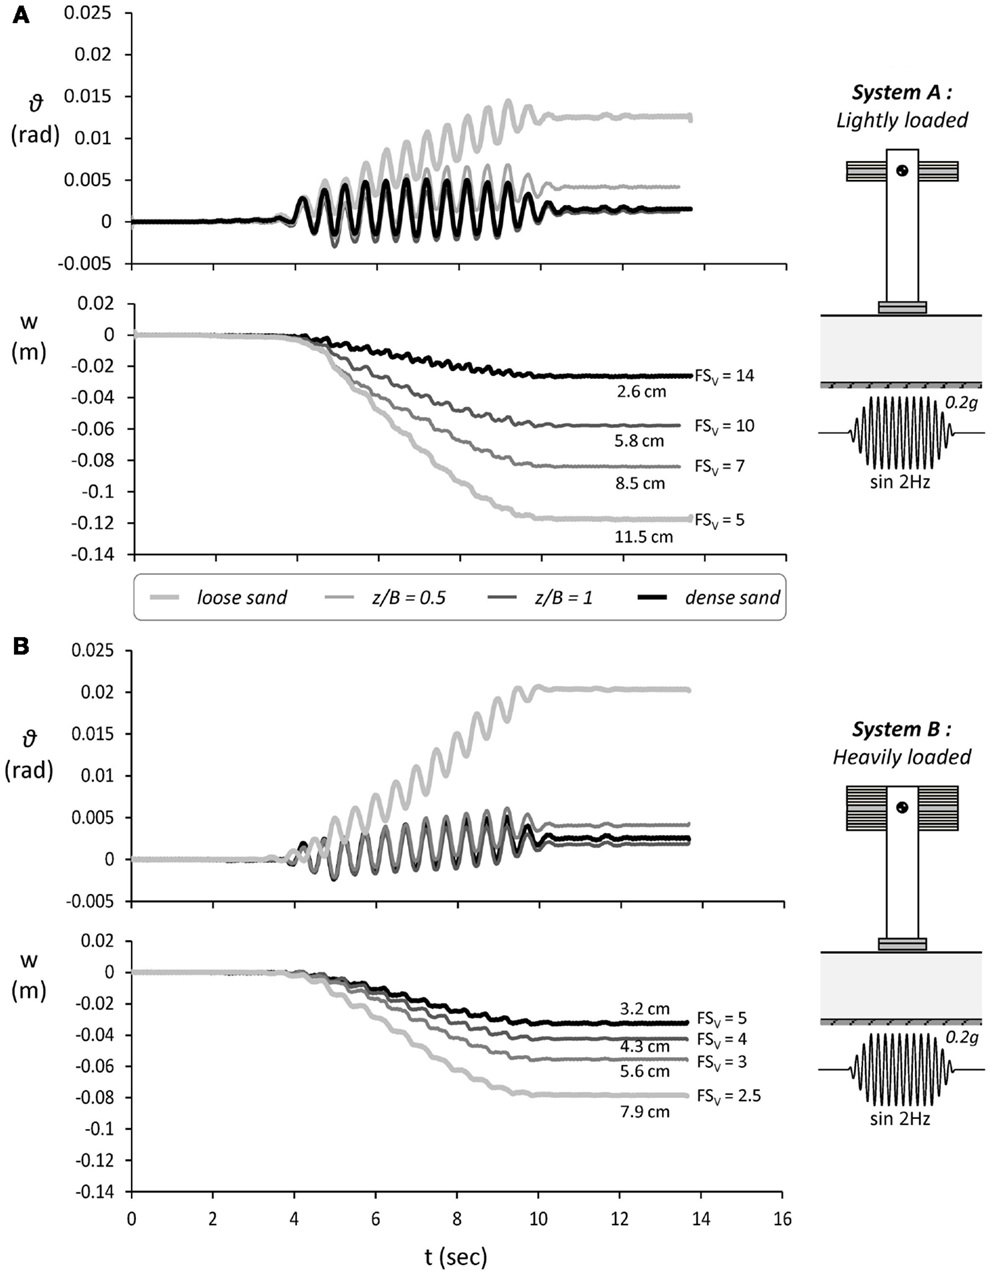
Figure 15. The effect of “de-amplification” due to strongly non-linear SSI. Time histories of rotation ϑ and settlement w for all soil profiles examined, subjected to an f = 2 Hz sine of PGA = 0.2 g. Comparison of (A) lightly loaded System A; with (B) heavily loaded System B.
Time histories of rotation θ and settlement w of the lightly loaded system (Figure 15A) are compared to the heavily loaded system (Figure 15B) for all four soil profiles. Given the much lower moment capacity of the heavily loaded system, it would have been reasonable to expect inferior performance. It is reminded that the factors of safety FSV of the heavily loaded systems are much lower than those of the lightly loaded ones (ranging from 2.5 to 5 as opposed to 5 to 14), and the same applies to their critical accelerations ac. The reality, however, is different. The lightly loaded systems are subjected to much more settlement. For example, the lightly loaded system founded on z/B = 1 soil improvement settles 6 cm, while the settlement of its heavily loaded counterpart does not exceed 4.5 cm. At this point, it should be noted that while for the lightly loaded system A this particular excitation is the first of shaking sequence I, for the heavily loaded system B, it is preceded by two other excitations, which means that some densification may have already taken place. Moreover, the loose sand representing poor soil conditions is of lower relative density in the case of the lightly loaded system (Dr = 45% as opposed to 60%). Even though, these two factors alone cannot fully explain the difference in settlement.
This counter-intuitive behavior is easily explainable considering the effects of the previously discussed “de-amplification.” Observe the rotation time histories of Figure 15B that the lightly loaded systems are rocking with maximum rotation θ = 0.003 rad (on average), while the heavily loaded systems are experiencing lower θ = 0.002 rad (on average). Although the seismic excitation is the same, being much stiffer, the lightly loaded system is excited much more: its lower natural period is closer to the dominant period of the seismic excitation. In stark contrast, the heavily loaded system is much more flexible to start with, and becomes even more flexible as soon as it starts responding non-linearly. As previously discussed, due to such non-linear SSI, significant degradation of the system’s effective stiffness takes place, leading to a substantial increase of its effective period, which in turn leads to de-amplification. As a result, the heavily loaded systems prove more resilient to this particular seismic excitation than the lightly loaded ones. Naturally, overall the lightly loaded systems are much less vulnerable, as also revealed by the cases in which the heavily loaded systems toppled.
It is also interesting to compare the behavior of the two systems with the same FSV: the lightly loaded system lying on loose sand and the heavily loaded system lying on dense sand. The two systems exhibit remarkably different behavior: not only does the heavily loaded system accumulate less settlement but also the rotation amplitude of its oscillation is notably smaller as well. This proves that the FSV alone cannot describe the dynamic response of two systems subjected to the same excitation. As shown in other studies (Kourkoulis et al., 2012), the response of two rocking systems of the same FSV and aspect ratio h/B subjected to the same excitation can be similar provided that there is the appropriate analogy in the stiffness of the foundation soil. In this case, the loose sand deposit proves to be relatively less stiff leading thus to increased rotation and settlement accumulation for the lightly loaded system.
Conclusion
Aiming to explore the efficiency of shallow soil improvement as a means to mitigate settlement accumulation due to non-linear response of the footing during an earthquake, this paper experimentally investigated the seismic response of two conceptual bridge piers represented by two relatively slender h/B = 3 systems, both lying on square foundation of width B. The first one corresponds to a lightly loaded structure (relatively large FSV), while the second refers to a heavily loaded structure (relatively low FSV), deliberately chosen to model distinctly different foundation performance, from uplifting-dominated to sinking-dominated response. The two systems were subjected to reduced-scale shaking table testing at the Laboratory of Soil Mechanics of the NTUA. They were first tested on poor soil conditions in order to demonstrate the necessity for soil improvement. Then, the effectiveness of shallow soil improvement was studied by investigating the performance of the two systems on soil crusts of depth z/B = 1 and 0.5. Finally, the performance of the two systems lying on the improved soil profiles was compared to that considering ideal soil conditions.
The main conclusions of the presented research can be summarized as follows:
• Based on the conducted reduced-scale tests, and at least for the cases examined herein, the concept of shallow soil improvement is proven quite effective in reducing the dynamic settlement of the footing. For both systems, a z/B = 1 dense sand crust is enough to achieve practically the same performance (in terms of settlement) with the ideal case of dense sand. A shallower z/B = 0.5 soil improvement may also be considered effective, depending on design requirements.
• The results of the shaking table tests are in very good qualitative agreement with previously published (Anastasopoulos et al., 2012) experimental results from monotonic and slow-cyclic pushover tests. In quantitative terms, the differences are non-negligible with the shaking table tests yielding much larger settlement for all cases examined. The tests presented herein not only confirm the key conclusions of the static experiments but also reveal substantial differences, which are attributed to kinematic soil response and dynamic compaction–mechanisms that cannot possibly be simulated through static pushover testing.
• As with the slow-cyclic pushover tests, the performance of shallow soil improvement is found to depend on the rotation amplitude. Real records and artificial motions of different frequency were examined, which forced the two systems to oscillate at various rotation amplitudes. It was shown that with the increase of the rotation amplitude the effectiveness of the soil crusts increases.
• The performance of shallow soil improvement is ameliorated with the number of cycles of the motion. The rate of settlement reduces with the increase of the number of cycles for all cases examined.
Conflict of Interest Statement
The authors declare that the research was conducted in the absence of any commercial or financial relationships that could be construed as a potential conflict of interest.
Acknowledgments
The financial support for this paper has been provided under the research project “DARE,” which is funded through the European Research Council’s (ERC) “IDEAS” Programme, in Support of Frontier Research-Advanced Grant, under contract/number ERC-2-9-AdG228254–DARE.
References
Acikgoz, S., and DeJong, M. J. (2012). The interaction of elasticity and rocking in flexible structures allowed to uplift. Earthquake Eng. Struct. Dynam. 45, 2177–2194. doi:10.1002/eqe.2181
Acikgoz, S., and DeJong, M. J. (2013). “Analytical and experimental observations on vibration modes of flexible rocking structures,” in SECED – Society for Earthquake and Civil Engineering Dynamics Young Engineers Conference. Newcastle.
Allotey, N., and El Naggar, M. H. (2003). Analytical moment–rotation curves for rigid foundations based on a Winkler model. Soil Dynam. Earthquake Eng. 23, 367–381. doi:10.1016/S0267-7261(03)00034-4
Allotey, N., and El Naggar, M. H. (2007). An investigation into the winkler modeling of the cyclic response of rigid footings. Soil Dynam. Earthquake Eng. 28, 44–57. doi:10.1016/j.soildyn.2007.04.003
Anastasopoulos, I., Gazetas, G., Loli, M., Apostolou, M., and Gerolymos, N. (2010a). Soil failure can be used for earthquake protection of structures. Bull. Earthquake Eng. 8, 309–326. doi:10.1007/s10518-009-9145-2
Anastasopoulos, I., Gelagoti, F., Kourkoulis, R., and Gazetas, G. (2011). Simplified constitutive model for simulation of cyclic response of shallow foundations: validation against laboratory tests. J. Geotech. Geoenviron. Eng. 137, 1154–1168. doi:10.1061/(ASCE)GT.1943-5606.0000534
Anastasopoulos, I., Gelagoti, F., Spyridaki, A., Sideri, T. Z., and Gazetas, G. (2013a). Seismic rocking isolation of asymmetric frame on spread footings. J. Geotech. Geoenviron. Eng. 140, 133–151. doi:10.1061/(ASCE)GT.1943-5606.0001012
Anastasopoulos, I., Loli, M., Georgarakos, T., and Drosos, V. (2013b). Shaking table testing of rocking-isolated bridge pier. J. Earthquake Eng. 17, 1–32. doi:10.1080/13632469.2012.705225
Anastasopoulos, I., Kourkoulis, R., Gelagoti, F., and Papadopoulos, E. (2012). Rocking response of SDOF systems on shallow improved sand: an experimental study. Soil Dynam. Earthquake Eng. 40, 15–33. doi:10.1016/j.soildyn.2012.04.006
Anastastasopoulos, I., Georgarakos, P., Georgiannou, V., Drosos, V., and Kourkoulis, R. (2010b). Seismic performance of bar-mat reinforced-soil retaining wall: shaking table testing versus numerical analysis with modified kinematic hardening constitutive model. Soil Dynam. Earthquake Eng. 30, 1089–1105. doi:10.1016/j.soildyn.2010.04.002
Antonellis, G., Gavras, A. G., Panagiotou, M., Kutter, B. L., Guerrini, G., Sander, A. C., et al. (2015). Shake table test of large-scale bridge columns supported on rocking shallow foundations. J. Geotech. Geoenviron. Eng. 141, 04015009. doi:10.1061/(ASCE)GT.1943-5606.0001284
Butterfield, R., and Gottardi, G. (1995). “Simplifying transformations for the analysis of shallow foundations on sand,” in Proc. 5th Int. Offshore and Polar Eng Conf (The Hague), 534–538.
Chatzigogos, C. T., Figini, R., Pecker, A., and Salençon, J. (2011). A macroelement formulation for shallow foundations on cohesive and frictional soils. Int. J. Numer. Anal. Meth. Geomech. 35, 902–931. doi:10.1002/nag.934
Chatzigogos, C. T., Pecker, A., and Salençon, J. (2009). Macroelement modeling of shallow foundations. Soil Dynam. Earthquake Eng. 29, 765–781. doi:10.1016/j.soildyn.2008.08.009
Chen, X. L., and Lai, Y. M. (2003). Seismic response of bridge piers on elastic-plastic Winkler foundation allowed to uplift. J. Sound Vibrat. 266, 957–965. doi:10.1016/S0022-460X(02)01382-2
Chopra, A. K., and Yim, S. C. S. (1985). Simplified earthquake analysis of structures with foundation uplift. J. Struct. Eng. 111, 906–930. doi:10.1061/(ASCE)0733-9445(1985)111:4(906)
Crémer, C. (2001). Modélisation du Comportement Non Lineaire des Foundations Superficielles Sous Seisme. Ph.D. Thesis, LMT-Cachan, France.
Crémer, C., Pecker, A., and Davenne, L. (2001). Cyclic macro-element for soil-structure interaction: material and geometrical nonlinearities. Int. J. Numer. Anal. Meth. Geomech. 25, 1257–1284. doi:10.1002/nag.175.abs
Drosos, V., Georgarakos, T., Loli, M., Anastasopoulos, I., Zarzouras, O., and Gazetas, G. (2012). Soil- foundation-structure interaction with mobilization of bearing capacity: an experimental study on sand. J. Geotech. Geoenviron. Eng. 138, 1369–1386. doi:10.1061/(ASCE)GT.1943-5606.0000705
Faccioli, E., Paolucci, R., and Vivero, G. (2001). “Investigation of seismic soil-footing interaction by large scale cyclic tests and analytical models,” in Proc. 4th International Conference on Recent Advances in Geotechnical Earthquake Engineering and Soil Dynamics (San Diego, CA). Paper no. SPL-5.
Gajan, S., and Kutter, B. L. (2008). Capacity, settlement, and energy dissipation of shallow footings subjected to rocking. J. Geotech. Geoenviron. Eng. 134, 1129–1141. doi:10.1061/(ASCE)1090-0241(2008)134:8(1129)
Gajan, S., and Kutter, B. L. (2009). Effects of moment-to-shear ratio on combined cyclic load-displacement behavior of shallow foundations from centrifuge experiments. J. Geotech. Geoenviron. Eng. 135, 1044–1055. doi:10.1061/(ASCE)GT.1943-5606.0000034
Gajan, S., Kutter, B. L., Phalen, J. D., Hutchinson, T. C., and Martin, G. R. (2005). Centrifuge modeling of load-deformation behavior of rocking shallow foundations. Soil Dynam. Earthquake Eng. 25, 773–783. doi:10.1016/j.soildyn.2004.11.019
Gazetas, G., Apostolou, M., and Anastasopoulos, I. (2003). “Seismic uplifting of foundations on soft soil, with examples from Adapazari (Izmit 1999, Earthquake),” in Proceedings of BGA International Conference on Foundations (Dundee: University of Dundee), 37–50.
Gelagoti, F., Kourkoulis, R., Anastasopoulos, I., and Gazetas, G. (2012). Rocking isolation of low-rise frame structures founded on isolated footings. Earthquake Eng. Struct. Dynam. 41, 1177–1197. doi:10.1002/eqe.1182
Gourvenec, S. (2007). Shape effects on the capacity of rectangular footings under general loading. Géotechnique 57, 637–646. doi:10.1680/geot.2007.57.8.637
Grange, S., Kotronis, P., and Mazars, J. (2008). A macro-element for the circular foundation to simulate 3D soil-structure interaction. Int. J. Numer. Anal. Meth. Geomech. 32, 1205–1227. doi:10.1002/nag.664
Harden, C., and Hutchinson, T. (2006). Investigation into the effects of foundation uplift on simplified seismic design procedures. Earthquake Spectra 22, 663–692. doi:10.1193/1.2217757
Houlsby, G. T., Amorosi, A., and Rojas, E. (2005). Elastic moduli of soils dependent on pressure: a hyperelastic formulation. Géotechnique 55, 383–392. doi:10.1680/geot.2005.55.5.383
Housner, G. W. (1963). The behavior of inverted pendulum structures during earthquakes. Bull. Seismol. Soc. Am. 53, 403–417.
Kawashima, K., Nagai, T., and Sakellaraki, D. (2007). “Rocking seismic isolation of bridges supported by spread foundations,” in Proc. of 2nd Japan-Greece Workshop on Seismic Design, Observation, and Retrofit of Foundations (Tokyo), 254–265.
Kokkali, P., Anastasopoulos, I., Abdoun, T., and Gazetas, G. (2015). Static and cyclic rocking on sand: centrifuge versus reduced scale 1g experiments. Géotechnique 64, 865–880. doi:10.1680/geot.14.P.064
Kourkoulis, R., Anastasopoulos, I., Gelagoti, F., and Kokkali, P. (2012). Dimensional analysis of SDOF systems rocking on inelastic soil. J. Earthquake Eng. 16, 995–1022. doi:10.1080/13632469.2012.691615
Kutter, B. L., Martin, G., Hutchinson, T. C., Harden, C., Gajan, S., and Phalen, J. D. (2003). Status Report on Study of Modeling of Nonlinear Cyclic Load-Deformation Behavior of Shallow Foundations. Davis, CA: University of California; PEER Workshop.
Le Pape, Y., and Sieffert, J. P. (2001). Application of thermodynamics to the global modelling of shallow foundations on frictional material. Int. J. Numer. Anal. Meth. Geomech. 25, 1377–1408. doi:10.1002/nag.186
Mergos, P. E., and Kawashima, K. (2005). Rocking isolation of a typical bridge pier on spread foundation. J. Earthquake Eng. 9, 395–414. doi:10.1142/S1363246905002456
Nakaki, D. K., and Hart, G. C. (1987). “Uplifting response of structures subjected to earthquake motions,” in Report No. 2.1-3, U.S.-Japan Coordinated Program for Masonry Building Research (Los Angeles, CA).
Negro, P., Paolucci, R., Pedretti, S., and Faccioli, E. (2000). “Large-scale soil-structure interaction experiments on sand under cyclic loading,” in Proceedings of the 12th World Conference on Earthquake Engineering (Aukland), 1191.
Nova, R., and Montrasio, L. (1991). Settlement of shallow foundations on sand. Geotechnique 41, 243–256. doi:10.1680/geot.1991.41.2.243
Paolucci, R. (1997). Simplified evaluation of earthquake induced permanent displacements of shallow foundations. J. Earthquake Eng. 1, 563–579. doi:10.1142/S1363246997000210
Paolucci, R., Shirato, M., and Yilmaz, M. T. (2008). Seismic behaviour of shallow foundations: shaking table experiments vs numerical modeling. Earthquake Eng. Struct. Dynam. 37, 577–595. doi:10.1002/eqe.773
Pecker, A. (1998). “Capacity design principles for shallow foundations in seismic areas,” in Proc. 11th European Conference on Earthquake Engineering (Paris: A.A. Balkema Publishing).
Pecker, A. (2003). “A seismic foundation design process, lessons learned from two major projects: the Vasco de Gama and the Rion Antirion bridges,” in ACI International Conference on Seismic Bridge Design and Retrofit (San Diego, CA: University of California at San Diego).
Pedretti, S. (1998). Non-Linear Seismic Soil-Foundation Interaction: Analysis and Modeling Methods. Ph.D. thesis, Politechnico di Milano, Milan.
Raychowdhury, P., and Hutchinson, T. C. (2009). Performance evaluation of a nonlinear Winkler-based shallow foundation model using centrifuge test results. Earthquake Eng. Struct. Dynam. 38, 679–698. doi:10.1002/eqe.902
Shirato, M., Kouno, T., Asai, R., Nakani, N., Fukui, J., and Paolucci, R. (2008). Large-scale experiments on nonlinear behavior of shallow foundations subjected to strong earthquakes. Soils Found. 48, 673–692. doi:10.3208/sandf.48.673
Taiebat, H. A., and Carter, J. P. (2000). Numerical studies of the bearing capacity of shallow foundations on cohesive soil subjected to combined loading. Géotechnique 50, 409–418. doi:10.1680/geot.2000.50.4.409
Tan, F.S. (1990). Centrifuge and Theoretical Modelling of Conical Footings on Sand. Ph.D. thesis, University of Cambridge, Cambridge, UK.
Keywords: rocking, seismic performance, soil improvement, physical modeling, shaking table
Citation: Tsatsis A and Anastasopoulos I (2015) Performance of rocking systems on shallow improved sand: shaking table testing. Front. Built Environ. 1:9. doi: 10.3389/fbuil.2015.00009
Received: 14 March 2015; Accepted: 22 June 2015;
Published: 06 July 2015
Edited by:
Panagiotis Mergos, City University London, UKReviewed by:
Marios Panagiotou, University of California Berkeley, USAMichalis F. Vassiliou, ETH Zürich, Switzerland
Copyright: © 2015 Tsatsis and Anastasopoulos. This is an open-access article distributed under the terms of the Creative Commons Attribution License (CC BY). The use, distribution or reproduction in other forums is permitted, provided the original author(s) or licensor are credited and that the original publication in this journal is cited, in accordance with accepted academic practice. No use, distribution or reproduction is permitted which does not comply with these terms.
*Correspondence: Ioannis Anastasopoulos, Division of Civil Engineering, School of Engineering Physics and Mathematics, University of Dundee, Nethergate, Dundee DD14HN, UK, i.anastasopoulos@dundee.ac.uk