Displacement-based seismic design of symmetric single-storey wood-frame buildings with the aid of N2 method
 Panagiotis Mergos
 Katrin Beyer
- 1Research Centre for Civil Engineering Structures, Department of Civil Engineering, City University London, London, UK
- 2Earthquake Engineering and Structural Dynamics Laboratory, Department of Civil Engineering, École Polytechnique Fédérale de Lausanne, Lausanne, Switzerland
This paper presents a new methodology for the displacement-based seismic design of symmetric single-storey wood-frame buildings. Previous displacement-based design efforts were based on the direct displacement-based design approach, which uses a substitute linear system with an appropriate stiffness and viscous damping combination. Despite the fact that this method has shown to produce promising results for wood structures, it does not fit into the framework of the Eurocode 8 (EC8) provisions. The methodology presented herein is based on the N2 method, which is incorporated in EC8 and combines the non-linear pushover analysis with the response spectrum method. The N2 method has been mostly applied to reinforced concrete and steel structures. In order to properly implement the N2 method for the case of wood-frame buildings, new behavior factor–displacement ductility relationships are proposed. These relationships were derived from inelastic time history analyses of 35 SDOF systems subjected to 80 different ground motion records. Furthermore, the validity of the N2 method is examined for the case of a timber shear wall tested on a shake table and satisfactory predictions are obtained. Last, the proposed design methodology is applied to the displacement-based seismic design of a realistic symmetric single-storey wood-frame building in order to meet the performance objectives of EC8. It is concluded that the simplicity and computational efficiency of the adopted methodology make it a valuable tool for the seismic design of this category of wood-frame buildings, while the need for extending the method to more complex wood-frame buildings is also highlighted.
Introduction
In Eurocode 8 – Part 1 (CEN, 2004), the performance-based seismic design of structures is based on a force-based approach. Force-based seismic design is adopted by the codes since engineers are more familiar with this methodology as it resembles the design for other load cases, such as gravity loads or wind loads. However, nowadays, it is widely recognized (Priestley et al., 2007; Fardis, 2009) that force-based design is not a rational way for implementing performance-based seismic design. This is the case because structural and non-structural damage is directly related to imposed displacements and/or deformations. In force-based design, displacements and deformations are only checked at the end of the design procedure in order to establish that they are below some predefined limits.
For wood-frame buildings, correct application of force-based design is further undermined by several drawbacks, such as (i) the requirement of the definition of an initial (“elastic”) stiffness and period (timber shear walls behave non-linearly even in the very early stages of their lateral response), (ii) a lack of appropriate behavior factor q–displacement ductility μΔ relationships in the literature and therefore in design codes. It is recalled herein that q is the ratio of the peak force Fel that would have developed if the system behaved linearly elastically to the yield strength Fy of the actual system. The displacement ductility μΔ is the ratio of the maximum displacement response to the yield displacement dy. Moreover, capacity design approaches have not yet been fully developed for the case of wood-frame buildings.
To overcome the short-comings of a force-based design approach, several displacement-based design approaches have been developed (Sullivan et al., 2003). The fundamental concept of displacement-based design is to design a structure in order to achieve, rather be bounded by, a performance level for a given seismic action. One of the best-known procedures that falls within this category is the direct displacement-based design (DDBD) method, which was initially developed by Priestley (1993) and Priestley and Kowalsky (2000). DDBD methodologies assume a substitute linear system (Shibata and Sozen, 1976) with an appropriate stiffness and viscous damping combination that best reproduces the response of the inelastic system at the performance level under investigation.
Several researchers have applied the DDBD approach to wood-frame buildings. Filiatrault and Folz (2002) developed a performance-based seismic design methodology for wood-frame buildings, which is based on the DDBD. Pang and Rosowsky (2009) developed a new DDBD procedure for performance-based seismic design of mid-rise wood-frame buildings. Pang et al. (2010) simplified the methodology by Pang and Rosowsky (2009) and applied their approach to a six-storey wood-frame building, which was tested at full scale as part of the NEESWood project (van de Lindt and Liu, 2006). Furthermore, Wang et al. (2010) developed a set of factors for use in the methodology by Pang et al. (2010) in order to meet pre-specified performance levels with certain probabilities of non-exceedance.
Although DDBD methods have shown to produce promising results for wood structures, they do not fit into the framework of the Eurocode 8 (EC8) provisions, which do not adopt the linear substitute structure approach for assessing seismic response. Instead, they use a non-linear static assessment method the so-called N2 method (Fajfar and Gaspersic, 1996; Fajfar, 1999, 2000). This method is a capacity spectrum method, which combines the non-linear static (pushover) analysis and the response spectrum approach. The method has been widely applied to reinforced concrete, steel, and unreinforced masonry structures. For timber buildings, however, only few applications have been carried out.
Fragiacomo et al. (2011) used the N2 method to assess the seismic response of a multi-storey crosslam massive wooden building. They indicate that the lack of appropriate behavior factor q–displacement ductility μΔ relationships for systems with significant pinching and stiffness degradation is the main drawback for the application of the method to timber structures.
The main objective of this paper is the application of the N2 method to the direct performance-based seismic design of symmetric single-storey wood-frame buildings. To meet this goal, a new design methodology is developed and applied to a realistic wood-frame building case study.
Furthermore, to apply the N2 method to wood-frame buildings in a consistent manner, new behavior factor q–displacement ductility μΔ relationships of SDOF systems representative of the hysteretic response of wood-frame buildings are developed. Then, the validity of the N2 method with the new q–μΔ relationships is verified against experimental results of wood-frame buildings.
Description of the N2 Method for SDOF Systems
In this section, the basic steps of the N2 method for SDOF systems, which can be assumed representative of symmetric in plan single-storey wood-frame buildings, are outlined. Furthermore, the limitations of this method when applied to wood-frame buildings are highlighted and discussed. The N2 method can also be applied to MDOF systems by transforming the MDOF system into a SDOF system that represents the first mode behavior.
The N2 method for SDOF systems comprises the following basic steps.
Step 1
The data required for the application of the method are obtained. For computing the structure’s capacity, the structural configuration of the SDOF system with mass m needs to be determined (Figure 1A). Seismic demand is represented by a pseudo-acceleration response spectrum (Figure 1B).
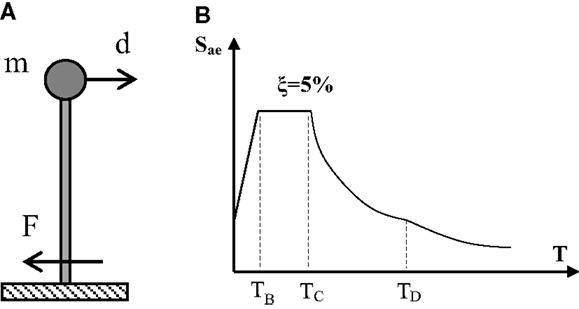
Figure 1. Data selection for the N2 method for SDOF systems: (A) SDOF system; (B) elastic pseudo-acceleration response spectrum of EC8.
Step 2
The elastic acceleration–displacement response spectrum (ADRS) is determined by the following relationship, which is valid for a constant viscous damping ratio (e.g., 5%), and Sde and Sae represent elastic displacement and acceleration spectra, respectively.
The inelastic acceleration Sa and inelastic displacement Sd spectra for a constant displacement ductility level μΔ are then determined by the following relationships, where q is the behavior factor due to ductility (i.e., hysteretic response).
For the derivation of the inelastic spectra, it is necessary to determine the relationship between q and μΔ. In the next section, new q–μΔ relationships are developed to account for the special hysteretic characteristics of wood-frame buildings.
Step 3
A pushover analysis is conducted and the relationship between top displacement d versus base shear F is established.
Step 4
Having established the actual force F versus displacement d relationship of the SDOF system, an approximate elastoplastic envelope (Figure 2) is obtained, by using an appropriate bilinearisation method (FEMA-273, 1997; Fajfar, 2000), with yielding point (dy, Fy).
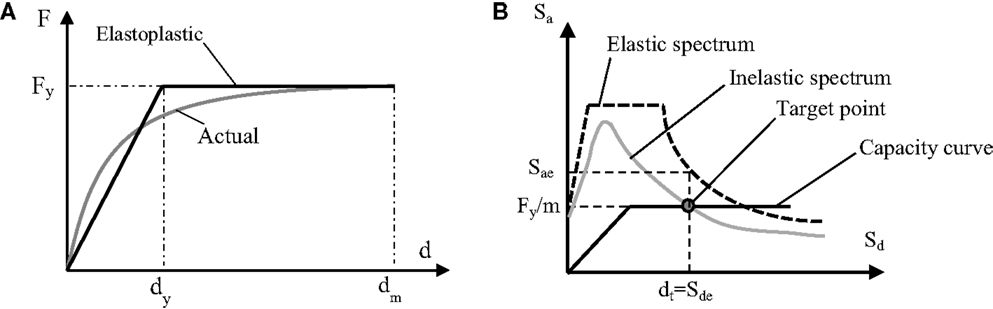
Figure 2. N2 method: (A) equivalent bilinear capacity curve; (B) determination of target point (case where T ≥ TC).
The elastic period T of the equivalent SDOF system is calculated as
The elastoplastic capacity curve is finally transformed into acceleration versus displacement format by the following relationship
Step 5
The performance (target) point with displacement dt is determined graphically by the intersection of the demand (inelastic spectrum) and capacity curve when both are plotted in the displacement–acceleration format (Figure 2). Alternatively, dt can be calculated by simple closed-form expressions as explained in Annex B of EC8-Part 1.
Step 6
At this last step, local demands developed at the level of target displacement are compared (if required) with the corresponding acceptable limits (capacities) for the performance level under examination.
From the description of the basic steps of the N2 method for SDOF systems, the following flaws related to the application of this method to symmetric single-storey wood-frame buildings can be identified:
• The method uses inelastic response spectra that have not been developed for structural systems representative of wood-frame buildings, which are characterized by hysteretic behavior with significant stiffness and strength deterioration and important pinching effect.
• The method uses displacement ductility μΔ, which is a function of the displacement of the structure at yielding. Yield displacement is used also for the determination of the elastic stiffness and elastic period. However, wood-frame buildings exhibit a non-linear behavior right when subjected to horizontal loads. Hence, the definition of the yield displacement is ambiguous and may not be representative of the actual non-linear response.
Relationship Between Behavior Factor q and Ductility Demand μΔ for Wood-Frame Buildings
As explained in the previous section, the relationship between q-factor and μΔ is a key feature of the N2 method. It is recalled that EC8 adopts the inelastic response spectra derived by Vidic et al. (1994) for the determination of seismic demand. These spectra were derived using hysteretic relationships representative of the flexural response of reinforced concrete and steel members: the elastoplastic model and the Q-model Vidic et al. (1994); for both models a positive post-yield slope of 10% was assumed. These models may therefore not be representative and accurate for timber structures, whose hysteretic behavior is characterized by significant stiffness and strength deterioration and important pinching effect.
To investigate herein the validity of the relationship between q-factor and μΔ, a number of inelastic time history analyses are conducted for SDOF systems representative of the timber shear walls’ hysteretic response for several ground motion records from regions of low to moderate and high seismicity. The same set of ground motions has been used in a study on loading protocols (Mergos and Beyer, 2014).
More particularly, 60 records were taken to be representative of a low to moderate seismicity region like the city of Sion in Switzerland. The city of Sion is situated in the Rhone Valley and has a design PGA of 0.16 g for 10% in 50 years (10/50) hazard level. For this site, the de-aggregation of hazard results is readily available (Giardini et al., 2004). All ground motions have a moment magnitude within the range of 4.3 ≤ Mw ≤ 6.6 and an epicentral distance within the range 5 km ≤ R ≤ 33 km. The unscaled acceleration response spectra of the ground motion records selected for low to moderate seismicity regions are shown in Figure 3A.
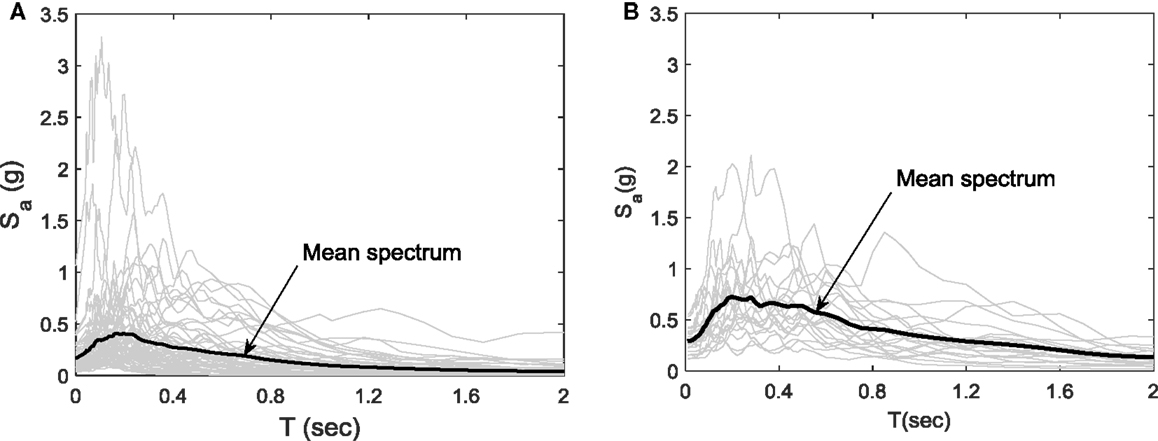
Figure 3. Unscaled acceleration response spectra of ground motion records representative of (A) low to moderate seismicity records; (B) high-seismicity records.
In addition to the 60 ground motion records representative of low to moderate seismicity regions, a set of 20 ground motion records used by Krawinkler et al. (2001) as representative of high-seismicity regions is also considered herein. All ground motions of this set have a moment magnitude within the range of 6.7 ≤ Mw ≤ 7.3 and an epicentral distance within the range 14 km ≤ R ≤ 26 km. The unscaled acceleration response spectra of the ground motion records used for high-seismicity regions are shown in Figure 3B.
The selected ground motion records are scaled one by one in order to match the spectral acceleration of the horizontal elastic spectrum (Krawinkler et al., 2001) of EC8-Part 1 for the 10/50 seismic hazard level at the fundamental period of the structure. The target EC8 elastic spectrum is derived for soil class C. The PGA for the 10/50 seismic hazard level and the site of Sion is taken equal to 0.16 g, while for the high-seismicity earthquakes it is taken equal to 0.40 g.
In order for a SDOF system to be representative of a structural system, an appropriate force-displacement hysteretic model has to be selected. For the timber shear walls, the Wayne–Stewart hysteretic model is adopted herein with the hysteretic parameter values proposed by Stewart (1987) for plywood sheathed timber walls (Figure 4). It is worth noticing that similar hysteretic parameters have been proposed by Filiatrault et al. (2003) for different types of timber walls [i.e., oriented strandboard (OSB), stucco, and gypsum]. The obtained results are therefore applicable to a wide range of timber wall buildings.
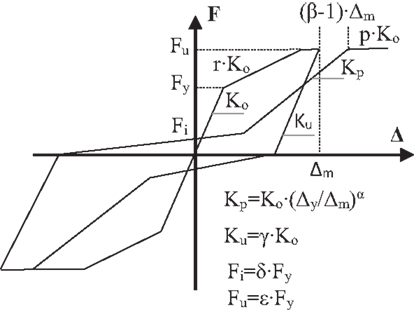
Figure 4. Wayne–Stewart hysteretic model. Assumed hysteretic parameters for wood-frame buildings: α = 0.38, β = 1.09, γ = 1.45, δ = 0.25, ε = 1.5, and p = 0.
The following values of elastic periods of the SDOF systems are assumed in this study: T = 0.2, 0.3, 0.45, 0.6, 0.8, 1.0, and 1.5 s. Moreover, the following values of behavior factors q are examined in accordance with EC8 provisions: q = 1, 2, 3, 4, and 5. The yield strength Fy of each SDOF systems is calculated from the ordinate of the design EC8 spectrum for the 10/50 seismic hazard level for the period T and the q-factor under investigation. The viscous damping ratio ζ is assumed equal to 5%. The post-yield stiffness ratio r (ratio of post-yield to elastic stiffness) of the SDOF systems is assumed equal to 10%. The same value has been adopted by Vidic et al. (1994) for the derivation of the q–μΔ relationships of EC8. Furthermore, it is close to the values proposed by Filiatrault et al. (2003) for different types of timber shear walls (i.e., OSB, Stucco, and Gypsum).
In total, 35 different SDOF systems are examined and 35 × 80 = 2800 time history analyses are conducted. For each SDOF system, the median values of the maximum displacement ductility demands μmax from the 60 low to moderate seismicity records and the 20 high-seismicity records are calculated. The main difference between high seismicity and low to moderate seismicity records relates to the number of cycles the structure is exposed to (Mergos and Beyer, 2014).
Figure 5A compares the calculated maximum displacement ductility demands μmax with the analytical predictions μEC8 of the formula adopted in EC8 for correlating displacement ductility and q-factor. The correlations between μEC8 and μmax are summarized in Table 1. It shows that EC8 formula tends to overpredict μmax for the low to moderate seismicity regions and to underpredict maximum demands for the high-seismicity regions. When considering both seismicity levels as a single data set, the coefficient of determination R2 is 0.69, the mean μmax/μEC8 ratio is 1.06, the median 1.00, and the coefficient of variation 0.29.
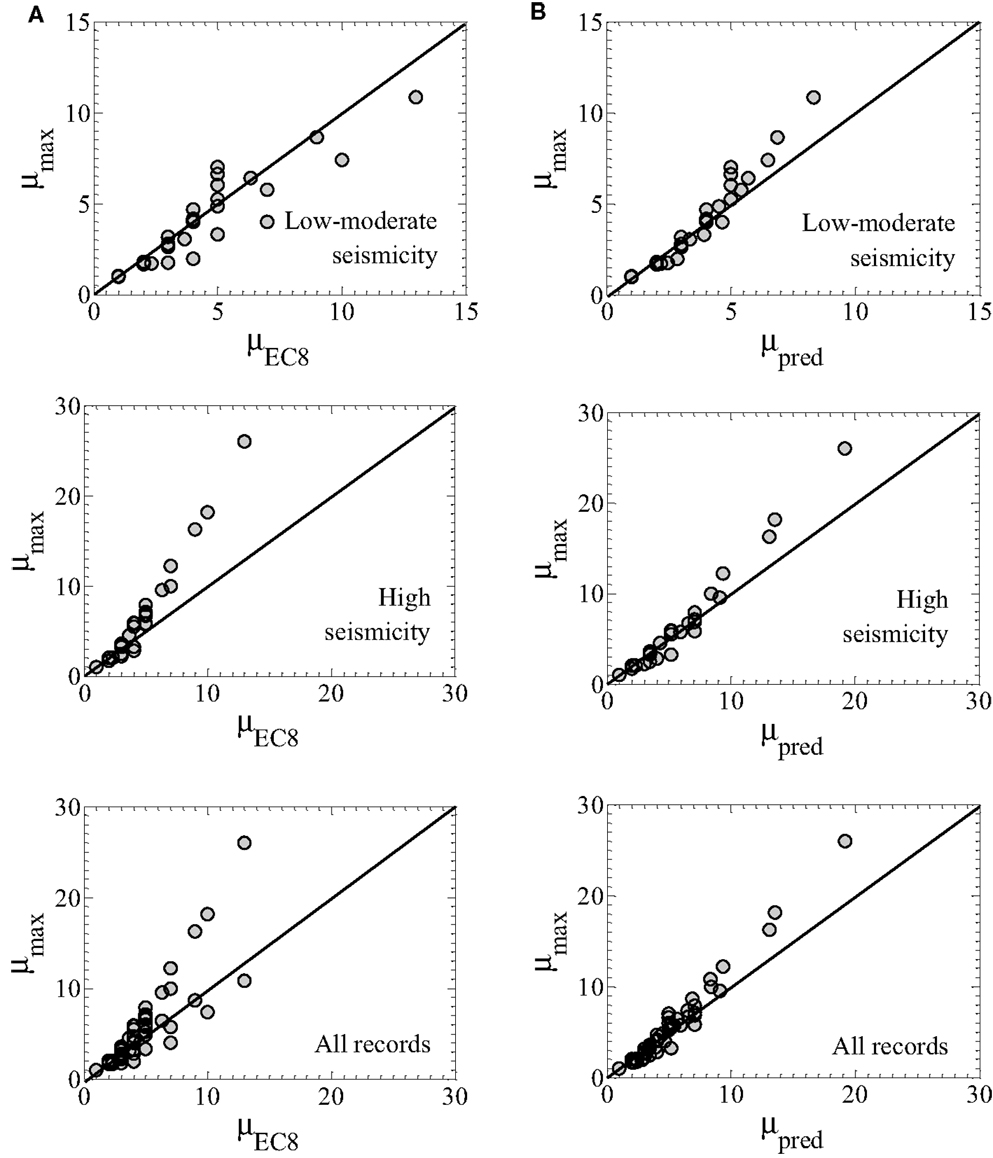
Figure 5. Correlation between calculated μmax and analytical predictions (A) by EC8 formula; (B) by proposed formulae.
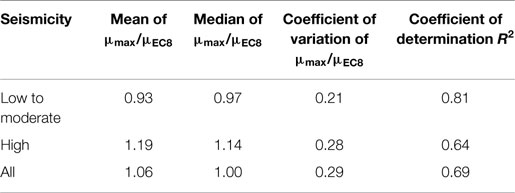
Table 1. Statistics of the calculated maximum ductility demands μmax versus analytical predictions μEC8 of EC8.
To improve the predictions of μmax, a new formula is proposed herein, which builds on the existing formula of EC8, but it is more general by the introduction of two empirical parameters, such as α and β. The general form of this equation is the following:
Equation 6 becomes EC8 formula for α = β = 1. Furthermore, Eq. 6 gives for q = 1 always μmax = 1. Furthermore, for T = TC both relationships (for T ≥ TC and T < TC) yield the same predictions. Hence, it is always a continuous equation as a function of T. Parameters, such as α and β, are evaluated in order to yield the best correlation of the analytical predictions μpred with the calculated maximum demands μmax.
In the very short-period range (0 ≤ T ≤ TB), and in order to assure smooth inelastic spectra for all structural periods, it is proposed that parameter β is replaced by βs given by:
Table 2 summarizes the proposed parameters values as well as the correlations between μpred and μmax. In addition, Figure 5B illustrates the correlations between the predictions of the proposed formula and μmax for the case of low to moderate seismicity, the case of high seismicity and for both levels of seismicity. For all records, Figure 5B shows the predictions of the combination of equations proposed for the two different seismicity levels and not the prediction of the equation developed when considering records from both seismicity levels as a single data set.
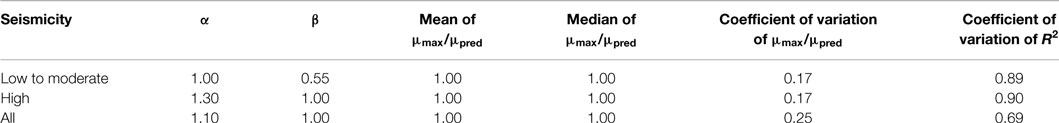
Table 2. Parameter values and statistics of calculated maximum ductility demands μmax versus analytical predictions μpred of the proposed equation.
The proposed formulae yields always better results than the EC8 formula. The mean and median ratios μmax/μpred are equal to unity. The formulae dealing with either the low to moderate seismicity level or the high-seismicity level provide better coefficients of variation (0.17 instead of 0.25) and coefficients of determination (0.89 and 0.90 instead of 0.69) than the formula involving ground motion records for both seismicity levels. This clearly advocates the adoption of different formulas for correlating μmax and q for low to moderate and high-seismicity regions in the case of wood-frame buildings.
Validation of the N2 Method Against Experimental Results for Wood-Frame Buildings
To the best of the authors’ knowledge, the N2 method has not yet been validated against experimental results of wood-frame buildings. To investigate the validity of the method, the N2 method is applied to the assessment of the seismic behavior of a timber shear wall tested on a seismic table by Durham (1998). The dimensions of the wall were 2.4 m × 2.4 m. Studs were placed at every 400 mm. Sheathing panels were 9.5 mm thick oriented strand boards with 1.5 GPa elastic shear modulus. Three panels were used to sheath the panel. Sheathing to framing connectors were 50 mm long-spiral nails.
The applied vertical load on the wall was 50 kN and the specimen was subjected to the E–W component of the 1992 California Earthquake as recorded at Joshua Tree station. The ground motion was scaled to have a peak ground acceleration of 0.36 g. The displacement time history at the top of the specimen was recorded and the maximum displacement was found to be approximately 60 mm.
Using the computer software CASHEW, Folz and Filiatrault(2000, 2001) found that the monotonic force F–displacement d response of the timber wall can be approximated by the “actual” envelope curve that is shown in Figure 6A. The part of the curve up to 20% loss of maximum strength is only examined herein.
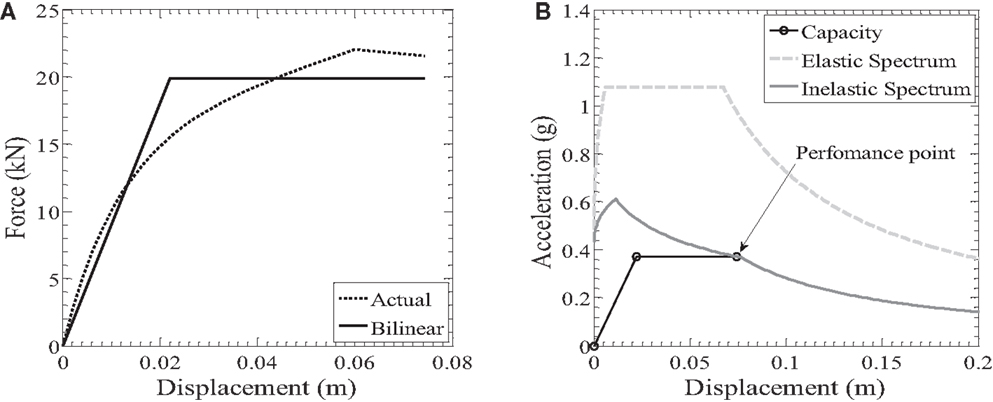
Figure 6. Application of the N2 method to the seismic assessment of the timber shear wall test specimen tested by Durham (1998): (A) monotonic force–displacement response of the wall; (B) determination of the performance point.
For the representation of seismic demand, the elastic acceleration response spectrum of EC8-Part 1 (Type 1) is adopted with PGA = 0.36 g and soil type B (soil factor 1.2). This soil type is chosen because the average shear wave velocity Vs,30 of the site where the accelerogram was recorded is approximately 380 m/s.
Figure 6 presents the application of the N2 method to the seismic assessment of the timber wall. Figure 6A shows the actual and equivalent bilinear curves up to the calculated performance point. The bilinear curve is derived by assuming that the elastic branch passes through the point of the actual curve with an ordinate equal to 0.6 Fy and that the areas beneath the actual and bilinear curve are the same. The same procedure is adopted in FEMA-273 (1997) and by Fajfar (2000).
It is important to mention here that the methodology adopted for the derivation of the bilinear envelope curve may affect significantly the accuracy of the results. Hence, it is generally recommended that the methodology for deriving the idealized bilinear curves is calibrated against experimental results of timber shear walls. Alternatively, different approaches can be applied and the most conservative results should be adopted.
Figure 6B illustrates the determination of the performance point of the structure as the intersection of the inelastic response spectrum and the capacity curve in the ADRS format. For the determination of the inelastic spectrum, Eq. 6 was applied. The predictions of the N2 method are the following: yield displacement dy = 22 mm, elastic period T = 0.49 s, displacement ductility demand μΔ = 3.40, and maximum developed displacement 74 mm. The estimated maximum displacement is 23% higher than the actual one developed during the experimental procedure (60 mm). Furthermore, it is on the side of safety since the predicted displacement is larger than the one measured in the experiment. This occurs because the behavior factor is slightly underestimated for the actual ductility demand. Lower q values drive to higher required design strengths. It is worth pointing out that application of EC8 q–μΔ relationships leads to 66 mm maximum displacement prediction, which is only 10% higher than the actual displacement demand. However, overall, the new q–μΔ relationships provide better estimations of maximum displacements and ductilities as shown in Figure 5.
Displacement-Based Design with the N2 Method
Method Description
In this section, a displacement-based seismic design methodology for wood-frame buildings is proposed with the aid of the N2 method. The procedure is displacement driven since it starts with a target displacement that the structure is allowed to develop for a given level of seismicity and calculates the required strength of the wood-frame building. In particular, the design aims at determining the required nailing patterns of the wood-frame building timber walls. The procedure assumes that other structural components of timber walls like the hold-down or tie-down systems are properly designed. Furthermore, the methodology is only valid for symmetric single-storey wood-frame buildings that can be sufficiently represented by SDOF systems.
The analytical steps of the proposed methodology are the following.
Step 1
For the force capacity and start the sentence directly with: the structural configuration of timber walls apart from the nailing pattern (i.e., dimensions of walls, thickness of sheathing panels) is determined. The seismic demand is represented by an elastic pseudo-acceleration response spectrum (Figure 1). The target displacement dt is established by the performance level of the building (EC8-Part 3, FEMA-273).
Step 2
The main aim of this step is to determine the yield displacement dy of the equivalent bilinear force F–displacement d response of the SDOF system. Conveniently, determination of dy can be done by using simplifying expressions as the case for other structural types (i.e., reinforced concrete buildings). However, to the best of the authors’ knowledge, these relationships do not yet exist for timber shear walls and consequently for wood-frame buildings.
Wang et al. (2010) conducted pushover analyses, using the computer software CASHEW (Folz and Filiatrault, 2000) of timber shear walls with the same structural configuration, but different nailing spacings. After normalizing the backbone curves of the walls Fi–di by the maximum force Fui, they observed that a single normalized (average) backbone curve Fi/Fui versus displacement di can be assumed for all nailing spacings with adequate accuracy (see next section).
Making use of this observation, it is suggested herein that for each timber shear wall structural configuration, a pushover analysis is conducted by assuming a nailing spacing. The obtained Fi–di is then normalized with respect to maximum strength Fui. More accurately, pushover analyses for different nailing spacings are conducted and normalized and then an average normalized Fi/Fui–di is obtained. This normalized backbone curve is assumed as representative of all nailing spacings. Hence, it is assumed that nailing spacing affects only the maximum shear wall strength Fui.
For the case that the walls are deformed in pure racking mode (without uplift) and consequently they undergo the same lateral top displacement the force capacity of the wood-frame building can be taken as the sum of the timber shear walls force capacities for the same displacement level. Hence, if the building comprises walls with the same structural configuration, the normalized force F/Fu–d displacement relationship of the building is the same as the normalized backbone curves of the single walls. If the building is composed of different shear walls then the normalized force F/Fu–d displacement of the building should be obtained by dividing the total force F–d displacement relationship of the building by the force capacity of the building Fu.
After establishing, the normalized force F/Fu–d displacement relationship of the building an equivalent normalized elastoplastic bilinear curve is established with yield point (Fy/Fu, dy). It is important to note that no iterations are required for the determination of the equivalent normalized bilinear curve. This is the case because the displacement of the final point of the equivalent bilinear curve (Fy/Fu, dm) (Figure 2) is constant and equal to dt.
Step 3
Here, the elastic and inelastic ADRS are computed. First, the elastic ADRS is defined and then by calculating target displacement ductility μΔ = dt/dy and using Eqs 2, 3, and 6 the inelastic ADRS is established.
Step 4
From the target displacement dt and the inelastic spectrum, the required strength Fyt/m is obtained (Figure 7). Hence, required yield Fyt and ultimate strength Fut are directly calculated.
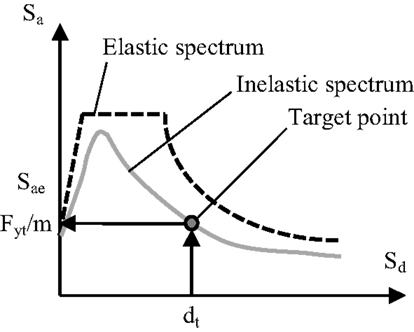
Figure 7. Determination of required strength Fyt/m for a given target displacement dt with the N2 method.
Step 5
A nailing spacing is selected yielding strength capacity Fu for the building higher than Fut.
Case Study
Introduction
Wang et al. (2010) examined the monotonic Fi–di relationship of timber shear walls with the following structural characteristics: 1.2 m width B and 3.1 m height H, sheathing panels attached to the framing members vertically with 11.1 mm thick OSB attached with dn = 3.3 mm diameter (8 dn length) nails. Interior nail spacing is 305 mm. Four different cases of constant edge (perimeter) nail spacing were examined: 51, 76, 102, or 152 mm. The obtained Fi–di relationships are shown in Figure 8A. As mentioned in the previous section, Wang et al. (2010) observed that when normalizing with respect to Fui a single (average) backbone curve can be applied for all the different values of edge nail spacing (Figure 8B). Furthermore, it was found that the ultimate strength Fui is equal to 32.4, 22.3, 17.1, and 11.5 kN for 51, 76, 102, and 152 mm edge nail spacing, respectively. The displacement dui (corresponding approximately to 20% loss of maximum strength) is 0.124 m (4% drift).
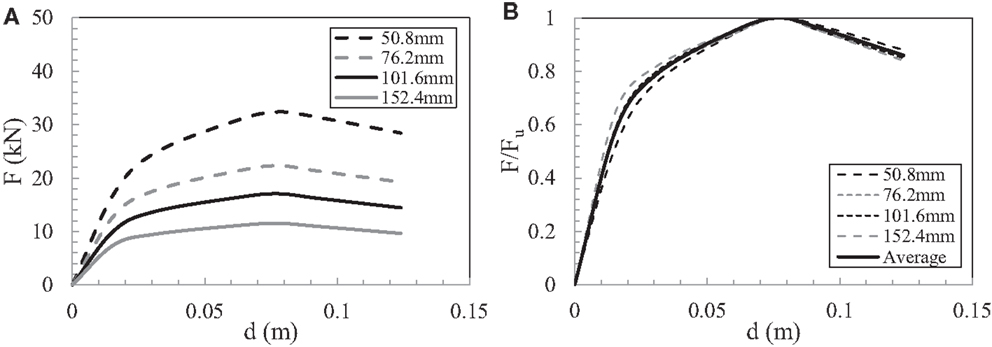
Figure 8. Backbone curves of timber shear wall with different nailing patterns (Wang et al., 2010) (A) force F–displacement d (B) normalized force F/Fu–displacement d.
As a design example in this section, it is assumed that a symmetric in plan single-storey wood-frame building (Figure 9) is composed by eight of these shear walls in each direction. It is also assumed that the walls are deformed in pure racking mode (without uplift) and consequently they undergo the same lateral top displacement and their force capacities can be added.
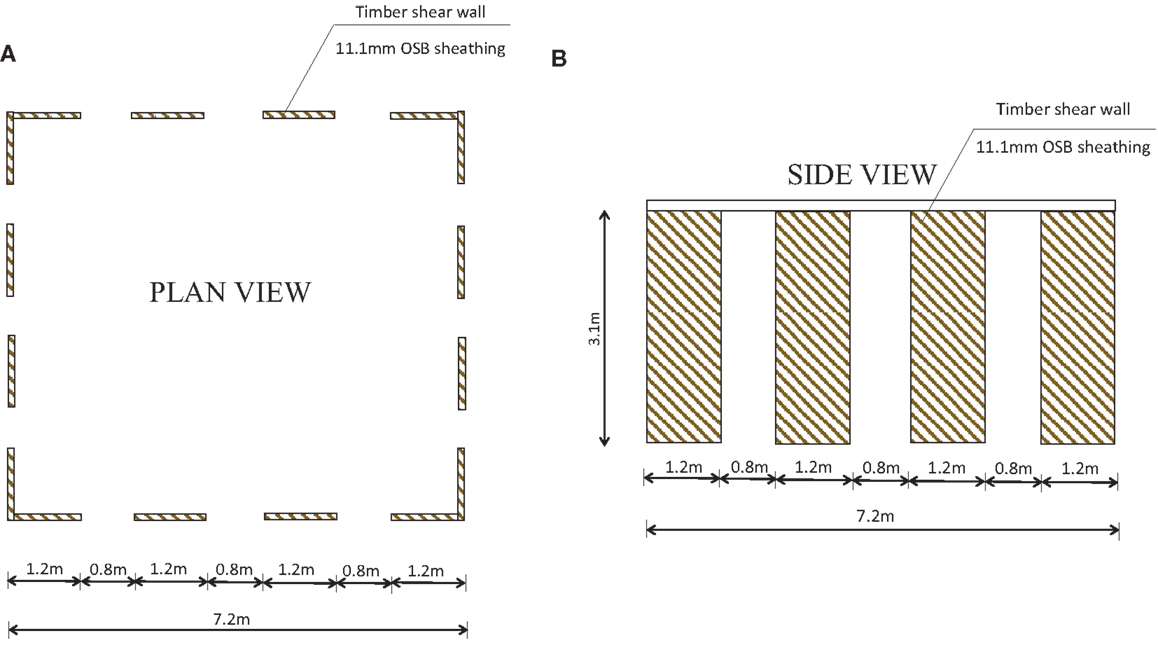
Figure 9. Single-storey wood-frame building case study: (A) plan view; (B) side view.
The seismic mass of the building is m = 90 ton and the design PGA for the 10/50 seismic hazard level is equal to 0.16 g. The building is constructed on soil type C according to the categorization of EC8. The building will be designed to comply with the performance objectives of Table 3. The design aims at determining the appropriate edge nailing spacing for the construction of the walls.
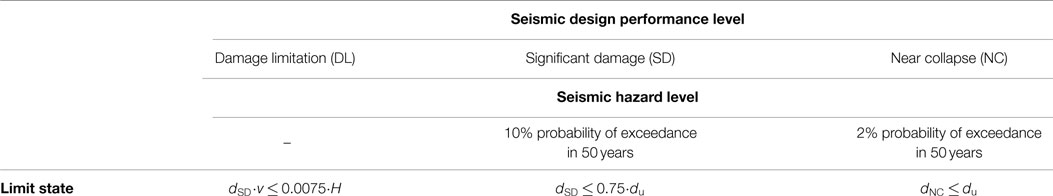
Table 3. Performance objectives for seismic design of case-study wood-frame building.
Design Objectives
The adopted performance levels are similar to the ones used in EC8-Part 3 (CEN, 2005) for other types of structures (i.e., reinforced concrete, steel) apart from the damage limitation (DL) limit state, which is taken herein to coincide with the provisions of EC8-Part 1 for buildings having ductile non-structural elements. For these non-structural elements, the interstorey drift is limited to 0.75% (Table 3). The target displacement for the near collapse (NC) limit state du is taken equal to the displacement corresponding to 20% loss of maximum strength of a single timber shear wall dui = 0.124 m (4% drift). The target displacement at the SD limit state is taken equal to 0.75⋅du = 0.093 m (3% drift).
The seismic hazard levels for the significant damage (SD) and near collapse (NC) limit states are taken in accordance with the recommendations of EC8-Part 1. The DL limit state is checked indirectly by the multiplication of the target normalized drift dSD for the SD limit state by the reduction factor ν = 0.5 for importance classes I and II, which accounts for the lower return period of the seismic action associated with this performance level following the approach of EC8-Part 1.
As mentioned previously, the design drifts are approximately dNC = 4% for the NC limit state and dSD = 0.75⋅4 = 3% for the SD limit state. However, in order for the DL design objective to be achieved, the following should hold:
Consequently, the design should be performed for the following drift limits: dNC = 4% (0.124 m displacement) for the 2/50 (2% is probability of exceedance in 50 years) seismic hazard level, and dSD = 1.5% (0.046m displacement) for the 10/50 (10% is probability of exceedance in 50 years) hazard level.
In order to define the design PGA value for the NC limit state (2/50 seismic hazard level), the following equation, proposed in EC8-Part 1, is used:
where ag,NC is the design PGA for the NC limit state, ag,SD is the design PGA for the SD limit state, PSD = 10% is probability of exceedance in 50 years for the SD limit state, and PNC = 2% is probability of exceedance in 50 years for the NC limit state.
Bilinearization of Normalized Force–Displacement Relationship
The second step for the seismic design with the proposed N2 method is the bilinearization of the normalized force–displacement envelopes (Figure 10). It is pointed out that since the building is composed by identical timber shear walls the normalized F/Fu–d behavior of the building matches the Fi/Fu–di of the single walls.
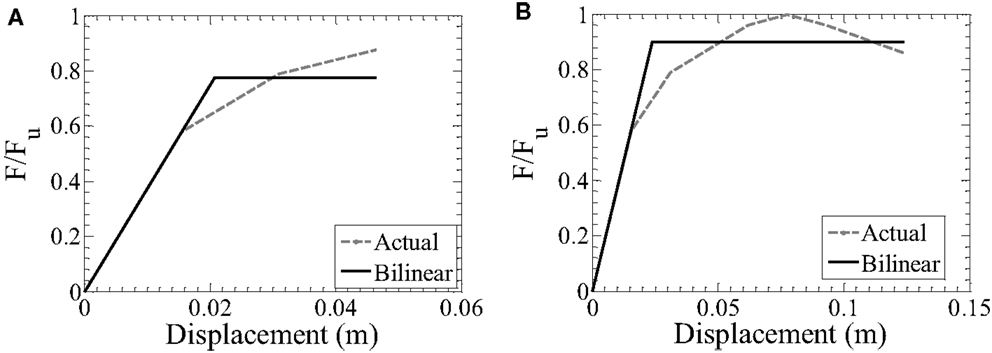
Figure 10. Bilinearization of normalized F/Fu–d relationships for the (A) SD limit state; (B) NC limit state.
The 0.6 Fy rule for the bilinearization of the F/Fu–d curve is used as described in the validation of N2 method section. The target displacements are set equal to the design displacements for each performance level. Hence, an iterative procedure is not required for the bilinearizations.
Figure 10 presents the equivalent bilinear elastoplastic curves obtained for the two different limit states. Furthermore, Table 4 presents the characteristic values of the equivalent bilinear curves as well as the respective displacement ductility demands μΔ.
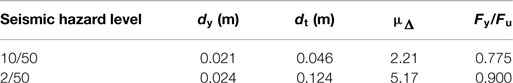
Table 4. Characteristic values of equivalent bilinear F/Fu–d curves and displacement ductility demands for the two design seismic hazard levels.
Inelastic Displacement Spectra
The next step of the design procedure involves the derivation of the elastic and then the inelastic displacement spectra in ADRS format for the displacement ductility demands of the equivalent bilinear curves (Figure 11). For the derivation of the inelastic ADRS spectra, the new q–μΔ equations proposed in this study (Eqs 6 and 7) have been applied.
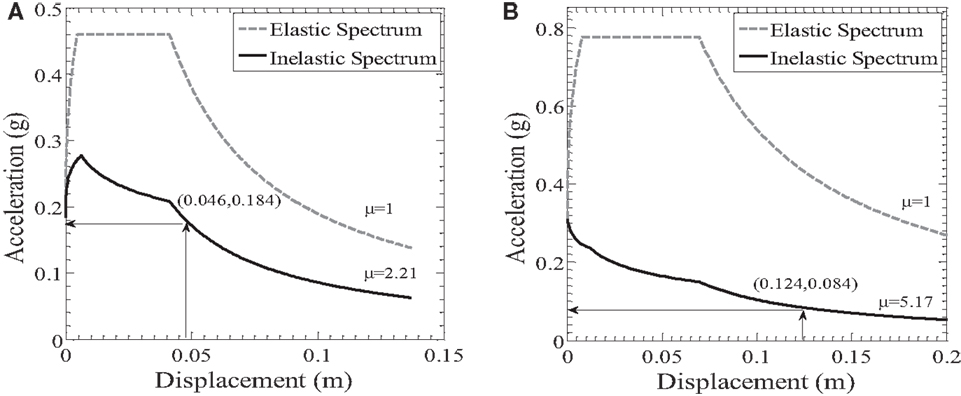
Figure 11. Determination of required Fyt/m strengths for the (A) 10/50 seismic hazard level and (B) 2/50 seismic hazard level.
Calculation of Required Strength
From the inelastic ADRS spectra and the target displacements, the required Fyt/m strengths can readily be obtained as shown in Figure 11. In this figure, it can be seen that the Fyt/m for the 10/50 seismic hazard level is 0.184 g and for the 2/50 seismic hazard level is 0.084 g. Hence, the 10/50 seismic hazard level (for DL limit state) governs the seismic design of this wood-frame building.
The design base shear for the wood-frame building is calculated as
This base shear will be carried by the eight shear walls. If Futi is the required maximum strength capacity of each of these walls then it becomes
In the previous equation, the factor 0.775 is taken from the equivalent bilinear curve for the critical 10/50 seismic hazard level (see Table 4).
Selection of Nailing Pattern
To complete the seismic design, the edge nail spacing that yields ultimate strength Fui for each timber shear wall higher than 26.2 kN should be selected. According to the analyses of Wang et al. (2010), the required ultimate strength Futi lies between the strengths provided by 50.8 mm edge nail spacing and 76.2 mm edge nail spacing. Hence, 50.8 mm edge nail spacing should be assigned for undertaking the design base shear with safety.
Discussion
Traditional seismic design of wood-frame buildings is force based. However, force-based seismic design does not directly control structural and non-structural damage, which are deformation and/or displacement related. Hence, displacement-based design is a more rational design approach.
Earlier displacement-based design efforts focused on the DDBD approach. Despite the fact that this method has shown to produce promising results for wood structures, it does not fit into the framework of the Eurocode 8 (EC8) provisions, which use as non-linear static assessment method the N2 method.
This study investigates the application of the N2 method to the seismic design of wood-frame buildings. The N2 method requires proper behavior factor q versus displacement ductility μΔ relationships for the derivation of the inelastic spectra, which do not exist for hysteretic systems representative of wood-frame buildings.
To tackle this limitation, new q–μΔ relationships are proposed herein based on numerous inelastic time history analyses of SDOF systems representative of wood-frame buildings. The new formulae can be considered as extensions of the q–μΔ relationships proposed by Vidic et al. (1994). It is found that different formulae should be applied for regions of low to moderate seismicity and for regions of high seismicity since the hysteretic response of wood-frame systems depends strongly on the number of cycles the structure is exposed to (Mergos and Beyer, 2014).
Another limitation of the N2 method relative to its application to wood-frame buildings is the fact that it requires the definition of displacement ductility and subsequently of the yield displacement. The definition of yield displacement is ambiguous for wood-frame buildings that behave strongly non-linearly from the early stages of their lateral response. Hence, validation of the N2 method is required before its application to the seismic design of new buildings.
Since the N2 method has not yet been verified against experimental results of wood-frame buildings, a verification case study is examined herein for a single timber shear wall tested on a shake table. It is found that the method overestimates maximum displacement demand by 23%.
A new displacement-based seismic design methodology for symmetric, single-storey wood-frame buildings with the aid of the N2 method is also developed in this paper. The procedure is displacement driven since it starts with a target displacement the structure is allowed to develop for a given level of seismicity and calculates the required nailing spacing of timber shear walls. The procedure assumes that other structural components of timber walls like the hold-down or tie-down systems are properly designed and remain elastic.
The proposed design approach is applied to the design of a realistic wood-frame building. The design methodology is computationally efficient since it does not require an iterative procedure. Furthermore, it can be directly incorporated in the framework of performance-based design. However, in its present form, it is limited to SDOF systems. Hence, the extension of the method to multi-storey and/or asymmetric in plan wood-frame buildings that behave as MDOF systems is required.
Conflict of Interest Statement
The authors declare that the research was conducted in the absence of any commercial or financial relationships that could be construed as a potential conflict of interest.
Acknowledgments
The authors thank the reviewers for their comments that helped to improve the manuscript. Financial support for this research was provided by the Swiss National Science Foundation within project NRP-66 (Resource Wood, Project Nr. 406640-136900). The opinions, findings, and conclusions expressed in this paper are those of the authors and do not necessarily reflect those of the sponsoring organization.
References
CEN. (2004). Eurocode 8: Design of Structures for Earthquake Resistance, Part 1: General Rules, Seismic Actions and Rules for Buildings. Brussels: European Standard EN 1998-1.
CEN. (2005). Eurocode 8: Design of Structures for Earthquake Resistance, Part 3: Assessment and Retrofitting of Buildings. Brussels: European Standard EN 1998-3.
Durham, J. P. (1998). Seismic Response of Wood Shearwalls with Oversized Oriented Strand Board Panels. MSc Thesis, University of British Columbia, Vancouver, BC.
Fajfar, P. (1999). Capacity spectrum method based on inelastic demand spectra. Earthq. Eng. Struct. Dyn. 28, 979–993. doi: 10.1002/(SICI)1096-9845(199909)28:9<979::AID-EQE850>3.0.CO;2-1
Fajfar, P. (2000). A nonlinear analysis method for performance-based seismic design. Earthq. Spectra 16, 573–592. doi:10.1193/1.1586128
Fajfar, P., and Gaspersic, P. (1996). The N2 method for the seismic damage analysis of RC buildings. Earthq. Eng. Struct. Dyn. 25, 31–46. doi:10.1002/(SICI)1096-9845(199601)25:1<31::AID-EQE534>3.0.CO;2-V
Fardis, M. (2009). Seismic Design, Assessment and Retrofitting of Concrete Buildings. Dordrecht, NY: Springer.
FEMA-273. (1997). NEHRP Guidelines for the Seismic Rehabilitation of Buildings. Washington, DC: Federal Emergency Management Agency.
Filiatrault, A., and Folz, B. (2002). Performance-based seismic design of wood-framed buildings. ASCE J. Struct. Eng. 128, 39–47. doi:10.1155/2014/240952
Filiatrault, A., Isoda, H., and Folz, B. (2003). Hysteretic damping of wood framed buildings. Eng. Struct. 25, 461–471. doi:10.1016/S0141-0296(02)00187-6
Folz, B., and Filiatrault, A. (2000). CASHEW – Version 1.0: A Computer Program for Cyclic Analysis of Wood Shear Walls. Rep. No. SSRP-2000/10, Structural Systems Research Project. San Diego, CA: Dept. of Structural Engineering, Univ. of California.
Folz, B., and Filiatrault, A. (2001). Cyclic analysis of wood shear walls. ASCE J. Struct. Eng. 127, 433–441. doi:10.1061/(ASCE)0733-9445(2001)127:4(433)
Fragiacomo, M., Dujic, B., and Sustersic, I. (2011). Elastic and ductile design of multi-storey crosslam massive wooden buildings under seismic actions. Eng. Struct. 33, 3043–3053. doi:10.1016/j.engstruct.2011.05.020
Giardini, D., Wiemer, S., Fäh, D., and Deichmann, N. (2004). Seismic Hazard Assessment of Switzerland. Zurich: Swiss Seismological Service.
Krawinkler, H., Parisi, F., Ibarra, L., Ayoub, A., and Medina, R. (2001). Development of a Testing Protocol for Woodframe Structures. Richmond, CA: CUREE Publication No. W-02.
Mergos, P. E., and Beyer, K. (2014). Loading protocols for European regions of low to moderate seismicity. Bull. Earthq. Eng. 12, 2507–2530. doi:10.1007/s10518-014-9603-3
Pang, W., and Rosowsky, D. V. (2009). Direct displacement procedure for performance-based seismic design of mid-rise wood-framed structures. Earthq. Spectra 25, 583–605. doi:10.1193/1.3158932
Pang, W., Rosowsky, D. V., Pei, S., and Van de Lindt, J. W. (2010). Simplified direct displacement design of six-storey wood-framed building and pretest seismic performance assessment. ASCE J. Struct. Eng. 136, 813–825. doi:10.1061/(ASCE)ST.1943-541X.0000181
Priestley, M. J. N. (1993). Myths and fallacies in earthquake engineering – conflicts between design and reality. Bull. NZSEE 26, 329–341.
Priestley, M. J. N., Calvi, G. M., and Kowalsky, M. J. (2007). Direct Displacement-Based Seismic Design of Structures. Pavia: IUSS Press.
Priestley, M. J. N., and Kowalsky, M. J. (2000). Direct-displacement-based seismic design of concrete buildings. Bull. NZSEE 33, 421–444.
Shibata, A., and Sozen, M. (1976). Substitute structure method for seismic design in reinforced concrete. ASCE J. Struct. Eng. 102, 1–18.
Stewart, W. G. (1987). The Seismic Design of Plywood Sheathed Shear Walls. Ph.D. Thesis, University of Canterbury. Christchurch, New Zealand.
Sullivan, T., Calvi, G. M., Priestley, M. J. N., and Kowalsky, M. J. (2003). The limitations and performances of different displacement-based design methods. J. Earthq. Eng. 7, 201–241. doi:10.1142/S1363246903001012
van de Lindt, J. W., and Liu, H. (2006). “Correlation of observed damage and FEMA 356 drift limits: results from one-story wood-frame house shake table tests,” in Proc., 2006 Structures Congress (Reston, VA: ASCE).
Vidic, T., Fajfar, P., and Fischinger, M. (1994). Consistent inelastic design spectra: strength and displacement. Earthq. Eng. Struct. Dyn. 23, 502–521. doi:10.1002/eqe.4290230504
Keywords: performance, seismic, design, wood-frame, structures, N2
Citation: Mergos P and Beyer K (2015) Displacement-based seismic design of symmetric single-storey wood-frame buildings with the aid of N2 method. Front. Built Environ. 1:10. doi: 10.3389/fbuil.2015.00010
Received: 29 April 2015; Accepted: 02 July 2015;
Published: 16 July 2015
Edited by:
Solomon Tesfamariam, The University of British Columbia, CanadaReviewed by:
P. Rajeev, Swinburne University of Technology, AustraliaHossein Mostafaei, FM Global, USA
Copyright: © 2015 Mergos and Beyer. This is an open-access article distributed under the terms of the Creative Commons Attribution License (CC BY). The use, distribution or reproduction in other forums is permitted, provided the original author(s) or licensor are credited and that the original publication in this journal is cited, in accordance with accepted academic practice. No use, distribution or reproduction is permitted which does not comply with these terms.
*Correspondence: Panagiotis Mergos, Research Centre for Civil Engineering Structures, Department of Civil Engineering, City University London, Northampton Square, London EC1V 0HB, UK, panagiotis.mergos.1@city.ac.uk