Seismic performance evaluation framework considering maximum and residual inter-story drift ratios: application to non-code conforming reinforced concrete buildings in Victoria, BC, Canada
 Solomon Tesfamariam
 Katsuichiro Goda
- 1School of Engineering, The University of British Columbia, Kelowna, BC, Canada
- 2Department of Civil Engineering, University of Bristol, Bristol, UK
This paper presents a seismic performance evaluation framework using two engineering demand parameters, i.e., maximum and residual inter-story drift ratios, and with consideration of mainshock–aftershock (MSAS) earthquake sequences. The evaluation is undertaken within a performance-based earthquake engineering framework in which seismic demand limits are defined with respect to the earthquake return period. A set of 2-, 4-, 8-, and 12-story non-ductile reinforced concrete (RC) buildings, located in Victoria, BC, Canada, is considered as a case study. Using 50 mainshock and MSAS earthquake records (2 horizontal components per record), incremental dynamic analysis is performed, and the joint probability distribution of maximum and residual inter-story drift ratios is modeled using a novel copula technique. The results are assessed both for collapse and non-collapse limit states. From the results, it can be shown that the collapse assessment of 4- to 12-story buildings is not sensitive to the consideration of MSAS seismic input, whereas for the 2-story building, a 13% difference in the median collapse capacity is caused by the MSAS. For unconditional probability of unsatisfactory seismic performance, which accounts for both collapse and non-collapse limit states, the life safety performance objective is achieved, but it fails to satisfy the collapse prevention performance objective. The results highlight the need for the consideration of seismic retrofitting for the non-ductile RC structures.
Introduction
Motivation
The eastern and western provinces of Canada are subject to moderate to large magnitude earthquakes. As a result, Canadian buildings are prone to earthquake-induced damage (Bruneau and Lamontagne, 1994; Ventura et al., 2005). Since 1900, several destructive earthquakes have been reported (Table 1; Figure 1), including the 1918 and 1946 earthquakes in Vancouver Island and the 1949, 1965, and 2001 (Nisqually) deep earthquakes in Washington, DC, USA. The recurrence of the Cascadia subduction earthquakes (magnitudes of 8–9) can affect a vast region of the Pacific coast from Vancouver Island to Washington/Oregon (Hyndman and Rogers, 2010). For large interface events, intense long-period ground motions having long duration are anticipated. To assess seismic performance of structures and infrastructure more accurately, a novel seismic performance evaluation framework that accounts for probabilistic characteristics of multivariate engineering demand parameters caused by major earthquake ground motions as well as their aftershock ground motions is proposed. The developed methodology is applied to a set of non-ductile reinforced concrete (RC) structures that are located in Victoria, British Columbia (BC), Canada. In the framework, regional seismicity in southwestern BC is fully taken into account in defining seismic performance levels and in evaluating the non-linear structural responses via rigorous ground motion record selection.
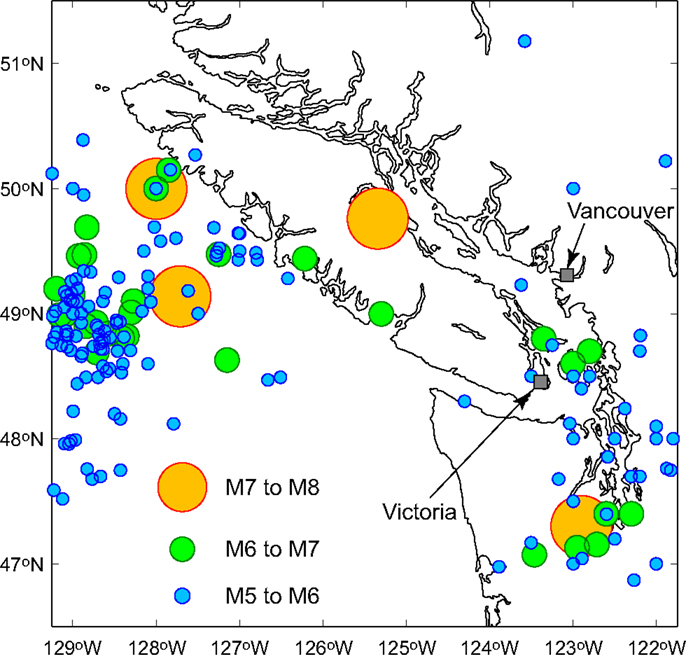
Figure 1. Regional seismicity in southwestern British Columbia, Canada.
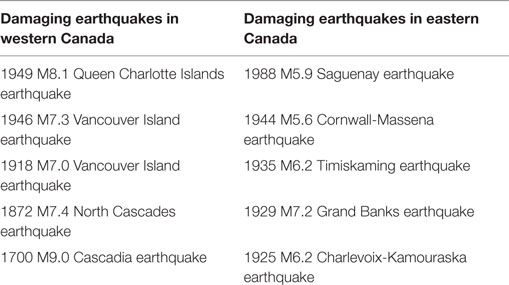
Table 1. Damaging earthquakes in eastern and western Canada.
Through lessons learned from performance of buildings during previous earthquakes and research over the last three decades, Canadian seismic design provisions have evolved (Mitchell et al., 2010). The first attempt for seismic hazard quantification in Japan and North America followed the 1923 Kanto (Tokyo) earthquake and the 1933 Long Beach (California) earthquake (Atkinson, 2004; Otani, 2004). Subsequently, the first edition of the National Building Code of Canada (NBCC) was published in 1941 (NRCC, 1941) and adopted provisions for seismic design based on the 1935 Uniform Building Code (UBC) in an appendix. Initially, the earthquake hazard quantification was introduced through seismic coefficients. Later, the provisions were incorporated into the main text of the 1953 NBCC and Canadian seismic zoning map was introduced. However, the seismic zones were introduced on a qualitative evaluation of hazard (Atkinson, 2004). The 1965 NBCC adopted the first seismic modification factor, as the construction factor, in the calculation of the minimum seismic base shear (NRCC, 1965). In late 1960s, the probabilistic quantification of seismic hazard has gained popularity. In 1970, the seismic code was changed to include the structural flexibility factor in addition to the construction factor (NRCC, 1970). To date, although the state of knowledge has improved, the same methods are still used in modern design codes; for engineering design purposes, these hazard factors in the newer code have been calibrated to a previous version (Atkinson, 2004). In the 1985, 1990, and 1995 NBCC, zonal velocity ratios (which have only four categories) are used to define seismic design loads at building locations, whereas since the 2005 NBCC, uniform hazard spectrum (UHS) is introduced to provide more site-specific seismic hazard values for calculating seismic design loads for buildings.
In BC, seismic provisions of the NBCC were not adopted by municipalities until 1973 (Ventura et al., 2005). Therefore, most of the pre-1970 buildings constructed in BC may have limited seismic capacity against severe earthquake forces (Onur et al., 2005). The cause–effect relationships of earthquake-induced damage on buildings designed without seismic capacity methods are summarized in Table 2. Most of these older buildings are currently operational and are required to be further assessed and upgraded to improve life safety (LS) and to mitigate potential economic consequences due to seismic damage.
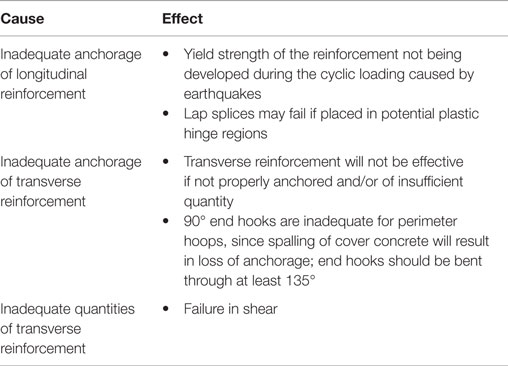
Table 2. Cause–effect relationships for buildings designed without seismic capacity methods (Liel and Deierlein, 2008; Tesfamariam and Saatcioglu, 2008).
In Canada, different building vulnerability assessment techniques have been proposed with different levels of complexity, ranging from a simple scoring to more detailed methods of non-linear structural analyses. The Institute for Research in Construction (IRC) of the National Research Council has developed a national seismic screening manual for buildings and different performance modifiers are taken into consideration (Rainer, 1992; Foo and Davenport, 2003). The methodology of the IRC manual follows the 1988 FEMA-154 screening guidelines (ATC, 2002). This seismic screening manual computes the seismic priority index (SPI), which is obtained as a summation of two indices, structural index (SI) and non-structural index (NSI). Saatcioglu et al. (2013) have updated the manual in accordance with the 2005 NBCC. Ventura et al. (2005) has developed building classification and fragility curves for southwestern BC to estimate the probability of damage at a given seismic intensity. The method was used for regional damage estimation and is not intended for individual buildings.
Performance-Based Seismic Evaluation of Buildings
Cornell and Krawinkler (2000) proposed a rational means of integrating the probabilistic performance-based earthquake engineering for seismic design and risk assessment. The analytical procedure probabilistically integrates seismic hazard analysis, structural analysis, damage assessment, and loss estimation. Performance-based design philosophy is adopted in the 2005 Canadian seismic design code (DeVall, 2003) following Structural Engineers Association of California (SEACO) Vision 2000 (SEAOC, 1995). The maximum inter-story drift ratio (MaxISDR) is used in Canadian and most building codes as the only performance metric. Relationships between different earthquake return periods and acceptable performance limit states in terms of MaxISDR are shown in Table 3. It can be highlighted that for frequent [50% probability of exceedance (PE) in 30 years], occasional (50% PE in 50 years), rare (10% PE in 50 years), and very rare (2% PE in 50 years) earthquake levels, the corresponding design performance limit states are immediate occupancy (IO), damage control (DC), LS, and collapse prevention (CP), respectively. Descriptions of the limit states are summarized in Table 4. In the Canadian code, the limit states for IO, DC, LS, and CP, in terms of MaxISDR are 0.2, 0.4, 1, and 2.5%, respectively. These limit state values are lower than values suggested in FEMA P-58-1 (2012). In this paper, limit state values similar to FEMA P-58-1 (2012) will be used.
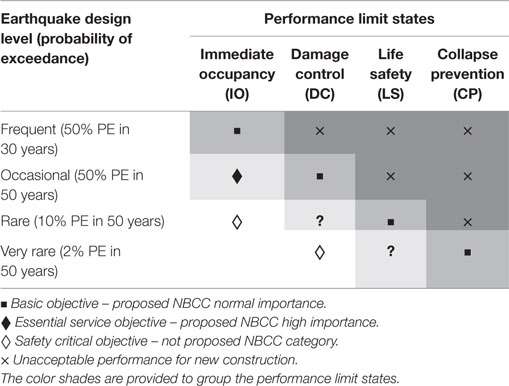
Table 3. Vision 2000 recommended seismic performance objectives for buildings (SEAOC, 1995).
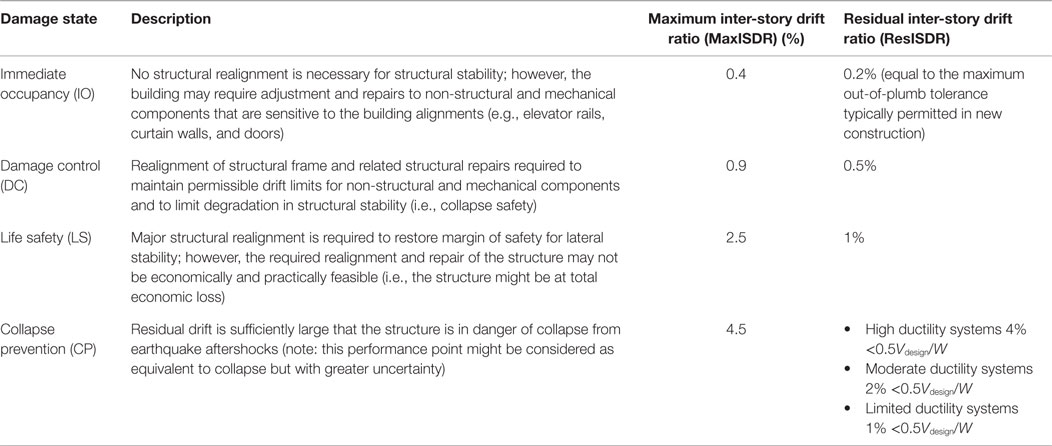
Table 4. Limit states for maximum and residual inter-story drift ratios (FEMA 356, 2000; FEMA P-58-1, 2012).
Consideration of Maximum and Residual Drift Ratios in Seismic Risk Assessment of Structures
The seismic performance of a structure is often evaluated through MaxISDR. Recent post-earthquake functionality assessment of structures has highlighted that residual inter-story drift ratio (ResISDR) is an important factor in the post-earthquake safety of a building and economic feasibility of repair and reconstruction (Kawashima et al., 1998; Ruiz-García and Miranda, 2006; Ramirez and Miranda, 2009; FEMA P-58-1, 2012). MacRae and Kawashima (1997) and Kawashima et al. (1998) implemented the first time risk assessment of bridges based on residual drift. Table 4 summarizes the limits of MaxISDR and ResISDR for IO, DC, LS, and CP based on FEMA 356 (2000) and FEMA P-58-1 (2012). The ResISDR limits for CP are expressed in terms of the design shear force Vdesign normalized by the building weight W to consider cases where P-delta might be dominant at smaller drift ratios.
Christopoulos et al. (2003) and Pampanin et al. (2003) studied the effect of residual drift on single-degree-of-freedom (SDOF) and multi-degree-of-freedom (MDOF) systems, respectively. Christopoulos et al. (2003) proposed an assessment criterion as a weighted sum of structural and non-structural residual drifts. Pampanin et al. (2003) further extended this formulation into a MDOF system and proposed a seismic performance evaluation framework based on a MaxISDR–ResISDR matrix. In the absence of extensive data and information, in FEMA P-58-1 (2012), a simple relation between MaxISDR and ResISDR was provided for the four limit states. Erochko et al. (2011) have proposed a mechanistic equation to estimate residual drifts as a function of expected peak drift and elastic recoverable drift. For post-earthquake risk assessment of buildings, the residual drift can be easily measured, and as a result, the maximum drift is typically estimated as a function of residual drift (Hatzigeorgiou and Beskos, 2009; Erochko et al., 2011; Hatzigeorgiou et al., 2011; Christidis et al., 2013). Reported equations that relate MaxISDR and ResISDR are summarized in Table 5.
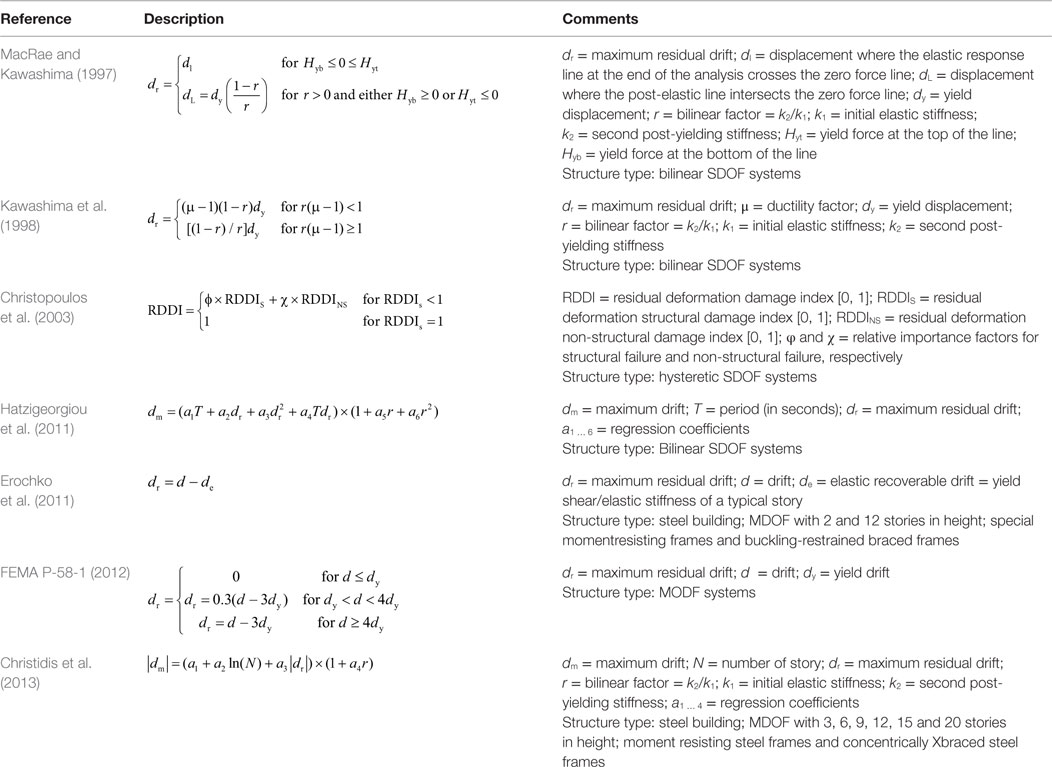
Table 5. Equations to relate residual and maximum inter-story drift ratios.
In the seismic performance assessment, the values for MaxISDR and ResISDR are subject to significant uncertainty and are dependent on each other. Uma et al. (2010) extended the performance-based seismic assessment framework by Pampanin et al. (2003) by taking into account the joint occurrence of MaxISDR and ResISDR of a SDOF system (modeled by a bivariate lognormal probability function). On the other hand, Goda and Tesfamariam (2015) have shown that MaxISDR and ResISDR of a MDOF system are statistically dependent, and that their marginal distributions can be represented by the Frechet and generalized Pareto distributions, respectively, whereas their dependence can be characterized by different copulas (e.g., normal, t, Gumbel, Frank, Clayton, and asymmetrical Gumbel). Tesfamariam and Goda (2015) further developed the copula-based multivariate seismic demand model and applied it to seismic loss assessment of a non-code conforming RC building with consideration of mainshock–aftershock (MSAS) earthquake records.
Mainshock–Aftershock Earthquakes on RC Buildings
The 2011 Mw6.3 Christchurch earthquake in New Zealand (Elwood, 2013; Leite et al., 2013) and the 2011 Mw9.0 Tohoku earthquake in Japan (Goda et al., 2013, 2015) have highlighted vulnerability of buildings subject to MSAS earthquake sequences. There are an increasing number of studies on vulnerability assessment of RC buildings subject to MSAS sequences. Ryu et al. (2011) presented a methodology for developing fragilities for mainshock-damaged SDOF buildings by performing incremental dynamic analysis (IDA, Vamvatsikos and Cornell, 2002) with aftershock ground motions. The aftershock fragilities are computed conditional on the damage caused by the mainshock (MS) earthquake. Their analyses showed that the effect of aftershocks is not significant. Hatzigeorgiou and Liolios (2010) quantified vulnerability of non-code and code conforming RC frames with prevalent irregularity. The MSAS sequences were obtained from actual MSAS records and 40 artificial seismic sequences. They concluded that aftershocks have significant impact on drift demand of the non-code conforming and irregular buildings. Tesfamariam et al. (2015) investigated MSAS earthquakes on non-code conforming RC frames with vertical irregularity. A set of 50 MSAS earthquake sequences was selected for Vancouver with consideration of regional seismic hazard. For the irregular structures, the MSAS sequences caused higher drift values than MS records only. Tesfamariam and Goda (2015) investigated the effect of MSAS earthquake sequences on a 4-story non-code conforming RC building. Their results showed that the MSAS earthquake had no marked effect on collapse and loss assessment of the RC building. This study, with the consideration of seismicity in Victoria, BC, extends the 4-story RC building investigated in Tesfamariam and Goda (2015) to 2-, 8-, and 12-story RC buildings. The building vulnerability assessment is further undertaken for collapse and non-collapse damage limit states.
Research Objective and Methodology
The objective of this paper is to carry out probabilistic building vulnerability assessment with consideration of regional probabilistic seismic hazard. The novel aspects of the proposed building vulnerability assessment are as follows:
i. Consideration of non-code conforming RC buildings having different story numbers, i.e., 2-, 4-, 8-, and 12-story, extending the work by Tesfamariam and Goda (2015) for the 4-story RC building;
ii. Consideration of three earthquake sources, i.e., crustal, inslab, and interface to reflect regional seismicity of southwestern BC in record selection (i.e., subduction environments and extensive ground motion datasets for the 2011 Tohoku earthquake records, which can be regarded as closest proxy for the Cascadia subduction events);
iii. Consideration of MSAS sequences as seismic excitation;
iv. Multivariate seismic demand modeling, MaxISDR and ResISDR, for seismic performance evaluation; and
v. Consideration of collapse and non-collapse limit states in the form of a bivariate seismic performance matrix.
Figure 2 illustrates a methodology for probabilistic building vulnerability assessment. It consists of five basic steps:
• Step 1: finite-element (FE) models of the 2-, 4-, 8-, and 12-story RC buildings are prepared to consider non-linear behavior of structural components and assembly. Modal analysis is performed to identify the three dominant fundamental periods (T1, T2, and T3).
• Step 2: a suite of ground motions which corresponds to a target seismic hazard level is selected on the basis of T1 by reflecting detailed characteristics of regional seismic hazard. Multiple conditional mean spectra (CMS) for different earthquake types are employed as target response spectra (Baker, 2011; Goda and Atkinson, 2011). Each ground motion consists of a MS record and a MSAS sequence.
• Step 3: a set of RC frames are analyzed through IDA to collapse limit states for the suite of MS records and MSAS sequences, and the performance parameters MaxISDR and ResISDR are recorded for each motion. The collapse fragilities are evaluated using the IDA results.
• Step 4: from non-collapsed results, marginal probability distributions of MaxISDR and ResISDR are derived, and corresponding dependency is characterized using copulas.
• Step 5: the performance matrix (Table 3) and limit states (Table 4) are used to carry out seismic performance evaluation. From the seismic performance evaluation, the probability unsatisfactory seismic performance with regard to the specified limit state criteria is derived for the MS and MSAS earthquake records.
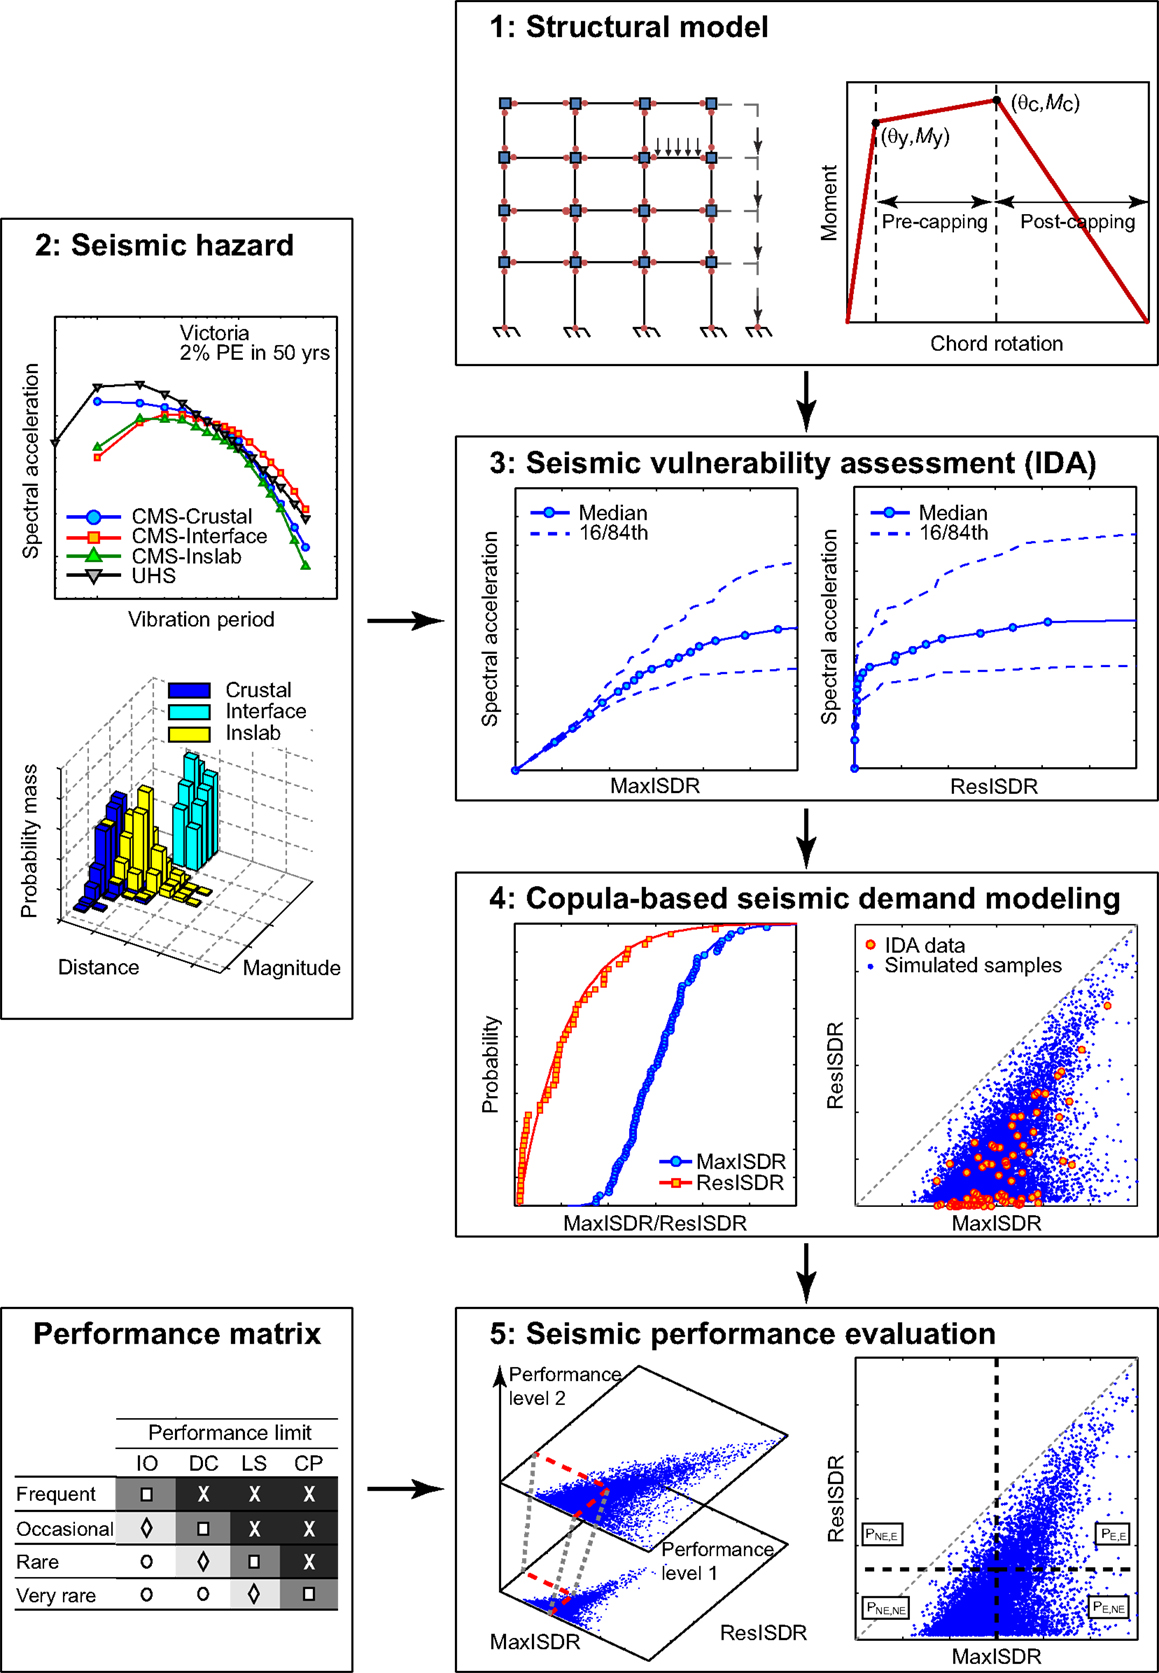
Figure 2. Probabilistic seismic vulnerability assessment framework.
Salient features of the key components of the framework are explained in the following.
Structural Model
Tesfamariam and Goda (2015) studied the effect of MSAS earthquake records on the loss assessment of a 4-story non-code conforming RC space frame structure. This study extends this investigation to archetypical structures with different story numbers reported in Liel and Deierlein (2008). The archetype structures are: 2-, 4-, 8-, and 12-story non-code conforming RC buildings; the structures were designed as a space frame, and all columns and beams were part of the lateral resisting system. The buildings were designed according to the 1967 UBC seismic provisions (ICBO, 1967). Beam and column elements have the same amount of over-strength; each element is 15% stronger than the code-minimum design level. The design is governed by strength and stiffness requirements, as the 1967 UBC had few requirements for special seismic design or ductile detailing.
Finite-element modeling of structures can be achieved using a fiber or lumped plasticity model. In the fiber model, the element cross section is discretized and corresponding non-linear material properties of the core concrete, cover concrete, and reinforcing bars are assigned. On the other hand, in the lumped plasticity model, non-linearity of the beam-column element is introduced at the two ends (hinges), which are connected by an elastic element. Advantages and disadvantages of each approach are summarized in Table 6. Haselton et al. (2008) indicated that the lumped plasticity model, equipped with adequate hysteretic models for plastic hinges, can simulate global collapse behavior well (note: they observed that the fiber model may be numerically unstable when the responses become highly non-linear).
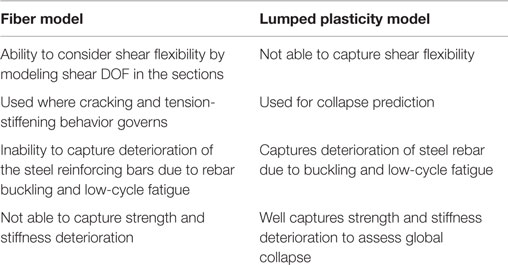
Table 6. Advantages and disadvantages of fiber and lumped plasticity models (Haselton et al., 2008).
Figure 3A shows a schematic of the 4-story building. It has a floor area of 38.1 m (125 ft) by 53.3 m (175 ft); columns are spaced at 7.6 m (25 ft), and story heights are 4.6 m (15 ft) and 4.0 m (13 ft) at the ground floor and higher floor levels, respectively. The non-ductile RC models used in this paper are developed by Liel and Deierlein (2008). The models are based on a lumped plasticity approach in Open system for earthquake engineering simulation (OpenSees, McKenna et al., 2000). The lumped plasticity element models used to simulate plastic hinges in beam-column elements (Figure 3B) utilize a tri-linear non-linear spring model that is developed by Ibarra et al. (2005) and implemented in OpenSees by Altoontash (2004). Figure 3B shows the tri-linear backbone curve, coupled with the associated hysteretic rules, which is used to model the structures to post-peak response and near-collapse response. The post-peak response enables modeling of the strain hardening behavior associated with concrete crushing, rebar buckling and fracture, and bond failure (Haselton et al., 2008; Liel and Deierlein, 2008). Liel and Deierlein (2008) and Haselton et al. (2008) reported that the Ibarra et al. model was calibrated with data from 255 RC column test results. Details of the calibration process and building details are provided in Liel and Deierlein (2008) and Haselton et al. (2008); for brevity, they are not repeated here. P-Δ effects are modeled using a leaning column. The vibration periods for the first three modes for the 2-, 4-, 8-, and 12-story buildings are summarized in Table 7.
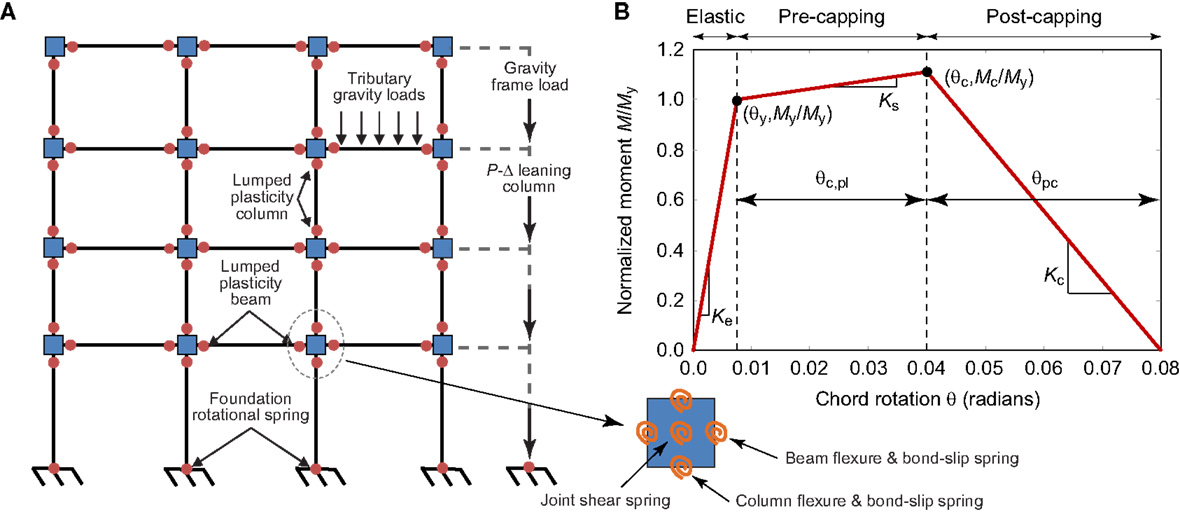
Figure 3. (A) Non-linear finite-element model of a 4-story non-ductile RC frame, and (B) backbone curve for beam-column elements.
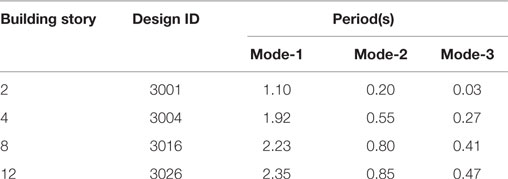
Table 7. First three fundamental periods of 2-, 4-, 8-, and 12-story buildings.
Seismic Hazard for Victoria and Ground Motion Selection
Victoria is the provincial capital of BC and is located at the southern tip of Vancouver Island (Figure 1). Due to its geographical location, Victoria is affected by three types of earthquakes. The first type of the influential events is an earthquake at shallow depth in the crust; historically, the 1918 and 1946 earthquakes fall under this category. The other two types of the influential earthquakes are related to the movements of the Juan de Fuca Plate, Explorer Plate, Gorda Plate, and North American Plate in the Cascadia subduction zone. In the subducting slab, deep earthquakes occur (e.g., 2001 Nisqually earthquake), while at the plate interfaces, mega-thrust subduction earthquakes, as larger as Mw9.0, occur (e.g., 1700 Cascadia earthquake, Hyndman and Rogers, 2010). It is important to recognize that the three types of dominant earthquakes in southwestern BC have distinct characteristics in terms of recurrence interval, earthquake magnitude, location, and depth and thus should be treated differently.
The key features of the critical earthquake scenarios for a given location can be evaluated quantitatively via probabilistic seismic hazard analysis. Atkinson and Goda (2011) conducted seismic hazard studies for southwestern BC, by incorporating recent advancements in seismology. Typical outputs from probabilistic seismic hazard analysis, which are essential for seismic performance assessment of buildings and infrastructure, are the UHS and seismic deaggregation. Currently, the UHS at 2% PE in 50 years (equivalent to the return period of 2500 years) is adopted as the basis for seismic design provisions for new construction in Canada. The seismic deaggregation identifies critical earthquake scenarios (for instance, in terms of magnitude, distance, and earthquake type) for a selected probability level. Figure 4A shows UHS for Victoria at 10, 5, and 2% PE in 50 years, where the site condition is set to site class C, which is represented by the average shear-wave velocity in the upper 30 m between 360 and 760 m/s. The three probability levels are relevant for assessing the seismic performance of structures in Canada. Figure 5 shows the seismic deaggregation results for T = 1.0 and 2.0 s for 10, 5, and 2% PE in 50 years; the selected vibration periods correspond to the adopted seismic intensity measure (IM) for the 2-story building and the 4-, 8-, and 12-story buildings, respectively (Table 7). In Figure 5, relative contributions due to crustal, mega-thrust (Cascadia) interface, and deep inslab earthquakes are indicated. The seismic deaggregation results suggest that relative contributions due to the Cascadia subduction earthquakes increase with the probability level and the seismic hazard values for longer vibration periods are affected more significantly by the large subduction events. The variable characteristics of the dominant scenarios are important for seismic performance evaluations and thus should be taken into account in selecting ground motion records for non-linear dynamic analyses of structural models.
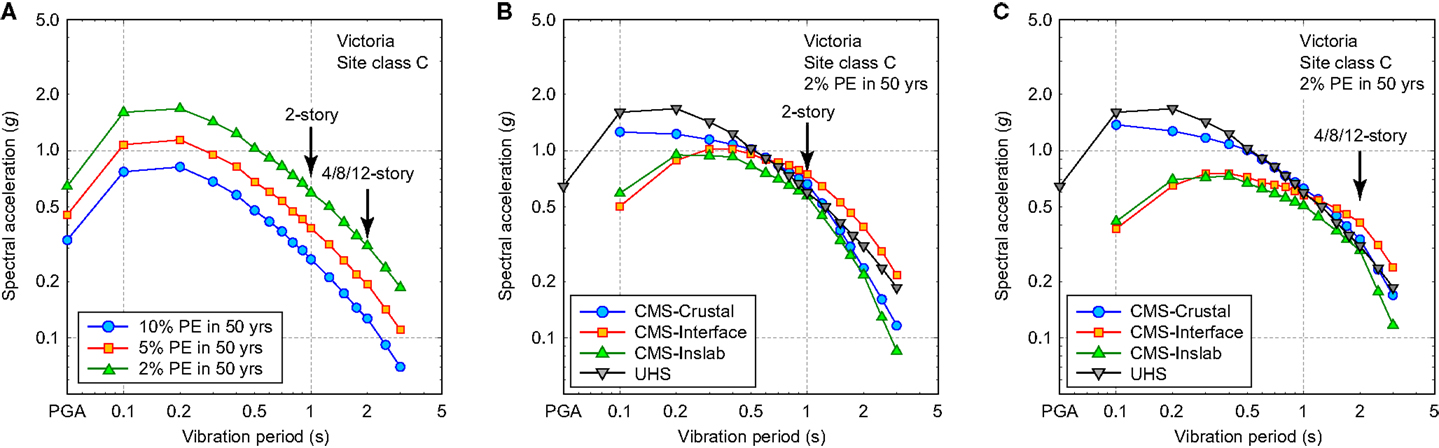
Figure 4. (A) Uniform hazard spectra, (B) conditional mean spectra for the anchor vibration period of 1.0 s (for the 2-story RC frame), and (C) conditional mean spectra for the anchor vibration period of 2.0 s (for the 4-, 8-, and 12-story RC frames).
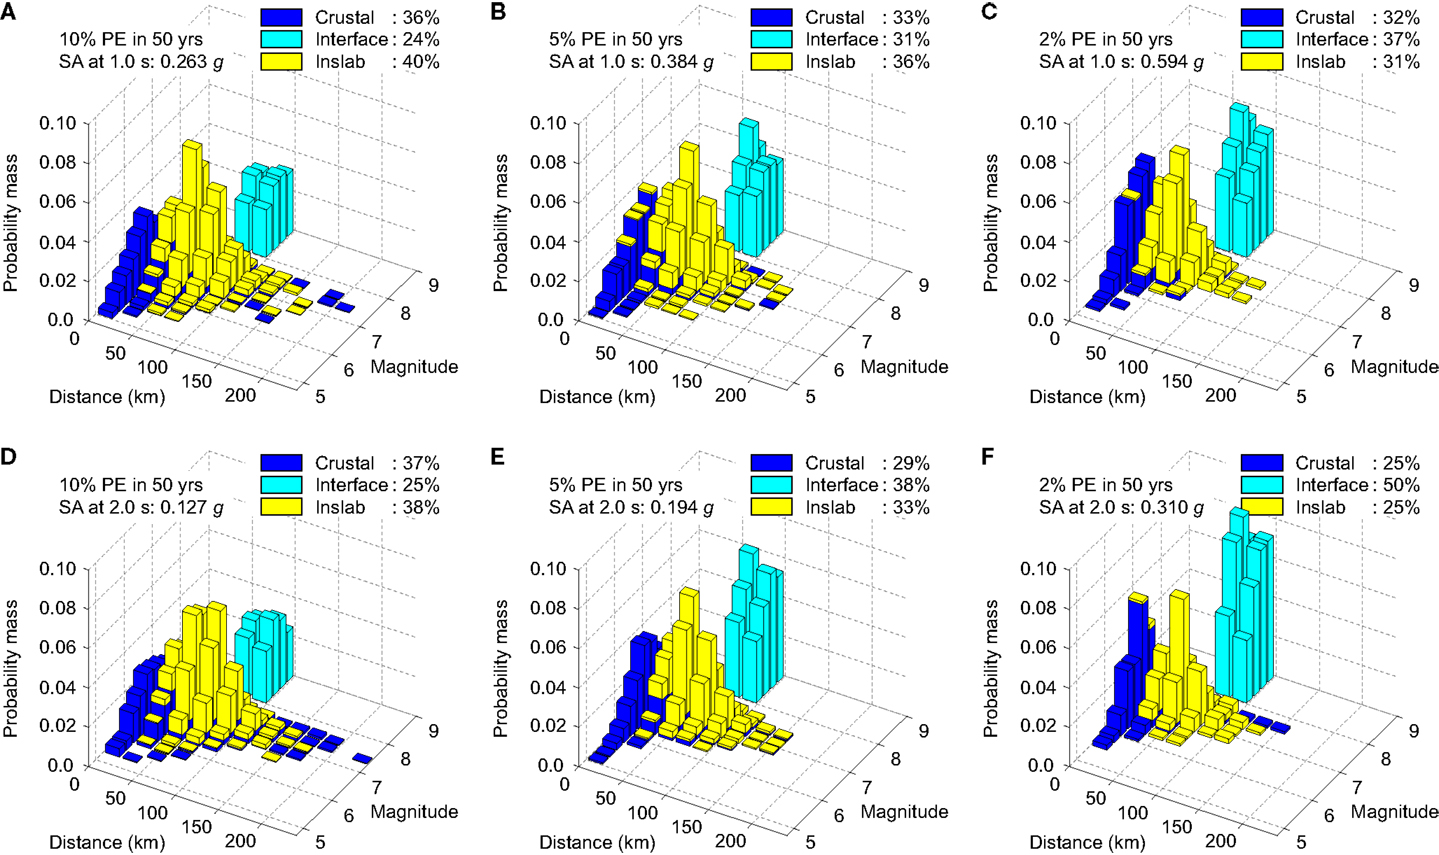
Figure 5. Seismic deaggregation results for Victoria: (A–C) T = 1.0 s for 10, 5, and 2% probability of exceedance in 50 years, and (D–F) T = 2.0 s for 10, 5, and 2% probability of exceedance in 50 years.
Careful record selection is of critical importance to produce unbiased estimates of seismic vulnerability. In particular, when record scaling is implemented to reach high seismic excitation levels, record selection needs to account for the spectral shape effects (Luco and Bazzurro, 2007). One practical method that is widely adopted for mitigating the record scaling bias is the CMS method (Baker, 2011). In the CMS-based record selection, the target response spectrum is modified based on dominant earthquake scenarios and relevant ground motion prediction equations at a selected performance level. Typically, the base target response spectrum for record selection is a UHS and is further modified based on the mean scenarios obtained from seismic deaggregation; several tens of ground motion records that match the modified target response spectrum (i.e., CMS) are selected as input motion. However, for the seismic environments in southwestern BC, it may be too simplistic to use a single target response spectrum for a given probability level because three dominant earthquakes with different characteristics are present (Figure 5). For this reason, in this study, the multiple CMS-based record selection method by Goda and Atkinson (2011) is adopted, which defines three different target spectra considering the different earthquake characteristics and ground motion prediction models for these earthquake types. Examples of the CMS for crustal, interface, and inslab earthquakes are shown in Figures 4B,C; Figure 4B is for the 2-story building, whereas Figure 4C is for the 4-, 8-, and 12-story buildings. It is noted that the CMS for the interface events have richer spectral content with respect to other two earthquake types because of larger earthquake magnitudes and longer propagation paths.
Another important aspect for record selection is to prepare a suitable ground motion dataset for the seismic environments of interest. For southwestern BC, the base ground motion dataset should contain records from large mega-thrust subduction events. Moreover, the record database should contain as-recorded MSAS sequence records. To achieve these requirements, a new composite database of real MSAS sequences is compiled by combining the database that was constructed based on the Next Generation Attenuation database (Goda and Taylor, 2012) and the new database for Japanese earthquakes from the K-NET, KiK-nt, and SK-net (Goda et al., 2015). It is noteworthy that the new Japanese database includes records from the 2011 Tohoku earthquake, which may be considered as appropriate surrogate for the Cascadia subduction events. The composite dataset consists of 606 real MSAS sequence records; 75 sequences are from the NGA database and 531 sequences are from the Japanese database (each sequence has two horizontal components). This database is the largest dataset for as-recorded MSAS sequences and is sufficient to select a suitable set of record sequences by taking into account various requirements, such as earthquake type, magnitude, distance, and site class.
Incremental Dynamic Analysis
Incremental dynamic analysis implements a series of non-linear dynamic analyses by scaling a set of input ground motions based on an adopted IM, and develops prediction equations of engineering demand parameters (EDP, e.g., MaxISDR and ResISDR) at different IM levels. The IM is the spectral acceleration at the fundamental period of a structure. For the different building story numbers, the maximum scaling required in IDA can vary. For the 2-story building, the spectral acceleration at 1.0 s is selected as IM (Table 7) and the scaling range in IDA is varied from 0.05 to 1.4 g. For the 4-, 8-, and 12-story buildings, the spectral acceleration at 2.0 s (i.e., IM) ranges from 0.05 to 0.7 g. In general, numerical instability is encountered when the inter-story drift ratio of the frames exceeds 0.10. The first occurrence of such large deformation responses is treated as “collapse” (Vamvatsikos and Cornell, 2002). In characterizing the inelastic demand, non-linear responses that are in “collapse” and “non-collapse” states are distinguished. The collapse results are modeled by collapse fragility curves (see Collapse Fragility Assessment), whereas the non-collapse results are represented by multivariate seismic demand models (see Coupla-Based Seismic Demand Modeling). Eventually, the overall performance of the building is assessed by integrating collapse results and non-collapse results in the Section “Seismic Performance Evaluation.”
Incremental dynamic analysis is carried out for the 2-, 4-, 8-, and 12-story RC frames using the set of 50 MS records as well as a set of 50 MSAS sequences, which are selected based on the multiple CMS-based procedures. The IDA results for both MS records and MSAS sequences (i.e., EDP-IM plot) are shown in Figures 6 and 7; Figure 6 is for MaxISDR, whereas Figure 7 is for ResISDR. To present the uncertainty of the IDA results, 16th–84th percentile curves (corresponding to mean ± 1 SD), are included in the figures. The overall characteristics of the IDA curves for MaxISDR and ResISDR are different; the former increases gradually with the seismic intensity level, whereas the latter increases rapidly when the seismic intensity level reaches in the range of 0.2–0.3 g for the 2-story building and 0.15–0.20 g for the 4-, 8-, and 12-story buildings; similar observations are also noted in FEMA P-58-1 (2012). It is noteworthy that the uncertainty of ResISDR is much greater than that of MaxISDR, as noted by Ruiz-García and Miranda (2006). To appreciate the differences of the IDA curves for the buildings with different story numbers, the 50th, 16th, and 84th percentile curves for the 4-, 8-, and 12-story buildings are overlaid together in Figure 8, noting that the same IM is adopted for these buildings (thus the IDA results can be compared directly). The results shown in Figure 8 indicate that for a given seismic excitation level, both MaxISDR and ResISDR decrease with the story number; therefore, for the considered non-ductile RC frames, the 4-story building is more vulnerable than the other taller buildings.
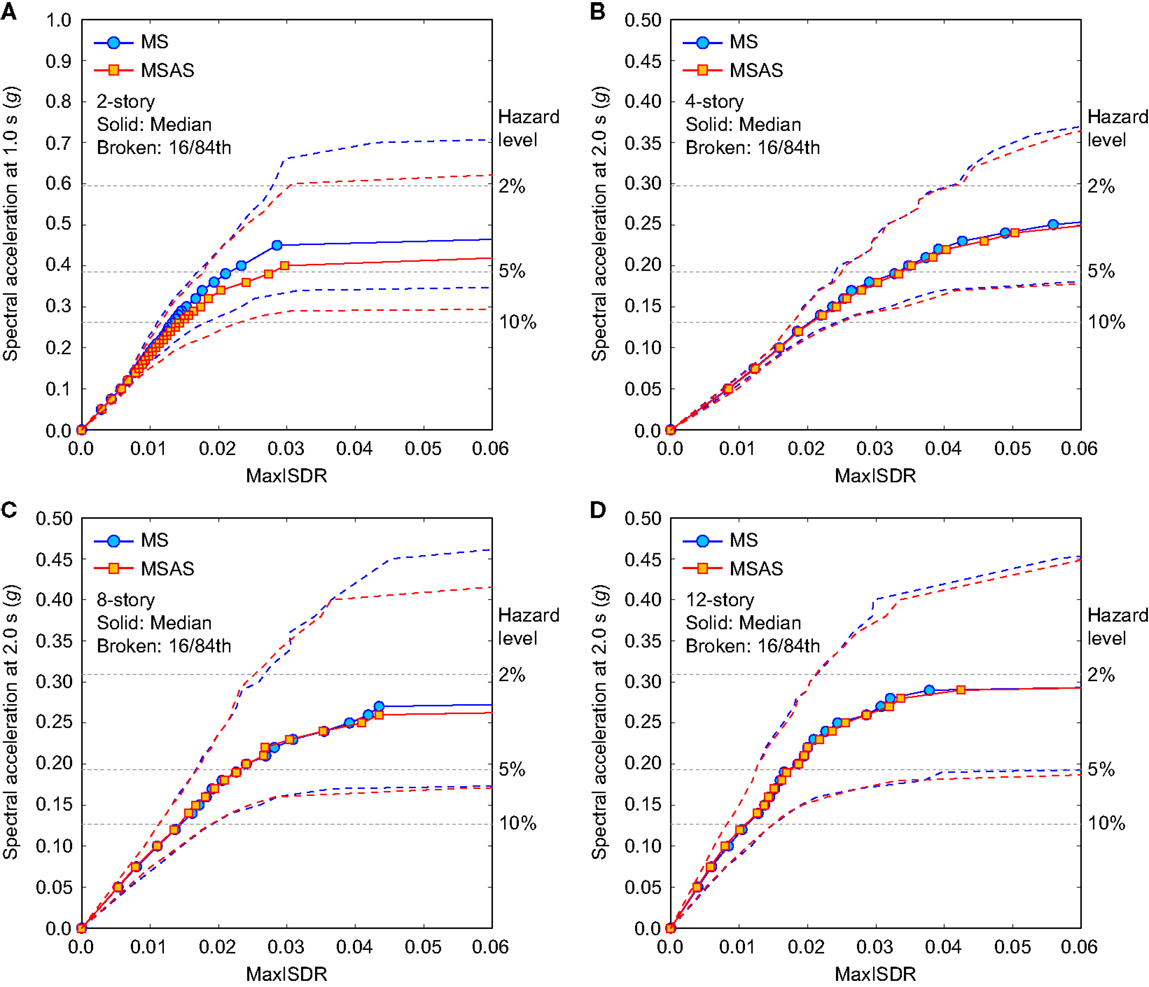
Figure 6. Incremental dynamic analysis results for MaxISDR by considering MS records and MSAS sequence records: (A) 2-story, (B) 4-story, (C) 8-story, and (D) 12-story.
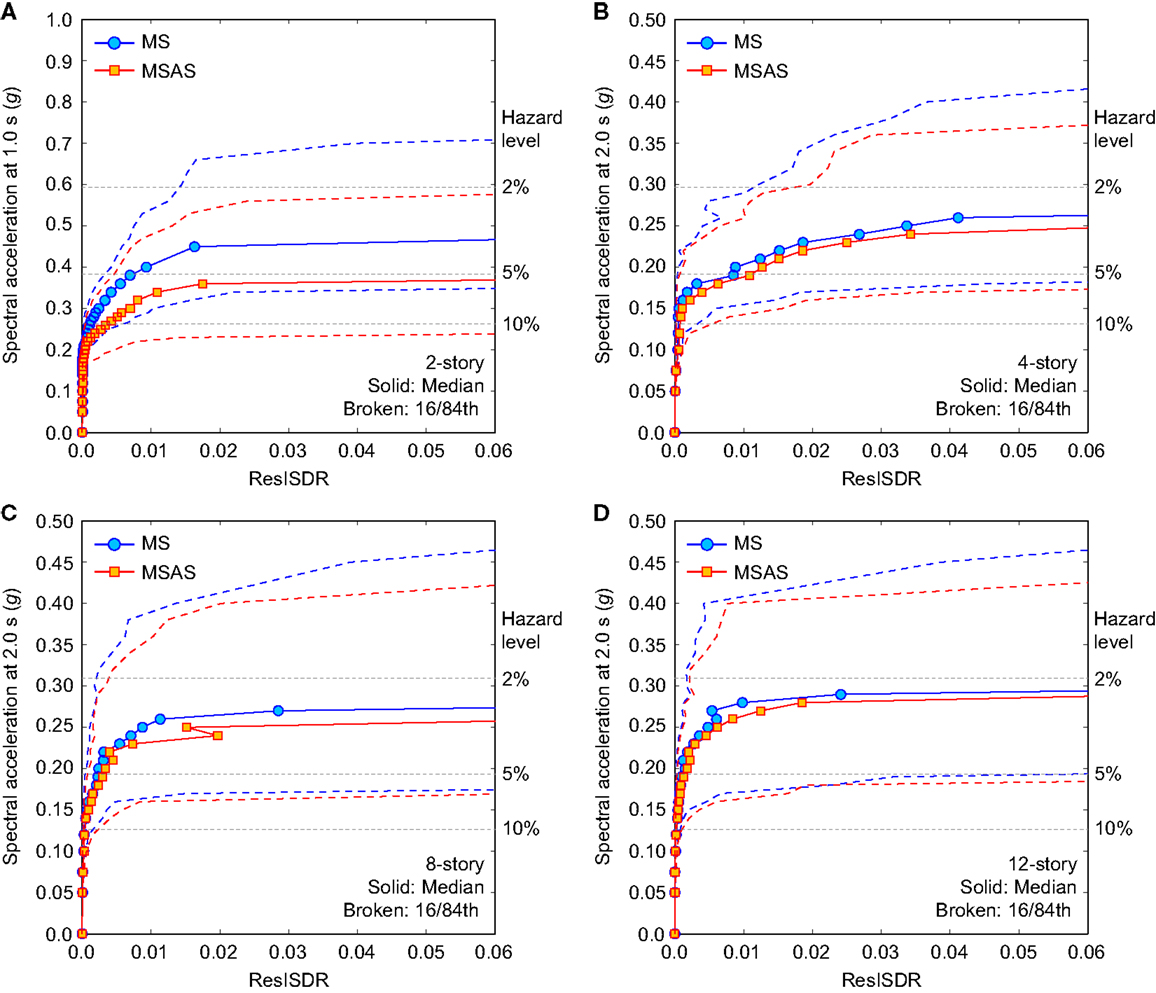
Figure 7. Incremental dynamic analysis results for ResISDR by considering MS records and MSAS sequence records: (A) 2-story, (B) 4-story, (C) 8-story, and (D) 12-story.
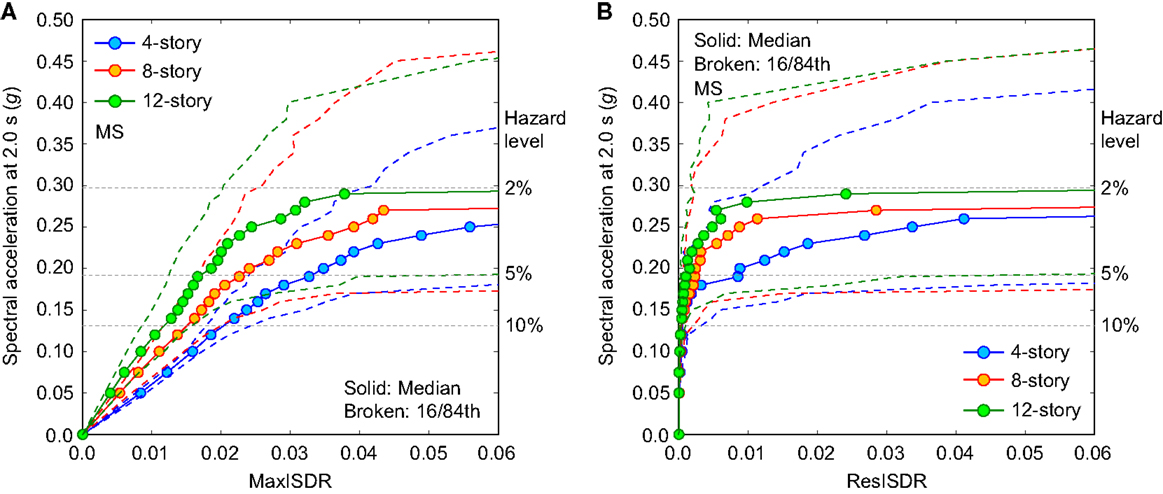
Figure 8. Comparison of incremental dynamic analysis results for the 4-, 8-, and 12-story RC frames by considering MS records: (A) MaxISDR and (B) ResISDR.
Moreover, from the EDP-IM plots, it can be observed that the impact of aftershock records is significant for the 2-story building (Figures 7A and 8A), whereas such marked effects diminish with increase in story number (Figures 7B–D–8B–D). One of the main reasons for the pronounced influence of aftershock records on MaxISDR and ResISDR for the 2-story building is related to its fundamental period (≈1.0 s; Table 7) and the dominant spectral content of the aftershock records; generally, aftershock records have richer spectral content in the short vibration period range (Goda et al., 2015). For all cases, the impact of MSAS earthquake sequence is more significant for ResISDR as compared with MaxISDR. For instance, for the 4-story building (Figures 7B and 8B), in terms of median, the consideration of MSAS sequences leads to 5–10% increase for MaxISDR and up to 100% increase for ResISDR with respect to the results for MS records.
Collapse Fragility Assessment
The collapse fragility can be represented by a lognormal cumulative distribution function (CDF):
where PC is the probability that a ground motion with IM = x will cause the structure to collapse, Φ(•) is the standard normal CDF, θ is the median of the fragility function (the IM level with 50% probability of collapse), and β is the SD of lnIM (sometimes referred to as the dispersion parameter). Figure 9 shows the collapse fragility results (raw data and fitted lognormal curve) for MS records and MSAS sequences. The estimated values of θ and β are also provided in the figure. The impact of aftershocks is pronounced for the 2-story building, where the median collapse capacity θ is reduced by 13% (i.e., the curve is shifted toward left). On the other hand, the collapse fragility curves of the 4-, 8-, and 12-story buildings show no or slight differences. These results are consistent with the IDA curves shown in Figure 6. Furthermore, in Figure 10, the collapse fragility results for the 4-, 8-, and 12-story buildings are superimposed. The comparison shown in Figure 10 indicates that the median collapse capacity θ as well as the dispersion β increases with the story number; the differences of the collapsed fragility curves are more pronounced at the greater seismic excitation levels.
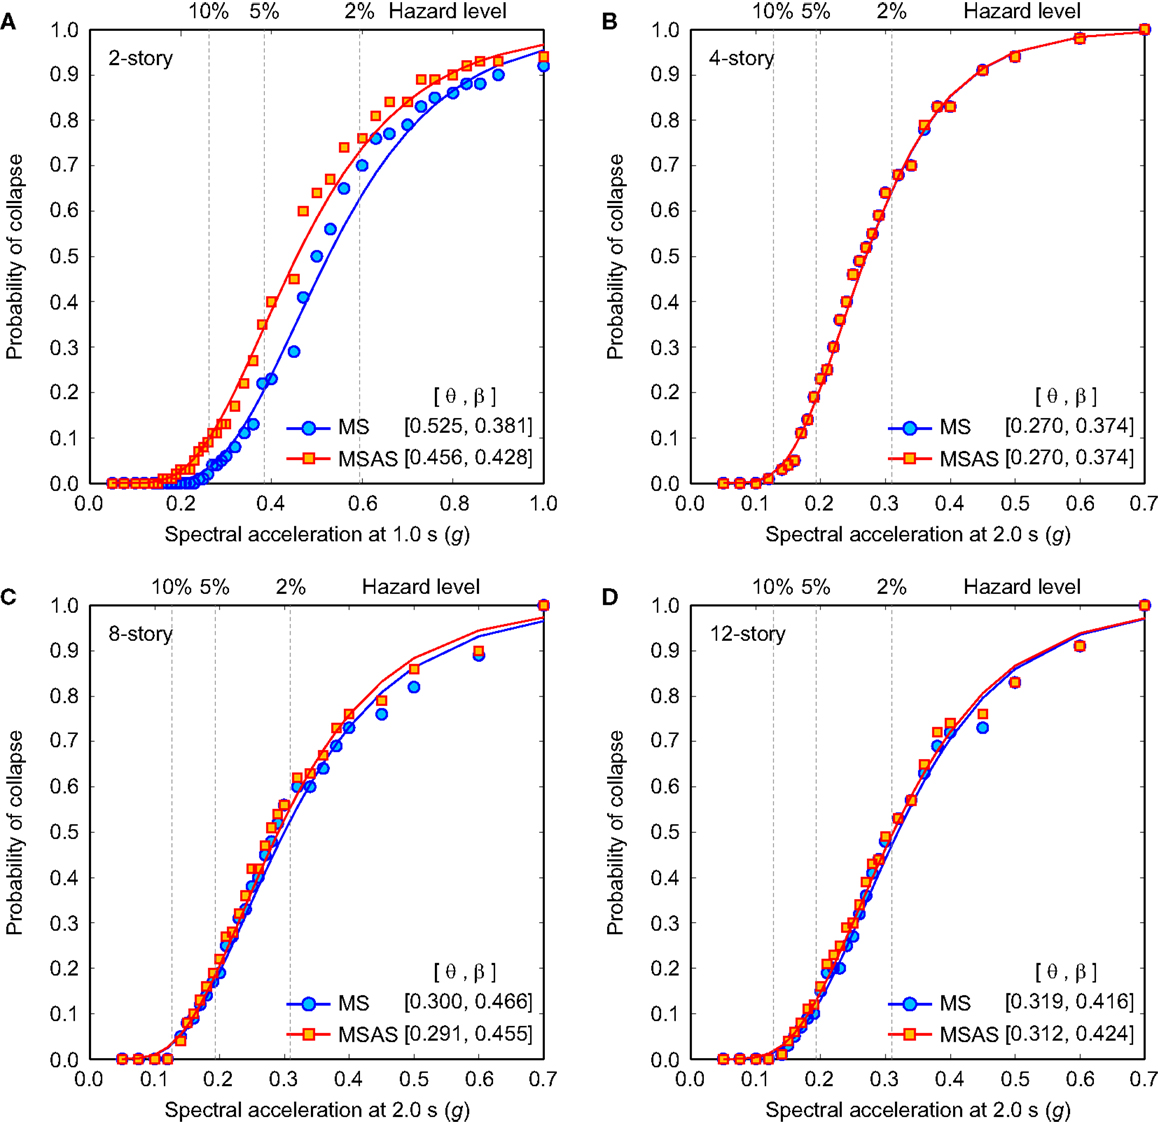
Figure 9. Collapse fragility results by considering MS records and MSAS sequence records: (A) 2-story, (B) 4-story, (C) 8-story, and (D) 12-story.
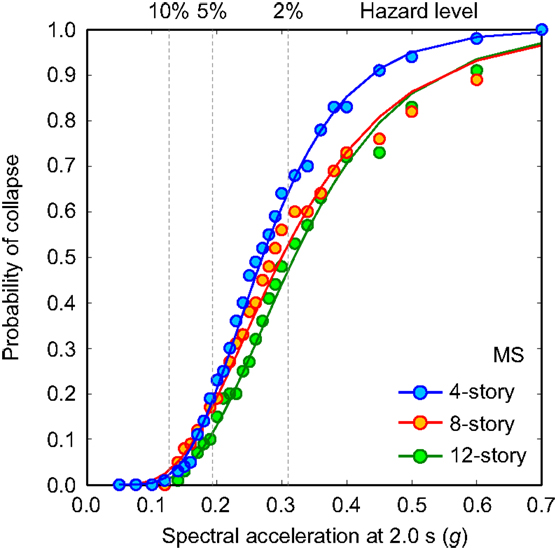
Figure 10. Comparison of collapse fragility results for the 4-, 8-, and 12-story RC frames by considering MS records.
Coupla-Based Seismic Demand Modeling
MaxISDR and ResISDR are statistically dependent (Goda and Tesfamariam, 2015) and thus this should be taken into account when these EDPs are characterized. For the seismic demand modeling, first, marginal probability distributions of MaxISDR and ResISDR should be developed, and second, corresponding dependence needs to be characterized. The probabilistic modeling of MaxISDR and ResISDR is performed at individual IM levels using non-collapse MaxISDR and ResISDR data (note: the number of available data points for seismic demand modeling decreases with the IM level because more data fall into collapse states; Figure 9).
Figure 11A shows the scatter plot for the 4-story building by considering MS records at 5% PE in 50 years level. In the figure, marginal distributions of MaxISDR and ResISDR are plotted along the horizontal axis and vertical axis, respectively. Note that ResISDR has a heavy right tail. Goda and Tesfamariam (2015) considered six probability distributions, i.e., lognormal, Gumbel, Frechet, Weibull, gamma, and generalized Pareto, for marginal probability distribution modeling of MaxISDR and ResISDR. For MS records and MSAS sequences, Goda and Tesfamariam (2015) showed that the Frechet distribution (Eq. 2) and generalized Pareto distribution (Eq. 3) are suitable for MaxISDR and ResISDR, respectively. The probability density functions of the Frechet and the generalized Pareto models are given by:
and,
where μ is the location parameter, and σ is the scale parameter, and ξ is the shape parameter. These marginal distributions are non-normal (in particular, ResISDR); in such cases, conventional multivariate normal (or lognormal) distribution modeling is not ideal, and a more elaborate approach is necessary.
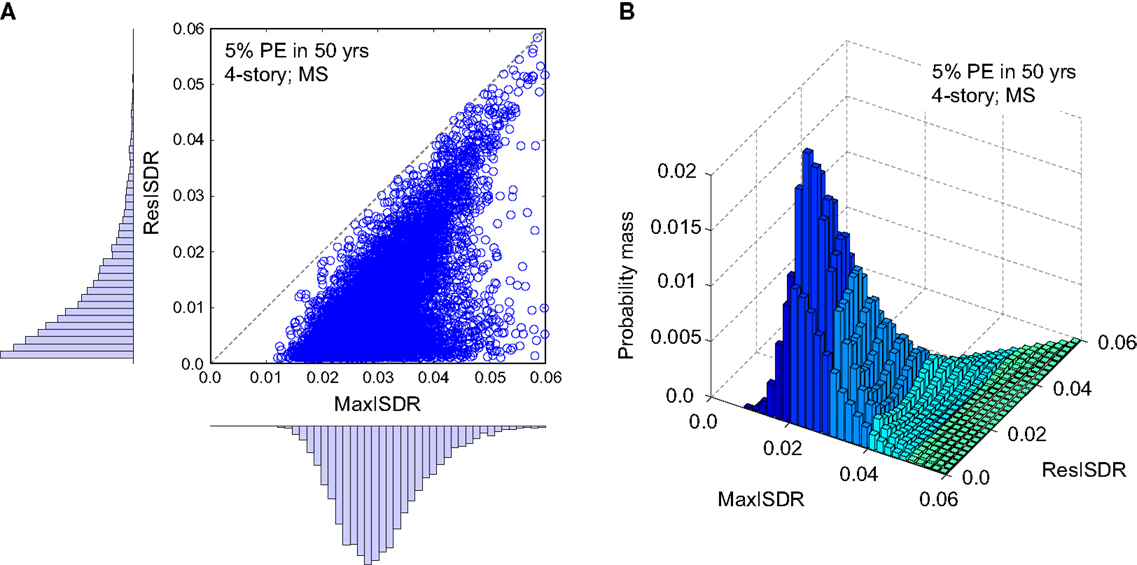
Figure 11. (A) Scatter plot and corresponding marginal probability distributions of MaxISDR and ResISDR and (B) joint distribution of MaxISDR and ResISDR for the 4-story building at 5% probability of exceedance in 50 years.
The dependence of MaxISDR and ResISDR can be characterized by using elliptical copulas, such as normal and t, and Archimedean copulas, such as Gumbel, Frank, and Clayton (McNeil et al., 2005). The asymmetric Archimedean copula is a mixture of one of the Archimedean copulas and the independence copula; this copula class is useful in modeling data that exhibit uneven distribution of the data points along the upper-left-lower-right diagonal line in the transformed space. In the context of joint probability distribution modeling of MaxISDR and ResISDR, the uneven distribution of the data is related to the physical relationship between MaxISDR and ResISDR (i.e., MaxISDR ≥ ResISDR; Goda and Tesfamariam, 2015). To model the observed dependence of MaxISDR and ResISDR (e.g., scatter plot shown in Figure 11A), parametric copula functions are fitted to empirical copula samples using the maximum likelihood method (McNeil et al., 2005). The copula fitting of MaxISDR and ResISDR at various IM levels suggests that overall, the Gumbel (or asymmetrical Gumbel) copula (Eq. 4) is suitable for the majority of the cases examined in this study.
where u1 and u2 are the uniform random variables, and δ is the model parameter.
The developed statistical seismic demand models of MaxISDR and ResISDR can be used for seismic performance evaluation of structures. For instance, considering the fitted dependence function for the 4-story building at 5% PE in 50 years, numerous copula samples are first generated; their marginal distributions are uniformly distributed with the specified dependence characteristics. Using the simulated copula samples and the fitted marginal distribution models for MaxISDR and ResISDR, pairs of MaxISDR and ResISDR samples can be obtained using the inverse transformation method. The results of 5,000,000 simulations are presented in Figure 11B. Indeed, similar figures can be generated for different building story numbers as well as seismic hazard levels, and can be used in the seismic performance evaluation.
Seismic Performance Evaluation
The collapse fragility curves and the joint probability model of non-collapse inelastic seismic demands outlined in the previous sections can now be used to carry out performance-based evaluation of a building with the limit states provided in Tables 3 and 4. For example, for the NBCC normal importance buildings (basic objective), the acceptable limit states are LS and CP for 10 and 2% PE in 50 years, respectively. For the NBCC high importance buildings (essential service objective), the required limit states are more stringent and correspond to DC and LS for the same performance levels. For these cases, the corresponding values of [MaxISDR, ResISDR] are as follows (Table 4):
• Basic objective: LS = [2.5, 1.0%] for 10% PE in 50 years and CP = [4.5, 1.0%] for 2% PE in 50 years;
• Essential service objective: LS = [0.9, 0.5%] for 10% PE in 50 years and CP = [2.5, 1.0%] for 2% in 50 years.
For the structural models that are considered in this study (which should meet the basic objective), IO and DC are not applicable to evaluate their seismic performances based on bivariate structural responses. This is because the structures, when subjected to expected ground motions at IO and DC hazard levels, are essentially linear-elastic and residual responses are very small (near zero). In other words, the seismic hazard levels corresponding to 50% PE in 30 or 50 years are mainly related to the serviceability limit state and are too low to cause significant non-linear responses. As our focus in this paper is upon the non-linear responses, LS and CP are mainly concerned and an intermediate seismic performance level between LS and CP, i.e., 5% PE in 50 years (corresponding to the return period of 1000 years), is introduced.
To illustrate the proposed seismic performance evaluation method, three performance levels, i.e., 10, 5, and 2% PE in 50 years, are considered with the limit states of [MaxISDR, ResISDR] = [2.0, 1.0%], [3.0, 1.5%], and [5.0, 2.0%], respectively. These demand levels are similar to those presented in Table 4. Figure 12A shows the scatter plots of MaxISDR and ResISDR (for non-collapse cases) at the three performance levels, noting that the collapse cases are dealt with collapse fragility curves (Figure 9). The corresponding limit states are indicated with red broken lines. By connecting the limit state thresholds at different performance levels (gray broken lines) and plotting the seismic demands in bivariate space (blue dots), the evolution of the seismic performance evaluation of the structure can be visualized, facilitating the better understanding of the seismic performance of the structure at multiple seismic excitation levels.
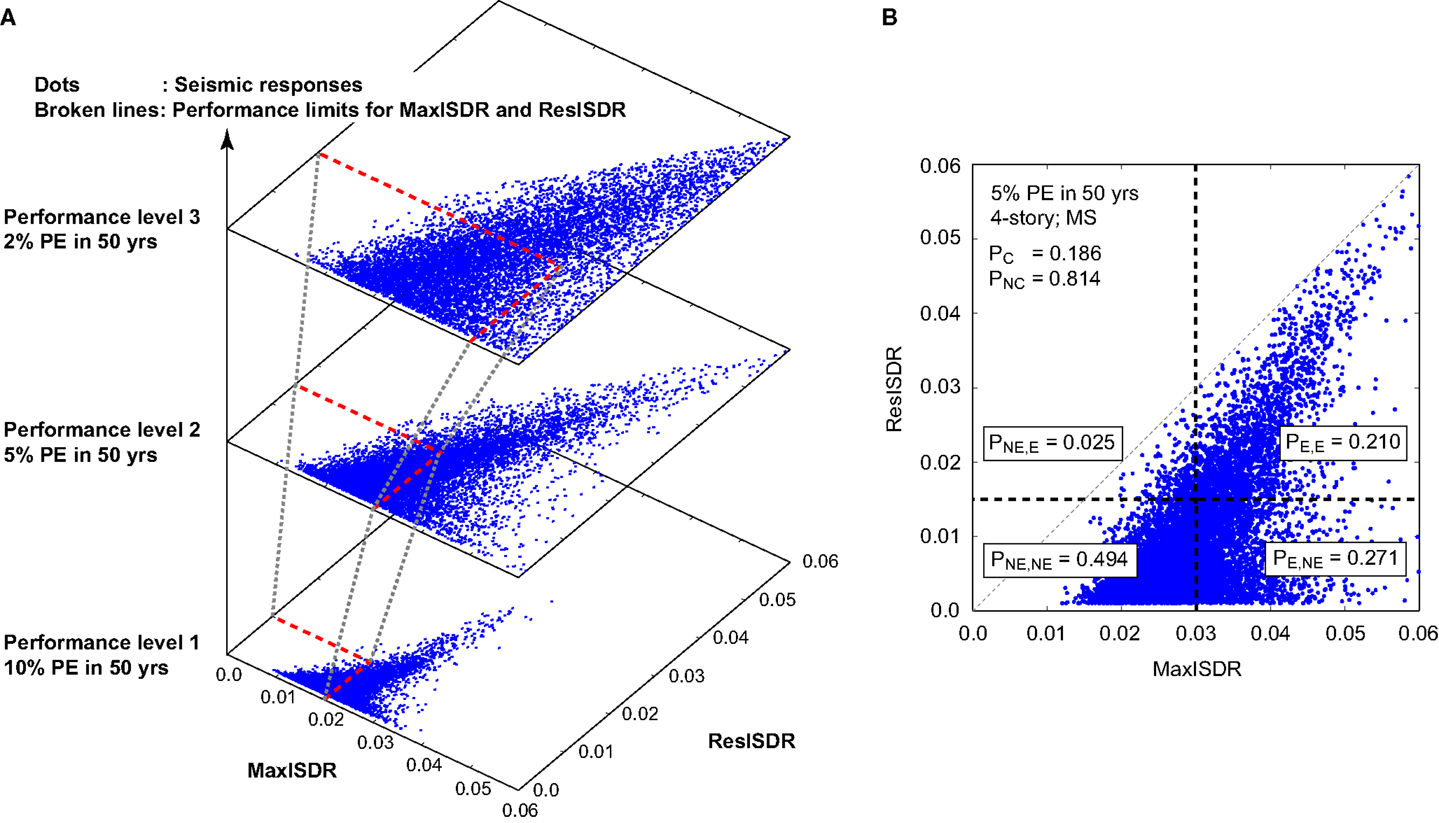
Figure 12. (A) Scatter plots of MaxISDR and ResISDR at the three performance levels (10, 5, and 2% PE in 50 years) and (B) probabilities of exceedance and non-exceedance of the limit state demand levels.
The overall performance of the building is assessed through unconditional probability of unsatisfactory seismic performance (PNS) (i.e., overall measure at a seismic performance level). The steps followed to compute PNS are outlined below, with the results shown in Figure 12B as an example. Figure 12B illustrates the calculations of the probabilities of exceedance and non-exceedance of the specified limit state thresholds for the 5% PE in 50 years performance level for non-collapse cases. First, from Figure 12B, four probabilities of exceedance and non-exceedance can be derived:
• the lower-left quadrant corresponds to the probability of joint non-exceedance of the MaxISDR and ResISDR limits, PNE,NE (=0.494),
• the lower-right quadrant corresponds to the probability of exceedance of the MaxISDR limit and non-exceedance of the ResISDR limit, PE,NE (=0.271),
• the upper-left quadrant corresponds to the probability of non-exceedance of the MaxISDR limit and exceedance of the ResISDR limit, PNE,E (=0.025), and
• the upper-right quadrant corresponds to the probability of joint exceedance of the MaxISDR and ResISDR limits, PE,E (=0.210).
The four probabilities are useful for assessing the causes of unsatisfactory seismic performance for non-collapse cases. A large value of PE,NE tends to indicate that the unsatisfactory seismic performance is due to MaxISDR, whereas a large value of PNE,E suggests that the structure may need to be demolished after the earthquake. It is noteworthy that PNE,NE, PE,NE, PNE,E, and PE,E are conditional probabilities upon non-collapse cases. Second, the collapse probability PC and the non-collapse probability PNC, i.e., PNC = (1 − PC), need to be evaluated for the given seismic intensity level using the corresponding collapse fragility curve (Figure 9). Finally, once the different probability values are obtained as outlined above, the value of PNS can be calculated by:
Figure 13 shows 4 by 3 panels (i.e., four buildings and three performance levels) of the bivariate MaxISDR–ResISDR data/performance limits for MS records; four conditional probabilities of exceedance and non-exceedance as well as collapse/non-collapse probabilities are indicated in the figure, whereas Figure 14 shows the same set of results for MSAS sequences. To facilitate the comparison of the calculated probabilities for different cases, values of PNE,NE, PE,NE, PNE,E, PE,E, PC, PNC, and PNS are summarized in Tables 8 and 9 for MS records and MSAS sequences, respectively.
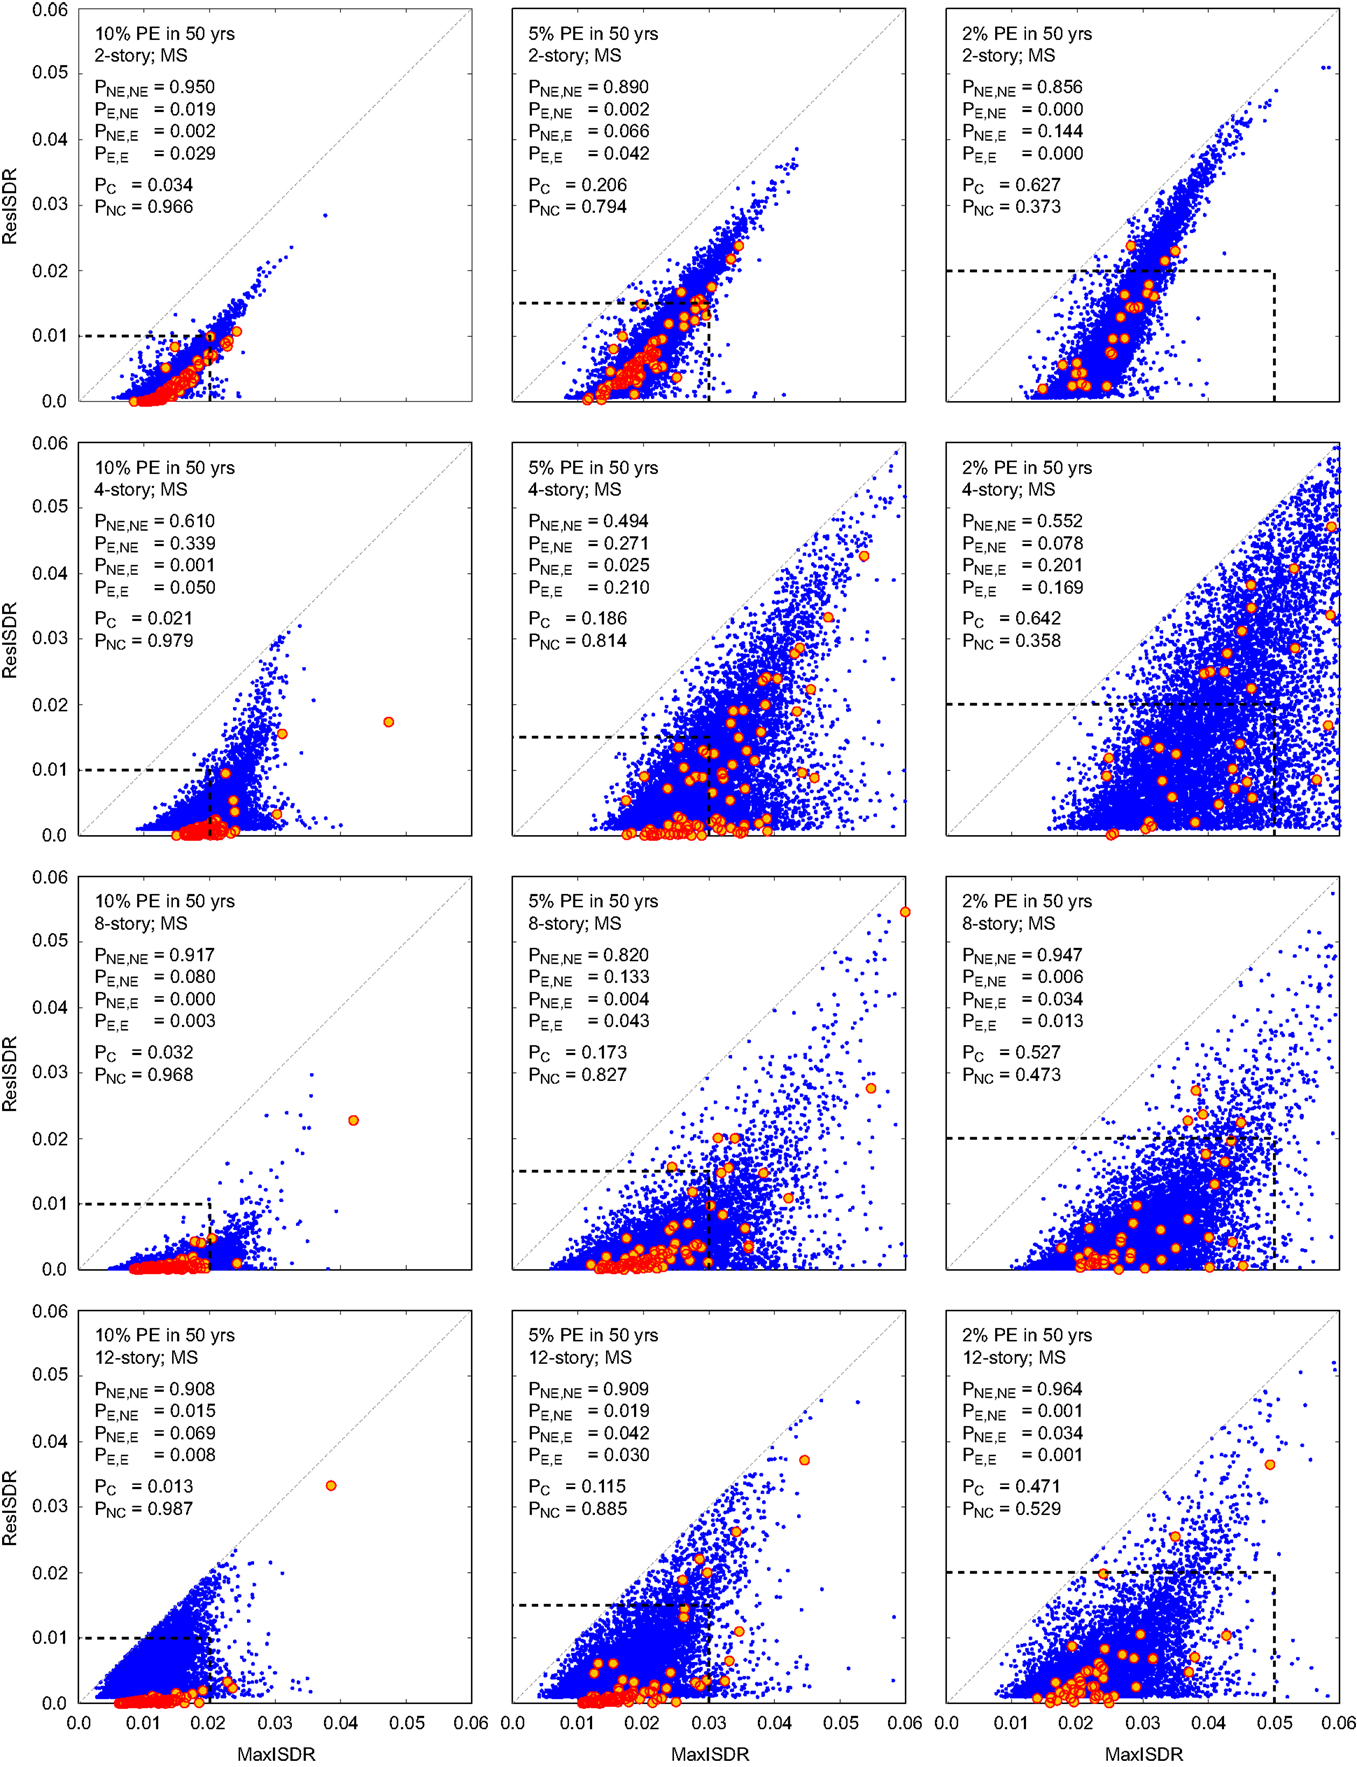
Figure 13. Mainshock earthquake record – probabilities of exceedance and non-exceedance of the 2-, 4-, 8-, and 12-story building (rows) and 10, 5, and 2% PE in 50 years hazard levels (columns). Red circles are the IDA results.
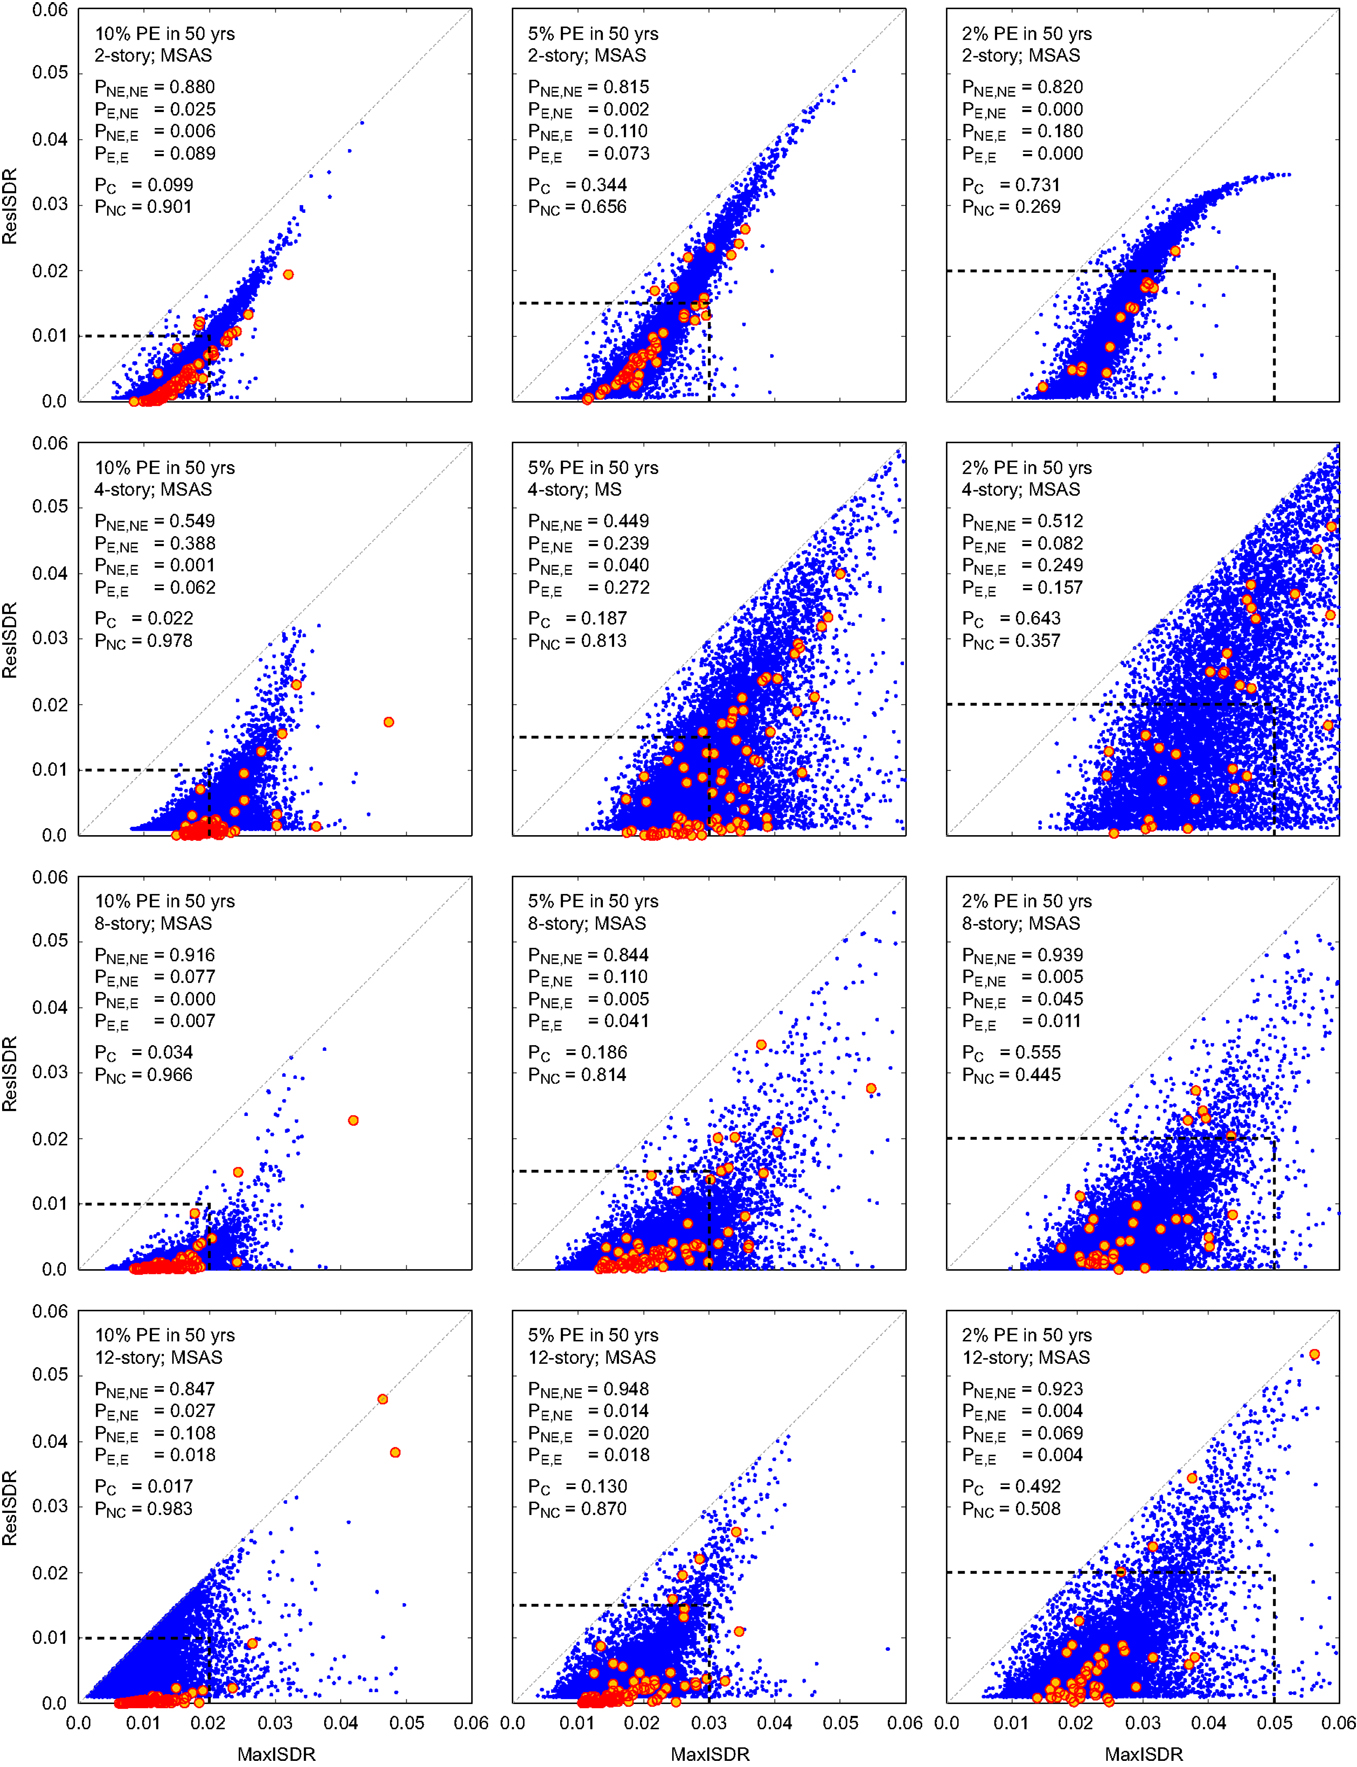
Figure 14. Mainshock–aftershock earthquake sequence records – probabilities of exceedance and non-exceedance of the 2-, 4-, 8-, and 12-story building (rows) and 10, 5, and 2% PE in 50 years hazard levels (columns). Red circles are the IDA results.
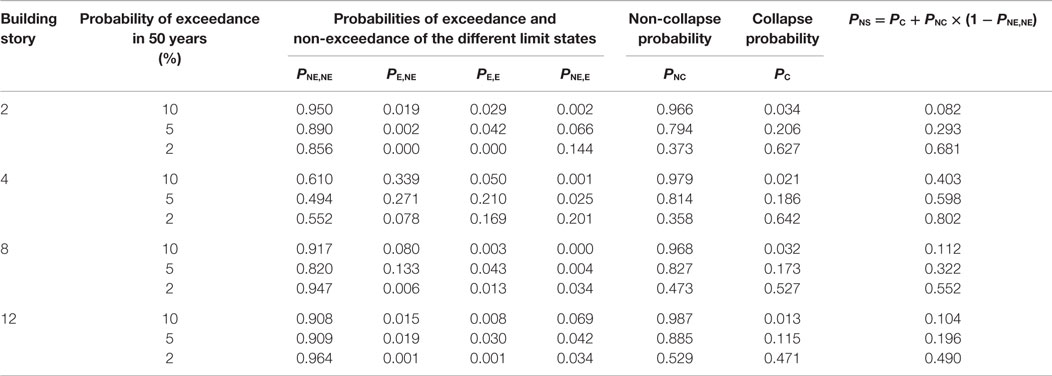
Table 8. Collapse and non-collapse probabilities and probabilities of exceedance and non-exceedance of the different limit states for MS records.
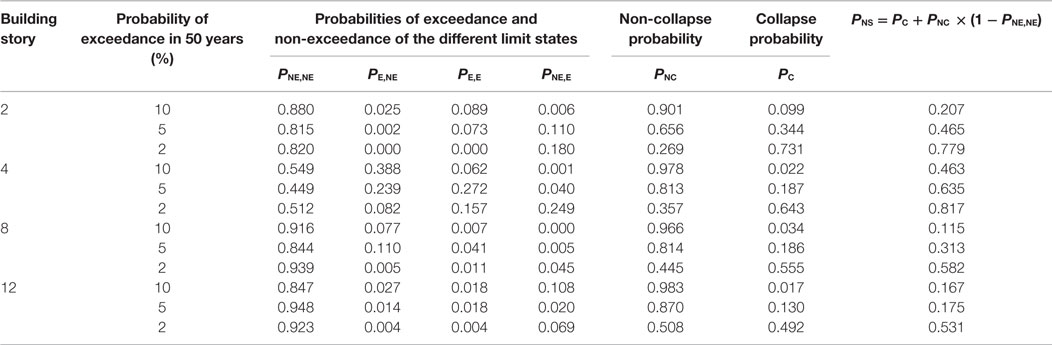
Table 9. Collapse and non-collapse probabilities and probabilities of exceedance and non-exceedance of the different limit states for MSAS sequence records.
Figures 13 and 14 show that MaxISDR and ResISDR become severer with the increase in the seismic performance level; this can be inspected from the scatter of the data points as well as the increase of the collapse probability. The 2- and 4-story buildings are more vulnerable, in comparison with the 8- and 12-story buildings. The collapse probabilities for the 2-story building are generally greater than those for the 4-story building; however, for the non-collapse cases, MaxISDR and ResISDR data are more widely distributed and consequently, conditional probabilities of unsatisfactory seismic performance (e.g., PE,NE, PNE,E, and PE,E) for the 4-story building are greater than those for the 2-story building. Overall, unconditional probabilities of unsatisfactory seismic performance for the 4-story building are greater than others (PNS in Tables 8 and 9). Note that the causes of unsatisfactory seismic performance vary depending on building story numbers and performance levels for the non-collapse cases. For example, for the 2-story building, unsatisfactory performance is mainly due to large residual seismic demands; in this case, the damaged building may be demolished. On the other hand, for the 4-story building (e.g., 5% PE in 50 years), the unsatisfactory performance is mainly due to excessive peak transient seismic demands. These results indicate that different counter measures may need to be implemented for different buildings as their damage mechanisms may be different.
The comparison of the results shown in Figures 13 and 14 as well as Tables 8 and 9 suggests that the observations made for MS records are generally applicable to MSAS sequences. However, additional seismic demands due to major aftershocks have noticeable influence on both MaxISDR and ResISDR for the 2-story building (Figures 6A and 9A). Consequently, counter measures against aftershock risks should be specific to building types (i.e., dynamic structural characteristics and susceptible failure mode).
Importantly, the calculated values of PNS listed in Tables 8 and 9 indicate that for all four non-ductile buildings, their seismic capacities may be judged as satisfactory (because PNS is relatively low) at the LS performance level (i.e., return periods of 500–1000 years), whereas they fail to meet the CP performance level required by the current standards suggested by FEMA P-58-1 (2012). Therefore, for this class of non-ductile RC buildings, seismic retrofitting should be implemented to improve the seismic performance.
Discussion and Conclusion
The primary objective of the building design code was LS. In developed countries, this has been met through improved seismic design provisions. Seismic vulnerability of existing buildings remains to be a major concern because of the use of older design codes and/or poor construction practices at the time of design and construction. Most of these older buildings are currently operational and are required to be further assessed and upgraded to improve potential economic consequences due to seismic damage. An accurate assessment of potential impact of future destructive earthquakes is essential for effective disaster risk reduction. Probabilistic seismic risk analysis entails comprehensive understanding of ground shaking information, such as fault rupture process, wave propagation, and site effects, as well as vulnerability of structures, such as structural damage accumulation, seismic loss generation, and societal/economic impact (Cornell and Krawinkler, 2000). Through probabilistic calculus, it evaluates the potential damage and loss that a certain group of structures is likely to experience due to various seismic events (Tesfamariam and Goda, 2015).
The current state of the art for seismic performance assessment of buildings in North America is FEMA P-58-1 (2012). It has been developed based on generic ground motions that are applicable to the seismicity of California, which might not be compatible with the seismicity in Canada. Furthermore, the damage observed from the MSAS sequence of the 2011 Mw6.3 Christchurch earthquake in New Zealand has highlighted the need for further study on the collapse risk of RC buildings in Canada (Elwood, 2013). The rigorous probabilistic seismic performance evaluation method can be used to aid in an informed decision-making by comparing performance metrics of alternative seismic risk mitigation measures quantitatively. Accurate representation of different limit states, robust ground motion selection, and multivariate inelastic seismic demands are vitally important in the assessment. In this paper, a robust seismic evaluation tool, within the performance-based earthquake engineering framework, is developed. Two EDPs, MaxISDR and ResISDR, are used to determine the severity of seismic damage and consequences. The joint probability distribution and dependency are modeled using the advanced copula technique. Following SEAOC (1995) and FEMA P-58-1 (2012), the two EDPs reaching different performance limit states are defined. Moreover, the aftershock ground motions are incorporated with the conventional seismic performance evaluation methodology, and furnished a better representation of the prevalent risk. The proposed evaluation tool can indeed be used for existing structures or design of new buildings.
The proposed framework was applied to 2-, 4-, 8-, and 12-story non-ductile RC buildings located in Victoria, BC, Canada. Considering regional seismicity in southwestern BC (i.e., shallow crustal earthquakes, off-shore mega-thrust interface earthquakes from the Cascadia subduction zone, and deep inslab earthquakes), 50 MS records and 50 MSAS sequence records were selected. Subsequently, IDA was performed and the computed MaxISDR and ResISDR data were used for developing collapse fragility curves and for developing probabilistic inelastic seismic demand models using copulas.
The general conclusions related to the aftershock effects are as follows:
• The MSAS sequence earthquake has significant influence on the 2-story building, where the median collapse capacity is reduced by 13%.
• The MSAS sequence records for the 4-, 8-, and 12-story buildings showed no marked differences in the collapse fragility. This partly may be ascribed to the considered model limitation. The collapse limit states as modeled in this paper are associated with flexure. The model does not consider shear failure, and gravity load collapse.
• The MSAS sequence records, however, have shown marked differences in the non-collapse limit states.
The unconditional probability of unsatisfactory seismic performance PNS integrates the collapse and non-collapse limit states and thus can be used as an overall seismic performance measure of structures. The general conclusions related to the PNS results for the four non-ductile RC frames are as follows:
• With increasing hazard levels (10, 5, and 2% PE in 50 years), the corresponding PNS is increasing.
• Seismic capacities at the LS performance level (i.e., return periods of 500–1000 years) are judged to be satisfactory (i.e., PNS is relatively low).
• Seismic capacities at the CP performance level (i.e., return period of 2500 years) may not be satisfactory (i.e., PNS is high). This highlights the need for undertaking seismic retrofitting to improve the seismic performance.
Finally, the proposed performance-based seismic screening criteria and methods can be used for Canadian buildings. The methodology can be extended to different building types and seismicity (e.g., Eastern Canada). The consideration of MSAS sequences as seismic input was found to be important for the seismic risk assessment of low- to mid-rise buildings, and further investigations are warranted in the future. Furthermore, the aftershock effects should also be integrated in the design of Canadian buildings.
Conflict of Interest Statement
The authors declare that the research was conducted in the absence of any commercial or financial relationships that could be construed as a potential conflict of interest.
Acknowledgments
Ground motion data for Japanese earthquakes and worldwide crustal earthquakes were obtained from the K-NET/KiK-net/SK-net databases at http://www.kyoshin.bosai.go.jp/ and http://www.sknet.eri.u-tokyo.ac.jp/, and the PEER-NGA database at http://peer.berkeley.edu/nga/index.html, respectively. This work was supported by the Natural Science Engineering Research Council Canada (RGPIN-2014-05013) to the first author and the Engineering and Physical Sciences Research Council (EP/M001067/1) to the second author.
References
Altoontash, A. (2004). Simulation and Damage Models for Performance Assessment of Reinforced Concrete Beam-Column Joints. Doctoral Dissertation, Stanford University, Stanford, CA.
ATC. (2002). Rapid Visual Screening of Buildings for Potential Seismic Hazard: A Handbook, 2nd Edn. Washington, DC: Applied Technology Council.
Atkinson, G. M. (2004). “An overview of developments in seismic hazard analysis,” in 13th World Conference on Earthquake Engineering Vancouver, BC, Paper No. 5001.
Atkinson, G. M., and Goda, K. (2011). Effects of seismicity models and new ground motion prediction equations on seismic hazard assessment for four Canadian cities. Bull. Seismol. Soc. Am. 101, 176–189. doi: 10.1785/0120100093
Baker, J. W. (2011). The conditional mean spectrum: a tool for ground motion selection. J. Struct. Eng. 137, 322–331. doi:10.1061/(ASCE)ST.1943-541X.0000215
Bruneau, M., and Lamontagne, M. (1994). Damage from 20th century earthquakes in Eastern Canada and seismic vulnerability of unreinforced masonry buildings. Can. J. Civil Eng. 21, 643–662. doi:10.1139/l94-065
Christidis, A. A., Dimitroudi, E. G., Hatzigeorgiou, G. D., and Beskos, D. E. (2013). Maximum seismic displacements evaluation of steel frames from their post-earthquake residual deformation. Bull. Earthq. Eng. 11, 2233–2248. doi:10.1007/s10518-013-9490-z
Christopoulos, C., Pampanin, S., and Priestley, M. J. N. (2003). Performance-based seismic response of frame structures including residual deformations – part I: single-degree-of-freedom system. J. Earthq. Eng. 7, 97–118. doi:10.1080/13632460309350443
Cornell, C. A., and Krawinkler, H. (2000). Progress and Challenges in Seismic Performance Assessment. PEER Center News 3. Available at: http://peer.berkeley.edu/news/2000spring/performance.html
DeVall, R. H. (2003). Background information for some of the proposed earthquake design provisions for the 2005 edition of the National Building Code of Canada. Can. J. Civil Eng. 30, 279–286. doi:10.1139/l02-048
Elwood, K. J. (2013). Performance of concrete buildings in the 22 February 2011 Christchurch earthquake and implications for Canadian codes. Can. J. Civil Eng. 40, 759–776. doi:10.1139/cjce-2011-0564
Erochko, J., Christopoulos, C., Tremblay, R., and Choi, H. (2011). Residual drift response of SMRFs and BRB frames in steel buildings designed according to ASCE 7-05. J. Struct. Eng. 137, 589–599. doi:10.1061/(ASCE)ST.1943-541X.0000296
FEMA 356. (2000). Prestandard and Commentary for the Seismic Rehabilitation of Buildings. Washington, DC: Federal Emergency Management Agency.
FEMA P-58-1. (2012). Seismic Performance Assessment of Buildings Volume 1 – Methodology. Washington, DC: Federal Emergency Management Agency.
Foo, S., and Davenport, A. (2003). Seismic hazard mitigation for buildings. Nat. Hazards (Dordr.) 28, 517–535. doi:10.1023/A:1022950629065
Goda, K., and Atkinson, G. M. (2011). Seismic performance of wood-frame houses in South-Western British Columbia. Earthq. Eng. Struct. Dyn. 40, 903–924. doi:10.1002/eqe.1068
Goda, K., Pomonis, A., Chian, S. C., Offord, M., Saito, K., Sammonds, P., et al. (2013). Ground motion characteristics and shaking damage of the 11th March 2011 Mw9.0 Great East Japan earthquake. Bull. Earthq. Eng. 11, 141–170. doi:10.1007/s10518-012-9371-x
Goda, K., and Taylor, C. A. (2012). Effects of aftershocks on peak ductility demand due to strong ground motion records from shallow crustal earthquakes. Earthq. Eng. Struct. Dyn. 41, 2311–2330. doi:10.1002/eqe.2188
Goda, K., and Tesfamariam, S. (2015). Multi-variate seismic demand modelling using Copulas: application to non-ductile reinforced concrete frame in Victoria, Canada. Struct. Saf. 56, 39–51. doi:10.1016/j.strusafe.2015.05.004
Goda, K., Wenzel, F., and De Risi, R. (2015). Empirical assessment of nonlinear seismic demand of mainshock-aftershock ground motion sequences for Japanese earthquakes. Front. Built Environ. 1:6. doi:10.3389/fbuil.2015.00006
Haselton, C. B., Liel, A. B., Lange, S. T., and Deierlein, G. G. (2008). Beam-Column Element Model Calibrated for Predicting Flexural Response Leading to Global Collapse of RC Frame Buildings. PEER Report 2007/03. Berkeley, CA: PEER Center, University of California, Berkeley.
Hatzigeorgiou, G. D., and Beskos, D. E. (2009). Inelastic displacement ratios for SDOF structures subjected to repeated earthquakes. Eng. Struct. 31, 2744–2755. doi:10.1016/j.engstruct.2009.07.002
Hatzigeorgiou, G. D., and Liolios, A. A. (2010). Nonlinear behaviour of RC frames under repeated strong ground motions. Soil Dyn. Earthq. Eng. 30, 1010–1025. doi:10.1016/j.soildyn.2010.04.013
Hatzigeorgiou, G. D., Papagiannopoulos, G. A., and Beskos, D. E. (2011). Evaluation of maximum seismic displacements of SDOF systems from their residual deformation. Eng. Struct. 33, 3422–3431. doi:10.1016/j.engstruct.2011.07.006
Hyndman, R. D., and Rogers, G. C. (2010). Great earthquakes on Canada’s west coast: a review. Can. J. Earth Sci. 47, 801–820. doi:10.1139/E10-011
Ibarra, L. F., Medina, R. A., and Krawinkler, H. (2005). Hysteretic models that incorporate strength and stiffness deterioration. Earthq. Eng. Struct. Dyn. 34, 1489–1511. doi:10.1002/eqe.495
Kawashima, K., MacRae, G. A., Hoshikuma, J., and Nagaya, K. (1998). Residual displacement response spectrum. J. Struct. Eng. 124, 523–530. doi:10.1061/(ASCE)0733-9445(1998)124:5(523)
Leite, J., Lourenco, P. B., and Ingham, J. M. (2013). Statistical assessment of damage to churches affected by the 2010-2011 Canterbury (New Zealand) earthquake sequence. J. Earthq. Eng. 17, 73–97. doi:10.1080/13632469.2012.713562
Liel, A. B., and Deierlein, G. G. (2008). Assessing the Collapse Risk of California’s Existing Reinforced Concrete Frame Structures: Metrics for Seismic Safety Decisions. Technical Report No. 166. Stanford, CA: John A. Blume Center Earthquake Engineering Center.
Luco, N., and Bazzurro, P. (2007). Does amplitude scaling of ground motion records result in biased nonlinear structural drift responses? Earthq. Eng. Struct. Dyn. 36, 1813–1835. doi:10.1002/eqe.695
MacRae, G. A., and Kawashima, K. (1997). Post-earthquake residual displacements of bilinear oscillators. Earthq. Eng. Struct. Dyn. 26, 701–716. doi:10.1002/(SICI)1096-9845(199707)26:7<701::AID-EQE671>3.3.CO;2-9
McKenna, F., Fenves, G. L., and Scott, M. H. (2000). Open System for Earthquake Engineering Simulation. Berkeley, CA: University of California Berkeley.
McNeil, A. J., Frey, R., and Embrechts, P. (2005). Quantitative Risk Management: Concepts, Techniques and Tools. Princeton, NJ: Princeton University Press.
Mitchell, D., Paultre, P., Tinawi, R., Saatciouglu, M., Tremlay, R., Elwood, K., et al. (2010). Evolution of seismic design provisions in the National Building Code of Canada. Can. J. Civil Eng. 37, 1157–1170. doi:10.1139/L10-054
NRCC. (1941). National Building Code of Canada. Associate Committee on the National Building Code. Ottawa, ON: National Research Council of Canada.
NRCC. (1965). National Building Code of Canada. Associate Committee on the National Building Code. Ottawa, ON: National Research Council of Canada.
NRCC. (1970). National Building Code of Canada. Associate Committee on the National Building Code. Ottawa, ON: National Research Council of Canada.
Onur, T., Ventura, C. E., and Finn, W. D. L. (2005). Regional seismic risk in British Columbia – damage and loss distribution in Victoria and Vancouver. Can. J. Civil Eng. 32, 361–371. doi:10.1139/l04-098
Otani, S. (2004). Earthquake resistant design of reinforced concrete buildings past and future. J. Adv. Concr. Technol. 2, 3–24. doi:10.3151/jact.2.3
Pampanin, S., Christopoulos, C., and Priestley, M. J. N. (2003). Performance-based seismic response of frame structures including residual deformations – part II: multi-degree-of-freedom systems. J. Earthq. Eng. 7, 119–147. doi:10.1080/13632460309350444
Rainer, J. H. (1992). Manual for Screening of Buildings for Seismic Investigation. Institute for Research in Construction. Ottawa: National Research Council of Canada.
Ramirez, C. M., and Miranda, E. (2009). Building-Specific Loss Estimation Methods & Tools for Simplified Performance-Based Earthquake Engineering. Technical Report No. 171. Stanford, CA: John A. Blume Center Earthquake Engineering Center.
Ruiz-García, J., and Miranda, E. (2006). Evaluation of residual drift demands in regular multi-storey frames for performance-based seismic assessment. Earthq. Eng. Struct. Dyn. 35, 1609–1629. doi:10.1002/eqe.593
Ryu, H., Luco, N., Uma, S. R., and Liel, A. B. (2011). “Developing fragilities for mainshock-damaged structures through incremental dynamic analysis,” in Proceedings, Ninth Pacific Conference on Earthquake Engineering, Building an Earthquake-Resilient Society, Auckland.
Saatcioglu, M., Shooshtari, M., and Foo, S. (2013). Seismic screening of buildings based on the 2010 National Building Code of Canada. Can. J. Civil Eng. 40, 483–498. doi:10.1139/cjce-2012-0055
SEAOC. (1995). Vision 2000: Performance-Based Seismic Engineering of Buildings. Sacramento, CA: Structural Engineers Association of California.
Tesfamariam, S., and Goda, K. (2015). Loss estimation for non-ductile reinforced concrete building in Victoria, British Columbia, Canada: effects of mega-thrust Mw9-class subduction earthquakes and aftershocks. Earthq. Eng. Struct. Dyn. 44, 2303–2320. doi:10.1002/eqe.2585
Tesfamariam, S., Goda, K., and Mondal, G. (2015). Seismic vulnerability of RC frame with unreinforced masonry infill due to mainshock-aftershock earthquake sequences. Earthq. Spectra 31, 1427–1449. doi:10.1193/042313EQS111M
Tesfamariam, S., and Saatcioglu, M. (2008). Risk-based seismic evaluation of reinforced concrete buildings. Earthq. Spectra 24, 795–821. doi:10.1193/1.2952767
Uma, S. R., Pampanin, S., and Christopoulos, C. (2010). Development of probabilistic framework for performance-based seismic assessment of structures considering residual deformations. J. Earthq. Eng. 14, 1092–1111. doi:10.1080/13632460903556509
Vamvatsikos, D., and Cornell, C. A. (2002). Incremental dynamic analysis. Earthq. Eng. Struct. Dyn. 31, 491–514. doi:10.1002/eqe.141
Keywords: seismic performance, maximum inter-story drift, residual inter-story drift, non-code conforming reinforced concrete building, mainshock–aftershock earthquake
Citation: Tesfamariam S and Goda K (2015) Seismic performance evaluation framework considering maximum and residual inter-story drift ratios: application to non-code conforming reinforced concrete buildings in Victoria, BC, Canada. Front. Built Environ. 1:18. doi: 10.3389/fbuil.2015.00018
Received: 12 August 2015; Accepted: 17 September 2015;
Published: 07 October 2015
Edited by:
Panagiotis Mergos, City University London, UKReviewed by:
Mohammad Mehdi Kashani, University of Bristol, UKSameh Samir F. Mehanny, Cairo University, Egypt
Anaxagoras Elenas, Democritus University of Thrace, Greece
Copyright: © 2015 Tesfamariam and Goda. This is an open-access article distributed under the terms of the Creative Commons Attribution License (CC BY). The use, distribution or reproduction in other forums is permitted, provided the original author(s) or licensor are credited and that the original publication in this journal is cited, in accordance with accepted academic practice. No use, distribution or reproduction is permitted which does not comply with these terms.
*Correspondence: Solomon Tesfamariam, The University of British Columbia, EME 4253 – 1137 Alumni Avenue, Kelowna, BC V1V 1V7, Canada, solomon.tesfamariam@ubc.ca