Probabilistic capacity assessment of lattice transmission towers under strong wind
 Wei Zhang
 Jin Zhu
 Huijuan Liu
 Huawei Niu
- 1Department of Civil and Environmental Engineering, University of Connecticut, Storrs, CT, USA
- 2Guangxi University, Nanning, China
- 3Wind Engineering Research Center, Hunan University, Changsha, China
Serving as one key component of the most important lifeline infrastructure system, transmission towers are vulnerable to multiple nature hazards including strong wind and could pose severe threats to the power system security with possible blackouts under extreme weather conditions, such as hurricanes, derechoes, or winter storms. For the security and resiliency of the power system, it is important to ensure the structural safety with enough capacity for all possible failure modes, such as structural stability. The study is to develop a probabilistic capacity assessment approach for transmission towers under strong wind loads. Due to the complicated structural details of lattice transmission towers, wind tunnel experiments are carried out to understand the complex interactions of wind and the lattice sections of transmission tower and drag coefficients and the dynamic amplification factor for different panels of the transmission tower are obtained. The wind profile is generated and the wind time histories are simulated as a summation of time-varying mean and fluctuating components. The capacity curve for the transmission towers is obtained from the incremental dynamic analysis (IDA) method. To consider the stochastic nature of wind field, probabilistic capacity curves are generated by implementing IDA analysis for different wind yaw angles and different randomly generated wind speed time histories. After building the limit-state functions based on the maximum allowable drift to height ratio, the probabilities of failure are obtained based on the meteorological data at a given site. As the transmission tower serves as the key nodes for the power network, the probabilistic capacity curves can be incorporated into the performance-based design of the power transmission network.
Introduction
Serving as one key component of the lifeline infrastructure system, electrical transmission networks, and distribution systems including transmission towers and lines are under a complex set of multiple threats from natural and manmade hazards. Possible failures from transmission towers and lines and associated large area blackouts could pose severe threats to the power system security, which has been a great challenge for the stakeholders, decision makers, and the whole society. In the Americas, Australia, and South Africa, about 80% of the transmission tower failures are due to the strong wind loadings from tornados, hurricanes, or isolated thunderstorms and such failures could lead to large area power outages (Dempsey and White, 1996; McCarthy and Melsness, 1996, Savory et al., 2001; De Oliveira et al., 2006, Jacobs, 2013). For example, over five million people in the U.S. West Coast lost power on December 22, 1982 after high winds knocked over a major 500-kV transmission tower, which fell into a parallel 500-kV line tower. The failure mechanically cascaded and caused three additional towers to fail on each line (Jacobs, 2013). More recently, large area blackout during Hurricane Sandy in October 2012 for 8.2 million people in 17 states, the District of Columbia and Canada and June 2012 Derecho for 4.2 million people in 11 Midwest and Mid-Atlantic states and the District of Columbia were also related to strong winds and associated tree falling and wire breakage in extreme weather conditions.
To avoid future transmission tower failure and achieve a quick recovery of regional areas from future extreme nature hazards, understanding the structural capacity and the characteristics of interactions between the transmission tower and strong wind are essential for the power system’s safety and reliability. Therefore, many codes, specifications, or manuals are available for the transmission tower design, such as the ANSI National Electric Safety Code (NESC) (ANSI 2006), the International Electrotechnical Commission (IEC) Standard 60826:2003 (IEC 2003), and the ASCE Manual 74 (American Society of Civil Engineers (ASCE), 2010), etc. In these codes or design manuals, an orthogonal approach is used to model the wind loads for transmission tower. The wind loads are only modeled as loads in the transverse and longitudinal directions. However, with significant difference of wind drag forces in different wind directions, wind loads could be significantly diverted with those defined in the codes (Mara, 2013). Meanwhile, the drag coefficient of the lattice frames is based on the solidity ratio in the design codes, which could not effectively illustrate the wind-structure interactions for different structural geometries. For a better illustration of wind-structure interactions, wind tunnel tests are carried out to find better expressions for the drag coefficient of the tower and the cable for different wind directions and study their dynamic responses (Loredo-Souza and Davenport, 2001; Okamura et al., 2003, Mara and Ho, 2011; Loredo-Souza, 2014).
In addition, due to the localized and unpredictable characteristic of local wind environments, wind profiles, and time histories could be different for different sites with different meteorological data. During an extreme storm event, the wind could be non-stationary based on the anemometry data and transient flow from such non-stationary gusts could have significant effects on structural responses (Schroeder and Smith, 1999; Wu et al., 2001, Letchford et al., 2002). Meanwhile, due to the rising average temperatures accompanying a more variable climate system, the extreme weather events are becoming more common leading to an increase of extreme hazards, such as those from hurricanes, isolated severe thunderstorms, and tornados (Semenov and Barrow, 1997; Meehl et al., 2000, Jentsch et al., 2007). To evaluate the potential risk of the transmission power system including the transmission towers, it is essential to evaluate the structural performance in multiple limit states for different failure modes with an effective methodology to include the associated uncertainties from structure and the surrounding environment and to build fragility curves for performance-based design of the structural system for risk analysis.
The present study focuses on building effective capacity assessment approach for transmission towers subjected to strong winds. A new probabilistic capacity assessment approach for transmission towers under strong wind loads is proposed and implemented for a 3-D lattice tower. At first, the wind loading for the transmission tower are modeled based on the randomly generated wind time history as a summation of time-varying mean and fluctuating components. The varied drag coefficients for different panels and wind yaw angles are obtained from wind tunnel experiments. To assess the structural capacity in different yaw angles of wind loadings, incremental dynamic analysis (IDA) is carried out and sets of IDA curves are created to predict the probabilistic capacity curves. Based on the meteorological data for a given site, the probability of failure for all wind yaw angles is evaluated with defined limit states and the risk analysis for transmission tower can be carried out. The paper is organized as the following four main sections. In the first section, the wind-structure dynamic system is modeled. The finite element model of the transmission tower is built and stochastic wind field is generated. In the second section, the wind tunnel experiments for the transmission tower are introduced and the wind loading coefficients are obtained. In the third section, the IDA analysis for capacity assessment is introduced and the capacity curves for different wind directions are obtained. In the fourth section, the set of IDA curves are obtained for probabilistic capacity assessment and the approach is summarized, as well. After defining limit states, the probabilities of failure for the transmission tower are obtained for wind speeds in different return periods using the meteorological data at a given site.
Modeling the Wind-Tower Dynamic System
Finite Element Modeling of the Transmission Tower
The lattice transmission towers are built with L-shape steel members and truss, beam elements or their combinations are usually used to model the structure. The material non-linearity and the geometric non-linearity are included by using bilinear elastoplastic material properties and by implementing large deformation analysis, respectively.
To effectively present the proposed probabilistic capacity assessment methodology, the finite element model for a 550-kV single circuit lattice transmission tower is built first for the structural capacity analysis. The tower is 68.6 m high and the side length of the square base for the tower is 14.094 m. The prototype transmission tower is shown in Figure 1. The finite element model is built in the commercial software ANSYS using 3D beam elements (Beam 188) with a total of 2107 elements and 1708 nodes. The four nodes at the ground level are fixed. After defining the material properties for the elements and boundary conditions, the mode analysis is carried out in ANSYS to find the mode frequencies and mode shapes. Based on the modal analysis, the first mode is lateral vibration with a frequency of 1.631 Hz and the second mode is longitudinal vibration with a frequency of 1.706 Hz. The first two model shapes are shown in Figure 2 and the first six modes are summarized in Table 1.
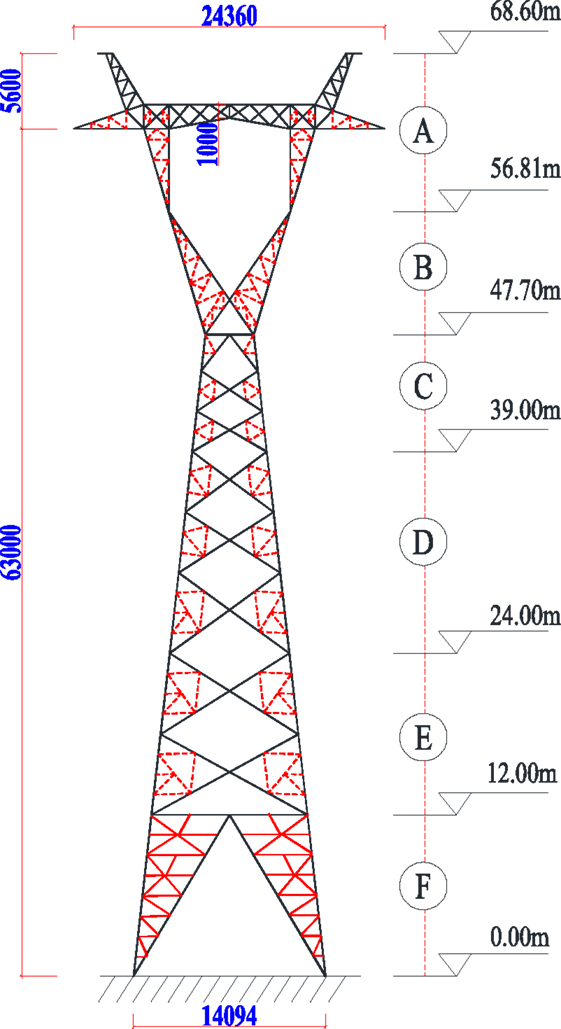
Figure 1. Model of the transmission tower.
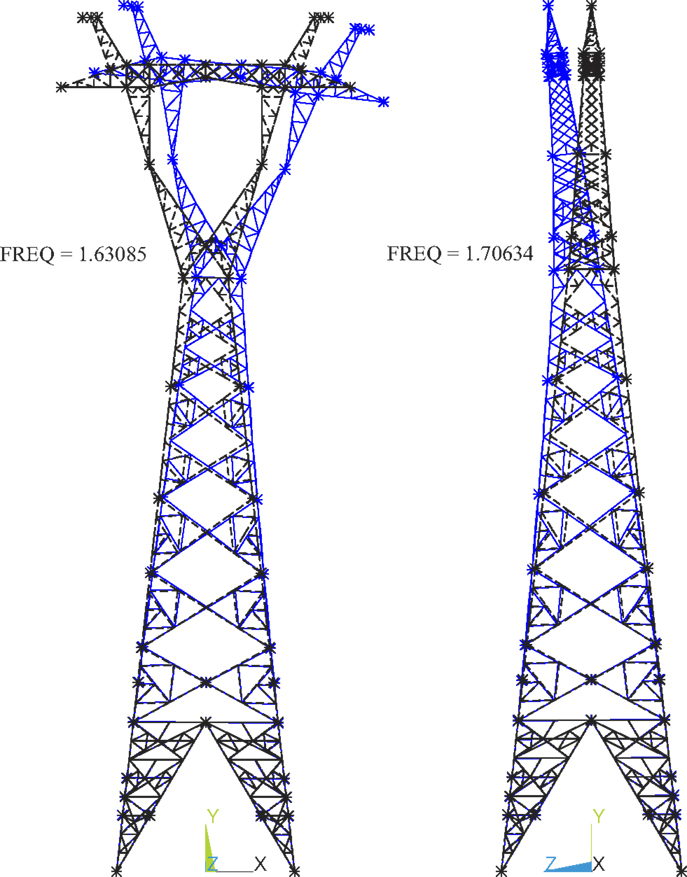
Figure 2. First two model shapes.
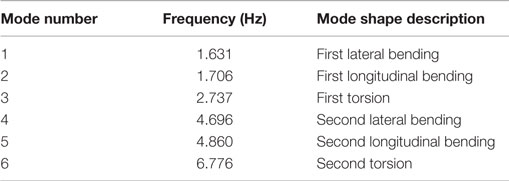
Table 1. First six modes.
Modeling of Wind Loads
As shown in Figure 1, the transmission tower has varied geometries in different heights and could have varied wind loadings in natural wind environment. As a result, multiple subsections of the transmission tower are defined as loading panels along the tower to differentiate the wind loads of the tower in different height. The drag wind load for each panel in a given wind yaw angle can be obtained by Mara (2013):
where ρ is the air density, V is the wind speed at the height of the section, Cd is the drag coefficient, and Ap is the projected area of the test subsection in the plane that is perpendicular to the incoming wind. In many wind design codes for transmission towers, the drag coefficient is defined as a function of solidity ratio. In the present paper, the drag coefficients are obtained through wind tunnel experiments, which will be detailed in the following sections.
Wind fluctuations can be treated as stationary Gaussian process and could be simulated using a superposition of trigonometric functions with random phase angles or the spectral representation method (Shinozuka and Deodatis, 1991; Kareem, 2008). In the present study, Kaimal’s spectrum is used for longitudinal wind fluctuation component. The simulated wind turbulence at a mean wind speed of 8 m/s and the comparison of the spectrum calculated from the simulated wind turbulence time history and the target wind spectrum is shown in Figure 3.
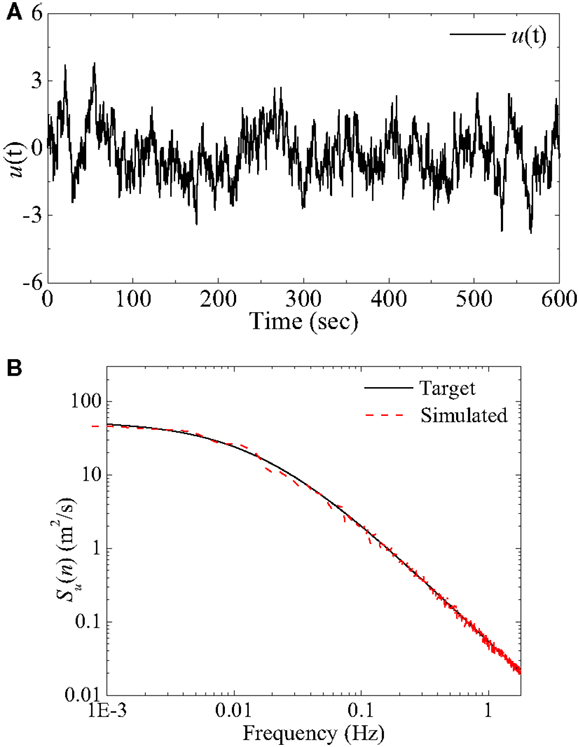
Figure 3. Simulated lateral wind turbulence. (A) Turbulence time history [u(t): m/s]. (B) Simulated and target spectrum.
Wind Environment
In the present study, the historical wind data from one meteorological observatory (Xiaoyangshan Meteorological Observatory) are adopted in the probabilistic capacity assessment approach for a demonstration purpose (Ge et al., 2003; Zhang et al., 2013). Maximum observed wind speeds at 10 m height and probabilities of the 12 wind directions in a typical year can be obtained based on the 4-year continuous records as shown in Figure 4A. Based on the statistical tests of the datasets, Extreme type I distribution is used for wind speed distributions for all wind directions and the parameters for the distribution are obtained (Ge et al., 2003). Therefore, 50, 100, and 300-year return period wind speed can be obtained, which are shown in Figure 4B. It is noteworthy that the observatory site is located at east coast of China, which is exposed to the strong wind from tropical cyclones or typhoons (Ge et al., 2003; Zhang et al., 2013).
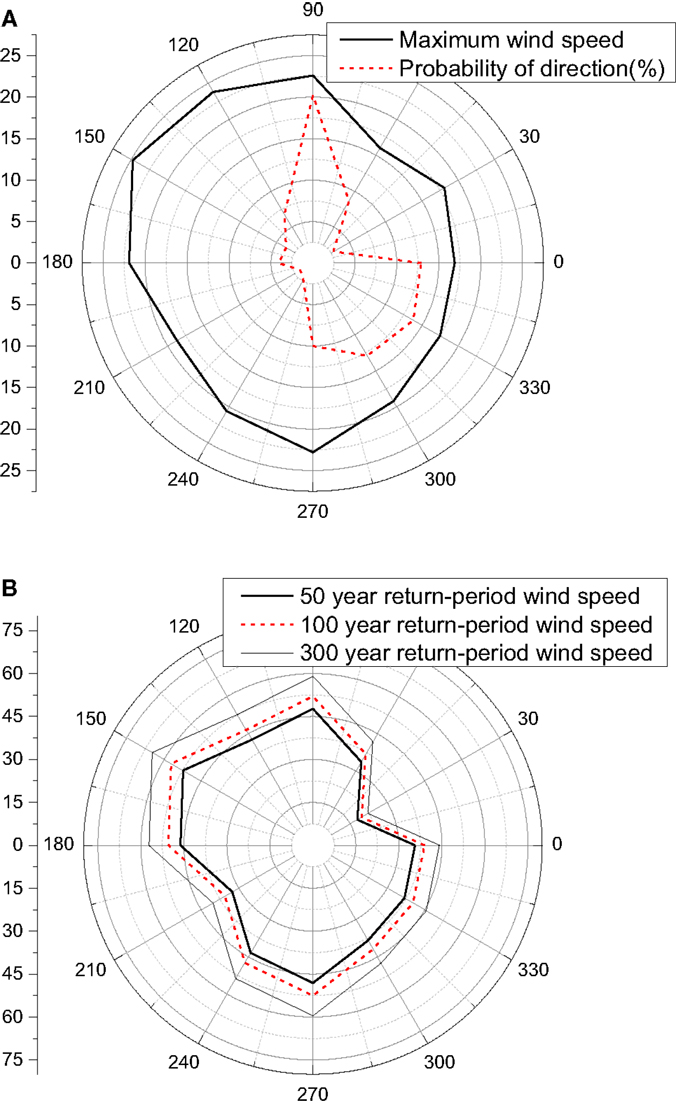
Figure 4. Wind speed and direction. (A) Maximum wind (m/s) and probability of direction. (B) Wind speeds (m/s) for different return periods.
Wind Tunnel Experiments
Setup of Wind Tunnel Experiment
In the present study, the wind-structure interactions are simplified as wind loading on structures using Eq. 1 and the wind drag coefficient Cd can be obtained through wind tunnel experiments. The wind tunnel experiments for the transmission tower were carried out in HD-2 wind tunnel at Hunan University, China. A rigid model for measuring drag coefficient Cd and an aeroelastic model for gust response factor (GSF) G were built separately. The test section in the wind tunnel is 2.5 m high, 3.0 m wide, and 17.0 m long. To achieve a better measurement of the interactions between wind and L-shape structural member, a 1/40 scale is used considering the height of the working section of the wind tunnel and model fabrication accuracy. The aeroelastic model in the wind tunnel is shown in Figure 5 and the wind profile in the wind tunnel is generated by using the passive devices of spires, fences, and roughness blocks. The wind velocity and turbulence intensity profiles of the wind tunnel are shown in Figure 6. As shown in the figure, the wind profile of the wind tunnel matches well with the power law wind profiles for the power law exponent of 1/0.16 = 6.25, which is defined as Exposure B in the Chinese code. It is noteworthy that the Exposure B in ASCE7 is defined a little different and the exponent α is 7.0. The turbulence intensity profile of the wind tunnel matches well with the one defined in the Chinese Code. However, it has large differences with the one defined in the ASCE7-05.
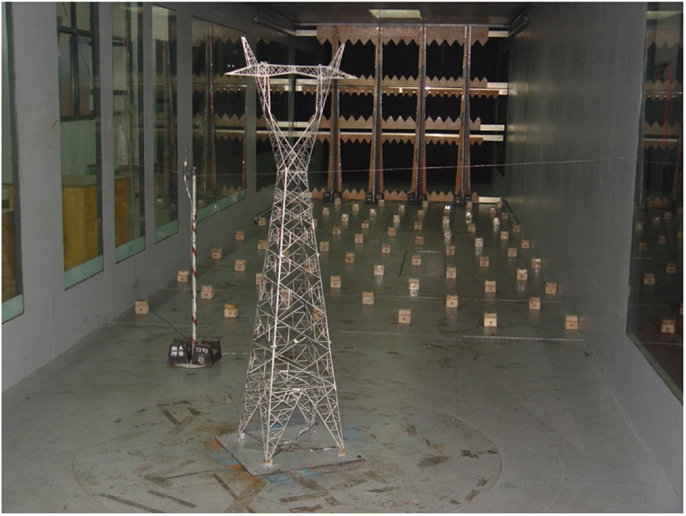
Figure 5. Aeroelastic model in wind tunnel.
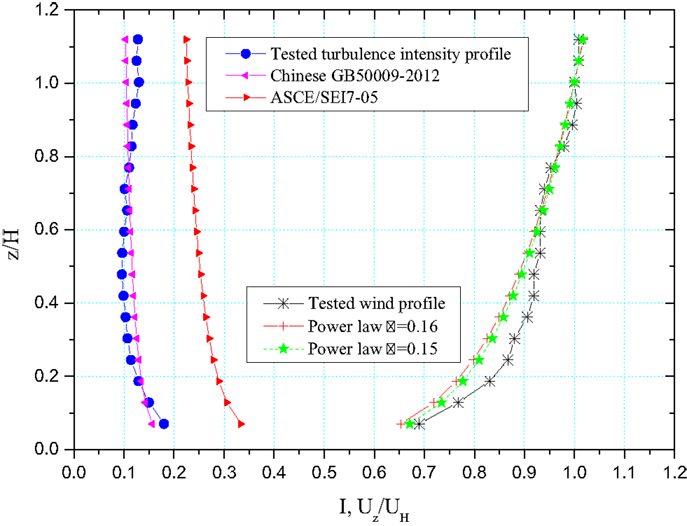
Figure 6. Wind profile and turbulence intensity.
Drag Coefficients
To obtain the drag coefficient Cd at different heights, the rigid transmission tower is divided into six sections, as shown in Figure 1 corresponding to those defined in the finite element model. The assembled structure model segments were connected to a six-component force balance, which was fixed in a turntable in the wind tunnel. The drag force signals are recorded by the force balance and the drag coefficients for every subsection at different yaw angles in the smooth flow were calculated using the following equation:
where FX, FY are the static drag forces along body axis X and Y and β is the wind yaw angle defined in Figure 7, and U is the mean wind speed of the coming flow at the height of 0.25 m, which corresponds to the 10-m height of the prototype transmission tower. The wind velocity is measured by 3D cobra probe. The tested drag coefficients for each subsection and yaw angle are shown in Figure 8. As shown in Figure 8, the drag coefficients vary with yaw angles. Similar results can be found in Mara’s work (Mara and Hong, 2013) and it is noteworthy that in the current ASCE code, drag coefficients are only defined in the transverse and longitudinal directions.
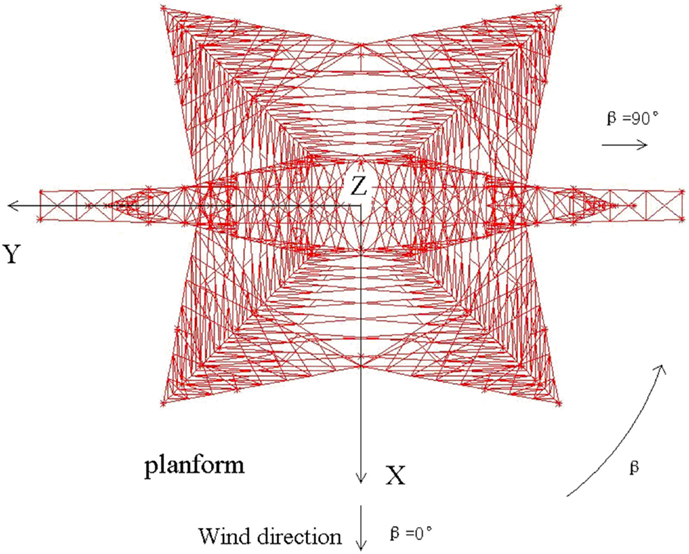
Figure 7. Definition of test yaw angle and body axes.
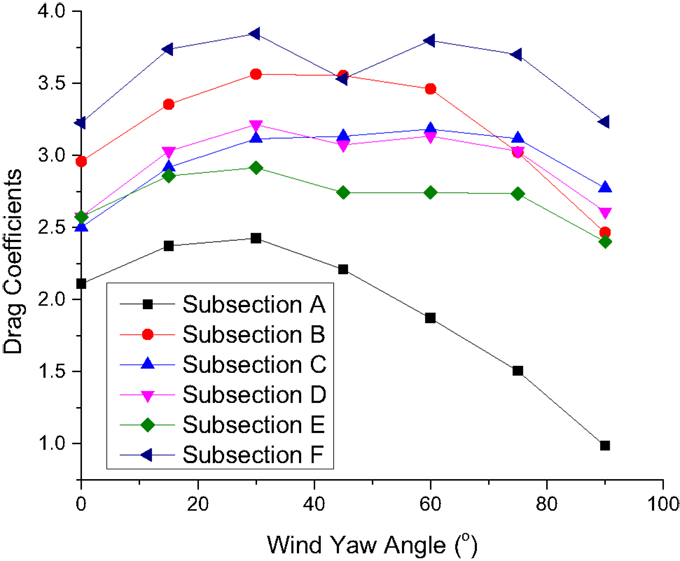
Figure 8. Drag coefficients for subsections.
Since the transmission tower has a square base, the drag coefficients for subsections D–F only have limited differences for the yaw angle of 0° and 90°. With the increase of the height, the tower shape change gradually. The drag coefficients have 11% difference for subsection C in 0° and 90°, 20% difference for subsection B, and 110% difference for subsection A. For all subsections, the maximum drag coefficients are at the yaw angle of 30°. In the present paper, for a demonstration purpose, only four yaw wind yaw angles of 0°, 30°, 60°, and 90° will be used to evaluate wind–tower interactions.
Gust Response Factor
Gust response factor is used to consider the dynamic effect of turbulent flow. A series of wind tunnel experiments were carried out for the aeroelastic tower model and the buffeting responses at different yaw angles of the model were measured. Based on a sensitivity study, the stiffness for the transmission tower is found to be provided mainly by the four major vertical columns and the contributions from lateral bending of each L-shape steel member are relatively small (Hua et al., 2014). Therefore, only the similarity of axial stiffness is considered in the model and the aeroelastic model was built with aluminum with a scaled area and axial stiffness. The accelerometers were installed at four heights of the model to capture the acceleration signals in the wind tunnel experiments. Based on the recorded acceleration signals at four height levels of the model, GSF for the tower can be calculated by
where, Pd and Ps are dynamic load and static load, respectively; CD(z) is the drag coefficient of the subsection at height z; μz(z) is the wind pressure height coefficient; is the basic wind pressure; Ap(z) is the net projected area of the test subsection in the plane that is perpendicular to the incoming wind of the subsection at height z; M(z) is the mass of the subsection at height z; Ga is the peak factor of the acceleration; and σa(z) is the root mean square deviation of acceleration response. The gust loading factors for different subsections (SS-A to SS-F) at different wind yaw angles were obtained and shown in Figure 9 at a wind speed of 20 m/s for the tower prototype.
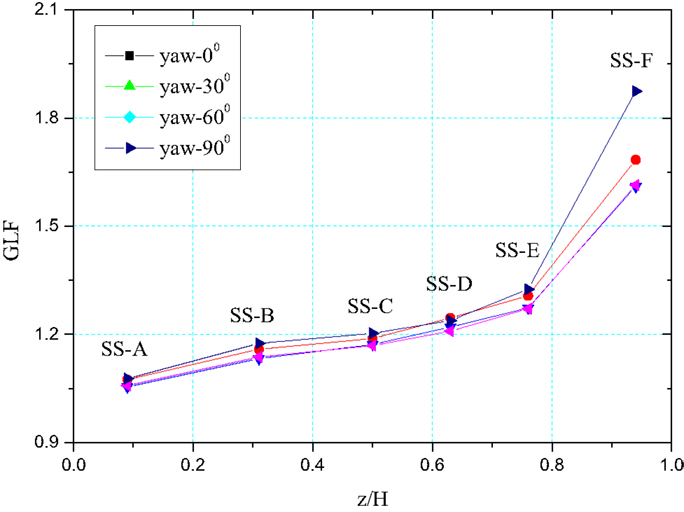
Figure 9. Gust loading factors for subsections.
As shown in the figure, the gust loading factors increase with the height of the subsection. When the height ratio (z/H) is <0.8, the gust loading factor is around 1.0–1.3. The differences of GLF in each yaw angle range from 3 to 9% and increase with the height ratio. However, after the height ratio exceeds 0.8, the gust loading factor can be over 1.5 and reach 1.9 when β = 0°. Based on the height and the net projected area of the subsection in the incoming wind direction, the weighted mean gust loading factor for the tower can be calculated as , where Gi and hi and the gust loading factor and height for each subsections. The calculated weighted mean gust loading factor falls in the range of 1.19 (β = 0°) to 1.23 (β = 90°).
Incremental Dynamic Analysis
Dynamic Analysis
Based on the wind loading defined in Eq. 1 and drag coefficients Cd obtained from wind tunnel experiments, the dynamic analysis of the wind–transmission tower system can be simulated in the time domain and the time histories could be obtained. Figures 10A,B show the time history of top tip displacement and base shear force at wind speed of 8 m/s and wind yaw angel β = 0°. Based on the data in Figures 10A,B, the GSF of 2.04 and 1.82 can be obtained for top tip displacement and base shear force, respectively.
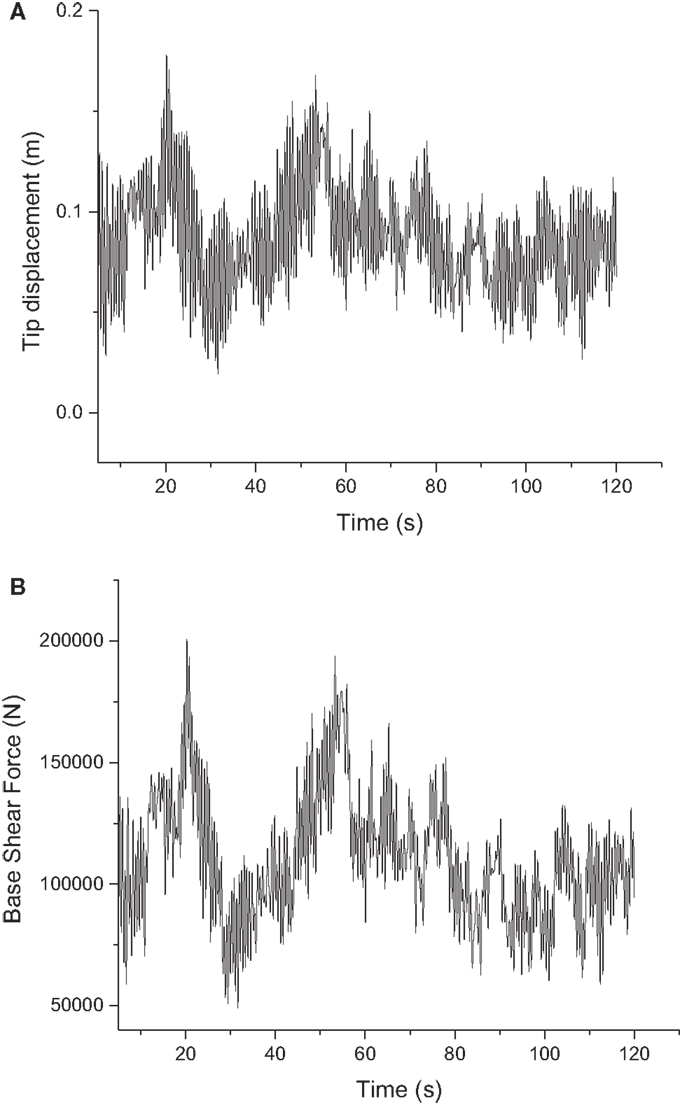
Figure 10. Time history for top tip displacement and base shear force. (A) Top tip displacement. (B) Base shear force.
Meanwhile, the dynamic effects of wind loading are usually considered in the design codes as a dynamic amplification factor, such as GSF in ASCE74. The wind loading for each panel in a given wind angle is calculated using the following equation (American Society of Civil Engineers (ASCE), 2010):
where γw is the load factor to adjust the wind load for the desired return period; V50 is the 3-s gust basic wind speed with a 50-year return period; Kz is the velocity pressure exposure coefficient; Kzt is the topographic factor; Q is a numerical constant, which reflects the mass density of air for the standard atmosphere; G is the GSF for conductors, ground wires, and structures; and Cd is the drag force coefficient values and A is the area projected on a plane normal to the wind direction. Compared with the GSF obtained from wind tunnel experiments, larger GSFs can be obtained using the dynamic analysis approach. In the present study, the dynamic analysis approach will be used for capacity analysis.
Based on the dynamic analysis, the maximum base shear force and top tip displacement at all wind directions can be obtained as shown in Figures 11A,B, respectively. With the increase of wind speed, the maximum base shear force and top tip displacements increase linearly in elastic range. After yielding begins to develop in structural members, the increase rate of base shear force drops quickly and large top tip displacements can be found even with a small increase of wind speed.
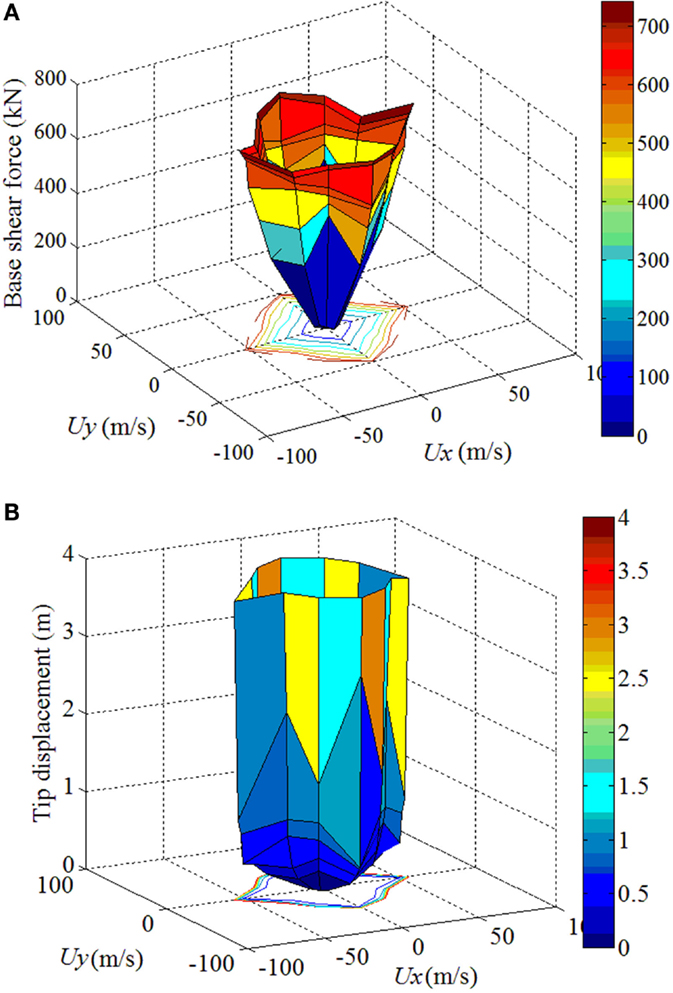
Figure 11. Base shear force and top tip displacement. (A) Base shear force. (B) Top tip displacement.
Incremental Dynamic Analysis Approach
To assess the global behavior of a structure from its elastic response to global dynamic instability through yielding and non-linear response, the IDA has been widely used for structure performance under earthquake loading. By analogy with passing from a single static analysis to the incremental static push over (SPO), the seismic loading is scaled to extend the single time history analysis into an incremental one (Vamvatsikos and Cornell, 2002). Since the IDA concept has been first mentioned by Bertero in 1977, IDA has been developed to build upon the results for probabilistic seismic hazard analysis to estimate the risk for a given structure. Meanwhile, FEMA (2000a,b) has adopted IDA to determine the global collapse capacity. Recently, the IDA method has been applied to assess the structural capacity of transmission towers under wind loading (Banik et al., 2008, 2010, Mara, 2013). Unlike the seismic loading with a zero mean stochastic excitations, the wind effects are not zero mean loading. The wind loadings include mean wind loading component and fluctuating buffeting wind loading component due to the wind turbulence. In the present study, a stepping algorithm is applied, where the wind loads are increased by steps until structural collapse and the wind loads at each panel were evenly distributed to the nodes in the subsections.
To define a limit state for the structural model, damage measure (DM) is defined as a non-negative scalar that characterizes the additional response of the structural model to a prescribed loading, which could be obtained through a corresponding non-linear dynamic analysis, such as a seismic analysis (Vamvatsikos and Cornell, 2002). For performance-based design, multiple DMs could be chosen to assess different response characteristics, limit states, or different failure modes. In the present study, the maximum top tip displacement and maximum base shear force are selected as DMs. For each of the four wind directions considered in the present study, the IDA is carried out and the time histories of the transmission tower top tip displacement and base shear force are obtained for each wind speed and direction. Meanwhile, to investigate whether the capacity curves are representative for longer durations for wind-structure interactions, a sensitivity analysis for the IDA analysis was carried for 35 s, 1 min, and 2 min simulations. As the maximum values for both of the base shear forces and top tip displacements are found to be within the first 35 s, the IDA analysis is based on 35 s simulations to save calculation cost.
Capacity Curve for Wind Loading in Longitudinal Direction
The capacity curves are obtained for the relation between the total base shear force versus the top tip displacement based on the maximum base shear force and corresponding top tip displacement (Curve A), the maximum top tip displacement and corresponding base shear force (Curve B), and the maximum base shear force and the maximum top tip displacement (Curve C). The capacity curves for the transmission tower in longitudinal direction, where β = 0°, are shown in Figure 12, which includes all of the three curves between the top tip displacement and base shear force. As shown in Figure 12, the structure is in an elastic range when the base shear force is below 594 kN and the top tip displacement is below 0.444 m. The corresponding wind speed is 50 m/s. With the increase of the base shear force and the top tip displacement, the structure goes beyond the elastic range and yielding occurs for structural members.
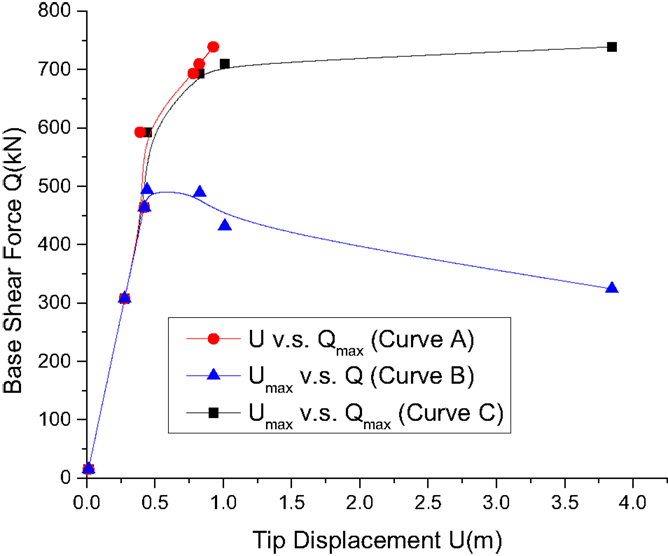
Figure 12. Capacity curve for longitudinal direction (β= 0°).
Capacity Curve for Other Wind Directions
The analysis can be repeated for other wind directions to obtain the relationship between the maximum base shear force and the maximum top tip displacement for all wind directions. Figure 13 shows the base shear force and top tip displacement for different wind yaw angles. In the elastic range, only limited differences can be found for the ratios of the base shear and top tip displacement. When the top tip displacements reach 0.4 m, the first brace-buckling occurs and the structure begins to have non-linear behavior. Comparing with the other wind directions, the maximum base shear forces for 0° are larger than the other directions at the same tip displacements when yielding begins at the top tip displacement of 0.4–0.8 m. When the maximum top tip displacement is 1.37 m, which is 2% of the tower height, the maximum base shear force could range from 590 to 715 kN.
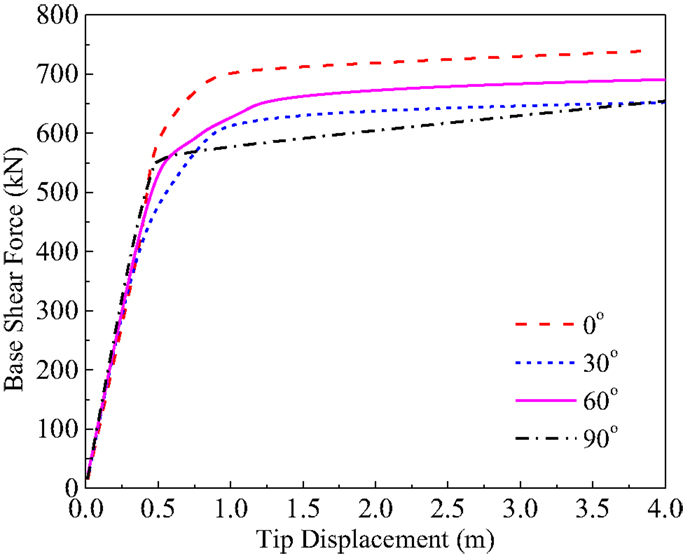
Figure 13. Capacity curves for the four wind directions.
Probabilistic Capacity Assessment
Set of IDA Curves
As the IDA study for seismic loadings is accelerogram and structural model specific, different ground motions could lead to different IDA curves (Vamvatsikos and Cornell, 2002). Similarly, due to the stochastic nature of wind field, the capacity curves obtained from IDA analysis could vary for different wind time history inputs, as well. Therefore, the single IDA study could not capture the structural performance under stochastic wind loadings and multiple IDA curves are needed to cover the full range of responses. For seismic loads, the IDA curve set is defined as a collection of IDA curves for the same structural model under different accelerograms with same intensity measures (IMs) and DM (Vamvatsikos and Cornell, 2002). In the present study, the IDA curve set for wind loadings can be defined in a similar way. The IDA curve set, therefore, is defined for the same structural model under different stochastic wind loadings due to different stochastic wind time histories, which have the same mean wind speed and the same wind spectrum parameters.
For a demonstration purpose, three wind speed time histories are simulated for the IDA analysis in the present study, which lead to three sets of capacity curves. Based on the three sets of capacity curves, the mean, 16%, and 84% IDA curves could be obtained to take into account the inherent randomness with respect to the wind loadings. As shown in Figure 14A, the line represents the mean IDA curve and the 16% and 84% IDA curves form the shaded area in the figure, which has 68% confidence level for the maximum base shear forces. In the elastic range when the displacement is below 0.43 m and the base shear force is below 473 kN, the variances for the wind loading can be neglected. After yielding of some structural members, the coefficient of variation for the base shear force increases to the range of 0.04–0.09. The same trend could be found for the mean IDA curves for other wind yaw angles of β = 30°, 60°, and 90° as shown in Figures 14B–D. As shown in the figure, the shaded areas formed by the 16 and 84% IDA curves for different wind yaw angles are different. When the wind yaw angle β = 30°, large variations only exist at around yield point when the maximum tip displacement is around 0.5 m. Both in the elastic range and the range with large displacement (over 1.5 m), only small variations can be found, which suggests that the yielding starts from different elements. However, only small variations can be found when the members continue to yield toward the final failure, which suggests the same failure modes. When the wind yaw angle β = 60°, variations could be found starting after initial yielding and remains constant at about 0.04. Compared with those at β = 0°, variations are smaller, which suggests that the final failure modes have less variations. Similar trends could be found for β = 90°. For all the wind yaw angles, the maximum mean base shear force reaches its maximum value of 706 kN at β = 60° and the maximum mean base shear force for β = 0°, 30°, and 90° is 674, 668, and 622 kN, respectively. Due to the symmetry of the transmission tower in longitudinal and transverse directions, the IDA curves for the twelve directions from β = 0° to 330° can be grouped into the four directions β = 0°, 30°. For example, the IDA curve for β = 0° can be used for β = 180°; the IDA curve for β = 90° can be shared with β = 270°; β = 30°, 150°, 210°, and 330° are in the same IDA curve group; the IDA curve for β = 60° can also be used for β = 120°, 240°, and 300°.
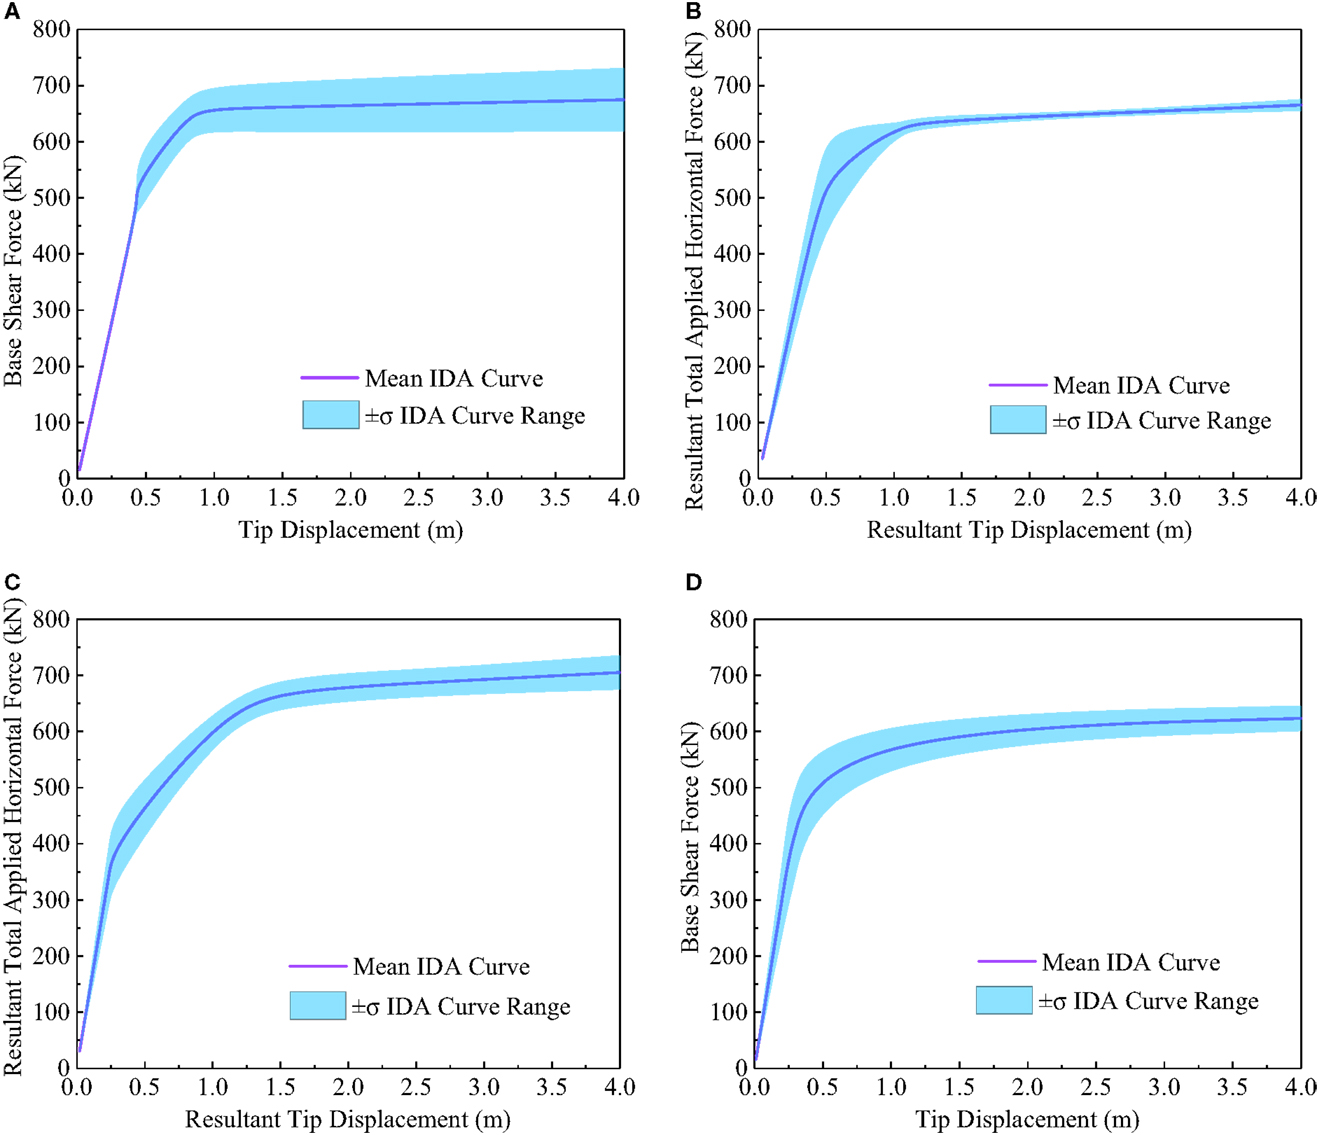
Figure 14. Capacity curve with 68% confidence level (±σ). (A) β = 0°. (B) β = 30°. (C) β = 60°. (D) β = 90°.
Limit States
For a performance-based design framework, structural performance is associated with reaching criteria that a limit-state rule is satisfied. In the present study, as the DMs are defined as damage indicators, the limit states can, therefore, be defined when DMs increase beyond a certain value that the structural model is assumed to be in the limit state. For example, in FEMA guidelines, the maximum drift to height ratio θmax = 2 or 8.5% is defined as the limit state for steel moment-resisting frames (SMRFs) with type-1 connections for the immediate occupancy structural performance level or collapse prevention level (FEMA, 2000b). Since such limit states are not defined in the design code for transmission towers, θmax = 2% is used as the limit state for the transmission towers in the present study for a demonstration purpose. Therefore, in the present study, failure is defined as the maximum drift to height ratio being over θmax, which does not mean a catastrophic collapse. Since the set of IDA curves are dependent on the yaw wind angles, the probability of failure of the structure for the defined limit state could be obtained as
where different i represents the twelve different wind yaw angles from 0° to 330°, αi is the probability of the wind direction at the structure site, and Pf i is the probability of failure for given wind yaw angle αi and could be obtained by evaluating the limit-state function shown below:
where θ is the drift (top tip displacement) to height ratio calculated from IDA analysis, θmax = 2% is the limit state defined for structural capacity, and g is a failure function such that g < 0 implies a structural failure. For the given wind yaw angle, the probability density function for θ could be obtained:
where P(W) is the probability density function of wind speed in given wind direction and P(θ|W) is the conditional probability density function for θ, which can be obtained from analyzing the set of IDA curves.
Probabilistic Capacity Assessment
The probabilistic capacity assessment approach based on IDA analysis is summarized in Figure 15. First, finite element model for the transmission tower is built. The wind loadings can be applied to the structural model by using randomly generated wind speed time histories based on given wind spectrum and wind speed and the wind loading coefficients from wind tunnel experiments. By implementing IDA analysis for different wind yaw angles and different randomly generated wind speed time histories, probabilistic capacity curves, such as those in Figure 14, can be generated. After defining the limit-state function for the structure in different wind yaw angles as shown in Eq. 8, the probability of failure can be obtained based on the meteorological data from a given site or wind speed data for a given return period, such as those in Figure 4.
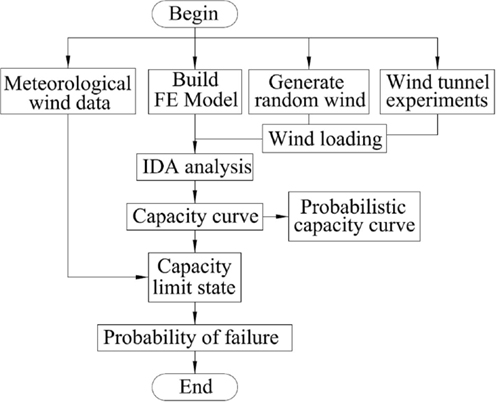
Figure 15. Probabilistic capacity assessment approach.
In the present study, for a 50-year return period wind, as the tower is still in the elastic range for most of the twelve wind yaw angles (except for β = 120°, 150°, and 240°), the probability of failure is 0 by using evaluating Eq. 8. However, for β = 120°, 150°, and 240°, the probability of failure is 6.0e−7, 1, and 9.6e−5. It is noteworthy that the probability of failure is 1 at β = 150°, which suggests that the drift (top tip displacement) to height ratio has exceeded θmax = 2% under that wind speed. The high probability of failure is due to the higher wind speed and larger drag forces in that direction as shown in Figures 4 and 8. Therefore, the probability of failure for a 50-year return period wind speed in all directions can be obtained using Eq. 7 and Pf = 4.2%. Similarly, probability of failures for 100 and 300-year return period wind speed can be obtained as 4.8 and 39.5%, respectively. Since the structure is still in an elastic range at the 50 and 100-year return period wind speed, the differences of the probability of failures for the two wind speeds are small. However, as yielding begins to develop in many wind yaw angles, the probability of failure increases drastically as the wind speed increases to a 300-year return period wind speed. It is noteworthy that only a single transmission tower is considered in the present study and the possible failure modes due to the cascading effects from adjacent towers and lines are not included in the limit states. However, the proposed probabilistic capacity assessment approaches can be implemented for the other high-intensity winds such as tornados, downbursts, and microbursts and any other scenarios with different hazards or their combinations, such as ice loads and cable vibrations.
Conclusion
With continuous climate change and associated severe natural hazards, such as hurricanes and winter storms, accurate predictions of structural capacity and failure modes of the transmission towers and power systems have been critical to ensure community resiliency and avoid large area blackout. This paper presents a probabilistic approach for capacity assessment for transmission towers under strong wind loadings. After modeling the transmission towers with beam elements and simulating stochastic wind field, the IDA for a transmission tower is carried out. Multiple wind time histories in four different wind directions were used for the dynamic analysis of the wind and transmission tower dynamic system. Wind tunnel experiments were carried out to obtain the drag coefficient and dynamic response factor for different wind yaw angles and different subsections of the tower. In the present study, the maximum base shear forces and top tip displacements are chosen as the DMs and the capacity curves for different wind yaw angles are obtained. To take into account the inherent randomness with respect to the wind loadings, different wind time histories are used in the wind-structure dynamic system to obtain the mean, 16%, and 84% IDA curves. After building the limit states according to the maximum drift to height ratio, the probabilities of failure are obtained for a given site meteorological data with different return periods. From the present study, the following conclusions are drawn: (1) the failure modes for different wind yaw angles could be different and the structural capacity for the transmission tower varies for different wind yaw angles; (2) in the elastic range of the transmission tower, the random wind effects are very small. The random wind effects begin to develop after yielding of different structural members over the elastic range; and (3) probability of failure for different yaw angles could be different.
The present study has demonstrated an effective probabilistic capacity assessment approach framework for transmission towers considering stochastic wind loadings. However, for performance-based design of transmission towers and power systems, other failure modes, such as fatigue damages or cracks and large amplitudes of vibrations, should be included. In addition, the randomness of structural members and progressive deterioration of structural members in structure’s life cycles are not considered in the present study. For a better understanding the resilience of the power transmission and delivery network, more research efforts are needed under the performance-based design framework using the probabilistic approach to assess all possible failure modes for all possible extreme weather scenarios. This will enable the stake holders and decision makers to better understand the system performance of the power transmission system under extreme events and help propose possible effective mitigation plans and strategies to avoid possible system failures and large area blackouts.
Conflict of Interest Statement
The authors declare that the research was conducted in the absence of any commercial or financial relationships that could be construed as a potential conflict of interest.
Acknowledgments
This work is partially supported by University of Connecticut under the first author’s startup funding and the National Science Foundation of Guangxi (Grant No: 2014GXNSFBA118264) and Key Laboratory of Engineering Disaster Prevention and Structural Safety of the China Ministry of Education in Guangxi University (Grant No: 2014ZDX06) for the third author. The support is greatly appreciated. The contents of the paper reflect only the views of the authors.
References
American Society of Civil Engineers (ASCE). (2010). “Guidelines for electrical transmission line structural loading,” in ASCE Manuals and Reports on Engineering Practices No. 74, eds C. J. Wong and M. D. Miller, Prepared by the Task Committee on Structural Loading of the Committee on Electrical Transmission Structures of the Structural Engineering Institute of the American Society of Civil Engineers.
Banik, S., Hong, H.P., and Kopp, G.A. (2008). “Assessment of structural capacity of an overhead power transmission line tower under wind loading.” BBAA VI International Colloquium on Bluff Bodies Aerodynamics & Applications; 2008 July 20–24; Milano, Italy.
Banik, S. S., Hong, H. P., and Kopp, G. A. (2010). Assessment of capacity curves for transmission line towers under wind loading. Wind Struct 13, 1–20. doi: 10.12989/was.2010.13.1.001
De Oliveira, A., Silva, E., De Medeiros, J. C. P., Loredo-Souza, A. M., Rocha, M. M., Rippel, L. I., et al. (2006). “Wind loads on metallic latticed transmission line towers,” in Proceedings CIGRE Session 2006. Paris.
FEMA. (2000a). Recommended Seismic Design Criteria for New Steel Moment-Frame Buildings. Report No. FEMA-350, SAC Joint Venture, Federal Emergency Management Agency, Washington, DC.
FEMA. (2000b). Recommended Seismic Evaluation and Upgrade Criteria for Existing Welded Steel Moment-Frame Buildings. Report No. FEMA-351, SAC Joint Venture, Federal Emergency Management Agency, Washington, DC.
Ge, Y., Yang, Y., and Zhang, Z. (2003). Report on the Wind Tunnel Experiments of Donghai Cable-Stayed Bridge. Shanghai, China: Department of Bridge Engineering, Tongji University.
Hua, X. G., Chen, Z. Q., Yang, J. B., Niu, H. W., and Chen, B. (2014). Turbulence integral scale corrections to experimental results of aeroelastic models with large geometric scales: application to gust loading factor of a transmission line tower. Adv Struct Eng 17, 1189–1197. doi:10.1260/1369-4332.17.8.1189
Jacobs, M. (2013). 13 of the Largest Power Outages in History and What They Tell us About the 2003 Northeast Blackout. Available at: http://blog.ucsusa.org/2003-northeast-blackout-and-13-of-the-largest-power-outages-in-history-199.
Jentsch, A., Kreyling, J., and Beierkuhnlein, C. (2007). A new generation of climate-change experiments: events, not trends. Front Ecol Environ 5:365–374. doi:10.1111/ele.12095
Kareem, A. (2008). Numerical simulation of wind effects: a probabilistic perspective. J Wind Eng Ind Aerodyn 96, 1472–1497. doi:10.1016/j.jweia.2008.02.048
Letchford, C. W., Man, C., and Chay, M. T. (2002). Thunderstorms – their importance in wind engineering (a case for the next generation wind tunnel). Journal of Wind Engineering and Industrial Aerodynamics 90, 1415–1433.
Loredo-Souza, A. M., and Davenport, A. G. (2001). A novel approach for wind tunnel modeling of transmission lines. J Wind Eng Ind Aerodyn 89, 1017–1029. doi:10.1016/S0167-6105(01)00096-4
Loredo-Souza, A.M. (2014). “The aeroelastic wind tunnel modelling of transmission lines and their behaviour under severe boundary layer winds,” in Proceedings of the 9th International Conferences on Structural Dynamics, EURODYN 2014, eds A. Cunha, E. Caetano, P. Ribeiro and G. Muller 2014 June 30–July 2. Porto, Portugal.
Mara, T. G., and Ho, T. C. E. (2011). “Design loads for transmission towers under skewed wind loading,” in Proceedings for Structural Congress 2011, eds D. Ames, T. L. Droessler and M. Hoit (Las Vegas, NV), 1246–1257.
Mara, T. G., and Hong, H. P. (2013). Effect of wind direction on the response and capacity surface of a transmission tower. Eng Struct 57, 493–501. doi:10.1016/j.engstruct.2013.10.004
Mara, T.G. (2013). Capacity Assessment of a Transmission Tower under Wind Loading. Ph.D. dissertation, London: University of West Ontario.
McCarthy, P., and Melsness, M. (1996). Severe Weather Elements Associated with September 5, 1996 Hydro Tower Failures near Grosse Isle, Manitoba, Canada. Winnipeg, Canada: Environment Canada.
Meehl, G. A., Zwiers, F., Evans, J., Knutson, T., Mearns, L., and Whetton, P. (2000). Trends in extreme weather and climate events: issues related to modelling extremes in projections of future climate change. Bull Am Meteorol Soc 81, 427–436. doi:10.1175/1520-0477(2000)081<0427:TIEWAC>2.3.CO;2
Okamura, T., Ohkuma, T., Hongo, E., and Okada, H. (2003). Wind response analysis of a transmission tower in a mountainous area. J Wind Eng Ind Aerodyn 91, 53–63. doi:10.1016/S0167-6105(02)00322-7
Savory, E., Parke, G. A. R., Zeinoddini, M., Toy, N., and Disney, P. (2001). Modelling of tornado and microburst-induced wind loading and failure of a lattice transmission tower. Eng Struct 23, 365–375. doi:10.1016/S0141-0296(00)00045-6
Schroeder, J. L., and Smith, D. A. (1999). “Hurricane bonnie wind flow characteristics as determined from WEMITE,” in Wind Engineering into the 21st Century: Proceedings, Tenth International Conference on Wind Engineering, eds A. Larsen, G. L. Larose and F. M. Livesey (Copenhagen, Denmark), 329–335.
Semenov, M. A., and Barrow, E. M. (1997). Use of a stochastic weather generator in the development of climate change scenarios. Clim Change 35, 397–414. doi:10.1023/A:1005342632279
Shinozuka, M., and Deodatis, G. (1991). Simulation of the stochastic process by spectral representation. Appl Mech Rev 44, 29–53. doi:10.1115/1.3119501
Vamvatsikos, D., and Cornell, C. A. (2002). Incremental dynamic analysis. Earthquake Eng Struct Dyn 31, 491–514. doi:10.1002/eqe.141
Wu, F., Sarkar, P. P., and Mehta, K. C. (2001). Full-scale study of conical vortices and roof corner pressures. Wind Struct 4, 131–146. doi:10.12989/was.2001.4.2.131
Keywords: probabilistic capacity assessment, transmission tower, wind, incremental dynamic analysis, performance-based design, wind-induced vibrations, wind tunnel experiments
Citation: Zhang W, Zhu J, Liu H and Niu H (2015) Probabilistic capacity assessment of lattice transmission towers under strong wind. Front. Built Environ. 1:20. doi: 10.3389/fbuil.2015.00020
Received: 23 April 2015; Accepted: 30 September 2015;
Published: 19 October 2015
Edited by:
Acir Mércio Loredo-Souza, Universidade Federal do Rio Grande do Sul, BrazilReviewed by:
Franklin Lombardo, Rensselaer Polytechnic Institute, USAIoannis Zisis, Florida International University, USA
Copyright: © 2015 Zhang, Zhu, Liu and Niu. This is an open-access article distributed under the terms of the Creative Commons Attribution License (CC BY). The use, distribution or reproduction in other forums is permitted, provided the original author(s) or licensor are credited and that the original publication in this journal is cited, in accordance with accepted academic practice. No use, distribution or reproduction is permitted which does not comply with these terms.
*Correspondence: Wei Zhang, wzhang@engr.uconn.edu