The Effect of Passive Design Strategies on Thermal Performance of Female Secondary School Buildings during Warm Season in a Hot and Dry Climate
 Sahar Zahiri1*
  Hasim Altan2,3
- 1School of Architecture, The University of Sheffield, Sheffield, UK
- 2Sustainable Design of the Built Environment (SDBE), Faculty of Engineering and IT, The British University in Dubai, Dubai, UAE
- 3Welsh School of Architecture, Cardiff University, Cardiff, UK
This paper describes a series of field studies and simulation analysis to improve the thermal performance of school buildings in the city of Tehran in Iran during warm season. The field studies used on-site measurement and questionnaire-based survey in the warm spring season in a typical female secondary school building. The on-site monitoring assessed the indoor air temperatures and relative humidity levels of six classrooms, while the occupants completed questionnaires covering their thermal sensations and thermal preferences. Moreover, thermal simulation analysis was also carried out to evaluate and improve the thermal performance of the classrooms based on the students’ thermal requirements and passive design strategies. In this study, the environmental design guidelines for female secondary school buildings were introduced for the hot and dry climate of Tehran, using passive design strategies. The study shows that the application of passive design strategies, including south and south-east orientation, 10 cm thermal insulation in wall and 5 cm in the roof, and the combination of 30 cm side fins and overhangs as solar shading devices, as well as all-day ventilation strategy and the use of thermal mass materials with 25–30 cm thickness, has considerable impact on indoor air temperatures in warm season in Tehran and keeps the indoor environment in an acceptable thermal condition. The results of the field studies also indicated that most of the occupants found their thermal environment not to be comfortable and the simulation results showed that passive design techniques have a significant influence on the indoor air temperature and can keep it in an acceptable range based on the female students’ thermal requirement. Therefore, in order to enhance the indoor environment and to increase the learning performance of the students, it is necessary to use the appropriate passive design strategies, which also reduce the need for mechanical systems and, therefore, reduce the energy loads of the building.
Introduction
Passive design in buildings uses building architecture to minimize the energy consumption of the building and improves the thermal comfort of the occupants. According to Mikler et al. (2009), the correlation of the local climate with the shape and the thermal performance of the building is one of the main considerations of the passive design approaches to reduce the energy use of the building and to increase the thermal comfort of the occupants. In general, the foundation of passive design depends on natural sources of energy and reduces the need for mechanical systems for cooling, heating, and lighting in the building (LHSBC and Guido Wimmers, 2009). To put the passive design strategies into effect, the criteria of the thermal comfort, the local climate data, and the building’s thermal performance target should be examined first (Mikler et al., 2009).
In recent years, the quality of construction and school design in Iran has been improved significantly. However, most of the existing schools have been constructed without any concern for the comfort of the occupants and the adaptation of the buildings to the local climate (Ghaffari, 1998; Iravani, 2010). Based on CABE (2010), the quality of indoor environment has a great influence on the students’ learning performance and ability to learn in indoor spaces. In order to develop environmental school design guidelines using passive design strategies and to improve the building’s thermal performance and the students’ indoor comfort in Iranian school buildings, it is necessary to assess the current design methods used by the educational authorities in Iran and to examine the performance of existing schools. There are many school buildings in Iran with a large number of students (Nosazi Madares, 2013). According to the annual report of Central Bank of Iran (CBI, 2011), there are more than 112,500 schools in Iran, including around 545,000 classrooms in 2011–2012 and the total number of students aged 6–18 were 13,234 thousand in 2011–2012. It is necessary to improve the quality of these schools to provide healthy and comfortable study spaces for the students with the use of passive design strategies to minimize the energy loads of the buildings as the school buildings in Iran are one of the major energy consumers (Gorji-Mahlabani, 2002; CBI, 2011). Although limited studies have been undertaken for school design in Iran and some guidelines are suggested, there are still lack of practical resources for the environmental and sustainable design of buildings that are appropriate for Iranian schools with concern to thermal comfort (Ghazizadeh, 1993 and Iravani, 2010). In order to create comfortable and healthy learning environments for students, one of the main subjects that needs to be considered during the design process is thermal comfort. Based on Nicol and Humphrey (2001), thermal comfort studies can help to frame sustainable design standards for buildings. Sustainable school buildings not only reduce the energy consumption and the buildings’ running costs, but also increase thermal comfort of the occupants and help preserve non-renewable energy recourses (Nasrollahi, 2009). Investigating the environmental comfort in schools is very important because children are very sensitive to temperature variations, and considering their physical comfort, which is again a critical issue (CABE, 2008). In order to enhance the thermal comfort and to predict the comfort boundaries, many studies have been conducted in different countries both for mechanical and natural ventilation buildings. Heidari (2010) conducted an extensive thermal comfort study in Iran for more than 15 years. Around 5000 sets of data were gathered during the 10 years of study in various climatic region of Iran for residential and office buildings. The same study confirms that the adaptive action in indoor environments depends on the outdoor temperature and causes various neutral temperatures in different seasons. According to this study, the indoor neutral temperature depends on outdoor temperatures. Heidari (2010) stated that Iranian people can achieve comfort at more than 30°C in the hot period and less than 20°C in the cool season. Moreover, it has been stated that, in the hot and dry climate of Iran, people can make themselves comfortable if they maintain indoor temperatures between 16.5 and 22°C in the cold season and between 28 and 34°C in the hot season by adjusting their clothes, activity levels, and air velocity.
Many research studies were also conducted to provide high performance school buildings around the world. Many programs also attempted to construct and refurbish the school buildings based on sustainable and passive design such as Building School for the Future in the UK. Building Schools for the Future (BSF) was a program to rebuild or refurbish all secondary schools in England by 2020. It aimed at providing twenty-first-century facilities for all students in secondary schools and helping to study in more healthy and comfortable environments (PricewaterhouseCoopers and DCSF, 2007). However, this scheme was scrapped (Richardson, 2010) and many projects were stopped. One of the main reasons was to get the best value for money (DFE, 2010). Nevertheless, there were many useful guidelines and standards on a school building design in this program that are extensive and can be changed to meet individual requirements for a particular design, and can offer good lessons for this research and the future designs of school buildings. There are also some guidelines for climatic school design in Iran but these guidelines need to be modified and updated, as they are general, and the students’ thermal satisfaction from the indoor environment is not considered in the previous guidelines. The State Organisation of School Renovation, Development and Mobilization in Iran has proposed a climatic zoning for educational buildings and provided climatic design guidelines in various climatic zones in Iran (Ghaffari, 1998). Kasmai (1994) also conducted a series of research studies in school buildings in different regions of Iran on the impact of different climatic conditions on Iranian school designs. He reviewed available documents on the thermal performance of school buildings, as well as climatic features, such as temperature and humidity, in order to divide educational buildings into different types in different regions presented a climatic zoning map for school buildings. However, there are lack of passive and sustainable design guidelines for energy efficient school buildings in these studies based on the students’ thermal comfort.
This research studies a female secondary school building in the city of Tehran, which is located in the hot and dry climatic region of Iran. Because of the lack of climatic design guidelines in Iran for female school buildings, this study aims to provide environmental design guidelines for female secondary school buildings in a hot and dry climate of Tehran in the warm season with regard to passive design strategies and the students’ thermal comfort. In this study, a series of field studies were conducted, including thermal comfort surveys and field measurements, to assess the indoor thermal performance and to predict the students’ thermal satisfactions. As the study involved human subjects in the field studies during the survey, an approval was obtained from the University of Sheffield’s ethics committee, which provided confirmation that all studies conform to the relevant regulatory standards. Moreover, thermal simulation analysis was performed to evaluate and improve the thermal performance of the secondary school buildings, and to define environmental design guidelines using passive design strategies with respect to the students’ thermal comfort, which would result in reducing the energy consumption of the buildings.
Generally, Tehran has warm and dry summers and cold winters (Kasmai, 2008). The annual precipitation is low and the average rainfall on the plain is about 218 mm and the maximum rainfall is about 50 mm in November (Kasmai, 2008). The average outdoor air temperature during the hottest period is 29.6°C in July and 21.6°C in May (warmest period in the academic year) and during the coldest period, it is 3.1°C in January. In general, the coldest period is from December to February and the hot and warm period is from May to September.
Methodology
In this paper, a series of field studies were conducted using a questionnaire-based survey and field measurements for 1 week in May, which represents the warmest period during the school calender year and before the final exams and summer vacation. Indoor air temperature and relative humidity levels of six classrooms were measured with HOBO data loggers while the students completed questionnaires covering their thermal sensations and thermal preferences in the classrooms facing north (N) and south (S), and located on the first and second floors. The study also evaluated the thermal performance of the classrooms using an environmental analysis software package, DesignBuilder (2013). The thermal simulation analysis was carried out by inputting actual data gathered from the field studies in order to assess the indoor thermal condition in the typical school building. Later, various passive design strategies were applied to the simulation software, such as orientation, shading devices, thermal mass, insulation, and natural ventilation. This starts from the basic school model, investigating various strategies to predict the optimum conditions for the school building based on the students’ thermal requirements. The simulation results determined how to improve the thermal performance of the building and how to provide classrooms that are more comfortable for the students by using passive design strategies, and as a result aimed to reduce the energy consumption of the school building in Tehran.
The Case Study Building
The original school building is a female secondary school building in the city of Tehran. The case study school building was chosen to be in Tehran as it is the capital of Iran and has the largest number of students and school buildings when compared to the other cities in Iran (CBI, 2011). Based on Ministry of Education of Iran (2014), just over 1.8 million students are studying in around 5000 schools in Tehran. The result of this study is later can be applied to the other regions with the similar climate. The school building is a four-storey building, including a basement and a ground floor, with a masonry structure. Based on Mahdizadeh (2011), 90% of the school buildings in Iran have a masonry structure. Moreover, the construction materials and thermal properties of the secondary school building are the typical building materials used for masonry buildings in Tehran, such as brick as the thermal mass material and glass wool as the thermal insulation material (see Table 1).
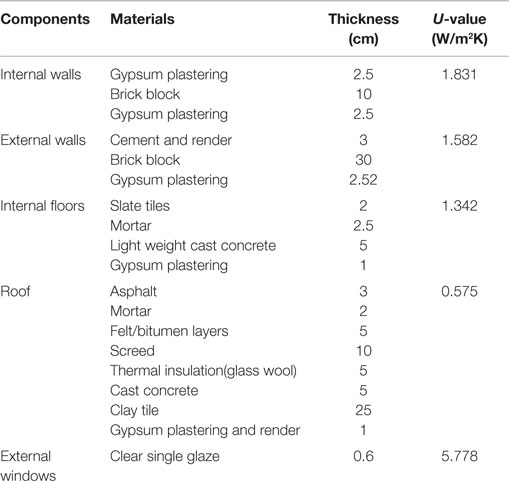
Table 1. Materials, thickness, and U-value of building components in the case study school building.
The classrooms were located on the first and second floors, and the main building facades were facing the south and north orientation. In this study, six classrooms were selected for field study experiments and two classrooms were chosen for simulation analysis that represented all classrooms facing south (S) and all classrooms facing north (N), which are located on the first and second floors, respectively. In addition, both the indoor air temperatures and relative humidity levels were measured in all classrooms and all the students filled out a questionnaire-based survey relating to their indoor thermal satisfaction in order to identify if the classrooms are thermally comfortable during the lesson hours in a critical warm season.
Field Measurements
In this study, the indoor air temperatures and relative humidity levels were measured with HOBO data loggers in the warm spring period of May 2010 for 1 week, which included a survey day. The measurements assessed thermal conditions of six classrooms in the warm spring season before the final exams and school closure for summer holiday. The classrooms were located on the first and second floors of the school building, facing north (N) and south (S) (see Figure 1).
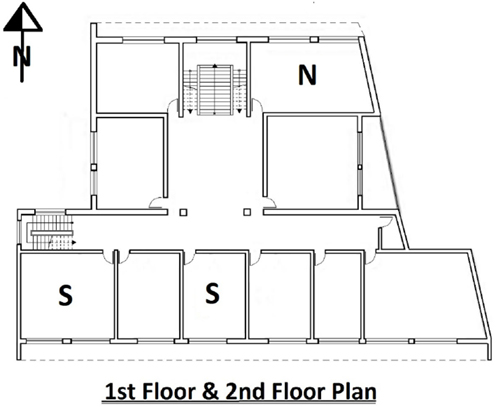
Figure 1. Measured classrooms, S and N, on the first and second floors.
The main aim of the field measurements was to establish a database in order to be able to predict the comfort temperature levels of the students and their thermal satisfaction while staying in the classrooms during the survey day in spring. The results were used to evaluate and improve the building’s thermal performance with the use of thermal simulation software. Based on the field measurement results, the mean indoor air temperature in all classrooms was around 24°C during the teaching hours in May field study experiment that fell within Heidari’s (2010) defined comfort zone (see Eq. 1). To identify the indoor comfort temperature (Tc) in the case study school building and to predict the initial comfort temperature ranges in the secondary school building in Tehran, the following equation was used, which is based on Heidari’s (2010) predictions with regard to the residential and office buildings in Iran with varied heating and cooling systems, and with respect to the religion and culture. Tmo is the monthly mean outdoor temperature.
Tmo is the monthly mean outdoor temperature.
Tc is the indoor comfort temperature.
Equation 1 was based on a decade of thermal comfort field studies on Iranian people in 15 cities and in four various climatic regions of Iran (Heidari, 2010), which showed that the occupants were able to tolerate a wide range of temperatures, covering more than 14K in the hot season and 7K in the cool season. In addition, Iranian people can achieve comfort at more than 30°C in the hot period and less than 20°C in the cool season (Heidari, 2010). Heidari (2010) cited that, in the hot and dry climate of Iran, people can make themselves comfortable at indoor air temperatures between 16.5 and 22°C in the cold season and between 28 and 34°C in hot seasons, by adjusting their clothes, activity, and air velocity (Heidari, 2010). The findings showed that people can obtain comfort at higher indoor air temperatures compared to previous international standards and recommendations. In addition, ASHRAE Standard 55 has tried to supply an objective standard for thermal comfort and the primary aim was to provide guidelines for centrally controlled HVAC (Brager and de Dear, 2000). In order to improve ASHREA Standard 55 to be a more adaptive field basis alternative for naturally ventilated buildings, proposals have been suggested by ASHRAE funded research and a series of research studies. The results indicated that occupants of naturally ventilated buildings prefer a wider range of temperature compared to the occupants of centrally controlled HVAC buildings and become more finely adapted to the narrow, constant conditions provided by mechanical ventilation systems. In a controlled HVAC building, the Tc is between 22 and 24°C (Brager and de Dear, 2000). However, the proposed adaptive comfort standard for ASHRAE Standard 55, for a naturally ventilated building, shows that the operative temperature is more than 18°C and less than 24°C with 90% acceptability (ASHRAE, 2004).
In this study, relative humidity levels were also measured with HOBO data loggers during the field study experiment. Based on the measurement results, the humidity levels was between 15 and 38% in all measured classrooms and the average levels were less than 29% during the teaching hours, which is low for school buildings. Generally, defining indoor relative humidity levels is more complicated than defining indoor air temperatures, as relative humidity can easily be affected by the outdoor weather conditions especially if the buildings have poor constructions. The number of the occupants and the airflow rate can also increase or decrease the humidity levels inside a classroom (Kasmai, 2008). Moreover, the mean radiant temperature was assumed to be equal to the indoor air temperature in the measured classrooms. According to Fanger (1973) and Santamouris (2008), when the occupants have sedentary activity less than 1.5 met and the air velocity is below 0.1 m/s, or the air is still in the indoor environment, the mean radiant temperature can be assumed to be equal to the indoor air temperature (Fanger, 1973; Santamouris, 2008), which was the condition in this study. In addition, in this study, the indoor environments were not exposed to direct sunlight, and the layout in the classroom was constant in terms of the environment around each seating area to any other point in the room, which caused the mean radiant temperature measures to be similar to the indoor air temperature (Limbachiya et al., 2012). Furthermore, air velocity was considered as a fixed parameter, at about 0.1 m/s, as the outdoor air velocity was quite low and the air was still in the classrooms during the field study experiment in spring season.
Questionnaire Survey
The field survey was conducted in classrooms S and N, while the indoor air temperatures were measured with HOBO data loggers. A questionnaire-based survey was carried out on the 4th May 2010. Around 126 questionnaires were distributed to the students in six classrooms and the students were asked to fill in the questionnaires and also describe their thermal sensations and thermal preferences during lesson hours based on the 7-point ASHRAE scale (ASHRAE, 2004) and 3-point McIntyre scale (McIntyre and Gonzalez, 1976). The results of the questionnaire survey indicated that just around 73% of the students’ responses fell into the central three categories of the ASHRAE scale, slightly cool (−1), neutral (0), and slightly warm (+ 1) (see Figure 2). Based on the ASHRAE standard 55 (ASHRAE, 2004), a response in the central three categories of the ASHRAE scale expresses satisfaction or acceptance and more than 80% acceptability in the three central categories of ASHRAE scale, from slightly cool to slightly warm, is enough to consider the indoor environment to be comfortable, which in this case is not. In addition, around 80% of the students in Classrooms N and around 60% in Classrooms S preferred a cooler environment (see Figure 2).
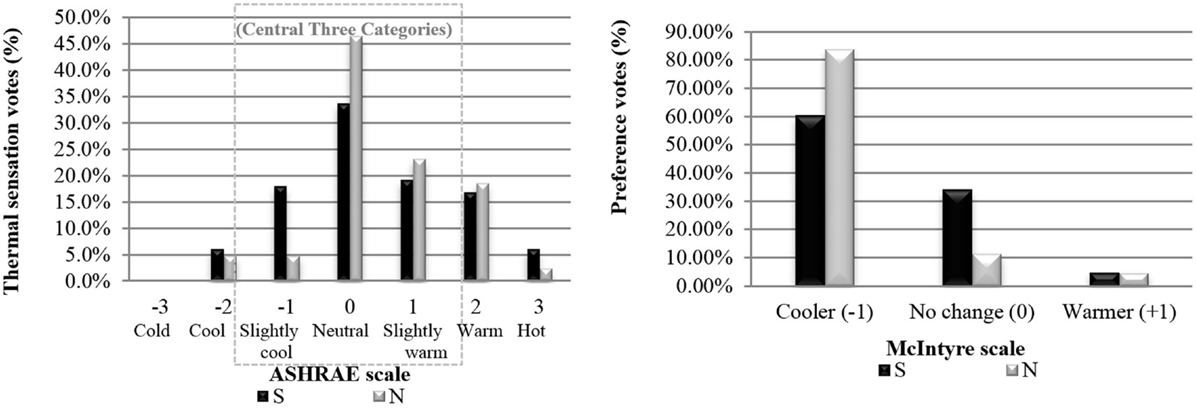
Figure 2. Thermal sensation votes and preferences vote in classrooms S and N on 4th May 2010.
Moreover, the average indoor air temperature in all classrooms during the teaching hours on the survey day was around 24°C and the most students preferred to be in a cooler environment while the indoor air temperature exceeds 24.5°C. Although the Tc in the classrooms during the May survey day fell within Heidari’s comfort zone as discussed in Section “Field Measurements”, thermal sensation votes were below 80% and the students wanted their thermal environment to be cooler in warm season. This shows that the comfort temperature range is different for the female students in the secondary school buildings. A possible reason is related to the age, religious, and culture grounds. As the female students needed to wear a special uniform and cover up their head in the school building on religious grounds, the neutral temperature was slightly different in female school buildings in Tehran. Moreover, in the school building, the students had less control in making themselves comfortable, compared to residential buildings, and as a result, the range of the comfort temperature is more limited. Based on the questionnaire survey conducted in this research, the maximum comfort temperature in May was 24.5°C as most of the students wanted a cooler environment when the indoor air temperature was more than 24.5°C.
The Simulation Analysis
In order to assess and improve the indoor thermal performance of the classrooms based on the passive design strategies and students’ thermal comfort satisfactions, thermal simulation analysis was performed in two classrooms using DesignBuilder, which has a comprehensive user interface to the EnergyPlus dynamic thermal simulation engine. The simulation analysis was carried out for the field studies, using classrooms facing north (N1) and south (S1), located on the first and second floors of the building. The field studies’ results were incorporated to the simulation model in DesignBuilder in order to evaluate the current thermal performance of the school building. Later, various passive design strategies were applied to the simulation model separately and the impact of these strategies, including orientation, solar shading devices, thermal mass, natural ventilation as well as external wall, and roof insulation on indoor air temperatures in spring season, was analyzed by revising the case study model in order to identify the optimal solution for each parameter. Following this, the optimum design solutions were defined for the case study building by combining all the optimal design solutions for each parameter. In addition, the classrooms were naturally ventilated in warm periods through opening windows in all classrooms from 07:00 a.m. until after the cleaning period at around 09:00 p.m. in the spring season. Table 2 presents the proposed schedules for occupancy and natural ventilation of the case study building in the simulation modeling based on the real-time schedules of the school building.
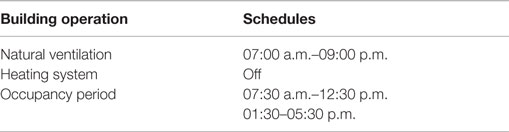
Table 2. Building operation schedules of the base case building model.
Thermal Performance Analysis
In order to improve the thermal performance of the school building, passive design strategies, including orientation, shading devices, insulation materials as well as thermal mass, and natural ventilation, were employed in the prototype school building separately. The simulation analysis was performed on classrooms S1 and N1 for 1 week in May 2010. Classroom S1 was located on the first floor, facing south, and Classroom N1 on the second floor, facing north. These two classrooms represented all the classrooms in analyzing the impact of passive design strategies on indoor air temperatures in various locations.
Orientation
Building orientation can affect the needs for mechanical energy systems in the buildings. An appropriate building orientation can decrease the use of mechanical heating and cooling systems, and as a result, reduce energy bills of the building. It is important to consider the connection between the geographical features of the site and the building itself in order to create an accurate passive building (LHSBC and Guido Wimmers, 2009). Building orientation has an impact on heat gains of the building, as a result of the variety of solar radiation at different angles (Givoni, 1998). To analyze the impact of the orientation on the indoor environment of the case study school building, simulation analyses have been performed on various directions. The eight main directions (N, NW, W, SW, S, SE, E, and NE) have been considered for the prototype school building, from 0° to 315°. The building was rotated anti-clockwise for eight primary directions, starting with 0° in the North. Figure 3 shows the plot box of indoor air temperatures in classrooms S1 and N1 based on the eight main geographic directions in May. It can be seen that the indoor air temperatures were in the highest range when the south facade faced west and south-west, respectively, in Classroom S1 but when the same facade faced north and north-east, the indoor air temperatures dropped when compared to the other side. However, the indoor air temperature in Classroom N1 increased in all directions. This is because the main facade of the classroom faced north in the base case and it received the minimum solar radiation when compared to the other directions.
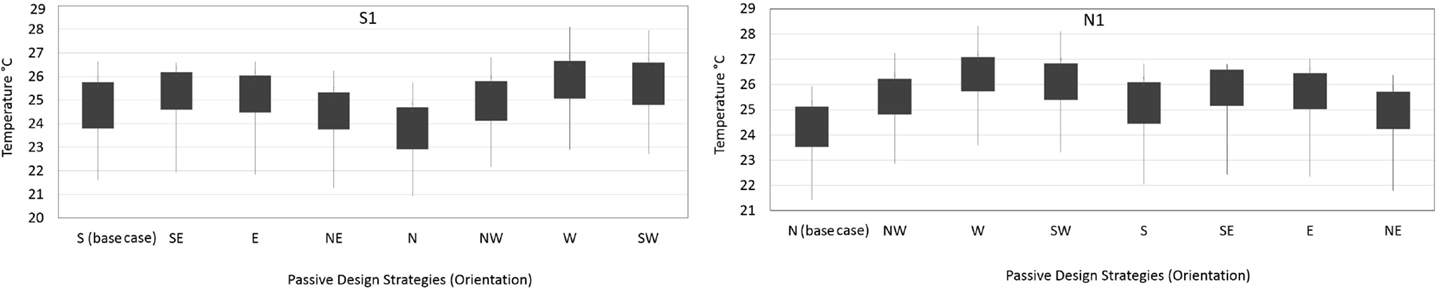
Figure 3. Plot box of indoor air temperature for eight primary directions in classrooms S1 and N1 in May 2010.
Based on Kasmai (2008), the southern walls gain direct solar radiation for around 8 h a day in summer in the city of Tehran at 35° N latitude. However, the northern walls receive at least 6 h of sunlight a day during the summer period. The eastern and western walls gain a considerable amount of solar radiation in summer, at least 7 h a day. The comparison of indoor air temperature variations in all directions shows that, while the classrooms faced west, it has a maximum indoor air temperatures and, while they faced north, it has the minimum indoor air temperatures when compared to the other directions.
Shading Devices
The main purpose of using shading devices is to prevent direct solar radiation reaching external walls. There are various kinds of shading: shading of the building over itself; shading of near obstacles, such as overhangs, fins and blinds; and shading of surrounding buildings and far obstacles (Ford et al., 2007). In this study, the effect of near obstacle shading on the indoor environment was examined. Five various types of shading devices were examined, including vertical overhangs with different lengths, a combination of side fins and overhangs, as well as window blinds. The aim was to find the best strategies for decreasing indoor air temperatures during the warm period while making the most of solar radiation during the winter season.
Sizing of Overhangs and Fins
To find the starting dimensions for a shading devices’ shadow, including overhangs and fins, the following equations have been used, based on a range of literature (O’Connor et al., 1997; Kasmai, 2008):
For Overhangs:
For Fins:
where H is the depth of the overhang’s shadow on the window and W is the depth of the side fin’s shadow over the window. Moreover, D stands for shading device projection and A is the angle of the shadow, which describes the length of shadow on the wall. In addition, Z is the solar azimuth and N is the window azimuth. Figure 4 presents the geometry and components for vertical and horizontal shading devices.
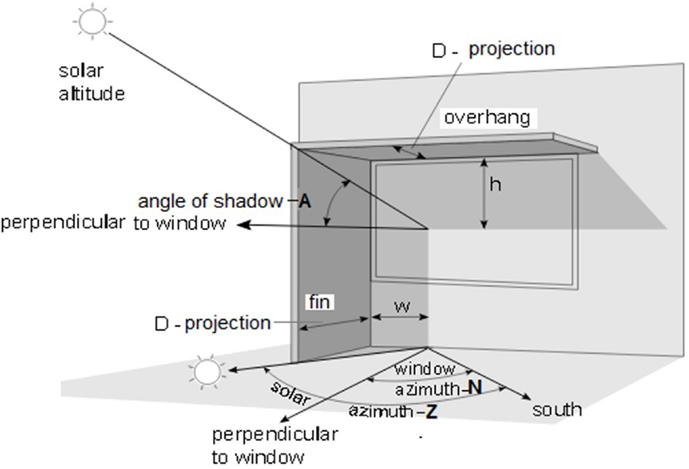
Figure 4. Geometry and components of shading devices (O’Connor et al., 1997).
The initially proposed lengths for the overhangs and fins are based on the shadow angles of shading devices defined in Iranian National Building Regulations (INBR) (Ministry of Housing and Urban Development, 2009). For south-facing windows, the horizontal shading is 60° and for north-facing windows the vertical shading is 75° west. According to Kasmai (2008), during the hot season, the maximum energy of the sun radiated on the south-facing walls is around 12:00 p.m. However, it is at 06:30 a.m. and 05:30 p.m. in summer for north-facing walls, and there is no radiation during the winter in this direction. Considering that the school would close for final exams in June and the maximum solar radiation in north-facing walls is at 06:30 a.m. and 05:30 p.m. in summer while the classrooms are unoccupied, 12:00 p.m. in May was chosen as the most appropriate time for solar azimuth to calculate the projection of shading devices based on the suggestion of Kasmai (2008) as stated below:
Based on the proposed shadow angle by the INBR (Ministry of Housing and Urban Development, 2009) and using Eq. 4, it was decided that choosing the initial length of 30 cm for the vertical and horizontal projections, which creates a shadow over the whole window in warmest period. Although the INBR (2009) suggest not using any horizontal shading devices on the north side of buildings in Tehran, in this study, both vertical and horizontal shading devices were used for comparing their effects on the indoor air temperatures. As the building’s main axis lay in an east-to-west direction, and the main facade is facing south, the angle of the window azimuth was 0°. The window azimuth is the angle between the perpendicular to the window and the real south (Ministry of Housing and Urban Development, 2009). Table 3 summarizes the proposed design strategies for shading devices and the length of the projections for each strategy in a base case building, as well as the blind dimensions. Various design strategies for shading devices were employed in the simulation model to examine the effects of them on the indoor air temperatures during the warm season, which included the survey days.
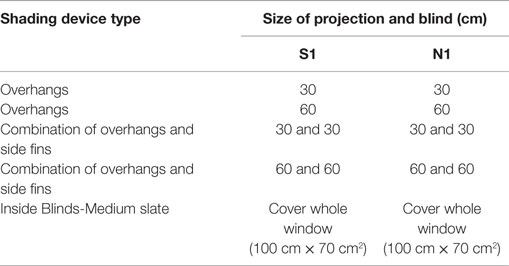
Table 3. Types and length of shading devices used in the simulation analysis.
The primary suggestion for choosing the type and size of shading devices was based on the INBR (Ministry of Housing and Urban Development, 2009). However, additional dimensions for overhangs and side fins were employed to the base case model for comparison purpose. In addition, although these regulations suggested not using side fins in south-facing windows or overhangs in north-facing windows, in this study, both types of shading devices were employed in both classrooms to compare their effects on the indoor air temperatures. Although the INBR does not suggest using window blinds as shading devices, in this study, a blind with a medium slate was employed inside the windows to examine its effects on the indoor air temperatures in the warm season.
Result of the Analysis
As discussed before in this section, a range of shading devices with various dimensions were employed in the base case model, including overhangs and blinds, as well as a combination of overhangs and side fins, in order to analyze the effect of them on the indoor air temperatures. Figure 5 shows the plot box of the indoor air temperatures resulted from applying various shading devices in classrooms S1 and N1 in May 2010. As can be seen in Figure 5, employing 30 cm overhangs and side fins together at the openings reduced the indoor air temperatures in both classrooms. The indoor air temperatures in Classroom S1 were reduced by a maximum of 2.5°C but in Classroom N1, it only dropped by a maximum 0.5°C. Moreover, employing 30 cm overhangs reduced the indoor temperatures as well, but the effect of overhangs on the indoor air temperatures is less than that in the combination used with side fins. The indoor air temperatures were reduced by a maximum 2°C in the south-facing classroom, while in the north-facing classroom, it only dropped by approximately 0.3°C. It was expected that applying deeper overhangs and side fins would result in lower temperatures, as the external walls around the shading devices received less solar radiation, but the result shows almost no effect when applying the 60 cm overhangs and side fins, compared to using the 30 cm overhangs and side fins (see Figure 5). The same result was found for 30 cm overhangs against 60 cm ones. A possible reason for this is the solar altitude in the periods of May, which is between 62° and 73° (Kasmai, 2008). In addition, using a medium slate blind inside the windows also helped to reduce the indoor air temperatures, as it prevented the sun’s radiation reaching the room. However, the effect of this type of shading device is less than that of overhangs and side fins, and the combination of both, but it can be used as an additional item to be used when needed especially in hot periods.
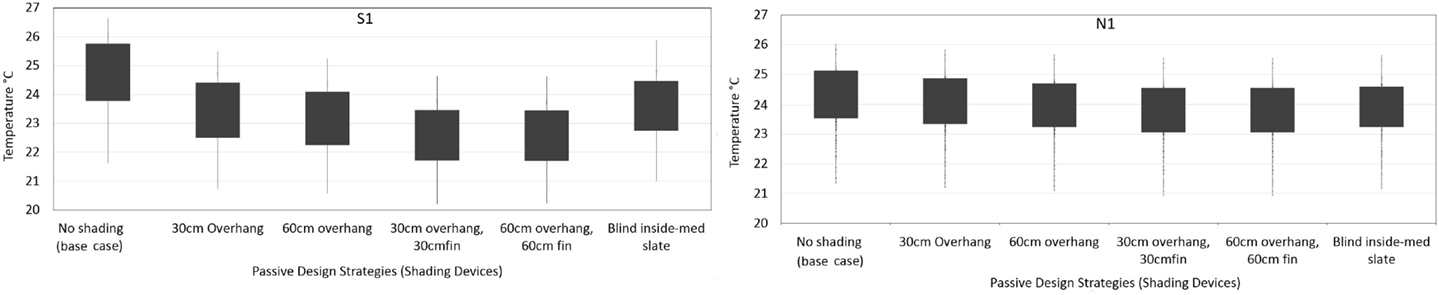
Figure 5. Plot box of indoor air temperature with different shading devices in classrooms S1 and N1 in May 2010.
Moreover, it is expected that the indoor air temperatures with all combinations of shading devices between sunset and sunrise decreased because of the effect of the thermal mass of the wall, which was 30 cm brick wall. As the shading devices prevented the sun reaching some parts of the windows and interior spaces, as well as the surrounding external walls, the amount of energy, which was released during the night decreased, and as a result, the indoor air temperatures were lower than expected.
Ventilation
Increasing the air movement rate in indoor spaces increases the cooling efficiency in hot and warm seasons. Natural ventilation is one of the passive design strategies, which enhances indoor air quality in hot and dry regions by providing fresh air. Night ventilation and evaporative cooling are some of the important ventilation strategies used to decrease the indoor air temperatures in hot and dry regions (Ford et al., 2007). In this study, the focus is on night-time natural ventilation and all-day natural ventilation during the warm spring season for cooling purpose. During the field study experiment, the windows always opened at around 07:00 a.m. and usually closed at around 09:00 p.m., after the cleaning up period. Night ventilation reduces indoor air temperatures in hot climates, as the outdoor temperatures drop after sunset (Sheta, 2012). As can be seen in Table 4, four different natural ventilation strategies were considered for the simulation analysis. These strategies included the base case practice and all-day natural ventilation, which included night ventilation with two various opening ratios, 40 and 60%. Moreover, for the last strategy no ventilation mode was applied in the base case model in order to assess the indoor air temperatures when ventilation is absent for a whole day.
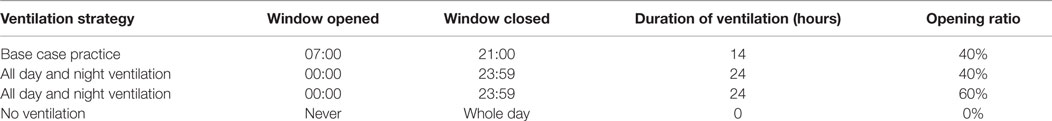
Table 4. Different ventilation strategies applied to simulation modeling.
Figure 6 presents the indoor air temperatures in classroom S1 and N1 in May 2010. It can be seen that the lack of ventilation in both classrooms clearly increased the indoor air temperatures during the survey day. The indoor air temperatures in the south-facing classroom increased around 4K, compared to the base case result, but it only increased by up to 3K in the north-facing classroom as less solar radiation reached this room. However, applying the all-day natural ventilation mode to simulation modeling results in reducing the indoor air temperatures in both classrooms, compared to the base case. As illustrated in Table 4, two various opening ratios were considered for all-day natural ventilation strategies, 40 and 60%. However, it can be seen that 20% difference in opening ratios has similar effect on the indoor air temperatures. A possible reason may be minimal air movement in outdoor environments and high indoor air temperatures during the hot and warm period.
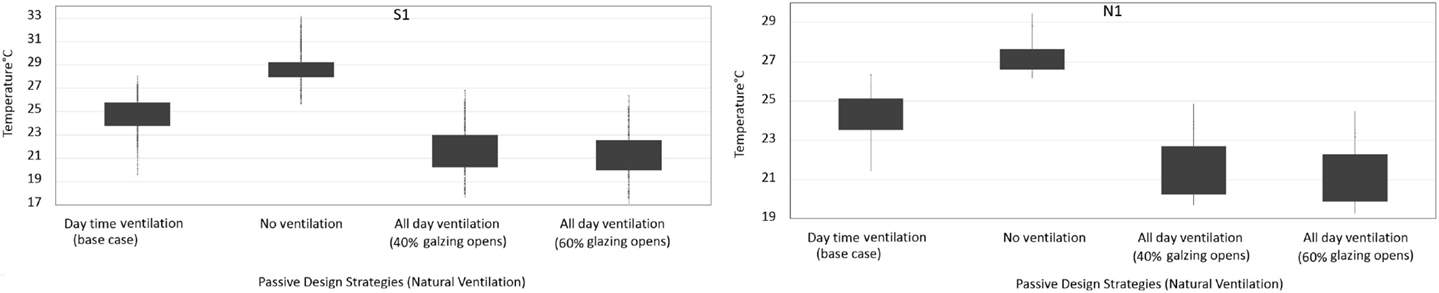
Figure 6. Plot box of indoor air temperature with different natural ventilation strategies in classrooms S1 and N1 in May 2010.
Thermal Insulation
Appropriate insulation material helps to reduce undesirable heat losses or heat gains through the building envelope. It decreases the heat flow rate through the wall, roof, floors, and openings, whether outward or inward, and as a result, reduces the energy consumption of the building (LHSBC and Guido Wimmers, 2009; Autodesk Ecotect Analysis, 2013). Thermal insulation materials have an impact on the indoor air temperatures of the buildings. A well-insulated building results in lower conductivity through the building envelope fabrics, decreasing the heat flow as well as providing a comfortable indoor environment. The amount of heat loss from building components is measured by U-values or thermal transmittance. A lower U-value means lower heat loss through the building fabrics and better insulation of the buildings. In addition, R-values or thermal resistance is a measure of a material’s resistance to heat flow, and therefore, an indicator of a material’s insulation properties. It is the inverse of the U-value (LHSBC and Guido Wimmers, 2009). In this study, different insulation types, with various thicknesses, were employed in the external walls as well as in the roof separately, to examine their effects on the U-value of the building, and as a result, on the indoor air temperatures. The thermal insulation materials used in the simulation modeling were based on recommendations by the INBR and are the typical insulation materials mostly used in Iran (Ministry of Housing and Urban Development, 2009; IFCO, 2012; IRIMA, 2012).
Thermal Insulation in External Walls
The original school building does not include any thermal insulation materials in the external walls. Three various types of insulation materials were employed in the base case external walls, including glass wool, extruded polystyrene (XPS), and expanded polystyrene (EPS), which are the common types of insulation materials used in Iran (IFCO, 2012). These insulation materials were selected based on the INBR (Ministry of Housing and Urban Development, 2009). They were applied to the walls separately, with various thicknesses of 5 and 10 cm. In addition, they were applied to the outer and inner sides of the external walls, in order to investigate the effect of the positioning of the insulation materials on the indoor air temperatures. Figure 7 illustrates the result of the simulation analysis concerning insulation types, thicknesses, and positions in May 2010, in south- and north-facing classrooms. It can be seen that the application of all types of thermal insulation with 5 and 10 cm thicknesses resulted in higher indoor air temperatures in both classrooms. It should be mentioned that the windows were open during the occupancy period in the base case building until the cleaning period at around 09:00 p.m. in the warm period.
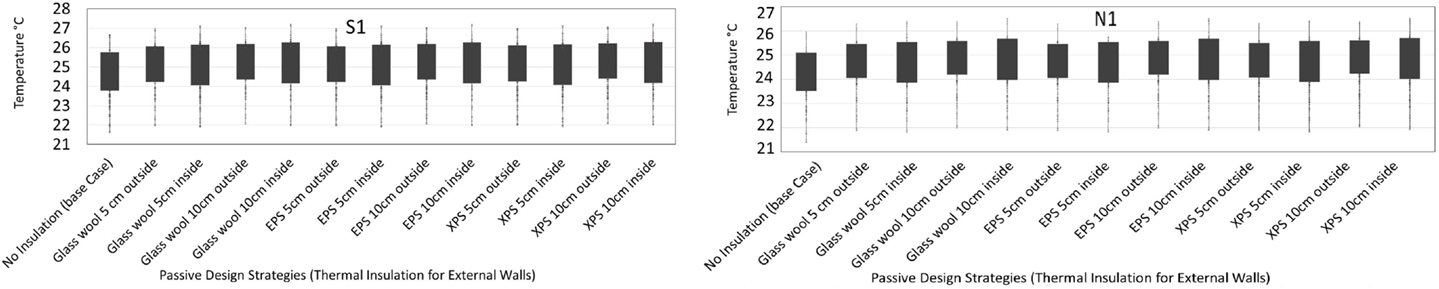
Figure 7. Plot box of indoor air temperatures with different wall insulation in classrooms S1 and N1 in May 2010.
As the application of tight fitting thermal insulation materials can improve airtightness levels of a building and limit air leakage through the building’s envelope, less air infiltration occurred in the building (LHSBC and Guido Wimmers, 2009), and as a result, the indoor air temperatures increased in both classrooms, regardless of the location. In addition, adding 10 cm of insulation material resulted in a higher increase in temperatures than the 5 cm thermal insulation in both classrooms. In general, adding insulations to the external wall had the effect of increasing temperatures in all rooms, which was not significant in the warm season, and all the suggested thermal insulations had nearly the same impact on the indoor air temperatures. In addition, putting thermal insulation on the outer side of the walls had almost the same effect on increasing the indoor air temperatures when compared to putting on the inner side, but the effect of thicker thermal insulation materials is more than that of the thinner materials. It is suggested to use thicker insulation materials on the outer surfaces of external walls with mass construction, as it will give the advantage of greater thermal mass in the winter period. Moreover, thicker insulation material results in lower U-value (see Table 5). The U-value of the non-insulated external wall in the case study school building was 1.61 W/m2K and the tested variations of thermal insulation, including glass wool, XPS, and EPS, with 5 cm of thickness, reduced the U-value of the base case building to 0.54, 0.48, and 0.36 W/m2K, respectively. However, increasing the thickness of the insulation materials to 10 cm had more impact on decreasing the U-value of the external wall, which decreased to 0.32, 0.28, and 0.32 W/m2K when using glass wool, XPS, and EPS.
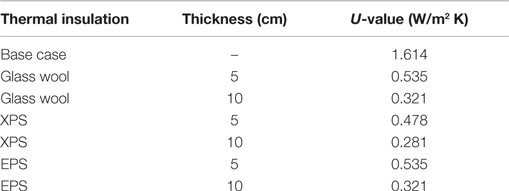
Table 5. Effect of thickness of insulation materials on overall U-value of external wall.
Thermal Insulation in Roof
The original building has only 5 cm of glass wool installed in the roof layer as a thermal insulation material. Three various types of insulation materials were employed in the base case roof layer, in a similar way to the external wall experiment of thermal insulation. The applied insulation materials included glass wool, XPS, and EPS. They were applied to the roof individually, with 10 cm of thickness. The reason for using 10 cm of thickness for the thermal insulation materials was that the original building already has 5 cm of glass wool as the thermal insulation installed to the roof layers. However, 5 cm glass wool were also applied to the inner side of the roof in order to compare the difference between the effect of inner side and the outer side on the indoor air temperatures. In addition, the thermal insulation materials with 10 cm of thickness were applied to the outer side of the roof as well as the inner side in order to investigate the effects of the positioning of the insulation materials on the indoor air temperatures. The insulation materials were applied to the roof only and the floors had no thermal insulation, just similar to the original building. The roof and ground floors are the most complex parts of the building when compared to the middle floors, and in the base case building, there were no classrooms on the ground floor and the basement, and therefore, no thermal insulation was installed in the middle floors in this study. Figure 8 presents the effects of various thermal insulation materials, installed to the outer side and inner side of the roof, on the indoor air temperatures in the north-facing classroom.
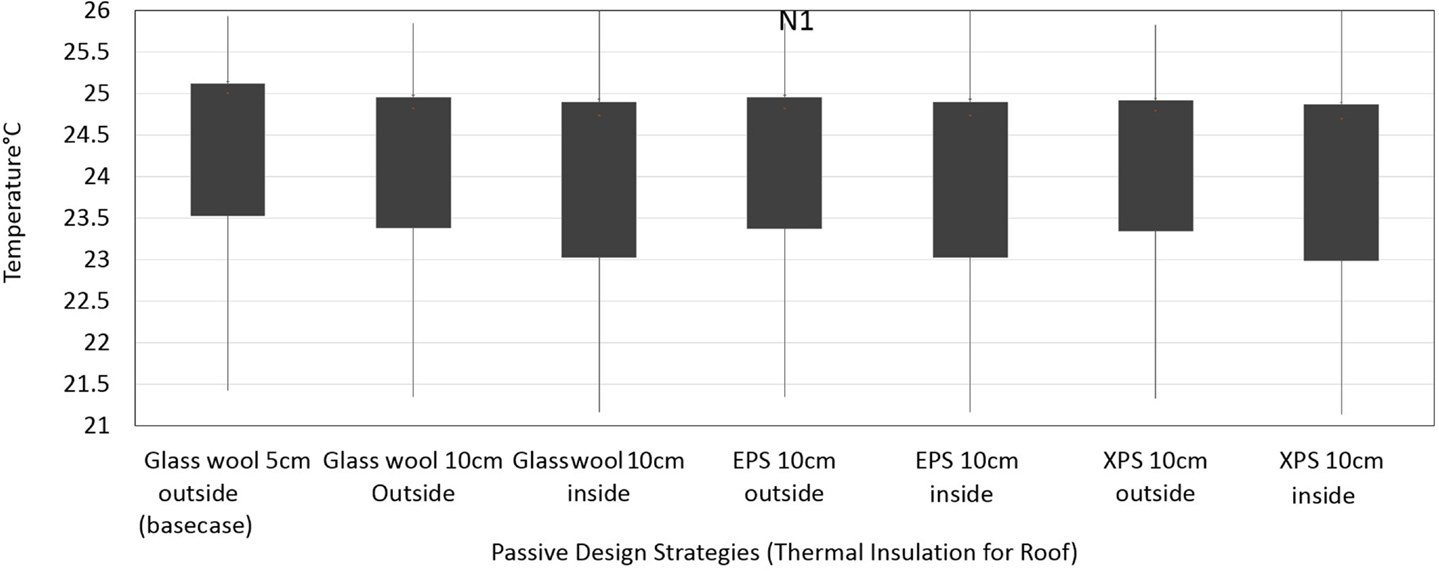
Figure 8. Plot box of indoor air temperatures with different roof insulation materials in classrooms N1 in May 2010.
It can be seen that the application of all types of thermal insulation with 10 cm of thickness caused lower indoor air temperatures in a north-facing classroom on the top floor (see Figure 8). However, the effect of inner side on reducing the indoor air temperatures is slightly higher than the outer side. In addition, the difference between the effects of thermal insulation materials with 5 cm thickness on the indoor air temperatures is not very significant when compared to the 10 cm thickness, and it is suggested to use 5 cm of thermal insulation materials to the inner side of the roof.
Table 6 presents the impact of various insulation types with various thicknesses on the U-value of the roof. The U-value of the roof for the base case building was 0.53 W/m2K and the tested variations of thermal insulation materials, including glass wool, XPS, and EPS, reduced the U-value of the base case building to 0.32, 0.28, and 0.32 W/m2K, respectively.
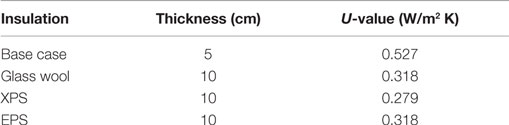
Table 6. Effect of thermal insulation materials and their thicknesses on U-value of the roof.
Thermal Mass in Walls
Thermal mass is the capability of fabrics to save heat. It can be integrated into a building as part of the buildings’ components in the walls and floors. High thermal mass materials’ such as concrete, brick, stone, and earth, can absorb and hold heat, and release it slowly later on when there is a temperature difference between the material and the surroundings (LHSBC and Guido Wimmers, 2009). It is suggested that high thermal mass materials should be used in building components in hot regions, as this provides a comfortable indoor environment by reducing the indoor air temperatures and avoiding overheating (Kasmai, 2008). Based on Kruger and Givoni (2008), using high thermal mass materials in external walls reduces indoor air temperatures, especially when considering night-time ventilation for the room. In this study, various thermal mass materials with different thicknesses were applied to the simulation model. Table 7 shows the materials applied to the base case external wall components.

Table 7. Thermal mass materials using different thicknesses in external wall components.
Figure 9 illustrates the effects of various thermal mass materials on the indoor air temperatures in classrooms S1 and N1. It can be seen that the indoor air temperatures increased when using low thermal mass materials. However, using high thermal mass materials decreased the indoor air temperatures on warm spring days. For instance, applying 40 cm of lightweight concrete increased the indoor air temperatures by around 0.7K in peak periods in both classrooms and using 25 cm heavyweight concrete reduced the indoor air temperatures by around 0.3K in peak periods, but this was not very significant in spring when compared to the base case. The reason is the current material of the base case, which included the thermal mass of a 30-cm brick wall.
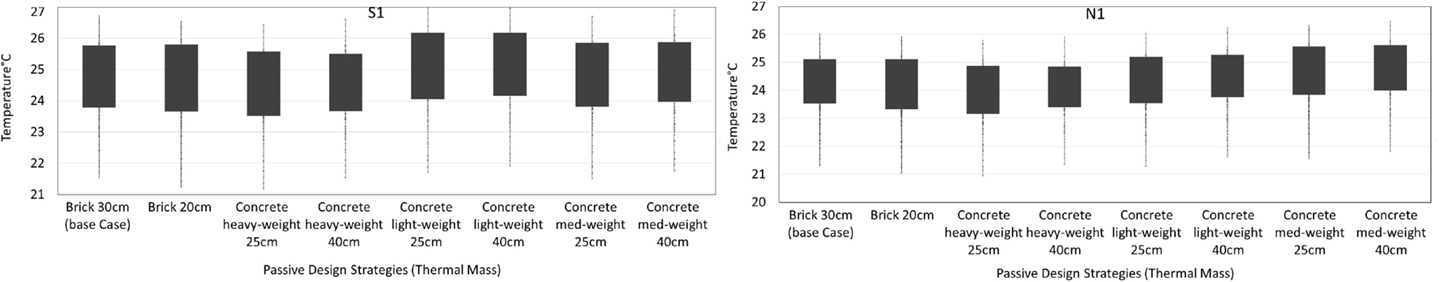
Figure 9. Plot box of indoor air temperatures with different thermal mass materials in classrooms S1 and N1 in May 2010.
Considering Figure 9, it can be seen that the application of thicker materials usually resulted in lower reduction in the indoor air temperatures in both classrooms. For example, using 40 cm heavyweight concrete blocks in the external walls caused less reduction in the indoor air temperatures than using 25 cm heavyweight concrete blocks. Based on the literature, the impact of thermal mass is increased by increasing thermal density and decreasing the thickness of the material, which causes more constant heat capacity. A thinner density of mass material responds faster to surface temperature fluctuations and consequently stores excessive heat gains and dampen interior air temperatures more effectively (Byrne and Ritschard, 1985; Fehr, 2009; Autodesk Sustainability Workshop, 2011). It is also essential to locate thermal mass in direct solar radiation for it to have more impact on the indoor air temperatures, although indirect sunlight has an effect on the overall performance of the building, as the walls be heated by air convection (Nasrollahi, 2009; Autodesk Sustainability Workshop, 2011). In addition, it can be seen that using lightweight concrete increases the indoor air temperatures in both classrooms. Based on Ries and Holm (2004), using lightweight concrete in a building’s envelope causes longer time lags. In addition, Vangeem et al. (2013) reported that reducing the density of the concrete masonry walls results in increasing thermal lag. They cited that for external uninsulated concrete walls, the beneficial effects of thermal mass are increased as density is reduced from 2400 to 800 kg/m3 (see Figure 10), which may be a possible reason for the higher temperatures while using lightweight concrete masonry walls when compared to the use of heavyweight concrete.
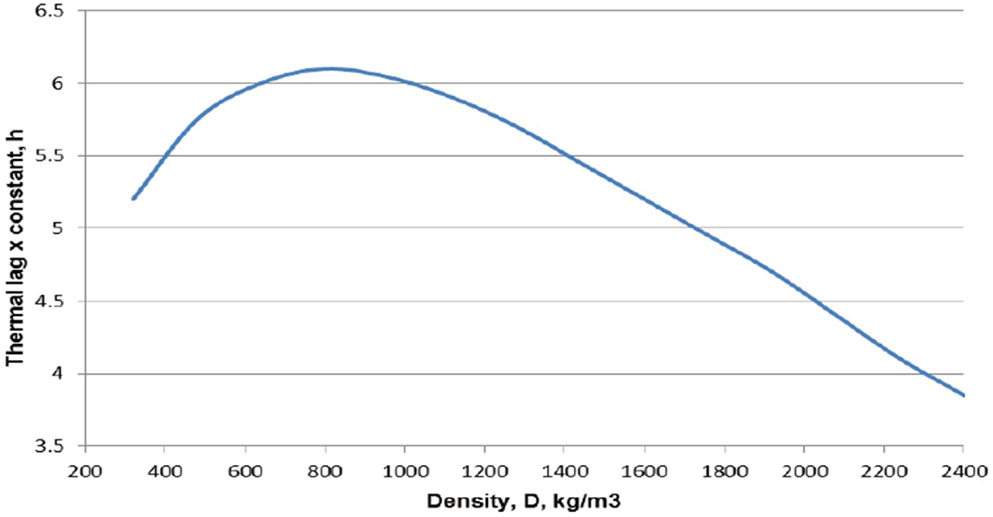
Figure 10. Optimum concrete density for maximum thermal lag (Vangeem et al., 2013).
Final Discussion
To estimate the effect of the optimum design solution, the measured indoor air temperature of the real base case building was compared to the effect of each optimum factor on the indoor air temperatures. Based on the results of the field study and the simulation analysis, by using passive design strategies, an optimum design solution for the base case building was defined. The optimum factors were taken from the analyzed passive design strategies, including orientation, shading devices, thermal mass, natural ventilation, and insulation, and with respect to the occupants’ thermal comfort satisfaction, which is discussed in Section “Questionnaire Survey.” The optimum passive design strategies were selected based on the effects of them on the indoor air temperatures, which were more close to the maximum comfort band in the warm season. The suggested primary optimum design solutions included suggested building orientation in the INBR, a combination of 30 cm of the overhangs and side fins for south- and north-facing side classrooms, external thermal insulation material with the U-value between 0.28 and 0.32 W/m2K for the external walls, 5 cm thermal insulation on the inner side of the roof, 25 cm high-density concrete blocks as a thermal mass for the exterior facades and all-day natural ventilation strategies during the warm season (Optimum 1). In addition, 30 cm outer brick was considered as a second suggested thermal mass material along with the other options used for the optimum design solution 1 (Optimum 2). Figure 11 illustrates the indoor air temperatures of the real base case and the optimum solutions in classrooms S1 and N1 with respect to the outdoor temperature and the comfort temperature in May 2010. The peak indoor air temperature is decreased by approximately 5K by the applications of optimum solutions in Classroom S1. It should be noted that the peak indoor air temperature was during the occupied period in midday while the windows were open. In addition, the indoor air temperature reduced by about 3K during the unoccupied period, which is still considered as a significant amount.
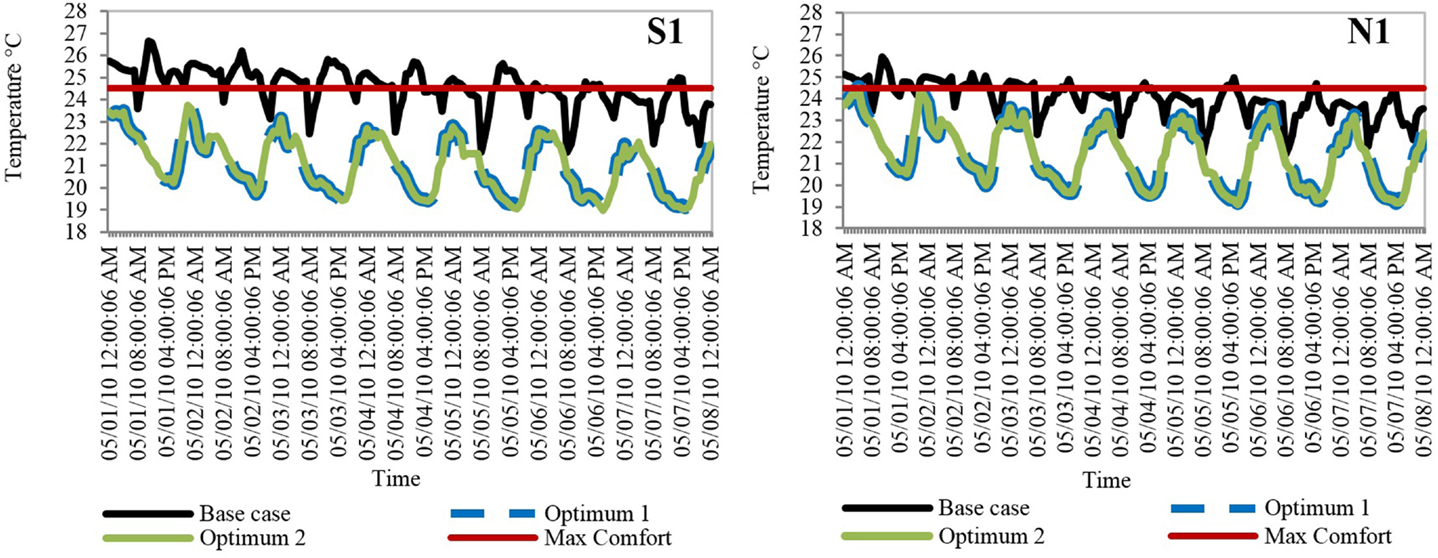
Figure 11. Optimum design solutions in Classrooms S1 and N1.
The reduction of the peak indoor air temperature during the occupied period in Classroom N1 was less than Classroom S1, around 4K that is still considerable. In addition, the reduction of maximum indoor air temperature during the unoccupied period was less than 2K. After the application of the optimum solutions, the whole profile of the indoor air temperatures was around proposed comfort temperature in both classrooms. The maximum and minimum temperatures were mostly within the proposed comfort band in both classrooms and the application of all optimum solutions resulted in the reduction of the average internal temperatures from about 5K in Classroom S1 to less than 4K in Classroom N1, which is again significant. Table 8 presents the temperature difference between the minimum, maximum, and mean indoor air temperatures before and after the application of optimum solutions. It can be seen that by applying all the proposed solutions, the indoor air temperatures in both classrooms reduced significantly and the temperature difference between each optimum solution and the base case temperature is approximately similar during May 2010.
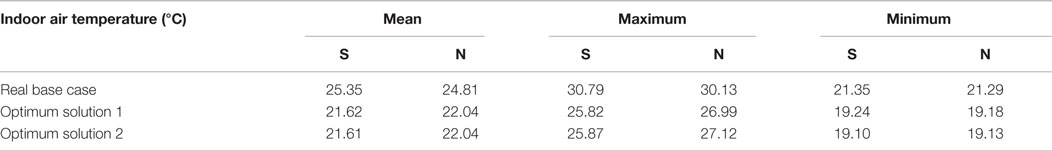
Table 8. Difference between minimum, maximum, and mean indoor air temperature before and after application of optimum solution in May 2010 in classrooms S1 and N1.
Recommended Optimum Solution
The aim of the optimum solution was to reduce the indoor air temperatures in the warm season and to keep the internal temperature in an acceptable range within the minimum energy use. The result of the simulation analysis of each parameter indicated that all-day natural ventilation and the application of the shading devices to the window areas helped significantly in reducing the indoor air temperatures in warm spring season. Employing the 30-cm overhang and side fins on the windows is the suggested optimal projection to reduce the indoor air temperature in spring. Applying 5 cm of thermal insulation on inner side of the roof also helps to decrease the indoor air temperatures in the warm season. Although adding insulation materials to the external wall increased the indoor air temperatures in spring, they had a small impact on increasing the temperatures, which was overcome by applying the shading devices and an all-day natural ventilation strategy. It should be noted that all-day ventilation has no cost at all and only obtained by keeping the windows open all day long. The installation of thermal insulation as well as shading devices require installation costs, but using these strategies will reduce the buildings energy costs over the years.
Table 9 shows the suggested optimum solution for the female secondary school building with respect to the thermal satisfaction of the occupants and passive design strategies for climatic condition of the city of Tehran. The passive design strategies included orientation, solar shading devices, natural ventilation and thermal mass, as well as thermal insulation for roof, and external walls.
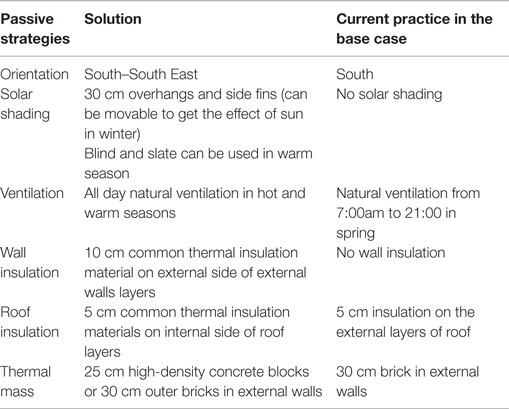
Table 9. Proposed passive design strategies for the female secondary school building in Tehran.
Conclusion
This study was carried out to investigate the thermal performance of a typical female secondary school building in Tehran during a warm spring season. A series of field studies, including a thermal comfort survey and on-site measurements, were conducted for 1 week in May 2010 to predict the indoor thermal condition, as well as the occupants’ thermal comfort. Thermal simulation analysis was also performed to evaluate and improve the building’s thermal performance using passive design strategies. The aim was to define a set of school buildings environmental design guidelines with respect to the students’ thermal comfort and passive design strategies in order to reduce the school buildings’ energy consumption and to increase the students’ thermal comfort.
The results of the field studies indicated that most of the occupants found their thermal environment not to be comfortable during the warm season and preferred to be in a cooler environment when the indoor air temperatures exceeded 24.5°C although the indoor air temperatures were within the comfort band defined by Heidari (2010) for offices and residential buildings. This shows that the female students’ comfort temperature is different from the residential and office buildings’ occupants, and the maximum comfort temperature is lower than the maximum band defined by Heidari (2010). Moreover, the results of the questionnaire-based survey indicated that just around 73% of the students’ responses fell into the central three categories of the ASHRAE scale, which expresses satisfaction, and more than 80% acceptability in these categories, from slightly cool to slightly warm, is enough to consider the indoor environment to be comfortable, which in this case in not. In addition, around 80% of the students in Classrooms N and around 60% in Classrooms S preferred a cooler indoor environment.
Moreover, the base case building was modeled in a dynamic building thermal simulation tool called DesignBuilder. Based on the passive design strategies and the students’ thermal preferences within the classrooms, the optimum design solutions were defined for the secondary school buildings to improve the indoor thermal conditions. The suggested optimum design solution includes all-day natural ventilation, installation of overhangs and side fins, the use of thermal mass and thermal insulation in the external walls and the roof, as well as the orientation. The primary simulation study was performed during a typical warmest week in May before school’s closure. The study shows that the application of passive design strategies, including south and south-east orientation, 10 cm thermal insulation in wall and 5 cm in the inner side of the roof, the combination of 30 cm side fins and overhangs as solar shading devices, as well as all-day ventilation strategy and thermal mass materials with 25–30 cm thickness, has considerable impact on reducing the indoor air temperatures in the warm season in Tehran, and keeps the indoor environment in an acceptable thermal condition. After applying the appropriate optimum solution to the case study building, the maximum indoor air temperature decreased by approximately 5K in south-facing classroom and 4K in north-facing classroom during the field study experiment in May.
Moreover, the simulation results indicate that the building fabric and the thermal properties, as well as all-day natural ventilation, had significant influences on reducing the indoor air temperatures in the classrooms and keeping it in acceptable conditions. Moreover, using these appropriate passive design strategies, such as thermal mass and thermal insulation materials, can also improve the thermal performance of the building during the winter period by keeping it warm, which also reduces the need for supplementary heating in cold periods. Therefore, in order to create a high quality indoor environment and to increase the learning performance of the students, it is necessary to use the appropriate passive design strategies, which also reduce the need for mechanical systems in the school buildings, and thus, save energy.
Author Contributions
HA is SZ’s first academic supervisor during her doctoral studies and has reviewed the paper and provided feedback for initial revision, HA is an Associate Editor for the HVAC Journal.
Conflict of Interest Statement
The authors declare that the research was conducted in the absence of any commercial or financial relationships that could be construed as a potential conflict of interest.
References
ASHRAE. (2004). ASHREA Standard 55. Thermal Environmental Conditions for Human Occupancy. Atlanta, GA: American Society of Heating, Refrigerating and Air-Conditioning Engineers.
Autodesk Ecotect Analysis. (2013). Passive Design [Online]. Natural Frequency. Available at: http://wiki.naturalfrequency.com/wiki/Passive_Design
Autodesk Sustainability Workshop. (2011). Building Design [Online]. Autodesk Education Community. Available at: http://sustainabilityworkshop.autodesk.com/buildings/thermal-mass
Byrne, S. J., and Ritschard, R. L. (1985). A Parametric Analysis of Thermal Mass in Residential Buildings. Thermal Performance of the Exterior Envelopes of Buildings III. Clearwater Beach, FL: ASHRAE/DOE/BTECC.
CABE. (2008). Sure Start Children’s Centres: A Post-Occupancy Evaluation. London: Commission for Architecture and the Built Environment.
CABE. (2010). Creating Excellent Primary Schools. London: Commission for Architecture and the Built Environment.
DesignBuilder. (2013). Building Simulation [Online]. DesignBuilder Software Ltd. Available at: http://www.designbuilder.co.uk/
DFE. (2010). Overhaul to England’s School Building Programme [Online]. Department for Education. Available at: https://www.gov.uk/government/news/overhaul-to-englands-school-building-programme [accessed February 17, 2016].
Fanger, P. O. (1973). Assessment of man’s thermal comfort in practice. Br. J. Ind. Med. 30, 313–324.
Fehr, R. L. (2009). Guide to Building Energy Efficient Homes. Kentucky: Department of Biosystems and Agricultural Engineering, University of Kentucky.
Ford, B., Schiano-Phan, R., and Zhongcheng, D. (2007). The Passivhaus Standard in European Warm Climate: Design Guidelines for Comfortable Low Energy Homes – Part 3. Comfort, Climate and Passive Strategies. Nottingham: The University of Nottingham.
Ghaffari, A. (1998). Architectural Design Principles of Educational Spaces. Tehran: State Organisation of Schools Renovation, Development and Mobilisation.
Givoni, B. (1998). Climate Considerations in Building and Urban Design. New York: Van Nostrand Reinhold.
Gorji-Mahlabani, Y. (2002). Climatic Effects on School Buildings. Ph.D. thesis, The University of Sheffield, Sheffield.
Heidari, S. (2010). Coping with Nature: Ten Years Thermal Comfort Studies in Iran. Adapting to Change: New Thinking on Comfort. Windsor: Network for Comfort and Energy Use in Buildings.
IFCO. (2012). Thermal Insulation of Buildings [Online]. Tehran Iranian Fuel Conservation Company. Available at: http://ifco.ir/building/build/isulation_extra1.asp
Iravani, S. (2010). The Causes of Inadequate Development in Educational Status and School Design in Iran in Recent Century [Online]. Tehran: DesignShare, P.Tec. Available at: http://www.designshare.com/images/article2irvani.pdf
IRIMA. (2012). Thermal Insulation Types [Online]. Isfahan: Iran’s Insulation Encyclopedia. Available at: http://www.irima.ir/home/thermal-insulation/thermal-insulation-classify
Kasmai, M. (1994). Educational Buildings in Climatical Area of Iran. Tehran: State Organisation of Schools Renovation, Development and Mobilisation.
Kruger, E., and Givoni, B. (2008). Thermal monitoring and indoor thermal predictions in a passive solar building in an arid environment. Build. Environ. 43, 1792–1804. doi: 10.1016/j.buildenv.2007.10.019
LHSBC (Light House Sustainable Building Centre), and Wimmers, G. (2009). Passive Design Toolkits for Homes. Vancouver: City of Vancouver.
Limbachiya, V., Vadodaria, K., Loveday, D., and Haines, V. (2012). “Identifying a suitable method for studying thermal comfort in poeople’s homes,” in Proceedings of the 7th Windsor Conference on The Changing Context of Comfort in an Unpredictable World, Cumberland Lodge, Windsor, UK, 12-15 April 2012. London: Network for Comfort and Energy Use in Buildings (NCEUB).
Mahdizadeh, A. (2011). Report on Retrofit Procedure of School Buildings in Islamic Republic of Iran. Tehran: Ministry of Education State Organization of Schools Renovation.
McIntyre, D. A., and Gonzalez, R. R. (1976). Man’s thermal sensitivity during temperature changes at two levels of clothing insulation and activity. ASHRAE Trans. 82, 219–233.
Mikler, V., Bicol, A., Breisness, B., and Labrie, M. (2009). Passive Design Toolkit. Vancouver: City of Vancouver.
Ministry of Housing and Urban Development. (2009). National Building Regulations of Iran Energy Saving. Tehran: Office of National Building Regulations.
Nasrollahi, F. (2009). Climate and Energy Responsive Housing in Continental Climates: The Suitability of Passive Houses for Iran’s Dry and Cold Climate. Berlin: Berlin University of Technology.
Nicol, F., and Humphrey, M. A. (2001). Adaptive thermal comfort and sustainable thermal standards for buildings. Windsor Conference 2001, Moving Thermal Comfort Standards into the 21st Century. Windsor: Network for Comfort and Energy Use in Buildings.
Nosazi Madares. (2013). Increase of Study Area per Head in Iranian Schools [Online]. Tehran: State Organization of School Renovation, Development and Mobilization. Available at: http://www.nosazimadares.ir/News/_layouts/viewlsts.aspx
O’Connor, J., Lee, E., Rubinstein, F., and Selkowitz, S. (1997). Tips for Daylighting. Berkeley, CA: The California Institute for Energy Efficiency (CIEE), The U.S. Department of Energy.
PricewaterhouseCoopers and DCSF. (2007). Evaluation of Building Schools for the Future. Technical Report. London.
Richardson, H. (2010). School Buildings Scheme Scrapped [Online]. BBC News. Available at: http://www.bbc.co.uk/news/10514113
Ries, J. P., and Holm, T. A. (2004). A Holistic Approach to Sustainability for the Concrete Community: Lightweight Concrete-Two Millennia of Proven Performance. Salt Lake City, Utah: ESCSI.
Sheta, W. A. M. (2012). Keeping Cool in Cairo: Thermal Simulation of Passive Cooling in Dwellings. Ph.D. thesis, The University of Sheffield, Sheffield.
Keywords: thermal performance, field measurements, passive design, thermal simulation, school buildings
Citation: Zahiri S and Altan H (2016) The Effect of Passive Design Strategies on Thermal Performance of Female Secondary School Buildings during Warm Season in a Hot and Dry Climate. Front. Built Environ. 2:3. doi: 10.3389/fbuil.2016.00003
Received: 19 November 2015; Accepted: 12 February 2016;
Published: 07 March 2016
Edited by:
Yaolin Lin, Wuhan University of Technology, ChinaReviewed by:
Zhenjun Ma, University of Wollongong, AustraliaRongxin Yin, Lawrence Berkeley National Laboratory, USA
Copyright: © 2016 Zahiri and Altan. This is an open-access article distributed under the terms of the Creative Commons Attribution License (CC BY). The use, distribution or reproduction in other forums is permitted, provided the original author(s) or licensor are credited and that the original publication in this journal is cited, in accordance with accepted academic practice. No use, distribution or reproduction is permitted which does not comply with these terms.
*Correspondence: Sahar Zahiri, sahar.zahiri@gmail.com