Performance-Based Placement of Manufactured Viscoelastic Dampers for Design Response Spectrum
 Yutaka Nakamura
 Tetsuya Hanzawa
 Takeshi Nomura2
- 1Institute of Technology, Shimizu Corporation, Tokyo, Japan
- 2Sumitomo Riko Company, Ltd., Komaki-shi, Japan
In this study, a viscoelastic damper (VED) is developed by using a VE material with low temperature dependence, and a performance-based placement-design procedure of VEDs is developed for finding the story-wise distribution of VEDs in a building such that each peak interstory drift coincides with the prescribed value. The mechanical properties of the employed VEDs dependence on amplitude and frequency of the excitation as well as material temperature are taken into account and a mechanical non-linear four-element model that comprises two dashpot elements and two spring elements is proposed for the VED. The developed performance-based design procedure utilizes equivalent linearization of the VED and the expanded complete quadratic combination method, which involves modal analysis with complex eigenvalue analysis. An equivalent linear Voigt model of the VED is determined by the prescribed peak interstory drift and the fundamental natural period of the structure for which the VEDs are installed. Seismic response analyses are carried out for high-rise building models installed with the necessary number of wall-type VEDs, with the results demonstrating the effectiveness and validity of the proposed performance-based placement-design procedure.
Introduction
Various dampers and energy dissipation devices have been developed and are widely used to reduce the earthquake response of buildings, such as the viscoelastic damper (VED), metallic hysteretic damper, friction damper, and viscous fluid damper. VEDs were first used in building structures to reduce wind-induced vibrations (Mahmoodi et al., 1987) and have subsequently been studied and used to reduce the earthquake response of buildings (Soong and Dargush, 1997; Cheng et al., 2008; Takewaki, 2009). As shown in Figure 1, a typical VED consists of a VE material or a high damping rubber that is bonded between an inner steel plate and an outer steel plate and is subjected to shear deformation. The story-installation-type VED is generally found in three configurations: brace type, wall type, and column type, as shown in Figure 2. The VED induces a viscous shear force in response to relative interstory drift, causing energy dissipation, and hence, the VE material properties govern the performance and characteristics of the VED.
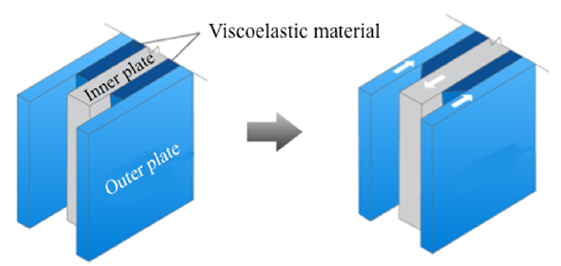
Figure 1. Principle of VED.
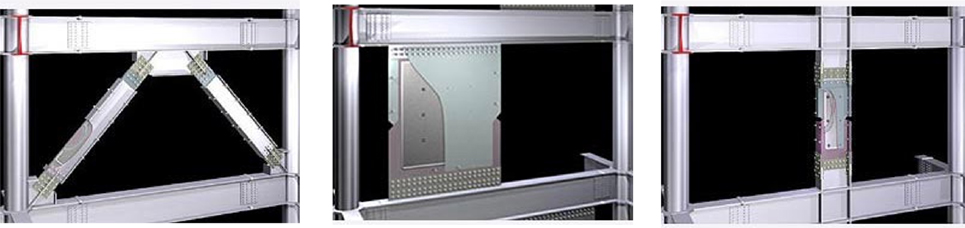
Figure 2. Configurations of story-installation-type VEDs.
Mechanical properties of the VED generally show a significant dependence on the amplitude and frequency of the excitation and material temperature depending on the employed VE material. For the use of VEDs in a building, one should consider their non-linear characteristics and dependence and study the necessary story-wise placement of the dampers to meet the seismic design performance objectives. Although quite a few previous studies have been carried out on the optimum or effective placement of viscous or VEDs, these have dealt with the damper as an ideal mechanical model that comprises a linear dashpot element with/without a linear spring element (Chang et al., 1992; Zhang and Soong, 1992; Gluck et al., 1996; Tsuji and Nakamura, 1996; Takewaki, 1997, 2000; Ribakov and Gluck, 1999; Takewaki et al., 1999, 2013; Garcia, 2001; Singh and Moreschi, 2001, 2002; Uetani et al., 2003; Xu et al., 2003; Liu et al., 2004, 2005; Park et al., 2004; Lavan and Levy, 2005, 2006; Tan et al., 2005; Cimellaro, 2007; Silvestri and Trombetti, 2007) and have treated the optimum placement of ideal viscous or VEDs installed in a building under seismic excitations. The story-wise placement of supplemental dampers or damping coefficients was found to meet the seismic design constraints or to optimize the values of the target properties. The constraints are mostly imposed on the interstory drifts of a structure subjected to a specified earthquake input, since the interstory drifts can be regarded as the most important seismic design index. The mean peak interstory drifts of the building installed with dampers subjected to the specified design displacement response spectrum can be estimated using the expanded complete quadratic combination (CQC) method, which entails modal analysis with complex eigenvalue analysis (Igusa et al., 1984; Yang et al., 1990).
In addition to the interstory drift criteria, Takewaki (1997) and Takewaki et al. (1999) minimized the sum of amplitudes of the transfer functions evaluated at the undamped fundamental natural frequency of a structure. Lavan and Levy (2005) chose energy-based damage indices based on the hysteretic energy dissipated by the restoring force divided by its hysteretic energy at failure. Tan et al. (2005) and Liu et al. (2005) considered an acceleration-based criterion in addition to the interstory drift criteria. Silvestri and Trombetti (2007) studied various performance indices, such as the SD of the roof displacement or the base shear, the average of the SDs of the interstory drift angles, and the sum of the SDs of the damper forces. Cimellaro (2007) minimized the sum of the norm of the displacement, absolute acceleration, and base shear transfer function evaluated at the fundamental natural frequency.
Various sequential procedures have been proposed to find the optimum placement of the supplemental dampers in a structure. The basic idea is that a controller is optimally located if it is placed at a position where the displacement response of the uncontrolled structure is the largest (Zhang and Soong, 1992). To find the optimal location, Gluck et al. (1996) used the solution for the linear quadratic regulator problem, Singh and Moreschi (2001, 2002) employed a gradient-based optimization approach and a genetic algorithm, and Xu et al. (2003) utilized the simplex method. Takewaki (2009) explored the repetitive performance sensitivity analysis, using which the supplemental damper is installed into the story with the highest performance sensitivity.
This study has novelty in light of an employed manufactured VED with amplitude and frequency dependence and a proposed placement-design procedure of the VEDs utilizing the equivalent linearization under the interstory drift constraint. Although most previous studies have dealt with idealized VED, which comprises a linear dashpot element, we employ a manufactured wall-type VED that uses our newly produced VE material with low temperature dependence. A mechanical model for the VED was proposed using a non-linear four-element (NLF) model that comprises two non-linear dashpot elements and two non-linear spring elements (Nakamura and Kaneko, 1998). A placement-design procedure is proposed for the VEDs such that each peak interstory drift is limited to the specified value for a given design response spectrum (Nakamura and Hanzawa, 2002). The proposed design procedure has originality in the equivalent linearization of the VED based on the interstory drift constraint and the expanded CQC method in the peak response estimation. The validity of the proposed design procedure is demonstrated by design examples of high-rise building models.
Review of a Developed VED
The VED generally exhibits large temperature dependence (Chang et al., 1992; Soong and Dargush, 1997), which is considered to be a drawback and limits its applicability. A new VED was developed by utilizing a newly produced VE material with low temperature dependence. Based on a series of dynamic tests of the VE material specimen, a mechanical model for the VED was proposed using an NLF model that comprises two non-linear dashpot elements and two non-linear spring elements. The validity of the proposed mechanical model of the VED was verified through the dynamic loading tests of a half-scale VED. In this section, the proposed NLF model of the VED is reviewed, and its test results are described.
Mechanical Characteristics of VE Material
The newly developed VE material is made of thermoplastic elastomer of the olefin–styrene series. Table 1 shows the compounding ratios of the VE material. A series of dynamic loading tests were carried out on a test specimen consisting of a 70-mm × 80-mm sheet of the VE material (thickness d = 5 mm, total shear area AS = 5,600 mm2), as shown in Figure 3. The air temperature (Te) was 20°C. Figure 4 shows hysteresis loops for an increasing sine wave and for an earthquake interstory drift of the 8th floor of a hypothetical 15-story building (Appendix A).
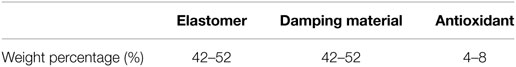
Table 1. Compounding ratios of VE material.
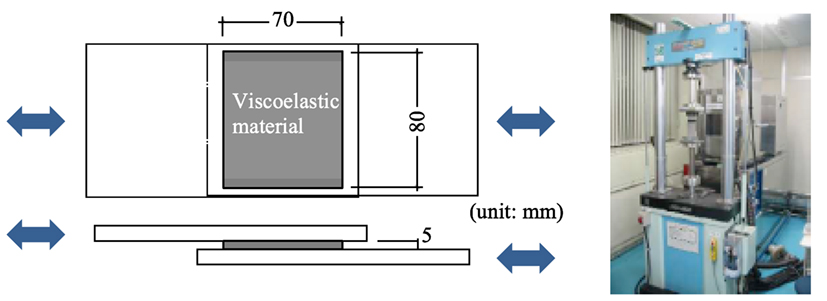
Figure 3. Test specimen of VE material and the dynamic testing machine.
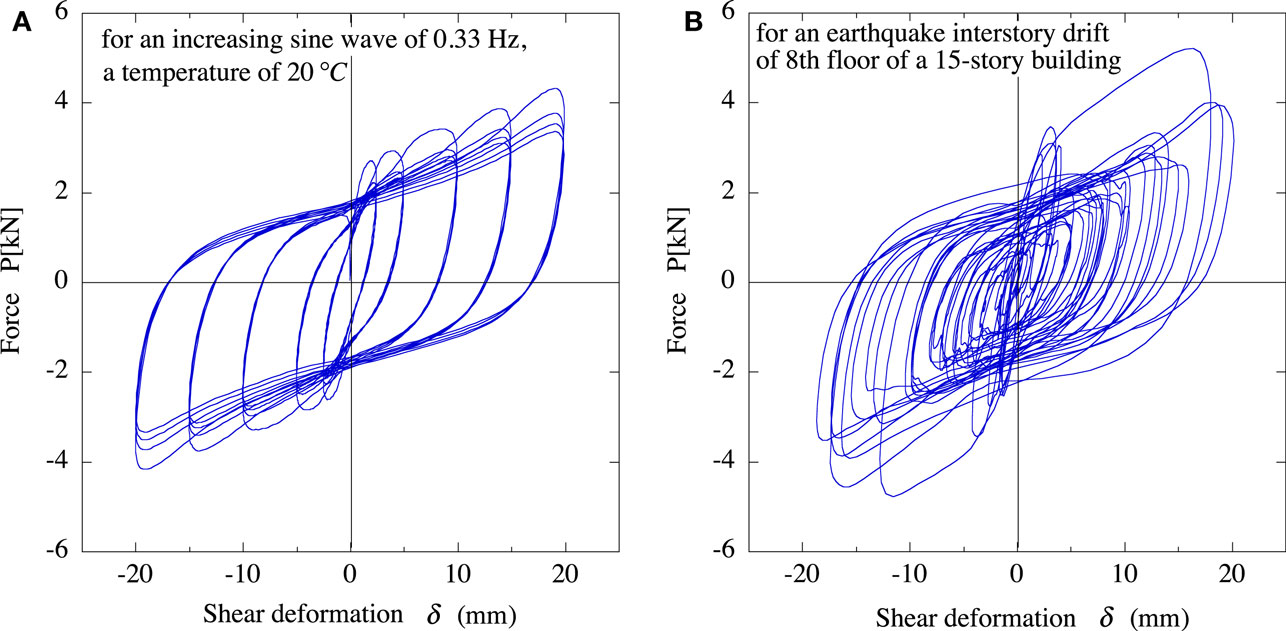
Figure 4. Resisting force characteristics of VE material. (A) for an increasing sine wave and (B) for an earthquake interstory drift.
From the measured hysteresis loop under sinusoidal loading, as shown in Figure 5, the equivalent shear stiffness, Keq, the equivalent damping coefficient, Ceq, and the equivalent damping factor, heq, were obtained by
where ω indicates the circular frequency of a sine wave.
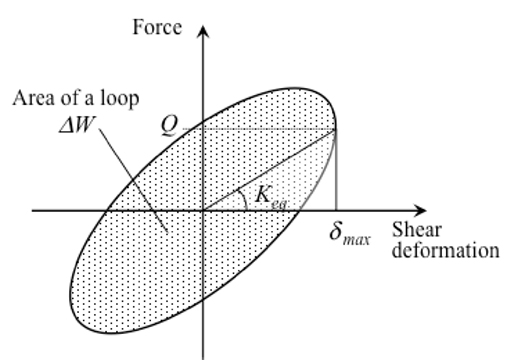
Figure 5. Evaluation of equivalent stiffness and area of a hysteresis loop.
Figure 6 shows the obtained values of Keq, Ceq, and heq for the shear strain, γmax = (δmax /d), of the VE material at air temperature, Te, of 20°C, where δmax indicates the amplitude of the sinusoidal wave. Figure 6 indicates the amplitude and frequency dependence of the VE material, and both Keq and Ceq decrease with increasing γmax, while heq is almost constant at about 0.4 irrespective of the amplitude and frequency of the input.
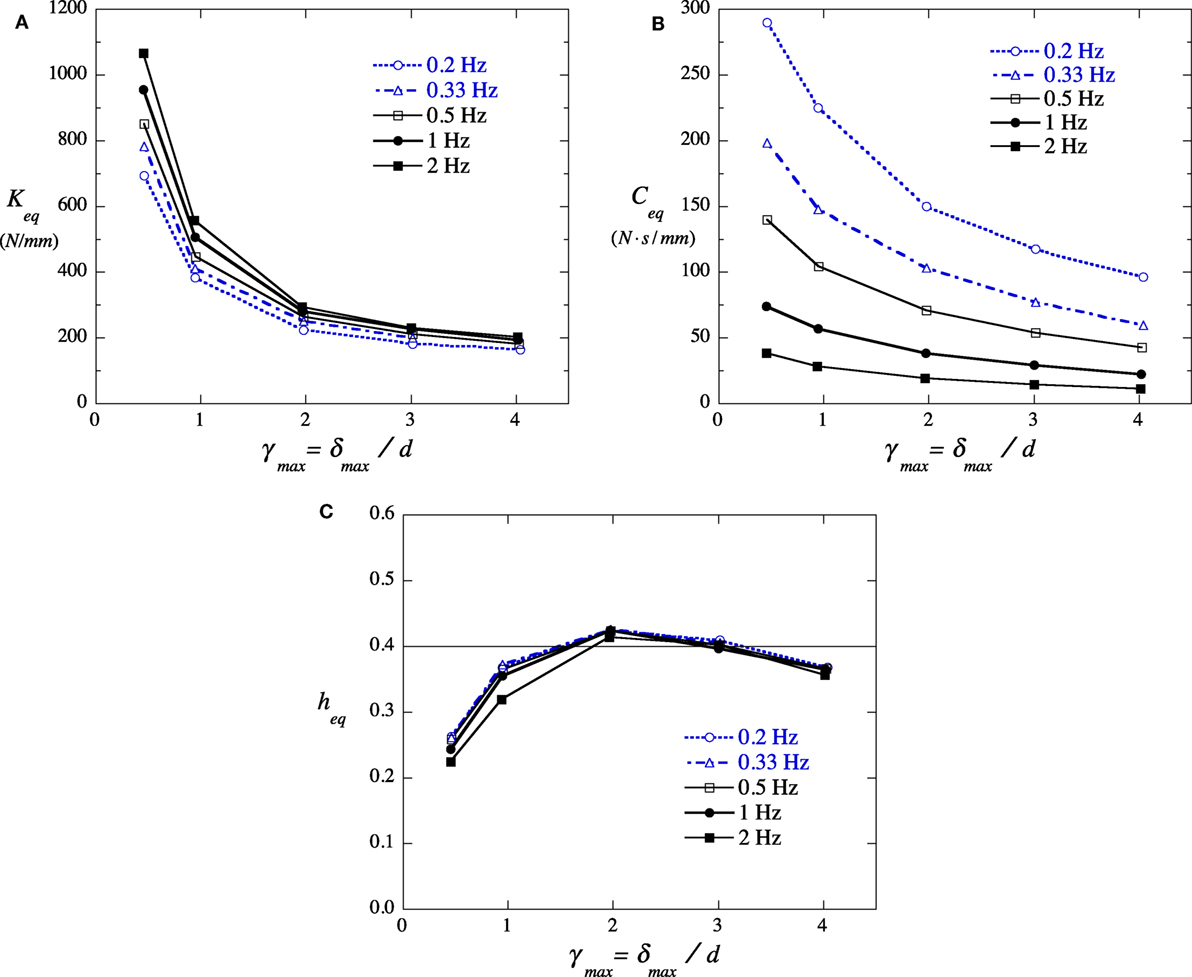
Figure 6. Amplitude and frequency dependency of mechanical characteristics of VE material. (A) equivalent shear stiffness, (B) equivalent damping coefficient, and (C) equivalent damping factor.
Figure 7 shows Keq and Ceq for Te = 0–40°C where Keq and Ceq values are normalized by the value at Te = 20°C, respectively. This figure indicates that the temperature dependence of Keq and Ceq can be well expressed by exp{−0.017(Te − 20)}. The temperature dependence is much smaller than that for the other viscoelastic materials for the VED that have been in practical use.
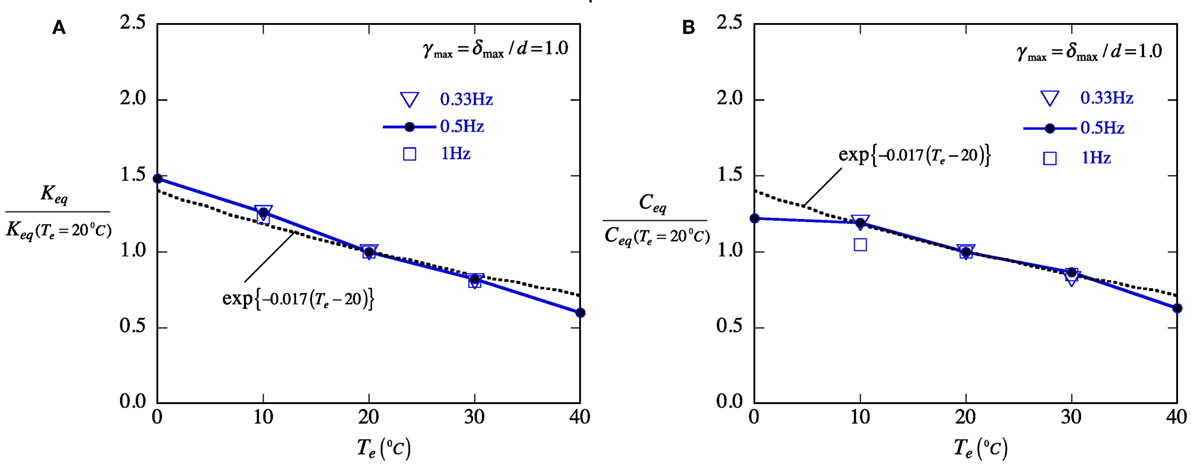
Figure 7. Temperature dependency of the equivalent stiffness and damping coefficient of test VE material. (A) Keq/Keq(Te = 20°C) and (B) Ceq/Ceq(Te = 20°C).
NLF Model of VE Material
A mechanical model for the VE material was proposed by an NLF model (Nakamura and Kaneko, 1998) that comprises two non-linear dashpot elements and two non-linear spring elements as shown in Figure 8 and expressed by Eqs 2a–d. The four-element model shown in Figure 8A can express the frequency dependence of the VE material, and the non-linear characteristics of the four elements shown in Figures 8B,C can provide the amplitude dependence of the VE material. The temperature dependence of the VE material is expressed by incorporating the temperature-dependent function, Ft(Te), in each element.
where As and d indicates the area and the thickness of the VE material, respectively. The coefficients of the four elements are first determined to express the obtained frequency dependence for a fixed shear strain of γ = 200% by trial and error, and then non-linear characteristics with respect to γ are incorporated to express the obtained amplitude dependence (Nakamura and Kaneko, 1998).
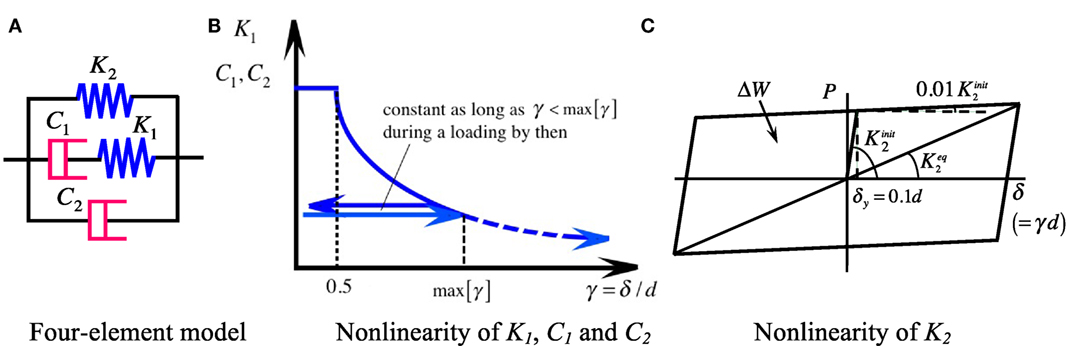
Figure 8. NLF model. (A) Four-element model; (B) non-linearity of K1, C1, and C2; (C) non-linearity of K2.
The equivalent shear stiffness, Keq, and the equivalent damping coefficient, Ceq, of the proposed NLF model under sinusoidal loading are expressed as follows.
where
and ω indicates the circular frequency of the excitation. Figure 9 shows Keq and Ceq obtained from the experimental results of the test VE material under sinusoidal loading and those of the proposed NLF model. Figure 9 indicates that the proposed NLF model can express the dynamic characteristics of the VE material with good accuracy.
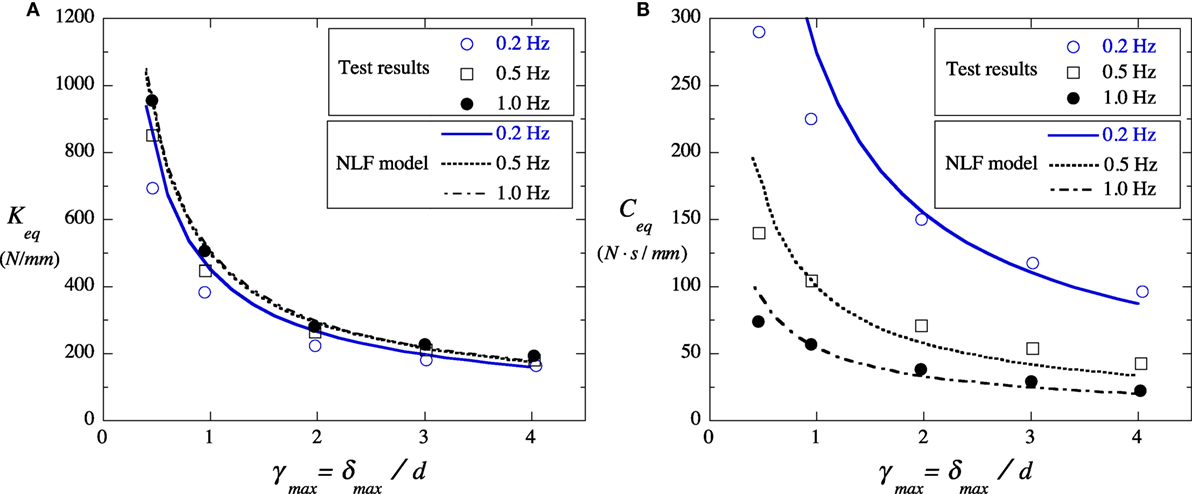
Figure 9. Equivalent stiffness and damping coefficient of experimental results of VE material and those of proposed NLF model. (A) Keq − γmax relationship and (B) Ceq − γmax relationship.
Dynamic Loading Tests of VED
Using a half-scale model of the wall-type VED, dynamic loading tests were carried out to verify that the resisting force characteristics of the scale VED can be accurately simulated by the proposed NLF model. Figure 10 shows a schematic diagram of a half-scale wall-type VED and the setup of a dynamic loading test. Two VE materials with dimensions of 600 mm × 600 mm and thickness of 10 mm were held between an inner steel plate and an outer steel plate by vulcanizing bonding. The total area of the VE material in the VED, As, was 720 × 103 mm2.
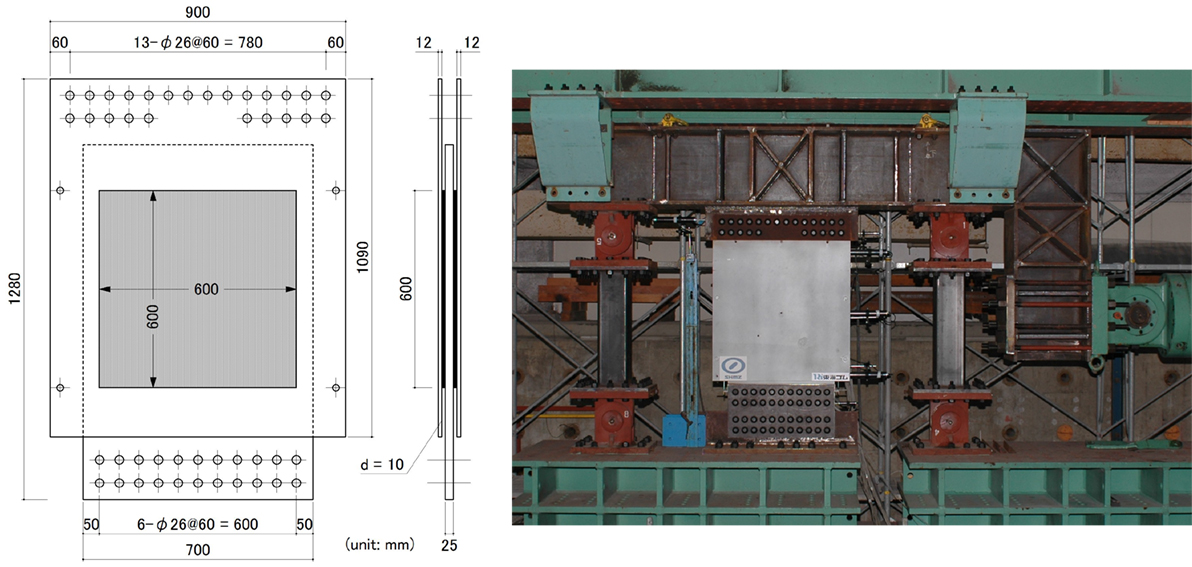
Figure 10. Schematic diagram of a VED and setup of dynamic loading test.
Figure 11 shows an experimental hysteresis loop of the half-scale model VED and that of the test VE material specimen (As = 5.6 × 103 mm2, d = 5 mm) in Figure 3 for an earthquake interstory drift of the 8th floor of a hypothetical 15-story building (Appendix A). The vertical axis of Figure 11 represents the shear stress, τ which is obtained from the resisting shear force, Q, divided by As. The horizontal axis of Figure 11 represents the shear strain, γ, which is obtained from the applied time–history deformation, δ, divided by the thickness of the VE material, d. The two hysteresis loops in Figure 11 are very similar, implying that the resisting force of the VE material is proportional to the area of the VE material.
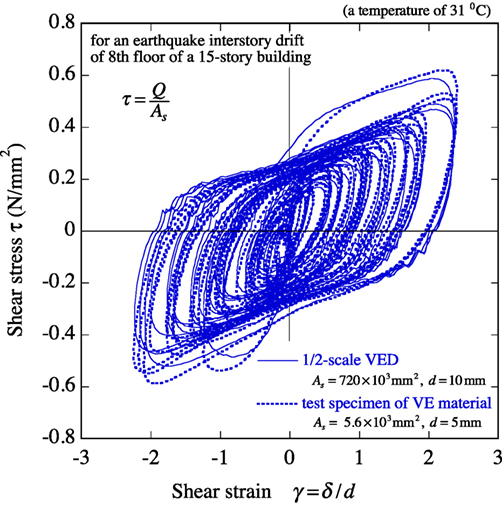
Figure 11. Resisting force characteristics of test VE material and VED.
Figure 12 shows an experimental hysteresis loop of the half-scale model VED and a simulation result by the NLF model for an earthquake interstory drift of the 24th floor of a hypothetical 24-story building (Appendix A). The simulation result in Figure 12 is computed by the NLF model (Figure 8) and Eqs 2a–e, which need the time–history shear strain, γ, but not the value of ω. The simulations were in good agreement with the experimental result, implying that the mechanical characteristic of the VED can be accurately estimated by the proposed NLF model.
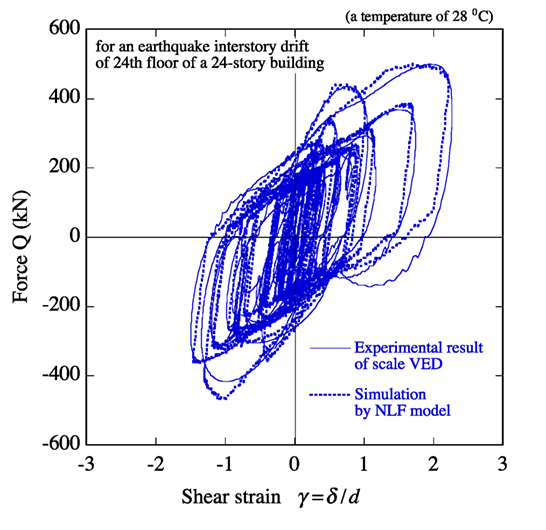
Figure 12. Resisting force characteristics of mechanical model and experimental results of VED.
Maximum Earthquake Response of a Building with VEDs
The seismic design constraints are generally imposed on the peak responses of a structure subjected to a specified earthquake input. The computational method is proposed here for estimating the peak interstory drifts of a building where VEDs with mechanical characteristics given by the NLF model are used. The mean peak interstory drifts can be estimated by using the equivalent linearization of the VEDs and the expanded CQC method for the specified design displacement response spectrum.
Equivalent Linearization of VED
The NLF model of the VED can be converted into a linear Voigt model comprising a linear spring and a linear dashpot connected in parallel by utilizing the equivalent linearization. Substituting the maximum shear strain of the VED, γmax, for γ in Eqs 2 and 4, and the fundamental natural period of the building, T1, for ω in Eq. (4) as ω = 2π/T1, the equivalent shear stiffness, KD, and the equivalent damping coefficient, CD, of the converted Voigt model shown in Figure 13 are given by Eqs 3a and b, respectively, for a specified set {As, d, Te}.
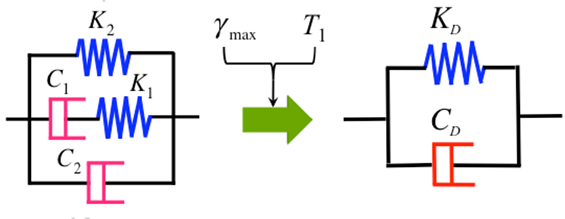
Figure 13. Equivalent linearization of NLF model.
The maximum shear strain γmax of the VED installed in a story can be evaluated from the interstory drift constraint in a performance-based design. When the peak interstory drift angle is specified as for the story of a floor height Ls and the mounting component for the VED can be regarded as stiff enough, γmax is given by
The fundamental natural period, T1, of the building installed with the VED can be obtained through the modal analysis explained in the following section. The equivalent linearization of the VED considering the stiffness of the mounting component is described in Appendix B.
Modal Analysis by the Expanded CQC Method
Consider a multistory shear building in which the VEDs are installed between the floors. The mean peak response of the building to an earthquake can be estimated using modal analysis. The equivalent shear stiffness, kDj, and the equivalent damping coefficient, cDj, of the Voigt model of the VED installed at the j-th floor are added to the story shear stiffness, kSj, and the story damping coefficient, cSj. The equations of motion of an f -story shear building can then be written as follows:
where and and denote the horizontal displacements of the floors and the input earthquake acceleration, respectively, MS denotes the diagonal mass matrix of the structure, CS and CD denote the tri-diagonal damping matrices for the structure and for the installed VEDs, respectively, and KS and KD denote the tri-diagonal stiffness matrices for the structure and for the installed VEDs, respectively. The damping matrix, CS + CD, in Eq. (6) represents non-proportional damping, and the eigenvalue problem of Eq. (6) is given using Foss’s method (Foss, 1958) as
Equation 7 gives f pairs of complex conjugate eigenvalues {λ}, and their corresponding eigenvectors {u} for damped vibration as listed below.
where and are a pair of complex conjugate eigenvalues. The natural circular frequency, ωj, and the damping factor, hj, of the j-th mode are given by
The mean peak interstory drifts, {δj}, of the building subjected to the specified design displacement response spectrum Sd (ω;h) can be estimated using the expanded CQC method (Igusa et al., 1984) as follows:
where Re[ ] and Im[ ] denote the real and imaginary parts of a complex number, respectively, and , , and are the modal cross-correlation coefficients given by Yang et al. (1990) as follows:
where p(r,s) = ωr/ωs.
Performance-Based Placement-Design Procedure of VED
A placement-design procedure for the VEDs is proposed here such that each peak interstory drift angle {βj} of an f-story shear building with a specified set {MS, CS, KS} subjected to a design earthquake Sd (ω;h) would coincide with the prescribed value (j = 1, 2, …, f). Figure 14 presents a design process for finding the distribution of the VEDs’ {Aj} (j = 1, 2, …, f) that are required to limit the interstory drift angles to the specified target values. Here, {Aj} means the total area of the VE material in the dampers at the j-th floor, while the thickness (d) and the temperature (Te) of the VE material are previously defined.
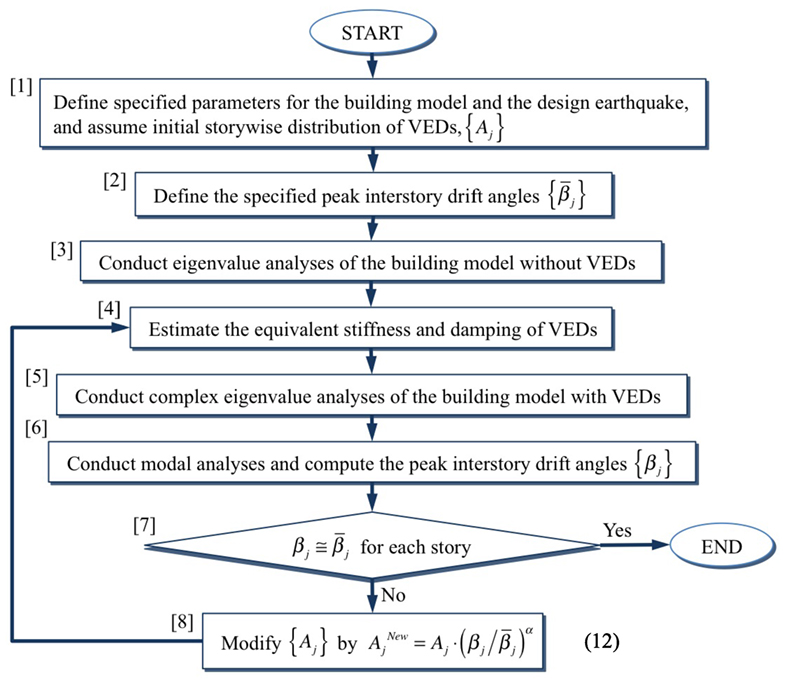
Figure 14. Design process for placement design of VED for specified peak interstory drifts.
In the design process shown in Figure 14, Aj is adjusted by the ratio of the estimated peak interstory drift angle, βj, to the target value, , and α in Eq. (12) is the control parameter, which is specified as 0 < α ≤ 1.
As {Aj} values are adjusted in the design process, the T1 value of the building with VEDs varies. Hence, the estimation in step (4) of the process should always be based on T1, which is obtained by the previous eigenvalue analysis. The proposed design procedure utilizes complex eigenvalue analysis, and therefore, can provide the changes in the equivalent natural periods and the equivalent damping factors of the building with VEDs.
Design Examples
Below, design examples of the performance-based placements of wall-type VEDs for three high-rise building models such that each peak interstory drift angle is reduced to the prescribed value, are shown. Time–history response analyses are carried out for the buildings installed with the necessary number of VEDs to demonstrate the validity of the proposed design procedure.
High-Rise Building Models with Optimally Placed VED
Consider a 20-, 30-, and 40-story shear buildings with mass and story stiffness properties as shown in Figure 15, which are based on actual high-rise buildings. The fundamental natural periods of the buildings without dampers, T1, and their story heights are shown in Table 2. The damping ratio in the first mode, h1, is assumed to be 2%, and those in the higher modes are assumed to be proportional to the frequency.
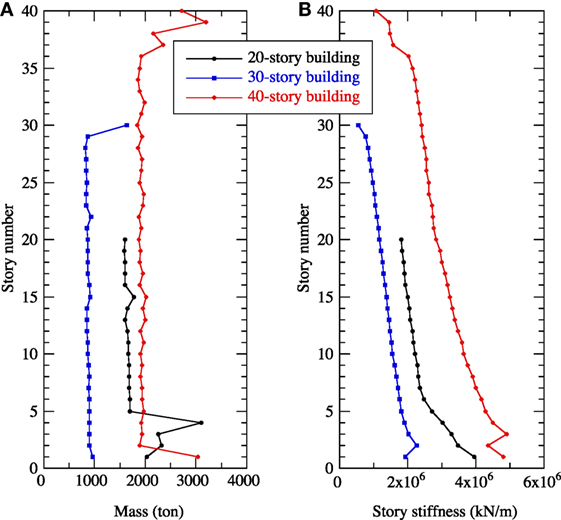
Figure 15. Mass and story stiffness of 20-, 30-, and 40-story shear buildings. (A) Mass (tons) and (B) story stiffness (kilonewtons per meter).
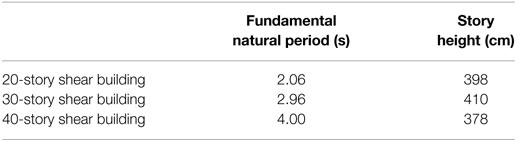
Table 2. Fundamental natural period and story height of 20-, 30-, and 40-story shear buildings.
The wall-type VED shown in Figure 16 is employed to control the peak interstory drifts of the buildings. The VE material is 5 mm in thickness and the total area of the VE material of one wall-type VED is 1.6128 m2. The ambient temperature is assumed to be 20°C. The story-wise distributions of {Aj} are now determined such that the peak interstory drift angle for all stories is for the Level 2 design response spectrum specified by the Japan Building Center (Figure 17). The control parameter α in Eq. (12) is 0.3 in the design process.
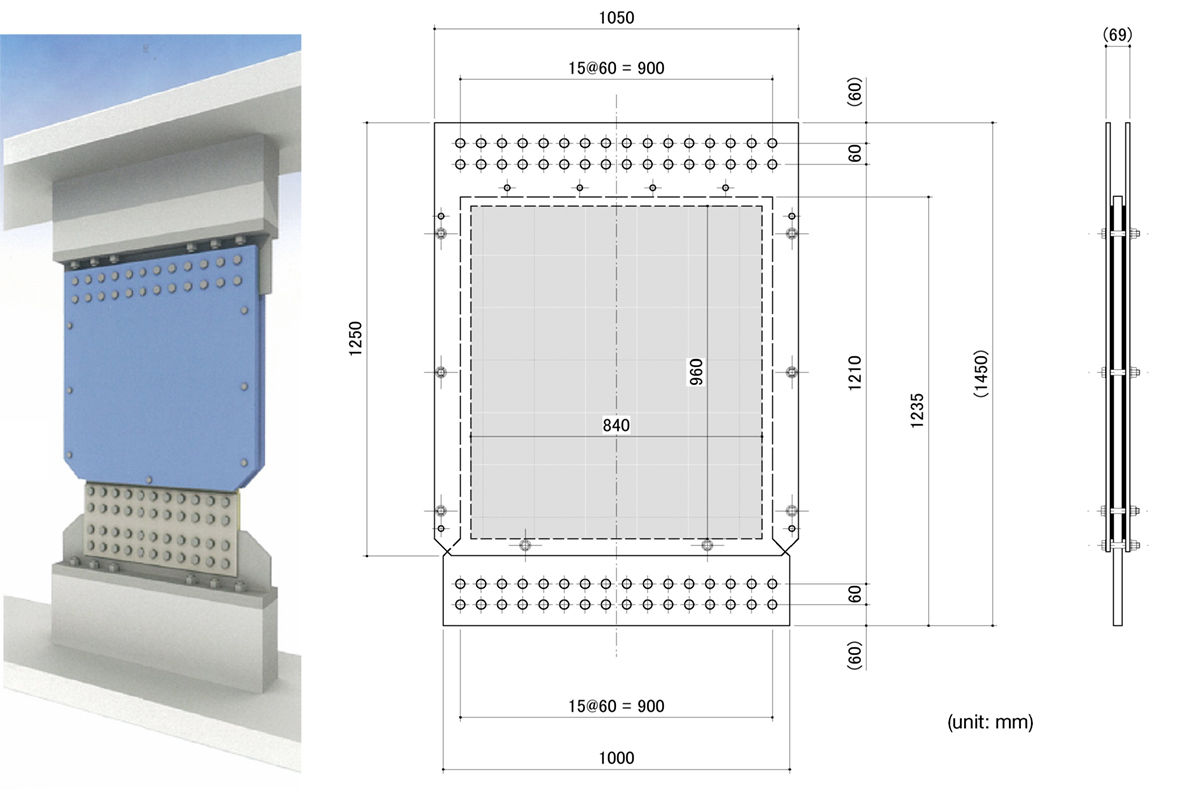
Figure 16. Wall-type VED.
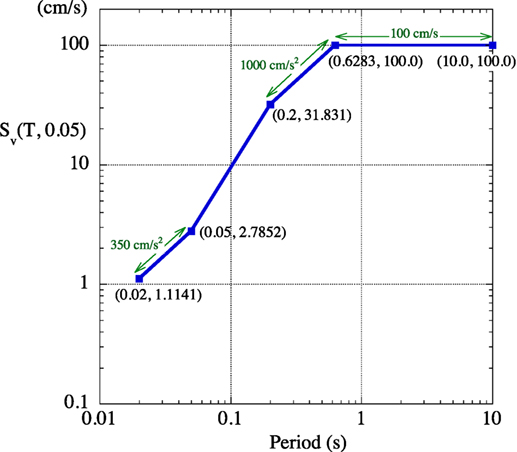
Figure 17. Design velocity response spectrum.
The extracted progress of story-wise distribution of the area of the VE material in the 20-story building is shown in Figure 18A, together with the estimated peak interstory drift angles in Figure 18B, which vary according to the story-wise distribution of the area of the VE material. As shown on the left-hand side of Figure 18A, the story-wise distribution of the VE material is first assumed to be uniform for all floors, and the drift angles are estimated by the expanded CQC method, as shown on the left-hand side of Figure 18B. The area of the VE material at each floor is adjusted by the ratio of the estimated drift angle to the target value using Eq. (12). For the modified VE material distribution, the drift angles are repeatedly estimated and compared to the target value with the modification repeated until the estimated drift angles are sufficiently close to the target value, as shown on the right-hand side of Figures 18A,B. The variations in T1 and h1 computed by the complex eigenvalue analyses during the iterative modification are also shown in Figure 18A.
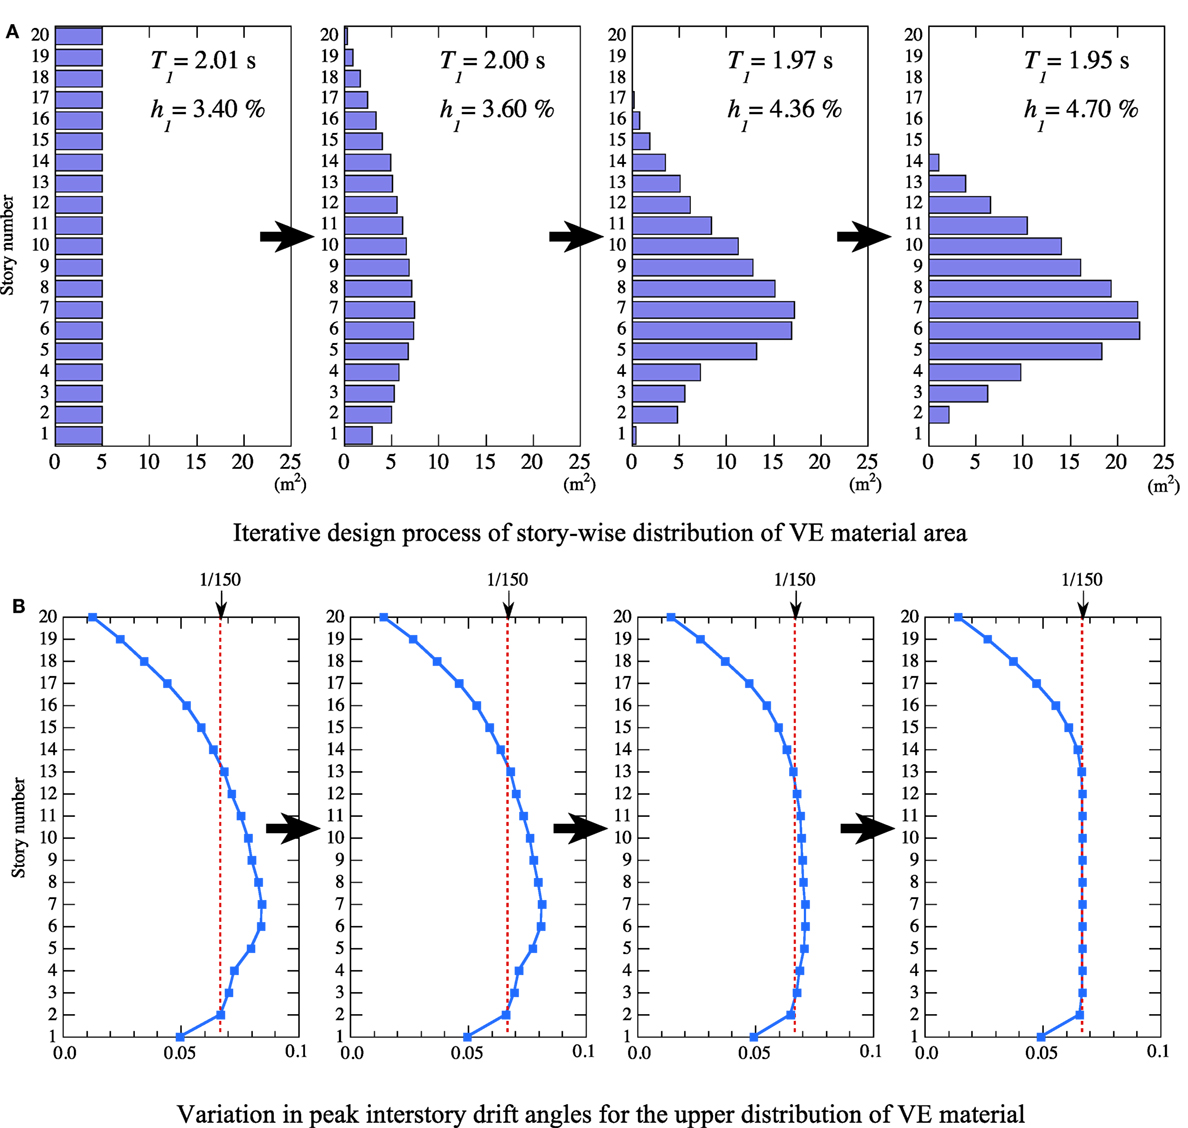
Figure 18. Extracted progress of story-wise distribution of VE material area and varying peak interstory drift angles in 20-story building. (A) Iterative design process of story-wise distribution of VE material area. (B) Variation in peak interstory drift angles for the upper distribution of VE material.
Figure 19 shows the obtained story-wise distribution of the area of the VE material and the necessary number of VED in the 20-, 30-, and 40-story buildings designed for a maximum story drift angle of 1/150. The necessary number of VEDs at each story was obtained by dividing the obtained area of the VE material by 1.6128 m2 (=the area of the VE material of the employed wall-type VED in Figure 16) and rounding off to a whole number.
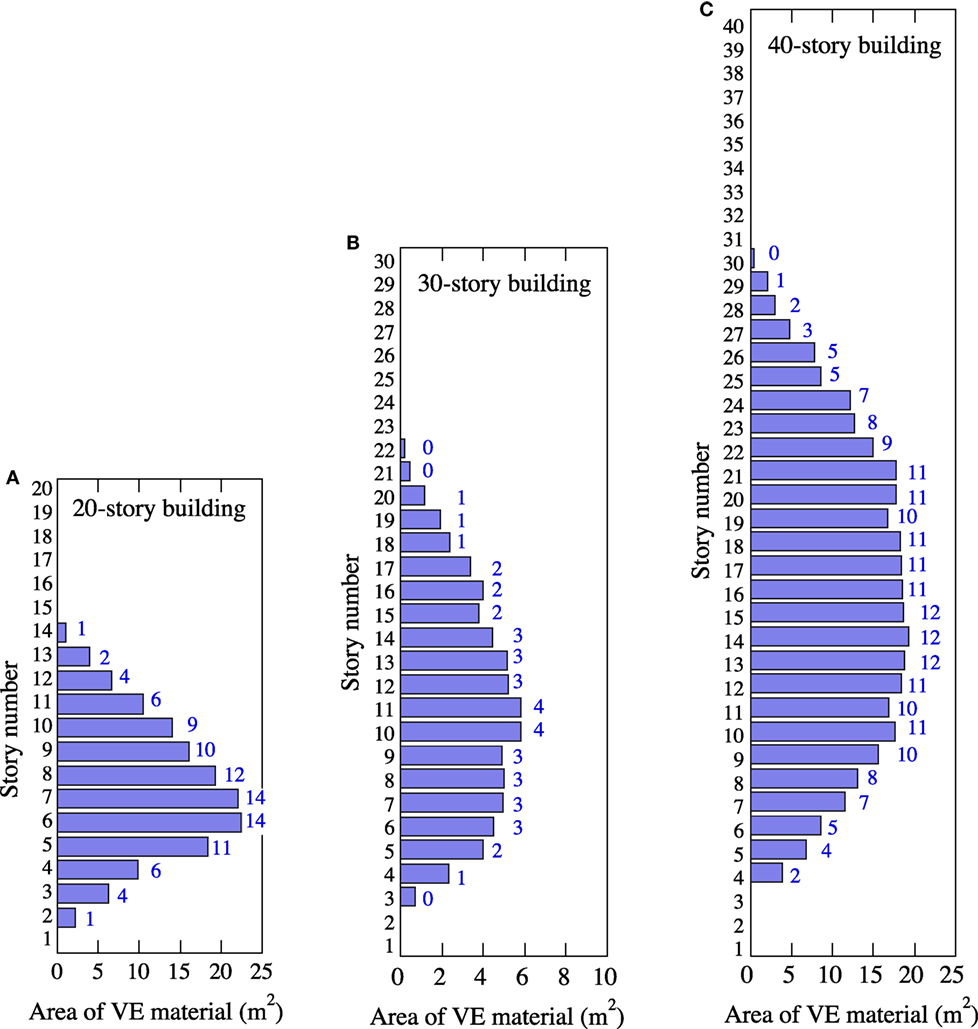
Figure 19. Story-wise distribution of VE material area and necessary number of VEDs in 20-, 30-, and 40-story buildings designed for maximum story drift angle of 1/150. (A) 20-story building, (B) 30-story building, and (C) 40-story building.
The proposed placement-design procedure can evaluate the extent of changes in T1 and h1 of the building installed with the necessary VEDs by the complex eigenvalue analyses. Table 3 shows T1 and h1 of the building with and without the VEDs. The required VEDs shorten the fundamental T1 slightly and increase h1 considerably due to their additional stiffness and damping coefficient. These changes in T1 and h1 can provide important information about the dynamic characteristics of the building.
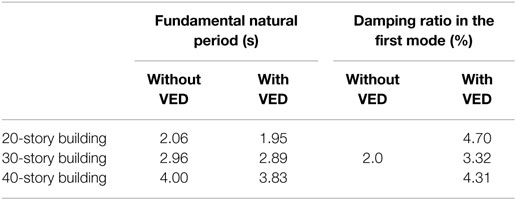
Table 3. Fundamental natural period and damping factor of buildings with and without VED.
Verification by Time–History Response Analyses
To demonstrate the validity of the proposed design procedure, the buildings installed with the necessary number of wall-type VEDs (as shown in Figure 19) were subjected to 10 synthetic earthquakes generated to be compatible with the design response spectrum (Figure 17). Figure 20 shows acceleration spectra of the 10 synthetic earthquakes with the target spectra. Time–history analyses were conducted using the original mechanical model of the VED, i.e., the NLF model given by Eqs 2a–e.

Figure 20. Acceleration response spectra of 10 synthetic earthquakes with the target spectrum.
Figure 21 shows the story-wise distribution of the mean peak interstory drift angles obtained by time–history analyses of the buildings with and without VEDs. With the exception of the lower and upper floors, where there is no need to install a VED, the mean peak interstory drift angles are found to be controlled to the specified value of 1/150 with enough accuracy.
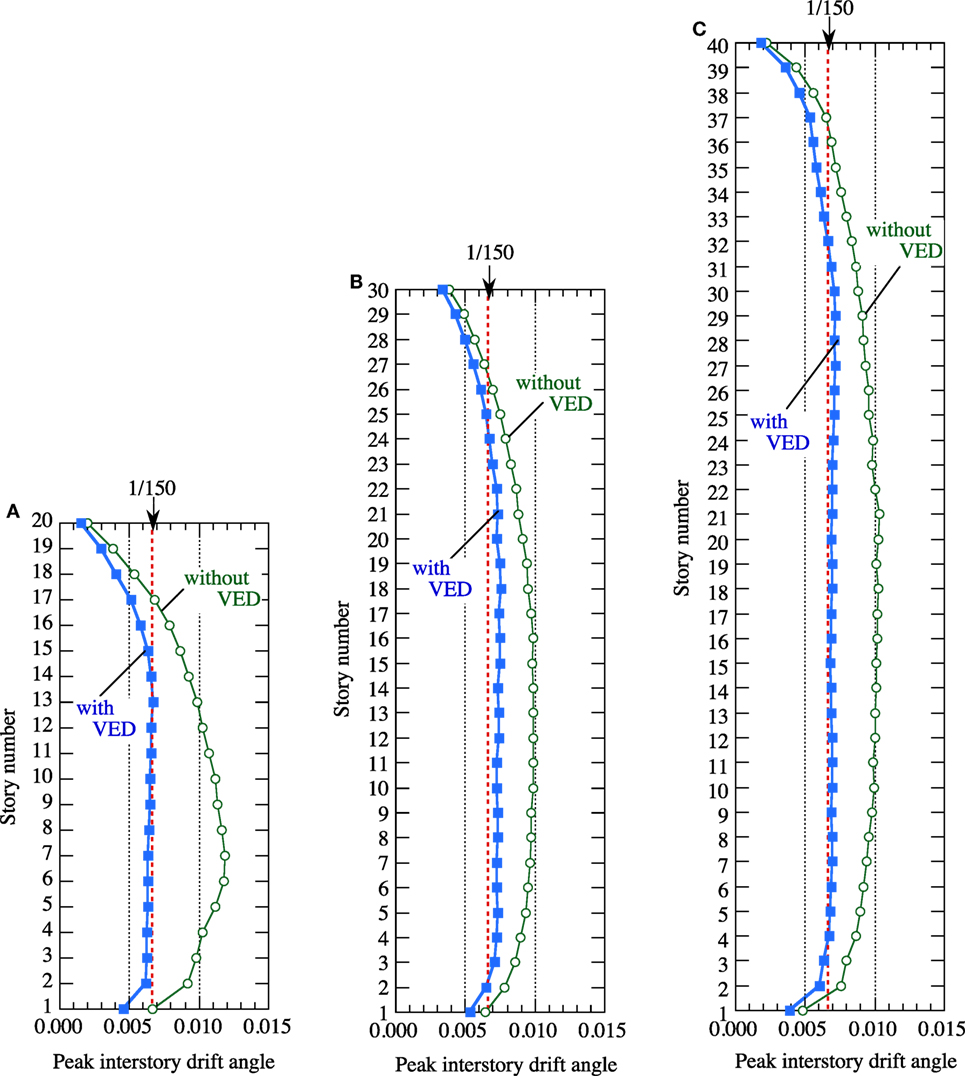
Figure 21. Story-wise distribution of mean peak interstory drift angles in buildings without VEDs and buildings with VEDs designed for maximum story drift angle of 1/150. (A) 20-story building, (B) 30-story building, and (C) 40-story building.
The mean peak interstory drift angles of the 30-story building in Figure 21B exceed the target value of 1/150 by about 10%. The errors in Figure 21 are considered to be caused by the following two disparities between the proposed design procedure and the applied time–history analyses: (1) the design procedure uses the converted Voigt model of the VED, while the time–history analyses use the original NLF model of the VED and (2) the design procedure uses the modal analysis with the specified design response spectrum, while the time–history analyses use the generated synthetic earthquake waves. Considering the uncertainty and dispersion of the earthquake input, this amount of error can be regarded as acceptable, and the target peak responses of a structure can be specified for an appropriate safety margin.
Conclusion
Using the expanded CQC method for non-classically damped structures, a performance-based placement-design procedure is developed for finding the story-wise distribution of the manufactured wall-type VED such that each peak interstory drift would be limited to the specified value for a given design response spectrum.
The wall-type VED is installed between the floors in a building and induces a viscous shear force in response to the relative interstory drift, causing energy dissipation. The wall-type VED studied in this paper utilizes a newly developed VE material with low temperature dependence. The wall-type VED shown in Figure 16 costs about 4,500 USD (1 USD = 110 JPY), and has been applied to a few tall buildings in Japan as a practical damper. A mechanical model for the VED can be expressed by an NLF model that comprises two non-linear dashpot elements and two non-linear spring elements. The NLF model can express amplitude- and frequency-dependent properties of the VED. The validity of the proposed NLF model of the VED is verified through the dynamic loading tests of a half-scale wall-type VED.
The expanded CQC method is utilized to estimate the peak interstory drifts of a building with installed VEDs subjected to a specified given design response spectrum. In the modal analysis, the NLF model of the VED installed at each story is converted into an equivalent linear Voigt model, which is determined by the prescribed peak interstory drift and the fundamental natural period of the structure.
An algorithm for the placement design of the VED is proposed such that the peak interstory drifts would be limited to a specified value. In the proposed sequential design process, the area of the VE material in each story is adjusted by the ratio of the estimated peak interstory drift angle to the target value. The necessary number of VEDs at each story is obtained by dividing the obtained area of the VE material by the area of the VE material of the employed single wall-type VED and rounding off the result to a whole number.
Design examples of the performance-based placements of the wall-type VEDs are shown for three high-rise building models. Time–history response analyses are carried out for buildings installed with the necessary number of VEDs subjected to the design response spectrum-compatible synthetic earthquakes. The results demonstrate the effectiveness and validity of the proposed performance-based placement-design procedure.
The developed design procedure utilizes the equivalent linearization of the VED and the expanded CQC method. Therefore, the procedure can be applied not only to the VED but also to other dampers, such as metallic hysteretic dampers and viscous fluid dampers, which can be converted into a linear Voigt model framework. Another advantage of the procedure is that the variations in the fundamental natural period and the damping ratio of the structure due to the installed dampers can be evaluated by complex eigenvalue analysis, which provides important information on the dynamic characteristics of the structure.
Author Contributions
YN: development of performance-based placement procedure of viscoelastic dampers and computations of design examples. TH: development of the mechanical model of the viscoelastic damper, dynamic loading tests of wall-type viscoelastic dampers, and time–history response analyses of design examples. TN: development of a viscoelastic material with low temperature dependence and dynamic loading tests of the viscoelastic material. TT: development of a viscoelastic material with low temperature dependence, dynamic loading tests of the viscoelastic material, and development of the mechanical model of the viscoelastic damper.
Conflict of Interest Statement
The authors declare that the research was conducted in the absence of any commercial or financial relationships that could be construed as a potential conflict of interest.
References
Chang, K. C., Soong, T. T., Oh, S.-T., and Lai, M. L. (1992). Effect of ambient temperature on viscoelastically damped structure. J. Struct. Eng. 118, 1955–1973. doi: 10.1061/(ASCE)0733-9445(1992)118:7(1955)
Cheng, F. Y., Jiang, H., and Lou, K. (2008). “Damping Systems” in Smart Structures. Boca Raton, FL: CRC Press, 109–158.
Cimellaro, G. P. (2007). Simultaneous stiffness-damping optimization of structures with respect to acceleration, displacement and base shear. Eng. Struct. 29, 2853–2870. doi:10.1016/j.engstruct.2007.01.001
Foss, K. A. (1958). Coordinates which uncouples the equations of motion of damped linear dynamic systems. J. Appl. Mech. 25, 361–364.
Garcia, D. L. (2001). A simple method for the design of optimal damper configurations in MDOF structures. Earthq. Spectra 17, 387–398. doi:10.1193/1.1586180
Gluck, N., Reinhorn, A. M., Gluck, J., and Levy, R. (1996). Design of supplemental dampers for control of structures. J. Struct. Eng. 122, 1394–1399. doi:10.1061/(ASCE)0733-9445(1996)122:12(1394)
Igusa, T., Der Kiureghian, A., and Sackman, J. L. (1984). Modal decomposition method for stationary response of non-classically damped systems. Earthq. Eng. Struct. Dyn. 12, 121–136. doi:10.1002/eqe.4290120109
Lavan, O., and Levy, R. (2005). Optimal design of supplemental viscous dampers for irregular shear-frames in the presence of yielding. Earthq. Eng. Struct. Dyn. 34, 889–907. doi:10.1002/eqe.458
Lavan, O., and Levy, R. (2006). Optimal design of supplemental viscous dampers for linear framed structures. Earthq. Eng. Struct. Dyn. 35, 337–356. doi:10.1002/eqe.524
Liu, W., Tong, M., Wu, Y., and Lee, G. C. (2004). Optimized damping device configuration design of a steel frame structure based on building performance indices. Earthq. Spectra 20, 67–89. doi:10.1193/1.1648334
Liu, W., Tong, M., Wu, Y., and Lee, G. C. (2005). Optimization methodology for damper configuration based on building performance indices. J. Struct. Eng. 131, 1746–1756. doi:10.1061/(ASCE)0733-9445(2005)131:11(1746)
Mahmoodi, P., Robertson, L. E., Yontar, M., Moy, C., and Feld, I. (1987). “Performance of viscoelastic dampers in World Trade Center Towers,” in Dynamic of Structures, Structures Congress ‘87 (Orlando, FL).
Nakamura, Y., and Hanzawa, T. (2002). “Performance-based placement design of vibration control dampers,” in Structural Engineers World Congress SEWC2002. T2-4-a-1 (Yokohama).
Nakamura, Y., and Kaneko, M. (1998). Mechanical modeling of viscoelastic damper with amplitude- and frequency-dependent properties. Proc. Second World Conf. Struct. Control 1, 181–190.
Park, J.-H., Kim, J., and Min, K.-W. (2004). Optimal design of added viscoelastic dampers and supporting braces. Earthq. Eng. Struct. Dyn. 33, 465–484. doi:10.1002/eqe.359
Ribakov, Y., and Gluck, J. (1999). Optimal design of ADAS damped MDOF structures. Earthq. Spectra 15, 317–330. doi:10.1193/1.1586043
Silvestri, S., and Trombetti, T. (2007). Physical and numerical approaches for the optimal insertion of seismic viscous dampers in shear-type structures. J. Earthq. Eng. 11, 787–828. doi:10.1080/13632460601034155
Singh, M. P., and Moreschi, L. M. (2001). Optimal seismic response control with dampers. Earthq. Eng. Struct. Dyn. 30, 553–572. doi:10.1002/eqe.23
Singh, M. P., and Moreschi, L. M. (2002). Optimal placement of dampers for passive response control. Earthq. Eng. Struct. Dyn. 31, 955–976. doi:10.1002/eqe.132.abs
Soong, T. T., and Dargush, G. F. (1997). “Viscoelastic Dampers” in Passive Energy Dissipation Systems in Structural Engineering. Chichester: John Wiley & Sons, 127–170.
Takewaki, I. (1997). Optimal damper placement for minimum transfer functions. Earthq. Eng. Struct. Dyn. 26, 1113–1124. doi:10.1002/(SICI)1096-9845(199711)26:11<1113::AID-EQE696>3.0.CO;2-X
Takewaki, I. (2000). Optimal damper placement for critical excitation. Probab. Eng. Mech. 15, 317–325. doi:10.1016/S0266-8920(99)00033-8
Takewaki, I. (2009). Building Control with Passive Dampers. Singapore: John Wiley & Sons (Asia) Pte Ltd.
Takewaki, I., Moustafa, A., and Fujjita, K. (2013). “Optimal placement of visco-elastic dampers and supporting members under variable critical excitations,” in Improving the Earthquake Resilience of Buildings, ed. H. Pham (London: Springer), 249–275.
Takewaki, I., Yoshitomi, S., Uetani, K., and Tsuji, M. (1999). Non-monotonic optimal damper placement via steepest direction search. Earthq. Eng. Struct. Dyn. 28, 655–670. doi:10.1002/(SICI)1096-9845(199906)28:6<655::AID-EQE833>3.0.CO;2-T
Tan, P., Dyke, S. J., Richardson, A., and Abdullah, M. (2005). Integrated device placement and control design in civil structures using genetic algorithms. J. Struct. Eng. 131, 1489–1496. doi:10.1061/(ASCE)0733-9445(2005)131:10(1489)
Tsuji, M., and Nakamura, T. (1996). Optimum viscous dampers for stiffness design of shear buildings. Struct. Design Tall Build. 5, 217–234. doi:10.1002/(SICI)1099-1794(199609)5:3<217::AID-TAL70>3.0.CO;2-R
Uetani, K., Tsuji, M., and Takewaki, I. (2003). Application of an optimum design method to practical building frames with viscous dampers and hysteretic dampers. Eng. Struct. 25, 579–592. doi:10.1016/S0141-0296(02)00168-2
Xu, Z.-D., Shen, Y.-P., and Zhao, H.-T. (2003). A synthetic optimization analysis method on structures with viscoelastic dampers. Soil Dyn. Earthq. Eng. 23, 683–689. doi:10.1016/j.soildyn.2003.07.003
Yang, J. N., Sarkani, S., and Long, F. X. (1990). A response spectrum approach for seismic analysis of nonclassically damped structure. Eng. Struct. 12, 173–184. doi:10.1016/0141-0296(90)90004-C
Zhang, R.-H., and Soong, T. T. (1992). Seismic design of viscoelastic dampers for structural applications. J. Struct. Eng. 118, 1375–1392. doi:10.1061/(ASCE)0733-9445(1992)118:5(1375)
Appendix
A. Earthquake Interstory Drifts of Hypothetical 15- and 24-Story Buildings
The dynamic loading tests of the VE material and the VED make use of simulated earthquake interstory drifts of hypothetical 15- and 24-story buildings subjected to Hachinohe 1968 EW earthquake or El Centro 1940 NS earthquake. The fundamental natural periods of the 15- and 24-story buildings are assumed to be 2 and 3 s, respectively. Figure A1 shows the waveforms of the earthquake interstory drifts in Figures 4B, 11, and 12.
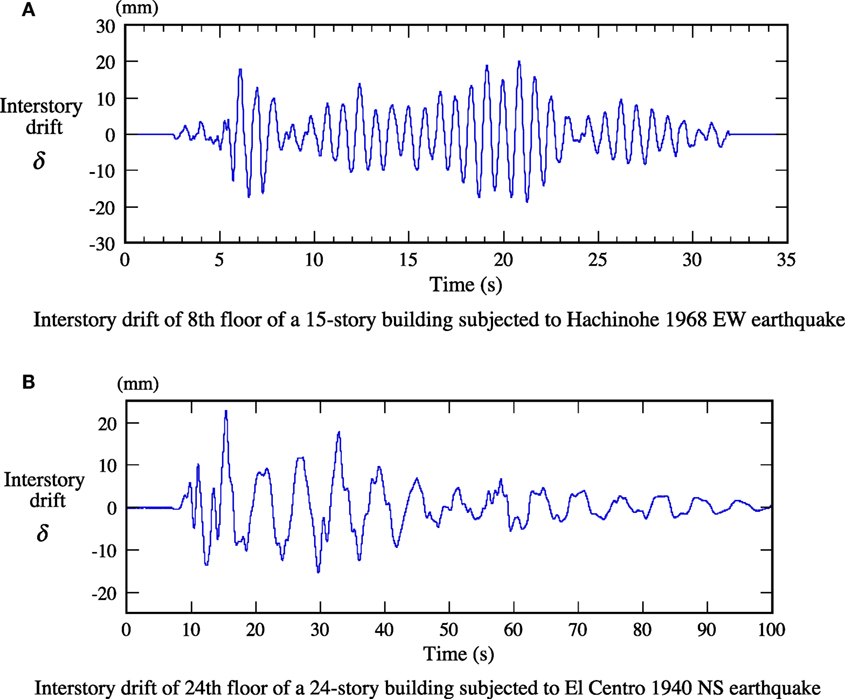
Figure A1. Earthquake interstory drifts of hypothetical 15- and 24-story buildings. (A) Interstory drift of 8th floor of a 15-story building subjected to Hachinohe 1968 EW earthquake (Figures 4B and 11). (B) Interstory drift of 24th floor of a 24-story building subjected to El Centro 1940 NS earthquake (Figure 12).
B. Voigt Model of VED Considering the Stiffness of the Mounting Component
For consideration of the mounting component’s stiffness, KM the equivalent Voigt model including the mounting component can be constructed. As shown in Figure A2, the sum of the maximum shear deformation of the VED, δD = γmax × d, and the maximum deformation of the mounting component, δM, is equal to the specified peak interstory drift, .
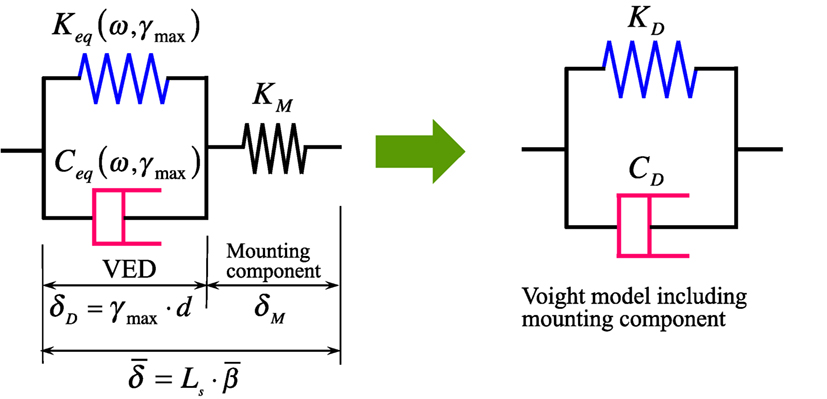
Figure A2. Equivalent linearization of VED considering the mounting component’s stiffness.
The following equation holds for γmax, , KM, and Keq (ω, γmax) and Ceq (ω, γmax) of the VED given by Eq. (3) for a specified set {As, d, Te}:
While Eq. (A1) cannot be analytically solved in terms of γmax, the value of γmax can be estimated through iterative computations by substituting as an initial value of γmax on the right-hand side of Eq. (A1). Once a converged value of γmax is obtained, KD and CD of the equivalent Voigt model considering KM are obtained according to
where the fundamental natural circular frequency of a building, ω = 2π/T1, is assigned to ω in Eqs A2 and A3 in the same way as in Section “Equivalent Linearization of VED.”
Keywords: viscoelastic damper, mechanical model, response control, performance design, equivalent linearization, modal analysis, CQC method
Citation: Nakamura Y, Hanzawa T, Nomura T and Takada T (2016) Performance-Based Placement of Manufactured Viscoelastic Dampers for Design Response Spectrum. Front. Built Environ. 2:10. doi: 10.3389/fbuil.2016.00010
Received: 22 February 2016; Accepted: 13 May 2016;
Published: 27 May 2016
Edited by:
Nikos D. Lagaros, National Technical University of Athens, GreeceReviewed by:
Vagelis Plevris, Oslo and Akershus University College of Applied Sciences, NorwayShinta Yoshitomi, Ritsumeikan University, Japan
Aristotelis Charalampakis, Gediz University, Turkey
Copyright: © 2016 Nakamura, Hanzawa, Nomura and Takada. This is an open-access article distributed under the terms of the Creative Commons Attribution License (CC BY). The use, distribution or reproduction in other forums is permitted, provided the original author(s) or licensor are credited and that the original publication in this journal is cited, in accordance with accepted academic practice. No use, distribution or reproduction is permitted which does not comply with these terms.
*Correspondence: Yutaka Nakamura, yutaka.nakamura@shimz.co.jp