A Simple Evaluation Method of Seismic Resistance of Residential House under Two Consecutive Severe Ground Motions with Intensity 7
 Kotaro Kojima
 Izuru Takewaki
- Department of Architecture and Architectural Engineering, Graduate School of Engineering, Kyoto University, Kyoto, Japan
In the 2016 Kumamoto earthquake in Japan, two severe ground shakings with the seismic intensity 7 (the highest level in Japan Meteorological Agency scale; approximately X–XII in Mercalli scale) occurred consecutively on April 14 and 16. In the seismic regulations of most countries, it is usually prescribed that such severe earthquake ground motion occurs once in the working period of buildings. In this paper, a simple evaluation method is presented on the seismic resistance of residential houses under two consecutive severe ground motions with intensity 7. Therefore, the proposed method can be used for the design of buildings under two consecutive severe ground motions. The present paper adopts an impulse as a representative of near-fault ground motion and two separated impulses are used as the repetition of intensive ground shakings with the seismic intensity 7. Two scenarios to building collapse (collapse limit in terms of zero restoring force with P-delta effect and collapse limit in terms of maximum deformation) under two repeated severe ground shakings are provided and energy consideration is devised for the response evaluation. The validity and accuracy of the proposed theories are discussed through numerical analysis using recorded ground motions.
Introduction
The general well-accepted theory of main-shock, after-shock occurrence was severely distorted in the 2016 Kumamoto earthquake in Japan and two intensive ground shakings with the seismic intensity 7 [the highest level in Japan Meteorological Agency (JMA) scale; approximately X–XII in Mercalli scale] occurred consecutively on April 14 and 16. In most seismic regulations in earthquake-prone countries, it is usually prescribed that such intensive earthquake ground motion occurs once in the working period of buildings and the after-shock is relatively small compared to the main-shock. In this circumstance, some changes of design philosophy may be necessary. In this paper, the degree of necessary upgrade is investigated on the seismic resistance of residential houses under two consecutive severe ground motions with intensity 7.
Several attempts have been conducted on the damage analysis of structures under repeated ground motions (Mahin, 1980; Amadio et al., 2003; Fragiacomo et al., 2004; Li and Ellingwood, 2007; Hatzigeorgiou and Beskos, 2009; Hatzigeorgiou, 2010; Moustafa and Takewaki, 2011, 2012; Motosaka, 2012; Ruiz-Garcia, 2012; Hatzivassiliou and Hatzigeorgiou, 2015). The formulations of residual deformation and member deterioration after one ground motion may be key issues. It seems that most previous papers deal with the response characteristics of structures under repeated ground motions and do not mention directly the necessary strength upgrade due to input repeat. In other words, while the previous researches are aimed at the analysis of damage for the main-shock–after-shock sequence, the purpose of the present paper is to propose a design method for preventing from collapse under two consecutive intensive ground shakings.
The present paper adopts an impulse of the velocity V as a representative of near-fault ground motion and two separated impulses are used as the repetition of intensive ground shakings with the seismic intensity 7 (see Figure 1). The modeling of earthquake ground motion into an impulse corresponds to the evaluation of the input energy under a monotonic loading that is a well-known and well-accepted concept in understanding the earthquake input energy demand (see Figure 2). It is not intended to extract a pulse from a record because the pulse represents an impulsive input symbolically in this case. A residential house is modeled by three models. The first one is an undamped single-degree-of-freedom (SDOF) model of normal bilinear hysteresis with negative second slope (steel structures), the second one is an SDOF model of slip-type restoring-force characteristic, including a bilinear hysteresis (wooden structures), and the third one is an SDOF model of degrading hysteresis (reinforced-concrete structures). Two scenarios to building collapse (collapse limit in terms of zero restoring force with P-delta effect and collapse limit in terms of maximum deformation) under two repeated severe ground shakings are provided and energy consideration is devised for the response evaluation. The validity and accuracy of the proposed theories are discussed through numerical analysis using recorded ground motions.
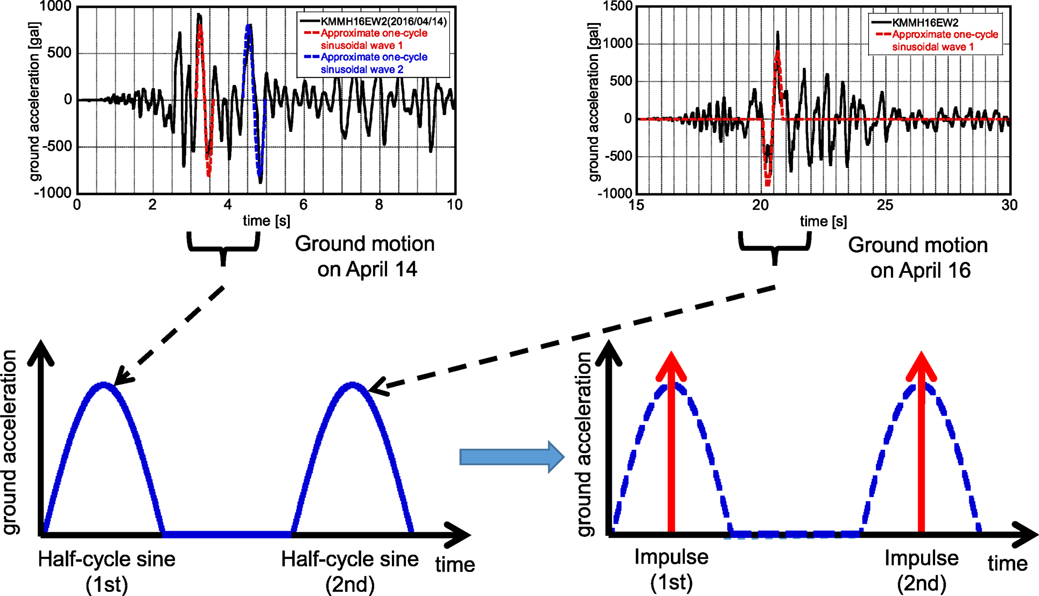
Figure 1. Modeling of repeated intensive ground motions into two impulses.
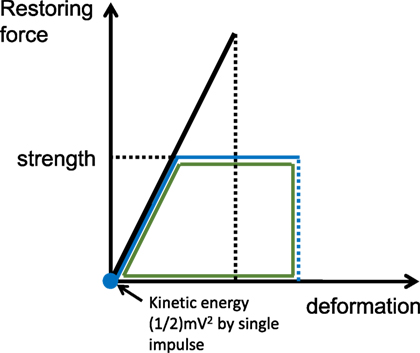
Figure 2. Simple energy evaluation of elastic–plastic structure under impulsive loading.
SDOF Model of Normal Bilinear Hysteresis with Negative Second Slope (Steel Structures)
Consider first an undamped SDOF model of normal bilinear hysteresis with negative second slope (steel structures) as shown in Figure 3A (Kojima and Takewaki, 2016). The negative slope of the first model can be understood as a modeling result of P-delta effect and structural degradation. The validity of using this model can be found in Appendix from the viewpoint of P-delta effect. It is assumed that, after the input of the first impulse, the SDOF model goes into the plastic range and starts unloading after the maximum deformation (see Figure 3B). It is also assumed that the SDOF model converges to a zero restoring-force state in the unloading path due to some damping effects (joint friction, radiation damping, etc.). Then the second impulse is given to the SDOF model with a residual deformation and the SDOF model goes into the plastic range again. Once the restoring force becomes 0, the SDOF model collapses.
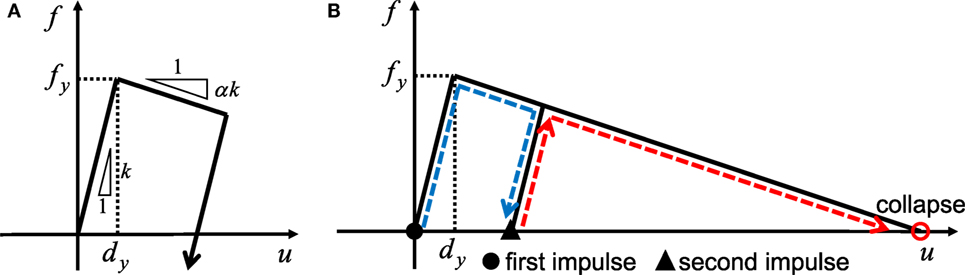
Figure 3. Restoring-force characteristic and collapse scenario: (A) Normal bilinear hysteresis with negative second slope. (B) Collapse scenario under two impulses.
Let m, k denote the mass and initial stiffness of the SDOF model and let u, f denote the deformation (displacement of mass) and the restoring force, respectively. The natural circular frequency, the ratio of the second slope to the initial slope, the yield deformation and the yield strength are denoted by , , dy and fy, respectively. Let Vy = ω1dy denote the velocity level of the input impulse at which the SDOF model just attains the yield deformation after the first impulse as in the reference (Kojima and Takewaki, 2015, 2016).
The degree of necessary upgrade on the seismic resistance of residential houses under two consecutive severe ground motions with intensity 7 is computed by comparing two models in which a building is designed to just collapse under one impulse and the other is designed to just collapse under two consecutive impulses. In order to make this comparison, two structures resisting one or two impulses are designed in the following.
Limit Input Velocity for One Impulse
Since a long time ago, a half-cycle sine wave is used as a simple representative of impulsive ground motions, e.g., see Housner (1963). In this paper, a near-fault impulsive ground motion is simplified into a half-cycle sine wave and then into a single impulse (see Figure 1). The introduction of impulses enables a simple energy evaluation of elastic–plastic structures (see Figure 2).
Following a procedure similar to that in the reference (Kojima and Takewaki, 2016), the limit input velocity for one impulse can be derived as follows by equating the kinetic energy (1/2)mV2 provided by one impulse with the dissipated energy (triangle in Figure 4).
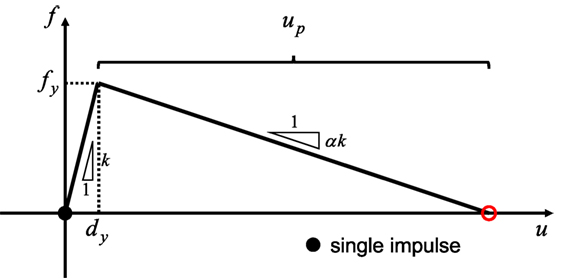
Figure 4. Collapse scenario under single impulse.
In Eq. (1), up = − (1/α)dy is used (see Figure 4). Therefore, the ratio of limit input velocity to the reference velocity Vy (input velocity just attaining the yield of the model after one impulse) may be expressed by
Then the reference velocity (strength indicator of the model) may be derived for a specified input velocity level V.
The corresponding model strength can then be obtained as
where k[1] is the stiffness of this model.
Limit Input Velocity for Two Consecutive Impulses
The limit input velocity for two consecutive impulses can be derived from the following procedure. The maximum deformation and the residual deformation after the first impulse can be computed by equating the kinetic energy (1/2)mV2 provided by the first impulse with the dissipated and strain energy (quadrangle in Figure 5). Then the limit input velocity for the two consecutive impulses inducing collapse after the second impulse can be derived by equating the kinetic energy (1/2)mV2 provided by the second impulse with the dissipated energy (triangle in Figure 6).
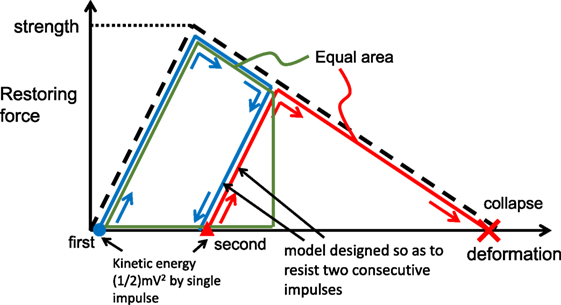
Figure 5. Collapse scenario under two impulses and energy consideration for evaluating limit input velocity.
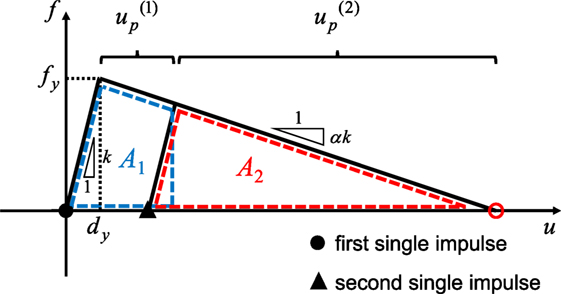
Figure 6. Restoring-force characteristic of model under two impulses.
Let and denote the plastic deformation after the first impulse and the second impulse, respectively. Since the plastic deformation of the model just attaining the collapse after the second impulse can be described by −(1/α)dy, the following relation holds (see Figure 6).
First of all, find from A1 = A2 (see Figure 6) which is guaranteed by the same input energy (1/2)mV2 by the first and second impulses. The condition A1 = A2 in terms of can be expressed by
Rearrangement of Eq. (6) leads to
From Eq. (7), can be obtained as
Since , the following expression is derived.
By using the energy balance, the input velocity level V of the single impulse can be related to A1 (or A2) and . The energy balance after the first impulse can then be expressed as
Therefore, the limit input velocity corresponding to the collapse after two impulses may be derived as
By substituting Eq. (9) into Eq. (11), the ratio V/Vy is obtained as
The reference velocity (strength of the model) may then be derived for a specified input velocity level V.
The corresponding model strength can be obtained as
where is the stiffness of this model.
In summary, the ratio of the reference velocity for collapse after two impulses to that for collapse after one impulse can be computed as
Finally, the ratio of the model strength for collapse after two impulses to that for collapse after one impulse can be expressed as
Figure 7 shows the plot of with respect to α. Furthermore, Figure 8 presents the plot of with respect to α. In Figure 8, numerical results using recorded ground motions (Kumamoto earthquake in 2016) are also plotted. It should be noted that, since the purpose of this section is to investigate the ratio , the same earthquake ground motion recorded on April 16, 2016 has been input twice.
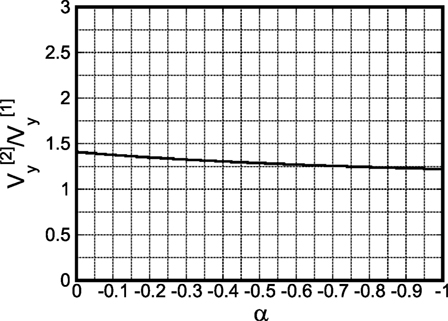
Figure 7. for α.
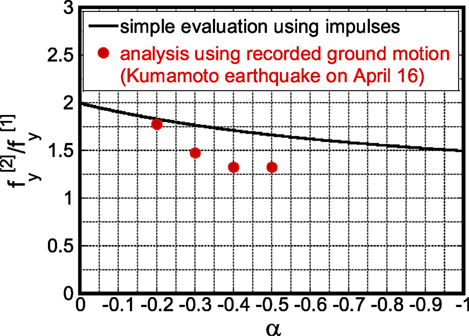
Figure 8. for α (including analysis for recorded ground motion).
Figure 9 shows the restoring-force characteristics of the models with different second slopes, under the earthquake ground motion of April 16, 2016, designed so that they just collapse after one single impulse. T1 in Figure 9 is the natural period of the model. In the top left one, the plastic deformation proceeds toward the reverse direction different from the other three cases. On the other hand, Figure 10 illustrates the restoring-force characteristics of the models with different second slopes, under the twice repeated earthquake ground motion of April 16, 2016, designed so that they just collapse after two impulses.
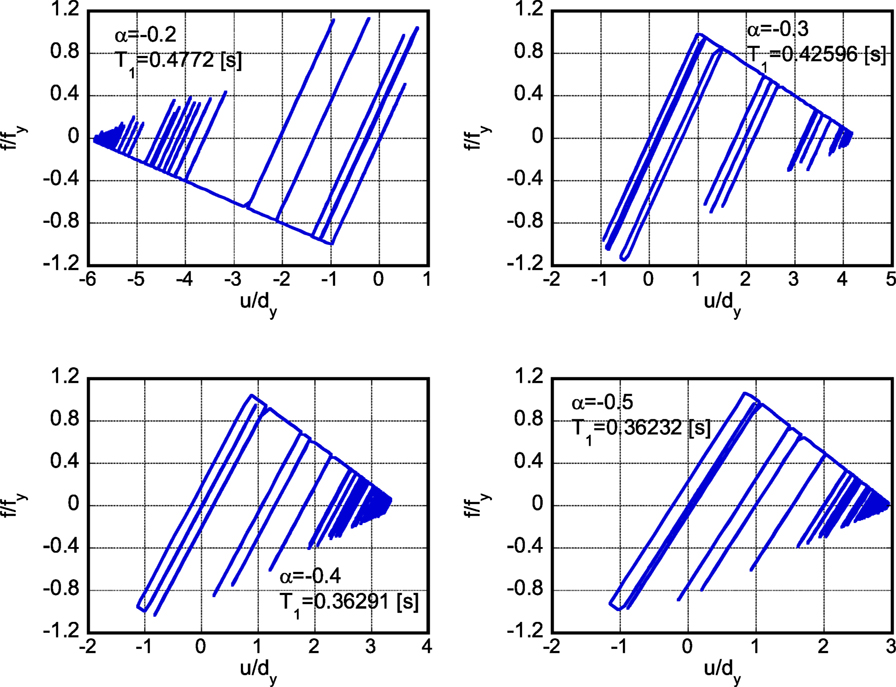
Figure 9. Restoring-force characteristics of models with different second slopes under 2016 Kumamoto earthquake ground motion (April 16) designed so that they just collapse after one single impulse.
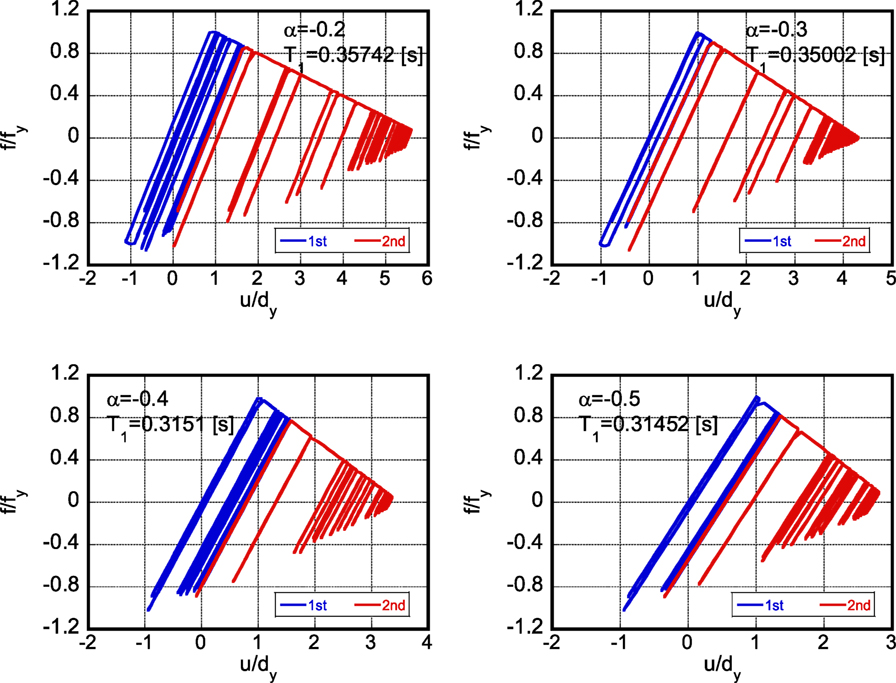
Figure 10. Restoring-force characteristics of models with different second slopes under repeated 2016 Kumamoto earthquake ground motion (April 16) designed so that they just collapse after two impulses.
Case of Collapse Limit on Maximum Deformation
Consider second a SDOF model of elastic-perfectly plastic slip-type hysteresis. This model corresponds to wooden structures and reinforced-concrete structures in some sense (in the sense that both kinds of structures include slip-type properties). In other words, the formulation in this section is made for an ideal model as shown in Figure 11 and the results may be applied approximately to wooden structures and reinforced-concrete structures.
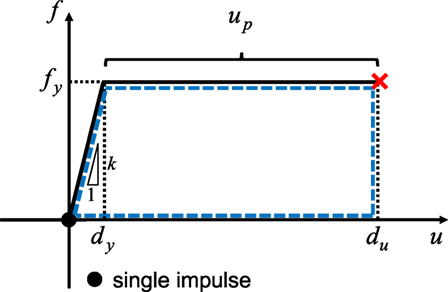
Figure 11. Scenario to building collapse just after single impulse (collapse limit is given by maximum deformation).
Limit Input Velocity for One Impulse
The energy balance law for the single impulse can be expressed by (see Figure 11)
where du indicates the ultimate deformation. Eq. (17) can be reduced to
For a specified input velocity level V, the reference velocity (strength indicator of the model) may be derived as
Then the corresponding strength of the model exhibiting collapse just after a single impulse can be obtained as
where k[1] is the stiffness of this model.
Limit Input Velocity for Two Consecutive Impulses
Let and denote the plastic deformation after the first impulse and the second impulse, respectively. Since the plastic deformation of the model just attaining the collapse after the second impulse can be described by du − dy, the following relation holds (see Figure 12).
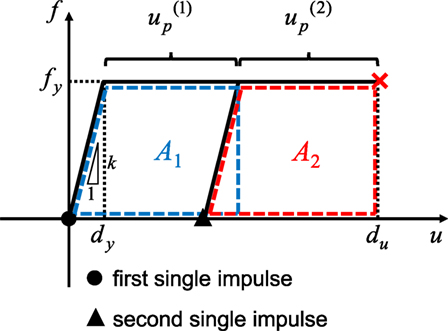
Figure 12. Scenario to building collapse just after two impulses (collapse limit is given by maximum deformation).
First of all, find from A1 = A2 which is guaranteed by the same input energy (1/2)mV2 by the first and second impulses. The condition A1 = A2 in terms of can be expressed by
From Eq. (22), can be obtained as
By using the energy balance, the input velocity level V of the single impulse can be related to A1 (or A2) and . The energy balance after the first impulse can then be expressed as
Eq. (24) can be reduced to
Then the reference velocity (strength indicator of the model) may be derived for a specified input velocity level V.
The corresponding model strength can be obtained as
Therefore, the ratio of the reference velocity for collapse after two impulses to that for collapse after one impulse can be computed as
Finally, the ratio of the model strength for collapse after two impulses to that for collapse after one impulse can be expressed as
in Eq. (28) and in Eq. (29) are plotted in Figures 13 and 14, respectively. It can be found from Figure 14 that the strength ratio exhibits the value between 1.5 and 1.8 for the ductility μ = du/dy between 2 and 5.
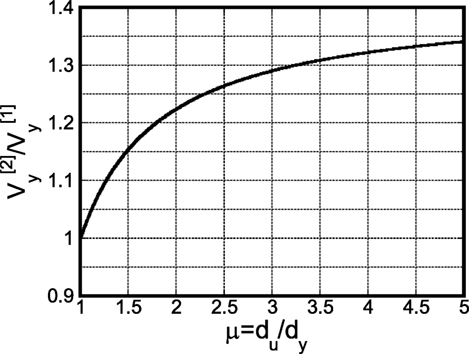
Figure 13. for μ = du/dy.
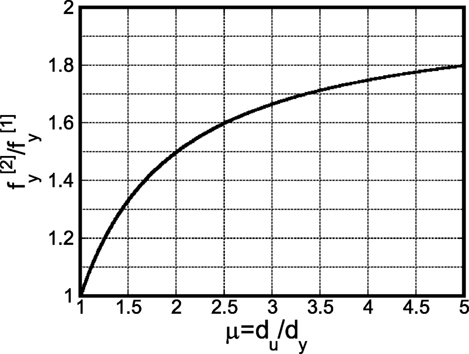
Figure 14. for μ = du/dy.
Application to Wooden Structures and Reinforced-Concrete Structures with Slip-Type Hysteresis
The formulation presented in Section “Limit Input Velocity for Two Consecutive Impulses” is applied to wooden structures and reinforced-concrete structures with slip-type hysteresis. As explained in the beginning of Section “Case of Collapse Limit on Maximum Deformation,” the formulation in section “Limit Input Velocity for Two Consecutive Impulses” was made for an ideal model as shown in Figure 11 and the results may be applied approximately to wooden structures and reinforced-concrete structures.
Consider wooden structures here. Figure 15 shows the restoring-force characteristics of the models with different strength ratios under repeated 2016 Kumamoto earthquake ground motion (April 16) designed so that they just collapse after one impulse or two impulses [reference model: collapse just after two impulses/slip and bilinear model (wooden structures)]. This model is a combination of an elastic-perfectly plastic model and a slip model. The resistance ratios with which the respective models (elastic-perfectly plastic model and slip model) govern are 0.2 and 0.8. The mass is 60 × 103 (kilogram), the yield deformation is dy = 0.1 (m) and the structural damping ratio is 0.02. It can be observed that the strength ratio 1.5 is reasonable for wooden structures. In other words, the maximum deformation of the wooden structure, designed for two impulses, under two consecutive severe earthquake ground motions is almost equivalent to that of the wooden structure, designed for one impulse, under one severe earthquake ground motion and their strength ratio is about 1.5.
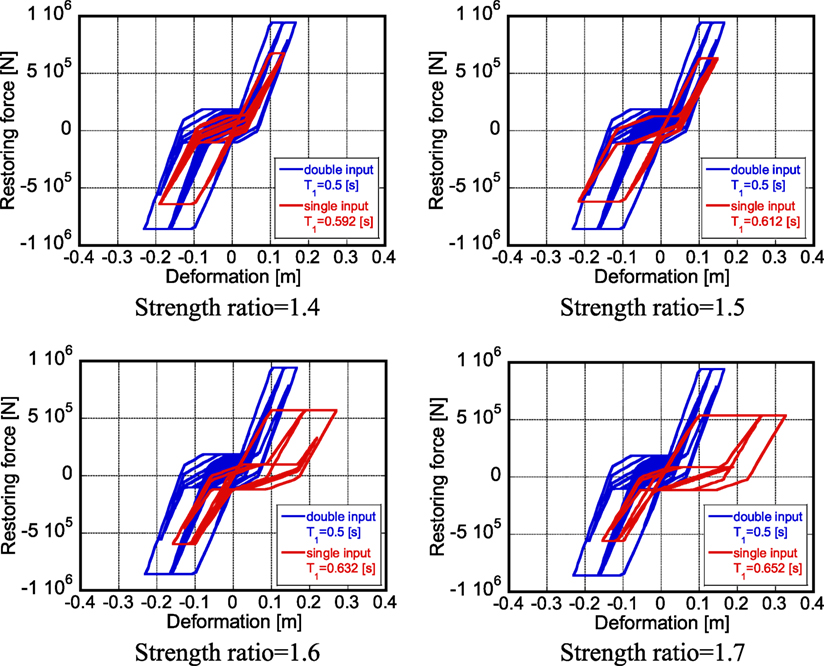
Figure 15. Restoring-force characteristics of models with different strength ratios under repeated 2016 Kumamoto earthquake ground motion (April 16) designed so that they just collapse after one impulse or two impulses [reference model: collapse just after two impulses/slip and bilinear model (wooden structures)].
Consider next reinforced-concrete structures. Since reinforced-concrete structures have complex hysteresis rules, a new scenario different from Figures 11 and 12 may be necessary. However, a simple numerical investigation is conducted here in order to obtain the property on strength ratio between the structure designed for two impulses and that for one impulse.
Figure 16 shows the restoring-force characteristics of the models with different strength ratios under repeated 2016 Kumamoto earthquake ground motion (April 16) designed so that they just collapse after one impulse or two impulses [reference model: collapse just after two impulses/Takeda model (Takeda et al., 1970) (reinforced-concrete structures)]. The mass is 60 × 103 kg, the crack deformation is dc = 0.003 m, the yield deformation is dy = 0.03 m, and the structural damping ratio is 0.02. It can be observed that the strength ratio 1.3–1.4 is reasonable for reinforced-concrete structures. In other words, the maximum deformation of the reinforced-concrete structure, designed for two impulses, under two consecutive severe earthquake ground motions is almost equivalent to that of the reinforced-concrete structure, designed for one impulse, under one severe earthquake ground motion and their strength ratio is about 1.3–1.4.
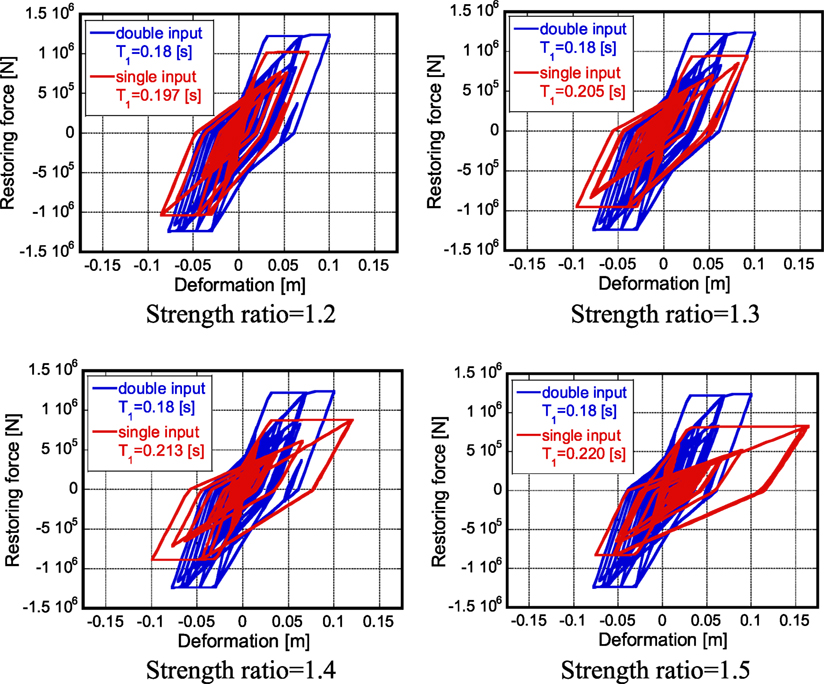
Figure 16. Restoring-force characteristics of models with different strength ratios under repeated 2016 Kumamoto earthquake ground motion (April 16) designed so that they just collapse after one impulse or two impulses [reference model: collapse just after two impulses/Takeda model (reinforced-concrete structures)].
It may be useful to remind that the present paper introduced two scenarios on the collapse. For steel buildings considering the P-delta effect or strength-degradation effect, the zero restoring force represents the collapse limit. This was demonstrated in Figures 8–10. On the other hand, for wooden and reinforced-concrete structures, the maximum deformation defines the collapse limit. Regarding this collapse scenario, a simple slip-type hysteretic model as shown in Figure 12 has been introduced. Although a theoretical result has been obtained in Figure 14, wooden and reinforced-concrete structures have more complicated hysteretic models. Therefore, the comparison as shown in Figure 8 for steel buildings is difficult in wooden and reinforced-concrete structures and another investigation has been conducted in wooden and reinforced-concrete structures. In Figures 15 and 16, the strength ratio has been investigated in which a strengthened building exhibits the same maximum deformation under two consecutive ground motions as that of the corresponding building with the original strength under one ground motion. This provides an appropriate strength ratio for wooden and reinforced-concrete structures.
Conclusion
The following conclusions have been derived.
(1) The repetition of severe near-fault ground motions can be modeled approximately by two separated impulses in order to capture a general property of input of consecutive, intensive ground shakings. This modeling enables a simple evaluation of earthquake response of a non-linear system under consecutive near-fault ground motions in terms of free vibration.
(2) Two scenarios to building collapse under two repeated severe ground shakings have been provided and energy consideration is devised for the response evaluation. The first scenario is based on the collapse limit in terms of the zero restoring force with the P-delta effect and the second one is based on the collapse limit in terms of the maximum deformation. The first scenario corresponds to steel structures and the second one corresponds to wooden structures.
(3) The validity and accuracy of the proposed theory have been discussed through numerical analysis using recorded ground motions. The degree of necessary upgrade on the seismic resistance of residential houses under two consecutive severe ground motions with intensity 7 has been computed by comparing two models in which a building is designed to just collapse under one impulse and the other is designed to just collapse under two consecutive impulses. The ratio was turned out to be approximately from 1.4 to 1.6.
(4) For reinforced-concrete structures, another scenario may be necessary. However, the degree of necessary upgrade is almost the same and around 1.3–1.4.
The present theory may be applicable to near-field ground motions so as to enable the modeling of ground motions into impulses. Furthermore, the proposed method can be applied to rather lower buildings because SDOF modeling is necessary. In addition, the proposed method can be used for the design of new buildings and the seismic retrofitting. It may be difficult to require the input of consecutive, intensive ground shakings for ordinary buildings, including residential houses. It seems reasonable to use the present method for important building structures, e.g., hospitals, city halls, schools, police offices. Furthermore, the passive control methods using dampers may be promising for smart upgrade of building structures.
Author Contributions
KK carried out the theoretical and numerical analysis. IT supervised the theoretical analysis. Both authors read and approved the final manuscript.
Conflict of Interest Statement
The authors declare that the research was conducted in the absence of any commercial or financial relationships that could be construed as a potential conflict of interest.
Funding
Part of the present work is supported by the Grant-in-Aid for Scientific Research (KAKENHI) of Japan Society for the Promotion of Science (No.15H04079, 15J00960). This support is greatly appreciated. A recorded ground motion was provided by KiK-net.
References
Amadio, C., Fragiacomo, M., and Rajgelj, S. (2003). The effects of repeated earthquake ground motions on the non-linear response of SDOF systems. Earthq. Eng. Struct. Dyn. 32, 291–308. doi:10.1002/eqe.225
Fragiacomo, M., Amadio, C., and Macorini, L. (2004). Seismic response of steel frames under repeated earthquake ground motions. Eng. Struct. 26, 2021–2035. doi:10.1016/j.engstruct.2004.08.005
Hatzigeorgiou, G. D. (2010). Ductility demand spectra for multiple near- and far-fault earthquakes. Soil Dyn. Earthq. Eng. 30, 170–183. doi:10.1016/j.soildyn.2009.10.003
Hatzigeorgiou, G. D., and Beskos, D. E. (2009). Inelastic displacement ratios for SDOF structures subjected to repeated earthquakes. Eng. Struct. 31, 2744–2755. doi:10.1016/j.engstruct.2009.07.002
Hatzivassiliou, M., and Hatzigeorgiou, G. D. (2015). Seismic sequence effects on three-dimensional reinforced concrete buildings. Soil Dyn. Earthq. Eng. 72, 77–88. doi:10.1016/j.soildyn.2015.02.005
Housner, G. W. (1963). The behavior of inverted pendulum structures during earthquakes. Bull. Seismol. Soc. Am. 53, 404–417.
Kojima, K., and Takewaki, I. (2015). Critical earthquake response of elastic-plastic structures under near-fault ground motions (part 1: fling-step input). Front. Built Environ. 1:12. doi:10.3389/fbuil.2015.00012
Kojima, K., and Takewaki, I. (2016). Closed-form dynamic stability criterion for elastic-plastic structures under near-fault ground motions. Front. Built Environ. 2:6. doi:10.3389/fbuil.2016.00006
Li, Q., and Ellingwood, B. R. (2007). Performance evaluation and damage assessment of steel frame buildings under main shock-aftershock sequences. Earthq. Eng. Struct. Dyn. 36, 405–427. doi:10.1002/eqe.667
Mahin, S. A. (1980). “Effects of duration and aftershocks on inelastic design earthquakes,” in Proc. of the Seventh World Conference on Earthquake Engineering, Vol. 5 (Istanbul), 677–679.
Motosaka, M. (2012). “Lessons of the 2012 Great East Japan earthquake focused on characteristics of ground motions and building damage,” in Proc. of International Symposium on Engineering Lessons Learned from the 2011 Great East Japan Earthquake (Tokyo, Japan), 166–185. Available at: www.jaee.gr.jp/event/seminar2012/eqsympo/proceedings.html
Moustafa, A., and Takewaki, I. (2011). Response of nonlinear single-degree-of-freedom structures to random acceleration sequences. Eng. Struct. 33, 1251–1258. doi:10.1016/j.engstruct.2011.01.002
Moustafa, A., and Takewaki, I. (2012). Characterization of earthquake ground motion of multiple sequences. Earthq. Struct. 3, 629–647. doi:10.12989/eas.2012.3.5.629
Ruiz-Garcia, J. (2012). Mainshock-aftershock ground motion features and their influence in building’s seismic response. J. Earthq. Eng. 16, 719–737. doi:10.1080/13632469.2012.663154
Takeda, T., Sozen, M. A., and Nielsen, N. N. (1970). Reinforced concrete response to simulated earthquakes. J. Struct. Div. 96, 2557–2573.
Appendix
Load-Deformation Relation of a Steel Frame with P-Delta Effect
A one-story, one-span steel frame is modeled here by three rigid bars connected by four rotational springs as shown in Figure A1. Let k and L denote the stiffness of the rotational spring and the height of the frame and let Mg denote the weight of the floor. The angle of rotation of the vertical bar is denoted by θ and the horizontal load is by P. Four cases are considered: (1) first-order approximation of rotation without P-Δ effect, (2) exact treatment of rotation without P-Δ effect, (3) first-order approximation of rotation with P-Δ effect, (4) exact treatment of rotation with P-Δ effect. When the yield rotation is specified by θy = 0.02 (rad) and the buckling load 4k/L is given by 4k/L = 4Mg (the buckling load is four times the floor weight), the load-rotation relation can be obtained as shown in Figure A2 (). It can be observed that the first-order approximation is a good approximation in the present case. Therefore, the first-order approximated relation is used in this paper.
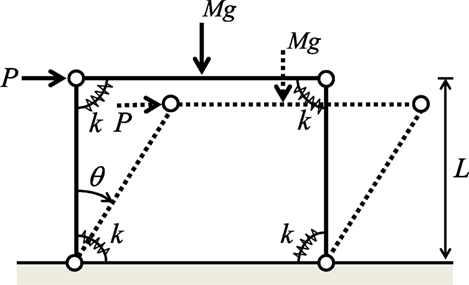
Figure A1. One-story, one-span steel frame of three rigid bars connected by four rotational springs.
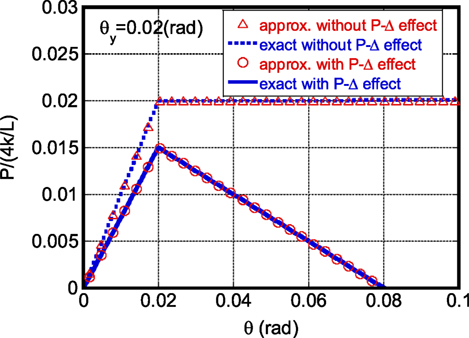
Figure A2. Load-deformation relation of a steel frame with and without P-Δ effect (exact one and approximate one).
Keywords: repeated earthquake ground motions, upgrade of seismic resistance, residential house, near-fault ground motion, elastic–plastic response, energy approach, collapse
Citation: Kojima K and Takewaki I (2016) A Simple Evaluation Method of Seismic Resistance of Residential House under Two Consecutive Severe Ground Motions with Intensity 7. Front. Built Environ. 2:15. doi: 10.3389/fbuil.2016.00015
Received: 14 June 2016; Accepted: 11 July 2016;
Published: 26 July 2016
Edited by:
Solomon Tesfamariam, University of British Columbia, CanadaReviewed by:
Fabrizio Mollaioli, Sapienza University of Rome, ItalyHossein Mostafaei, FM Global, USA
Copyright: © 2016 Kojima and Takewaki. This is an open-access article distributed under the terms of the Creative Commons Attribution License (CC BY). The use, distribution or reproduction in other forums is permitted, provided the original author(s) or licensor are credited and that the original publication in this journal is cited, in accordance with accepted academic practice. No use, distribution or reproduction is permitted which does not comply with these terms.
*Correspondence: Izuru Takewaki, takewaki@archi.kyoto-u.ac.jp