Seismic Risk Assessment of Urban and Rural Settlements around Lake Malawi
 Katsuichiro Goda
 Emily Daisy Gibson1
 Juliet Biggs
- 1Department of Civil Engineering, University of Bristol, Bristol, UK
- 2School of Earth Sciences, University of Bristol, Bristol, UK
- 3School of Earth and Ocean Sciences, Cardiff University, Cardiff, UK
The seismic risk potential for Malawi is high because traditional adobe and earthen structures are seismically vulnerable and large earthquakes of Mw7.0 or greater may occur in the Malawi Rift. To assess seismic risk of the Malawian communities quantitatively, data and models for exposure, hazard, and vulnerability modules that are suitable for Malawi are integrated. The developed risk model is applied to a retrospective appraisal of the past damaging 2009 Karonga earthquake sequence and to the future earthquake scenarios for long-term risk management purposes. The earthquake impact assessment results highlight that the collapse risk predictions of the Malawian settlements are particularly dependent on the inclusion of large-magnitude earthquakes from the active faults around Lake Malawi and the selection and combination of seismic vulnerability models.
Introduction
Malawi, as a low-income country in East Africa with a population of 16.7 million, has limited capability to cope with major earthquake disasters. The population is mainly rural and is engaged in agricultural activities. Traditional houses are hut structures, consisting of mud walls and burnt/unburnt bricks and blocks and, thus, are not resistant against intense ground shaking (World Housing Encyclopedia, 2002). The December 2009 Karonga earthquake sequence, albeit moderate events with moment magnitudes Mw5.4 to Mw6.0 (United States Geological Survey, 2009; Biggs et al., 2010), caused significant damage and disruption to local communities (United Nations Resident Coordinator, 2009; United States Geological Survey, 2009; Chapola and Gondwe, 2016), revealing the weakness and vulnerability of the country. Moreover, the shelters project by UN-HABITAT, United Nations High Commissioner for Refugees (UNHCR), and International Federation of Red Cross (IFRC) (2012) highlighted the urgent needs for constructing safer houses in Malawi. To mitigate the adverse impact due to future earthquake disasters, it is vital to evaluate the seismic risk to Malawian communities accurately and to implement adequate risk mitigation measures (Chapola and Gondwe, 2016). In this context, rapid increase of population is a major concern.
Malawi is situated in the southern branch of the active East Africa Rift System (Yang and Chen, 2010). In the Malawi Rift, several major geological faults (e.g., Livingstone and Bilila-Mtakataka faults) can be identified using seismic stratigraphic analysis (Flannery and Rosendahl, 1990). These faults may be capable of hosting earthquakes of Mw7.0 or greater due to relatively long fault lengths (>90 km) and wide seismogenic thickness (>30 km) (Jackson and Blenkinsop, 1997). The potential size of the earthquakes in the Malawi Rift is significantly larger than those of the 2009 Karonga sequence and other historical events in the region, such as the 1989 Ms6.6 Salima-Dedza-Mchinji earthquake (Gupta and Malomo, 1995). For instance, in an event of Mw7.0+, much stronger shaking will be experienced over wider geographical areas, which could result in potential catastrophe. At present, Malawians lack a seismic risk assessment and long-term earthquake mitigation strategy, particularly for large-magnitude events.
Conventionally, seismic hazard assessment was done by considering an available instrumental earthquake catalog only (Midzi et al., 1999), which is short in duration in comparison with average recurrence periods of the geological faults (e.g., 50 years versus thousands of years). Given the seismic potential of well-matured geological faults around Lake Malawi, Hodge et al. (2015) assessed regional seismic hazard in Malawi by incorporating geological and geomorphological information. In their study, possibility of having Mw7.0–8.0 earthquakes was formally included in probabilistic seismic hazard analysis by exploring different hypotheses regarding different rupture scenarios of the major faults and by evaluating impact of including large earthquakes. In particular, testing sensitivity to different fault rupture scenarios is important for contextualizing a seismic hazard and interpreting results in light of incomplete knowledge and inherent uncertainty about physical rupture mechanisms. Nevertheless, the extension to seismic risk assessment has not yet been conducted.
This study extends the current seismic hazard model for Malawi into a seismic risk model by evaluating risk as convolution of hazard, exposure, and vulnerability. In applying this framework, model components need to be compatible such that exposure-hazard-vulnerability modules are linked seamlessly and key uncertainties in the models are accounted for and propagated properly. This has a major influence on the choice of appropriate models in developing a seismic risk model for Malawi due to the lack of relevant data and applicable models. For example, ground motion and seismic vulnerability models specific to Malawi do not exist; although some teleseismic ground motion data are available for small-to-moderate earthquakes (e.g., 2014 Mw5.1 event), these data are insufficient to develop a robust prediction model. In such situations, global models need to be considered. In face of such pragmatic constraints, the risk assessment framework is focused on the impact to the population (i.e., the number of affected inhabitants experiencing a certain seismic intensity) and on the building collapse as a proxy to damage to the built environment.
To produce accurate risk predictions, it is paramount that high-resolution contemporary population data are used in the risk model. For this purpose, exposure data for Malawian settlements are obtained from WorldPop (2014) (http://www.worldpop.org.uk/; Linard et al., 2011, 2012), which is a public database of the high-resolution spatial population data (100-m grids) for developing countries. The WorldPop database provides the population distributions adjusted to match the United Nations national population estimates in year 2010, 2015, and 2020, allowing an investigation of the earthquake impact in the past, present, and future. Hazard is characterized based on the Hodge et al. model, which allows the investigations of adopting different hypotheses regarding the fault rupture behavior. To make the hazard output consistent with the input for seismic vulnerability, modifications are necessary in terms of seismic intensity measures. For Malawi, using modified Mercalli intensity (MMI) rather than modern measures [e.g., peak ground acceleration (PGA), peak ground velocity (PGV), and spectral acceleration] is appropriate due to the lack of seismic vulnerability models that take such modern hazard parameters as input. The vulnerability module is based on empirical prediction models of building collapse that are applicable to global building stock. Specifically, collapse prediction models by Jaiswal et al. (2011), So and Spence (2013), and Spence and Foulser-Piggott (2013) are adopted. Details of the models differ, particularly in definitions of vulnerability classes for building typologies and methods for the model development. As part of the risk assessment, the validity of these models is investigated by applying them to the earthquake damage due to the 2009 Karonga sequence.
The main objectives of this study are to: (i) develop the first-generation probabilistic seismic risk model for Malawi; (ii) conduct quantitative earthquake impact assessments for several urban and rural communities in Malawi and carry out sensitivity analyses with regard to exposure, hazard, and vulnerability model components; and (iii) discuss the results from long-term risk management perspectives. The significance and novelty of this work are that the seismic risk model is successfully developed and applied for Malawi by accounting for key uncertainties in the quantitative risk assessment. The approach taken is similar to the prompt assessment of global earthquakes for response (PAGER) methodology (Earle et al., 2009). However, this research is focused on prediction/assessment of earthquake impact due to future scenarios, rather than real-time impact assessment. This is to enhance Malawi’s seismic resilience and to enable a rational long-term risk mitigation, which is critically lacking. The scenarios considered are numerous and consistent with regional probabilistic seismic hazard analysis; such comprehensive assessment facilitates the holistic design and risk mitigation actions. The paper is organized as follows. First, a general methodology for seismic risk analysis is presented, followed by detailed descriptions of the exposure, hazard, and vulnerability modules. Subsequently, the developed risk model is applied to the 2009 Karonga earthquake scenario. The predicted risk estimates in terms of the number of collapsed buildings using different vulnerability models are compared with the observed earthquake damage during the sequence. In the Section “Result,” seismic risk assessment results for five rural and urban settlements in Malawi are discussed by considering future earthquake scenarios. Especially, sensitivity of the earthquake impact (i.e., number of affected population and number of buildings collapsed) to exposure (i.e., population distributions at different years), hazard (i.e., different fault rupture and ground motion modeling), and vulnerability (i.e., different combinations and weighting of applicable building-collapse prediction models) is investigated. Finally, main conclusions are drawn with the emphasis on future extensions and further applications of the developed seismic risk model for improving seismic resilience in Malawi.
Methodology
Analytical Framework
The analytical framework for the developed seismic risk model for Malawi is based on a generic concept of risk and is comprised of three main elements, i.e., exposure, hazard, and vulnerability. It is consistent with a modern seismic risk analysis methodology (McGuire, 2004). An important feature is that the framework is developed for a portfolio of buildings at regional levels, rather than individual structures. Figure 1 shows the seismic risk analysis procedure. More detailed descriptions of the model components are given in the following.
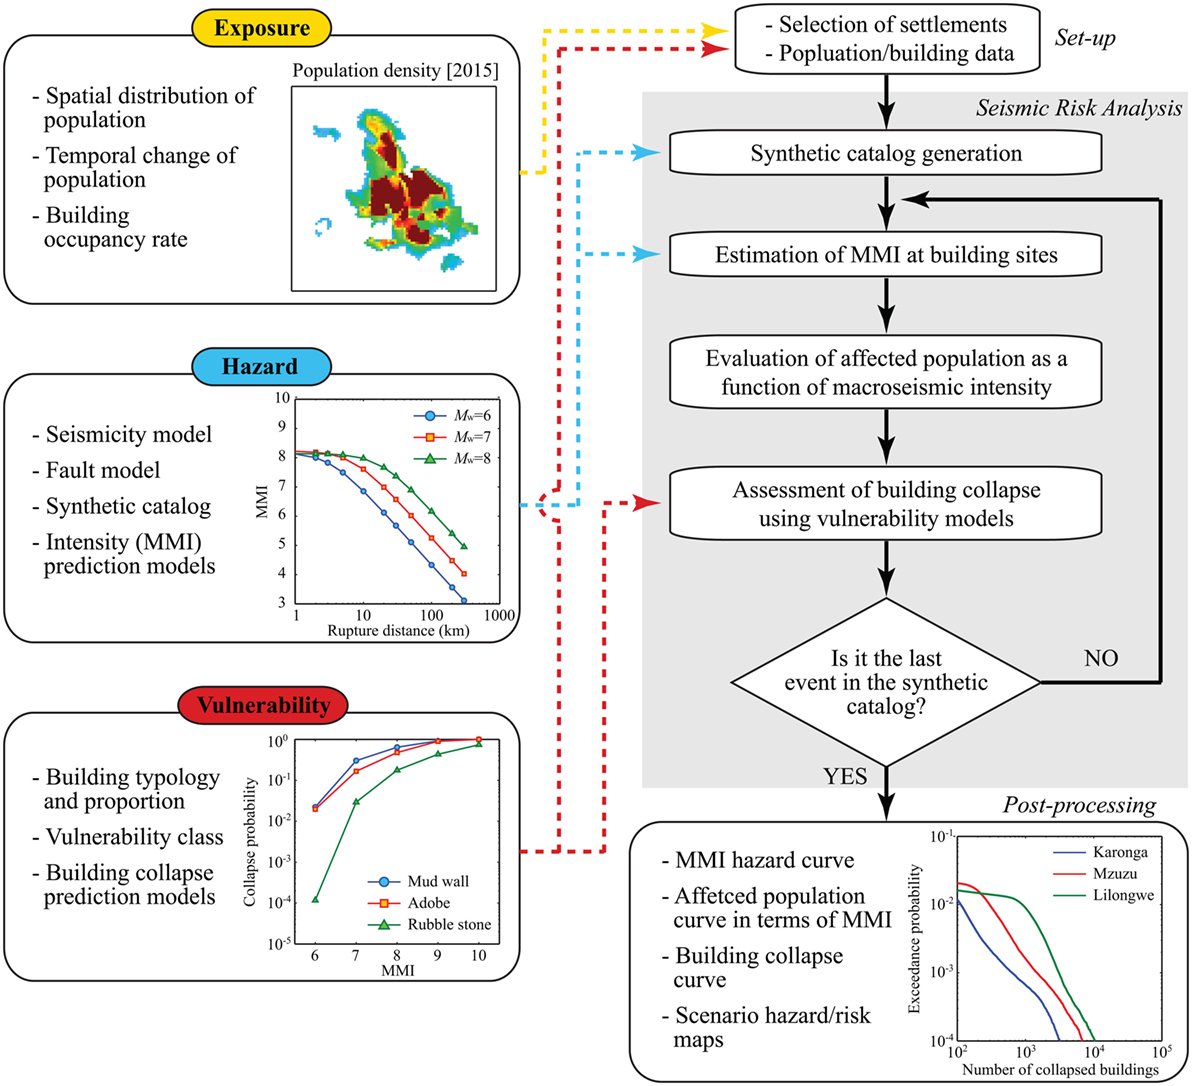
Figure 1. Seismic risk analysis framework.
The exposure module defines the spatial distribution of the population in a selected settlement and its temporal change. The WorldPop data are given at spatial grids of 100 m (Linard et al., 2011, 2012). The building occupancy rate, which is based on Malawi’s census data (National Statistical Office of Malawi, 2008), is used to convert the population size into the number of buildings in the settlement. The hazard module consists of two main components: (i) generation of synthetic earthquake catalog, and (ii) estimation of macroseismic intensity (MMI) at exposure grid cells. The catalog generation is based on the seismic hazard model by Hodge et al. (2015), which takes into account both instrumental catalog-based seismicity model and fault-based geomorphological model. The MMI values at grid cells of the exposure data are estimated using the prediction model by Allen et al. (2012). The vulnerability module evaluates the probability of building collapse for a given seismic intensity. The assessment is based on a set of applicable vulnerability models for global building typologies [e.g., Jaiswal et al. (2011), So and Spence (2013), and Spence and Foulser-Piggott (2013)]. The seismic vulnerability classes of Malawian buildings are assigned based on the PAGER building typologies (Jaiswal and Wald, 2008) and EMS-98 (Grünthal, 1998).
The seismic risk assessment is performed based on Monte Carlo simulation (see a flowchart in Figure 1). For a given settlement of interest in Malawi, population and building data are obtained. Then, a synthetic earthquake catalog is generated using the adopted seismic hazard model. For each seismic event in the synthetic catalog, MMI values at the exposure grid cells are evaluated by taking into account prediction errors of the MMI model. Using the MMI values and population data, the number of affected population is expressed in terms of macroseismic intensity. Subsequently, a seismic vulnerability model is applied to calculate the collapse probability of each building, and a scenario-based building damage map is created by generating realizations of collapse for all buildings individually according to the calculated collapse probability. The preceding analysis procedure is repeated for all events in the synthetic catalog. Note that the events in the catalog are all associated with occurrence times and thus annual probability of exceedance can be assigned to these events. In the post-processing stage, various forms of the seismic risk results can be produced, including a MMI hazard curve, affected population hazard curve, and building-collapse risk curve. These outputs are useful for developing long-term seismic risk management strategies for different settlements in Malawi.
Exposure
The WorldPop database offers high-resolution population maps (approximately 100 m by 100 m resolution) of Malawi in year 2010, 2015, and 2020. The WorldPop maps have been created by combining various forms of geographical and demographic data. The accuracy of modeling the population distribution has been evaluated by comparing the modeled population distribution with existing census counts at a high administrative level in several African countries (Linard et al., 2011, 2012). For these countries, the WorldPop dataset outperforms other population datasets, such as LandScan data.
Figure 2A shows the population distribution of Malawi in year 2015, where red color represents high population density areas. Two major urban cities in Malawi are Lilongwe (capital) and Blantyre (not indicated in the map; it corresponds to the high population density areas in the south of Zomba). In the figure, locations of five urban and rural settlements that are considered for the seismic risk assessment in the main result section are indicated: Karonga, Mzuzu, Lilongwe, Mangochi, and Zomba. They are selected on the basis of population characteristics and proximity to major faults. Figure 2B shows the zoomed population distributions for the five settlements. For each location, the boundary of the population is defined by a radius of 10 km by setting the center of the circle to the most densely populated area. It can be observed that rural towns (i.e., Karonga and Mangochi) have more compact high-density areas than urban cities (i.e., Mzuzu, Lilongwe, and Zomba). To transform population data into building data, the number of buildings per cell is estimated by dividing the number of population per cell by the average occupancy, which is set to five people per building based on the census data (National Statistical Office of Malawi, 2008). In the final exposure data, cells with the rounded number of buildings less than 1 (i.e., cells with the population size less than 2.5) are eliminated. Furthermore, Figure 3 shows the population growth of the five cities and towns between 2010 and 2020, highlighting a more rapid increase in Lilongwe.
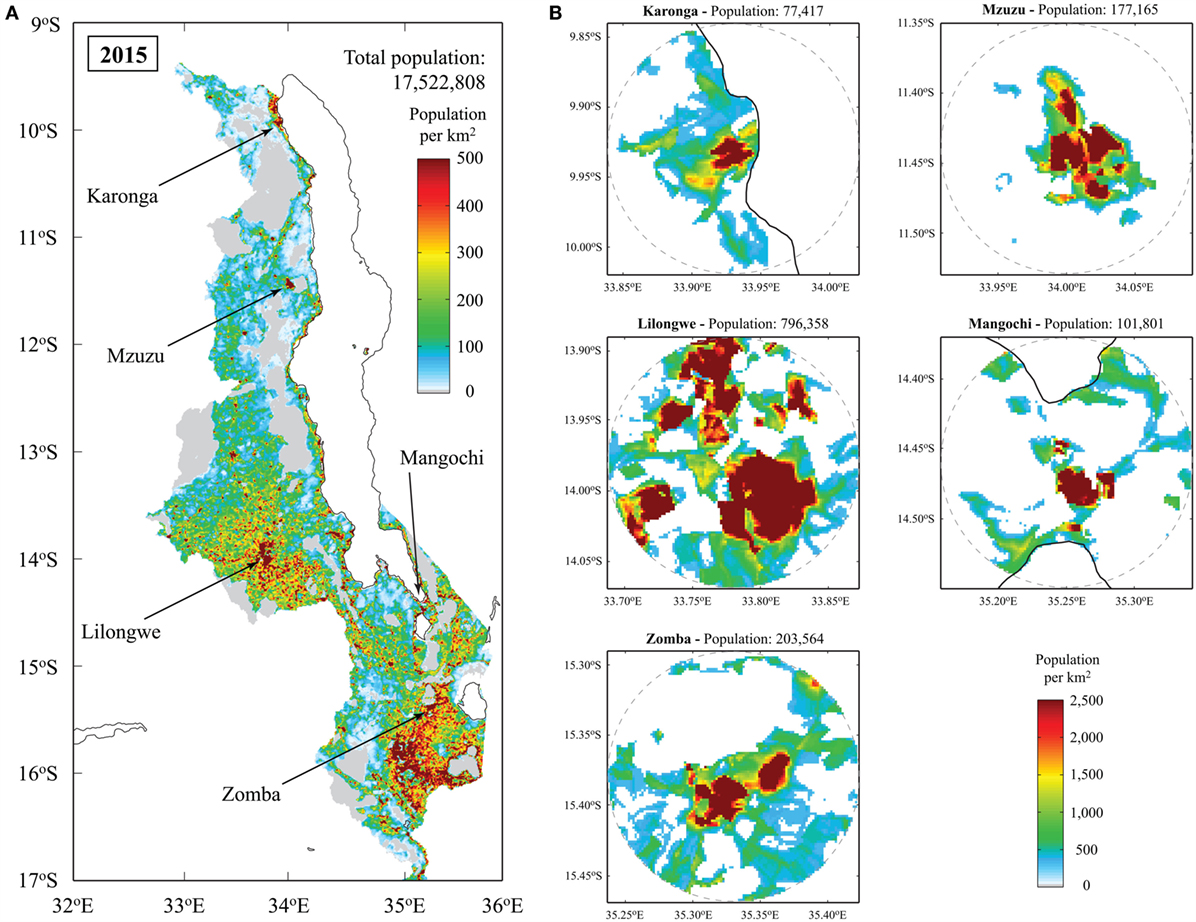
Figure 2. (A) Population distribution for Malawi in year 2015. (B) Population distributions for Karonga, Mzuzu, Lilongwe, Mangochi, and Zomba. Note that the radius of the dotted circle in (B) is 10 km.
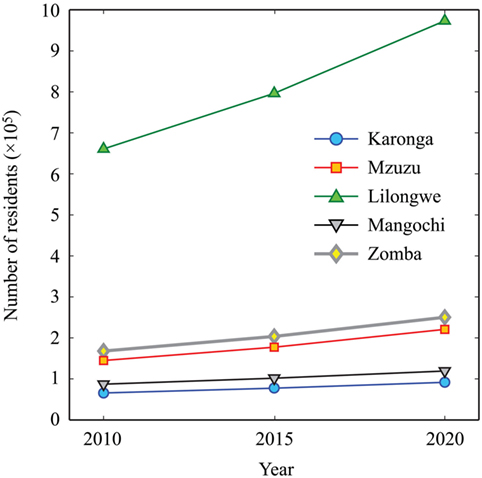
Figure 3. Population growth for Karonga, Mzuzu, Lilongwe, Mangochi, and Zomba.
Seismicity and Earthquake Catalog Generation
Geological, geodetic, and geomorphological studies in Malawi indicate the possibility for experiencing infrequent, large earthquakes originated from the well-matured fault systems along Lake Malawi (Flannery and Rosendahl, 1990; Jackson and Blenkinsop, 1997). Figure 4 shows locations of seven faults in the Malawi Rift region: Livingstone, Usisya, Mbamba, Bandawe, Metangula, Mwanjage, and Bilila-Mtakataka faults. Hodge et al. (2015) investigated the effects of including such large-magnitude earthquakes on the regional seismic hazard potential in the Malawi Rift region through probabilistic seismic hazard analysis. In their model, four variations of the earthquake occurrence model were considered. The first one was solely based on the post-1965 instrumental earthquake catalog compiled by the International Seismological Centre. The seismicity model was characterized using the truncated Gutenberg and Richter (1954) relationship, where the maximum moment magnitude was set to 6.75, by subdividing the entire region into four sub-regions according to local seismic activities. The b-values of the sub-regions were in a range from 0.97 to 1.08, which are consistent with the previous seismic hazard model by Midzi et al. (1999). Further details of the instrumental catalog-based seismicity model for Malawi can be found in Hodge et al. (2015).
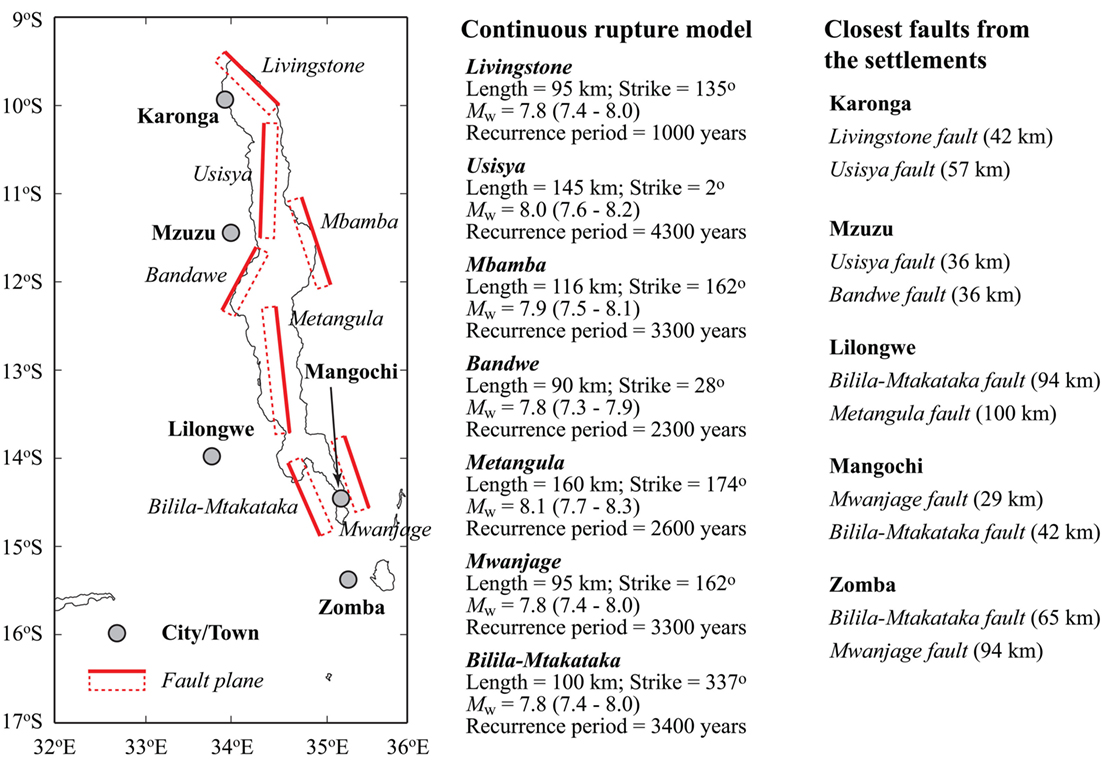
Figure 4. Fault maps of the continuous rupture model for Malawi [modified from Hodge et al. (2015)].
For the fault-based models, fault rupture parameters, such as fault dimensions and slip rate, were determined based on empirical scaling relationships available in the literature by accounting for their uncertainties [see Hodge et al. (2015) for details]. On the other hand, strain accumulation for each fault was calculated based on a global plate motion model by Kreemer et al. (2003) and geodetic plate motion estimates of the Nubia and Rovuma micro-plates (Stamps et al., 2008). Significant epistemic uncertainty exists regarding whether a fault ruptures along its entire length in a single event or in a series of smaller earthquakes, affecting the recurrence time interval and magnitude of the seismic events. For instance, the Livingstone and Bilila-Mtakataka faults are considered as a single, continuous structure (Wheeler and Karson, 1989; Jackson and Blenkinsop, 1997), whereas the other five faults consist of segments that could rupture individually (Flannery and Rosendahl, 1990; Contreras et al., 2000). To take into account different rupture possibilities of future earthquakes, the second to fourth models are based on the earthquake rupture of the seven fault systems by considering different rupture hypotheses, i.e., continuous, mixed, and segmented rupture, respectively, in addition to the instrumental catalog-based seismicity. The mixed rupture model is a composite model based on the continuous and segmented cases with equal weights. The information of the continuous rupture model for the seven fault systems is included in Figure 4; more details of the segmented rupture model can be found in Hodge et al. (2015). For seismic hazard and risk assessments of specific cities/towns, it is important to consider the proximity of the fault segments to the locations of interest (Figure 4). Mzuzu and Mangochi are relatively close to two major fault systems (about 30 km at distance); Karonga and Zomba are at moderate distances from major faults (40–60 km); whereas Lilongwe, although its population is much greater than others (Figures 2 and 3), is relatively far from the major faults (100 km). The differences of the exposure and hazard characteristics at different settlements have a significant influence on the earthquake impact assessment.
Figure 5 compares magnitude-recurrence relationships of the four rupture models for the entire region. For this comparison, synthetic earthquake catalogs for the rupture models are generated through Monte Carlo simulation (Hodge et al., 2015). Up to Mw6.5, all rupture models follow the same trend that is based on the instrumental catalog, but they diverge at higher magnitudes. The instrumental catalog-based model is generated using three possible maximum magnitudes, 6.25, 6.5, and 6.75, with weights of 0.25, 0.5, and 0.25, respectively, causing a drop-off around Mw6.7. Although the continuous, mixed, and segmented rupture models all fall within the 5th and 95th percentiles of the extrapolated Gutenberg–Richter relationship, these large faults are not uniformly distributed within the entire source zone (Figure 4). In other words, despite the similarity between the extrapolated Gutenberg–Richter statistics based on the instrumental catalog and those based on the geological rupture models, the geological approach contains more spatial information on the distribution of potential hazard.
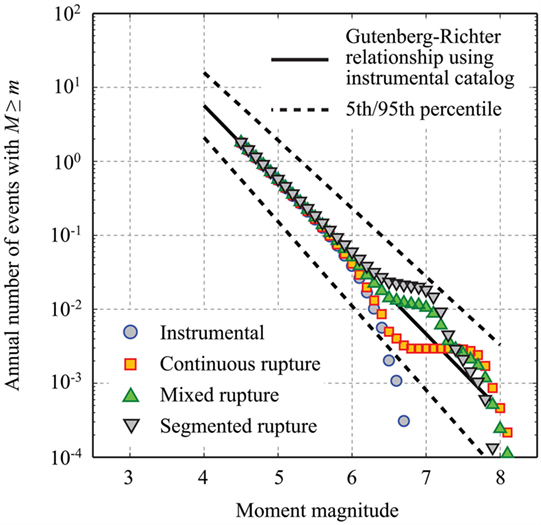
Figure 5. Gutenberg–Richter relationships for the instrumental catalog-based model, continuous rupture model, mixed rupture model, and segmented rupture model [modified from Hodge et al. (2015)].
Estimation of Macroseismic Intensity
Another critical component of the hazard module is the estimation of ground motion intensity at building locations. In the developed seismic risk model, MMI is adopted as seismic intensity measure. Despite its qualitative nature and difficulty in assigning reliable estimates of MMI values to observations (Musson et al., 2010; Hough, 2014), the use of MMI measures has been increasing in prompt ground motion and loss estimation (e.g., PAGER; Earle et al., 2009). The main reasons for adopting MMI in this study are twofold: (i) lack of modern ground motion models for PGA and spectral acceleration that are specific to Malawi or East Africa broadly (this is applicable to the MMI prediction model) and (ii) unavailability of advanced seismic vulnerability models that use PGA and spectral acceleration as input for structural damage prediction. There are two options in estimating MMI for a given scenario (Cua et al., 2010): (i) use of ground motion models for MMI directly for all considered scenarios [direct approach; e.g., Atkinson and Wald (2007)] and (ii) use of multiple ground motion models for spectral acceleration and then convert to MMI through empirical relationships [indirect approach; e.g., Wald et al. (1999)]. In this work, the direct approach using the prediction equation by Allen et al. (2012) is considered. This is because the indirect methods, where the estimates of MMI values are obtained via PGA and PGV using the prediction equations for PGA and PGV and the conversion equations between PGA/PGV and MMI (Wald et al., 1999), are associated with significant uncertainty (Cua et al., 2010), usually greater than the uncertainty of the direct MMI prediction equation alone.
Allen et al. (2012) developed two prediction models that use the rupture distance and the hypocentral distance as source-to-site distance parameter. In this study, the model that is based on the rupture distance is adopted because the rupture distance can be evaluated for seismic events in the synthetic catalog (fault geometry is known for each event) and the prediction error for the rupture distance-based model is smaller than that for the hypocentral distance-based model. The Allen et al. model includes the site term that is a function of topographical slope. To account for such site effects, the slope gradients at the exposure grid cells are obtained from the global Vs30 map by Wald and Allen (2007). Figure 6 shows the median as well as 16th and 84th percentiles of the predicted MMI values as a function of rupture distance for three magnitude values. Typically, for a given earthquake scenario, the confidence interval of the estimation corresponding to the 16th and 84th percentiles is plus/minus 0.7–1.0 MMI units (Allen et al., 2012).
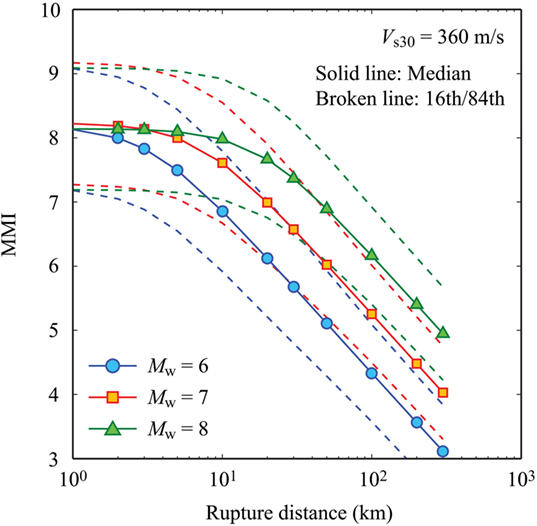
Figure 6. MMI prediction model by Allen et al. (2012).
In estimating MMI values at exposure grid cells, spatial correlation of MMI values at different locations is taken into account (i.e., MMI values are simulated as a correlated random field). This consideration can be important when earthquake impact assessment for a portfolio of buildings is carried out (Goda et al., 2011). The challenging aspects of the evaluation are that a suitable spatial correlation model for MMI is not available in the literature and that the effects of spatially varying seismic intensity measures are partly included in original MMI observations as they are defined over certain areas (e.g., zip codes and administrative units). In this study, a simplified correlation structure, which adopts a constant linear correlation coefficient at different locations (within the radius of 10 km from the center of the settlement), is considered for the prediction error of the MMI equation. More specifically, for the base case, the correlation coefficient is set to 0.5; this value is consistent with the empirical correlation estimates of PGA and spectral acceleration of various past earthquakes within the separation distance up to 10 km (Goda, 2011). In the Section “Result,” the effects of considering different correlation coefficients on the earthquake impact assessment will be investigated.
Seismic Vulnerability
In order to make a prediction for the number of collapsed houses due to a large-magnitude seismic event, three vulnerability models developed by Jaiswal et al. (2011), So and Spence (2013), and Spence and Foulser-Piggott (2013) are considered. All three models are developed for global building stock and use MMI as input hazard parameter. They produce estimates of building-collapse probability for a given MMI and building typology. The building typology (or vulnerability class) signifies the seismic resistance and capacity. Therefore, granularity and assignment of the vulnerability classes to buildings are important, having significant impact on the result.
The So-Spence and Spence–Foulser-Piggott models were developed based on the Cambridge earthquake impact database. Although the final publication years of the So-Spence and Spence–Foulser-Piggott models were the same, the So-Spence model was a predecessor of the Spence–Foulser-Piggott model (the former was initially submitted in 2011, whereas the latter was presented at a conference in 2013). Furthermore, they were developed for different purposes; the So-Spence model was developed as a part of the casualty and fatality model, whereas the Spence–Foulser-Piggott was developed for the building-collapse assessment. Because the predicted collapse rates based on these two models differ significantly (see Figure 7), both models are considered in this study to investigate the effect of seismic vulnerability functions on the building-collapse risk. Both vulnerability models adopt the EMS-98 classification scheme (grades A to E) to differentiate structures by the main component of their structural build-up. The general descriptions for the vulnerability classes A to E are (note: class D is split into D1 and D2): weak masonry (A), unreinforced masonry (B), structural masonry or pre-code reinforced concrete frame (C), moderate-code reinforced concrete frame or shear-wall (D1), timber frame (D2), and steel frame or high-code reinforced concrete frame (E). The expert reports for Malawi (World Housing Encyclopedia, 2002) indicate that 35 and 45% of the houses are classified as rammed earth house and unburnt brick wall building, respectively, whereas 5% of the building stock is timber frame with mud wall; the remaining 15% is unclassified. The seismic vulnerability ratings given in the World Housing Encyclopedia reports are “high vulnerability (A)” for the rammed earth house and unburnt brick wall building and “medium-low vulnerability (D)” for the timber frame with mud wall. Based on this information, 80 and 5% of the Malawian residential stock are considered as EMS-98 class A and D2, respectively. It is assumed that the remaining 15% is classified as D1 by comparing the building-collapse vulnerability functions for different classes. This assignment is arbitrary and could have been done differently (e.g., class B or class C may be considered). Figures 7A,B compare the building-collapse rate functions of the So-Spence and Spence–Foulser-Piggott models, respectively. It can be observed that there is significant variability among the collapse rate functions for different vulnerability classes and for different models. More specifically, the collapse rate functions for the So-Spence model are more clustered, in comparison with those for the Spence–Foulser-Piggott model. For the So-Spence model, the assumption adopted for the unclassified building stock (i.e., 15% is considered to fall under D1, which could have been in B or C) has minor effect, whereas such a difference can be large for the Spence–Foulser-Piggott model.
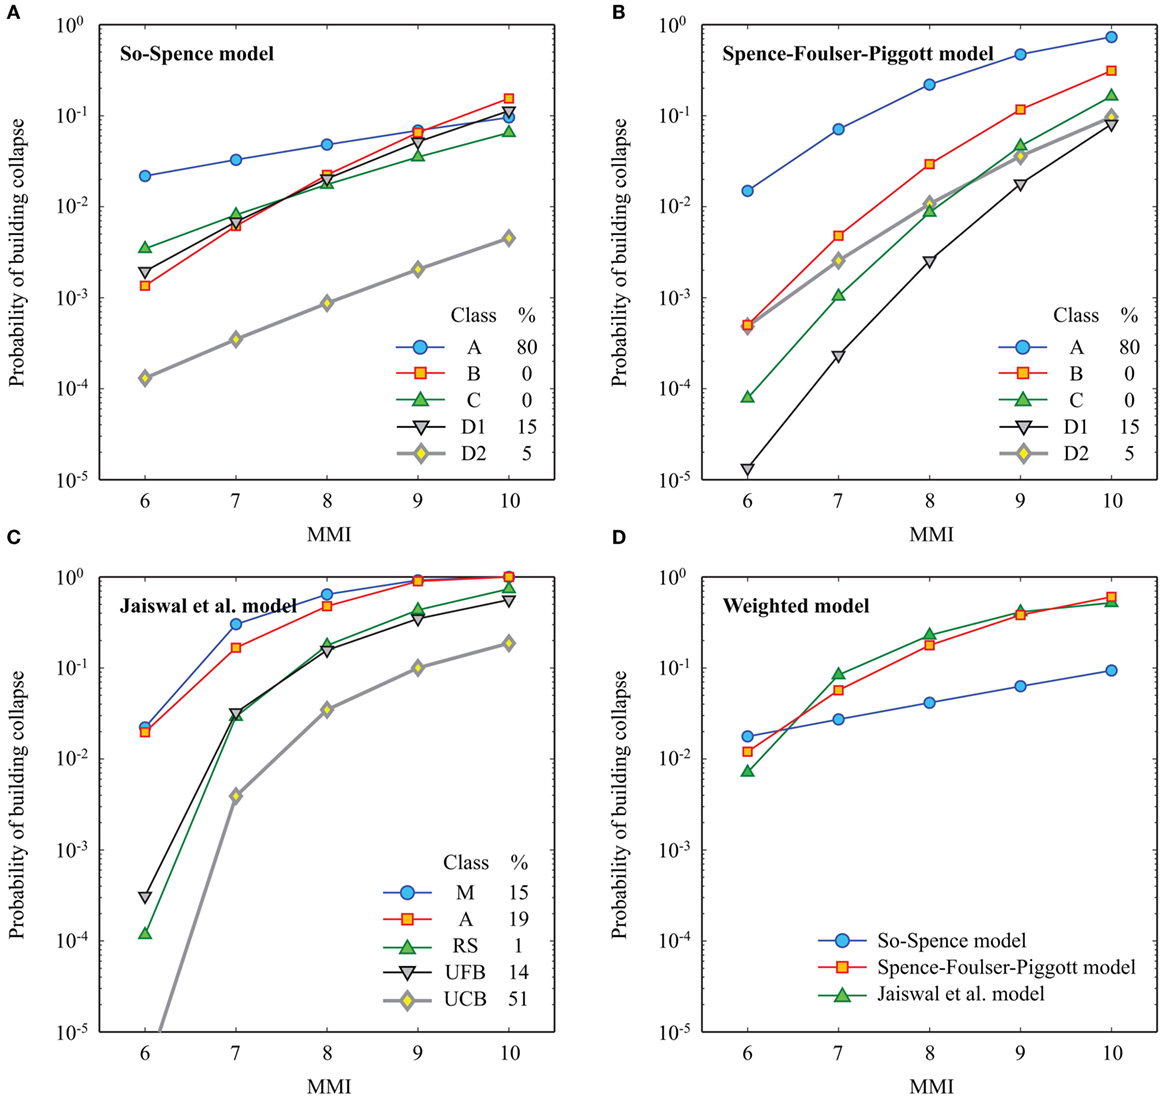
Figure 7. (A) Spence-So building-collapse prediction model. (B) Spence–Foulser-Piggott building-collapse prediction model. (C) Jaiswal et al. building-collapse prediction model. (D) Weighted building-collapse prediction model.
The Jaiswal et al. model is based on the WHE-PAGER classification system (World Housing Encyclopedia, 2002; Jaiswal and Wald, 2008), where a global residential building inventory database was derived in order to characterize the building stock distribution and to estimate the vulnerability of building stock to earthquake shaking by classifying country specific buildings by construction material. The structural types that are relevant to Malawian buildings are mud walls (M2), adobe blocks (A), rubble stone (RS), unreinforced fired brick masonry (UFB), and concrete block unreinforced masonry (UCB). The percentages of the buildings assigned to these typologies are 0.15, 0.19, 0.01, 0.14, and 0.51, respectively (Jaiswal and Wald, 2008). Due to absence of the actual damage data, the global vulnerability functions for different vulnerability classes were developed based on expert judgement (Jaiswal et al., 2011). Figure 7C shows the five building-collapse curves by Jaiswal et al. (2011) which are relevant for Malawi.
Moreover, Figure 7D compares the combined collapse rate functions for the So-Spence, Spence–Foulser-Piggott, and Jaiswal et al. models. The combined function is obtained by weighting individual collapse rate functions for different vulnerability classes based on the percentages of the building classes. It can be seen that three vulnerability models produce similar collapse probability predictions for MMI 6 to 7, whereas, for MMI > 7, the Spence–Foulser-Piggott and Jaiswal et al. models predict building collapse with much greater probabilities than the So-Spence model. To investigate the effect of using different combinations of the three vulnerability models on the seismic risk assessment result, an option to assign different weights to these three models is implemented in the developed seismic risk model. For the base case, equal weighting is considered.
Retrospective Assessment of the 2009 Karonga Earthquake Sequence
It is important to examine whether the developed seismic risk model produces realistic risk predictions for past earthquakes. In this context, it is particularly interesting to investigate which of the three seismic vulnerability models implemented in the seismic risk model produces reasonable results with respect to the observed damage. The earthquake damage observations/records during the December 2009 Karonga earthquake sequence can be used for such purposes (note: a similar retrospective assessment for the 1989 Salima-Dedza-Mchinji earthquake is difficult because relevant exposure data are unavailable). According to the United States Geological Survey (2009), four moderate earthquakes struck the Karonga region between December 6, 2009 and December 20, 2009: Mw5.8 event on 6th December, Mw5.9 event on December 8, Mw5.4 event on December 12, and Mw6.0 event on December 19. The epicentral locations of the four events by the United States Geological Survey (2009) are shown in Figure 8A. Alternatively, source models estimated by Biggs et al. (2010) can be adopted for the retrospective damage assessment of the 2009 Karonga sequence. The finite-fault models by Biggs et al. (2010) are also included in Figure 8A. It is noteworthy that the source locations of the four events by the two studies differ significantly. Among these, the 8th December event and 19th December event were particularly damaging. The United Nations Resident Coordinator (2009) reported that 1,557 buildings were destroyed during the whole Karonga sequence (break-down for each event is not available). On the other hand, the United States Geological Survey (USGS) significant earthquake database (2009) indicated that about 3,000 buildings were destroyed or damaged due to the 8th December event, while 1,111 houses were destroyed due to the 19th December event.
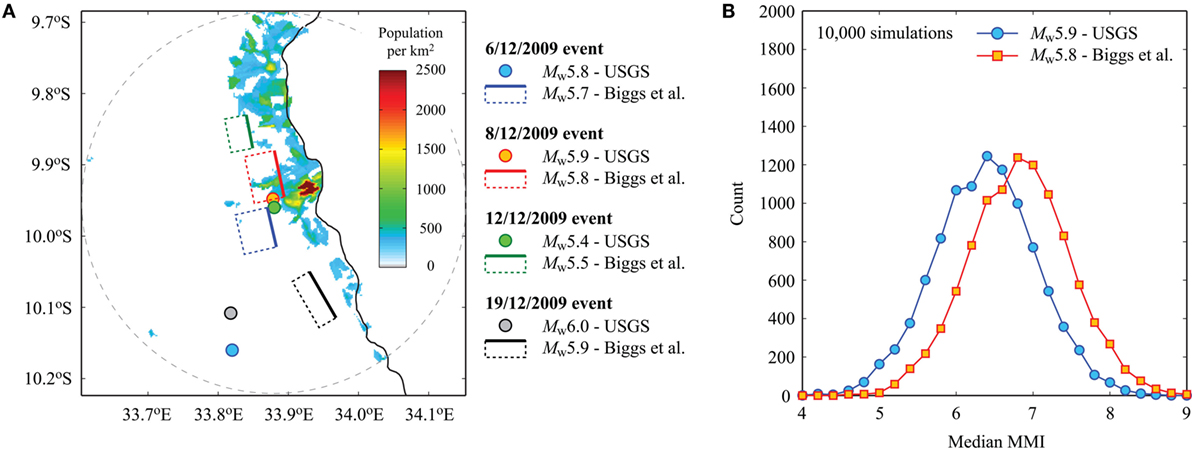
Figure 8. (A) Population distribution in Karonga (the radius is extended to 30 km) and source models of the 2009 Karonga earthquake sequence by United States Geological Survey (2009) and Biggs et al. (2010). (B) Histograms of median MMI for the 2009 Karonga earthquake scenario based on source models by United States Geological Survey (2009) and Biggs et al. (2010).
To produce the seismic risk estimates for the 2009 Karonga earthquake using the developed seismic risk model, the 8th December, 2009 event is considered. This scenario poses the most critical seismic hazard (on average) to the building stock in Karonga among the four seismic events of the Karonga sequence due to its proximity to the population center (Figure 8A). It is noteworthy that the predicted earthquake damage may underestimate the actual damage because damage accumulation due to multiple earthquakes is not taken into account, as indicated by the United Nations Resident Coordinator (2009). For the retrospective assessment of the earthquake damage, a separate exposure dataset (i.e., different from the one shown in Figure 2B) is prepared by using the WorldPop data in year 2010 and by considering a boundary radius of 30 km. The radius of 30 km is chosen by considering that predicted MMI values of the 8th December event become sufficiently low not to cause building collapse (see Figures 6 and 7D). In total, 10,000 simulations are conducted. Figure 8B shows histograms of median MMI based on the two source models for the 8th December event, highlighting large variability of the representative macroseismic intensity. The median MMI (horizontal axis of Figure 8B) corresponds to the 50th percentile of the MMI values that are estimated at the exposure cells and thus represents the typical ground intensity for the building portfolio during a seismic event. On the other hand, the counts (vertical axis of Figure 8B) correspond to the number of the cases where the median MMI falls within the specified bin. The seismic hazard levels due to the USGS point-source model are less than those due to the Biggs et al. finite-fault model; the mean and SD of median MMI are 6.38 and 0.65, respectively, for the USGS point-source model, whereas the mean and SD of median MMI are 6.82 and 0.65, respectively, for the Biggs et al. finite-fault model.
Subsequently, for the 10,000 synthesized seismic events, building-collapse assessment is carried out using three vulnerability models individually as well as using the equal-weight model (Figure 7D). The results based on the USGS point-source model are shown in Figure 9A, whereas the results based on the Biggs et al. finite-fault model are shown in Figure 9B. Note that the counts (vertical axis of Figure 9) correspond to the number of the cases where the number of collapsed buildings falls within the specified bin based on the 10,000 simulations. The So-Spence model results in a concentrated probability distribution of the number of collapsed buildings, whereas the other two models show a long upper tail distribution for the number of collapsed buildings. The main reason for the more concentrated collapse risk prediction for the So-Spence model is because its weighted collapse rate function (Figure 7D) has a gentle slope in terms of MMI. By contrast, the steep slopes for the Spence–Foulser-Piggott and Jaiswal et al. models result in much greater variation of the predicted collapse risk distribution. The use of the finite-fault model rather than the point-source model leads to the increased estimates of the number of collapsed buildings; this is because of the finite-fault dimension of the earthquake for this event (i.e., source-to-site distances are shorter for the former than the latter; Figure 8). Given the general agreement of the predicted and observed damage and significant variability of the predicted earthquake risk, it is not possible to determine the suitability of the three vulnerability models. In such cases, it may be sensible to consider all three vulnerability models with equal weight (i.e., equal credibility for these models). The sensitivity of the collapse risk predictions to the vulnerability will be investigated in Section “Result.”
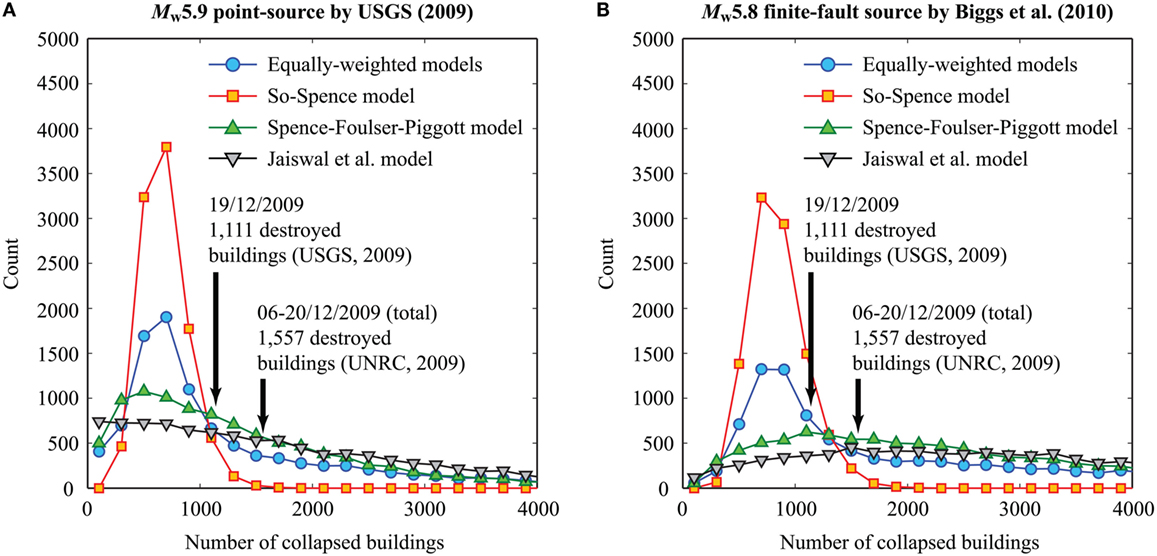
Figure 9. (A) Histograms of the number of collapsed buildings for the 2009 Karonga earthquake scenario (USGS model) by considering different vulnerability models. (B) Histograms of the number of collapsed buildings for the 2009 Karonga earthquake scenario (Biggs et al. model) by considering different vulnerability models.
Seismic Risk Assessment of Settlements in Malawi
Quantitative assessment of seismic risk for five cities and towns in Malawi (see Figure 2) is conducted to investigate the key features of the earthquake impact metrics and their changes due to different exposure-hazard-vulnerability characteristics. Throughout this section, the base case for the seismic risk assessment is set as follows: the earthquake occurrence is based on the mixed rupture model; the spatial correlation coefficient of MMI values is 0.5; the exposure data are for year 2015 (Figure 2); and three vulnerability models are weighted equally (Figure 7D). Two earthquake impact indicators that are focused on are the number of affected people experiencing MMI > 6.5 and the number of collapsed buildings in a given settlement. The duration of the synthetic earthquake catalog is set to 1 million years. To facilitate the presentation of the sensitivity analysis results to the exposure-hazard-vulnerability model components, Mzuzu is focused on in the first three subsections. Subsequently, the results for different settlements are discussed in the last subsection to examine the effects of site locations on the earthquake impact assessment.
Effects of Seismic Hazard Models
In this subsection, the effects of the seismic hazard modeling are investigated. The major source of uncertainty in the developed seismic risk model can be attributed to the earthquake occurrence modeling (Hodge et al., 2015); i.e., instrumental catalog, continuous rupture, mixed rupture, and segmented rupture. Figures 10A, 11A, and 12A compare the median MMI hazard curves, affected population curves (MMI > 6.5), and building-collapse curves, respectively, for Mzuzu by considering four different rupture models. Figure 10A clearly demonstrates the effect of different earthquake occurrence models on the MMI hazard curves. For instance, at the annual exceedance probability levels of 10−2 to 10−3 (which are typical probability levels referred to in making earthquake risk mitigation decisions), the median MMI hazard values increase by 0.1 to 0.6 MMI units, 0.6 to 1.1 MMI units, and 1.1 to 1.3 MMI units for the continuous, mixed, and segmented rupture models, respectively, with respect to the instrumental catalog model. The differences between the instrumental catalog-based model and the fault-based models highlight the potential impact of including infrequent, large earthquakes in the seismic hazard assessment. In Mzuzu, such differences are greater for the segmented rupture model as both Usisya and Bandawe faults (Figure 4) may rupture in segment more frequently. At the high probability level, the MMI hazard curve for the continuous rupture case is similar to the one for the instrumental catalog-based model because the occurrence of the whole rupture case is rare; it gradually approaches to the hazard curve for the segmented rupture model as the probability level decreases. The MMI hazard curve for the mixed rupture model falls between the continuous rupture case and the segmented rupture case (as expected).
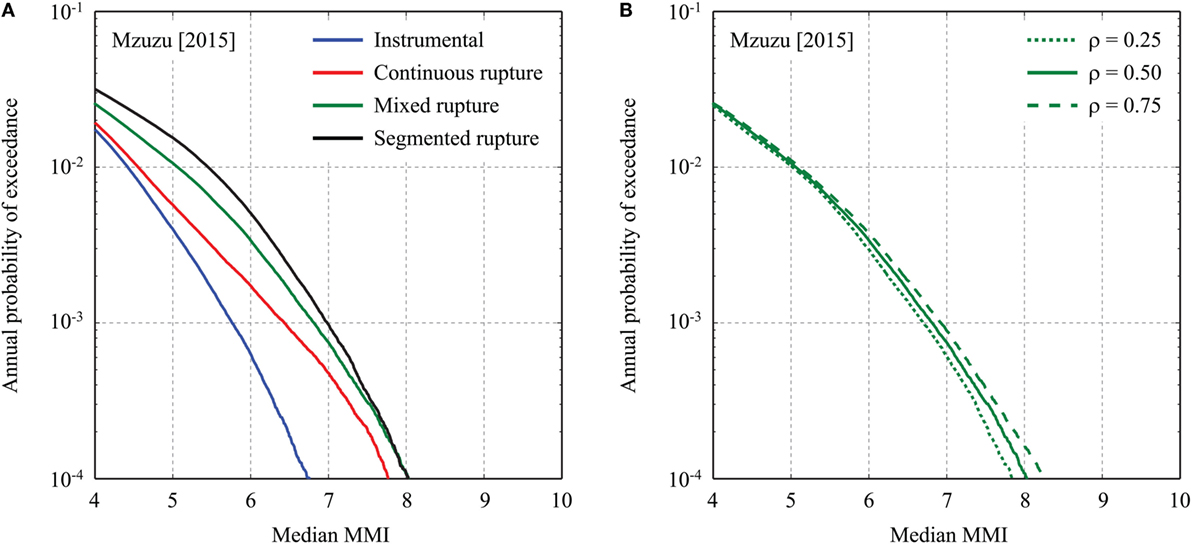
Figure 10. (A) Effects of different earthquake occurrence models on median MMI hazard curves for Mzuzu. (B) Effects of different MMI spatial correlation models (mixed rupture scenario) on median MMI hazard curves for Mzuzu.
Figure 11A compares the affected population curves for MMI > 6.5. The differences among the four cases are significant; for example, the differences at the annual exceedance probability levels of 10−2 to 10−3 can be as large as a factor of 100. As the seismic hazard increases from the instrumental catalog-based case to the fault-based cases, the maximum number of population is reached at rarer probability levels. These results essentially indicate the regional earthquake impact felt by the residents more frequently when the possibility for the large-scale fault rupture is taken into account.
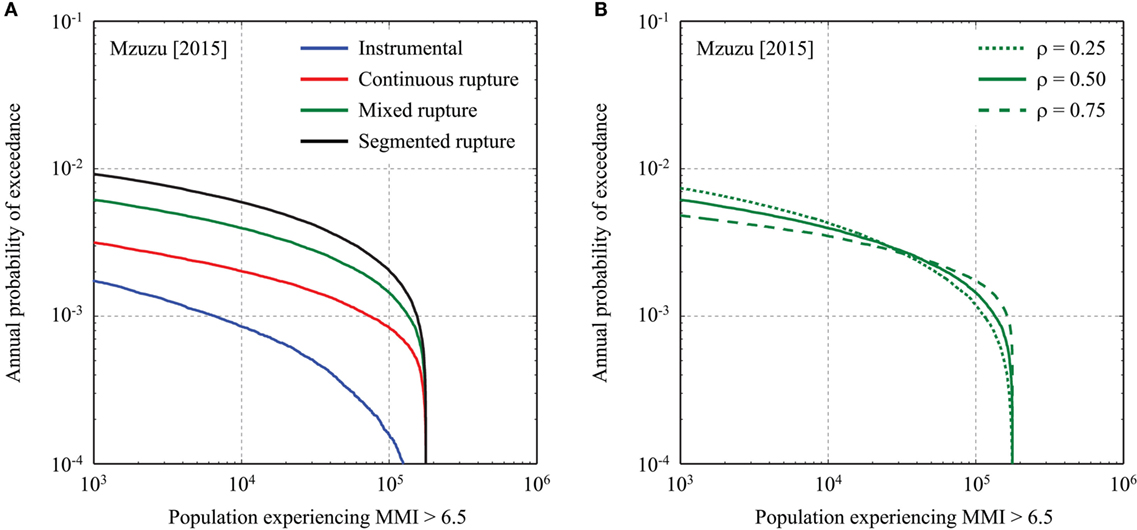
Figure 11. (A) Effects of different earthquake occurrence models on affected population curves (MMI > 6.5) for Mzuzu. (B) Effects of different MMI spatial correlation models (mixed rupture scenario) on affected population curves (MMI > 6.5) for Mzuzu.
Figure 12A shows the effects of the earthquake occurrence models on the collapse risk prediction. The overall trends of the building-collapse curves are similar to those of the median MMI hazard curves (Figure 10A). An important practical aspect of the presented risk results is that, for example, at the annual exceedance probability levels of 10−2 to 10−3, the building-collapse potential for the fault-based models is greater than that for the instrumental catalog-based model by a factor of 2–5. It is also noteworthy that the differences of the collapse risk predictions for the instrumental catalog-based model and the fault-based models tend to increase as the rarer probability level is considered.
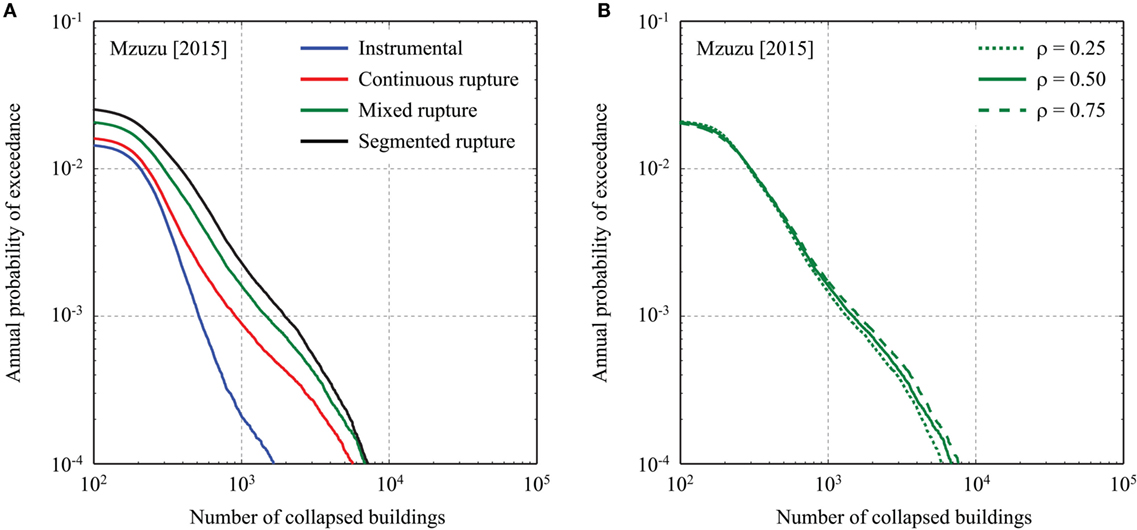
Figure 12. (A) Effects of different earthquake occurrence models on building-collapse curves for Mzuzu. (B) Effects of different MMI spatial correlation models (mixed rupture scenario) on building-collapse curves for Mzuzu.
Another aspect that is worthy of investigating is the effect of correlation of MMI values at exposure cells. Three correlation coefficients, 0.25, 0.5, and 0.75, are considered for such investigations. The results in terms of median MMI hazard curves, affected population curves (MMI > 6.5), and building-collapse curves are shown in Figures 10B, 11B, and 12B, respectively. General trends of the hazard and risk curves for different spatial correlation values are that three curves intersect one another (note: this is visible in Figures 11B and 12B but not in Figure 10B) and that with the increase of the correlation coefficient and with the decrease of the annual exceedance probability level, both hazard and risk metrics become greater, which is consistent with other seismic risk studies for a building portfolio (Goda et al., 2011). These are due to the simultaneous occurrence of correlated more intense macroseismic intensity at building sites, thus the aggregate effects due to the earthquake are increased. Among the three kinds of the results, more remarkable changes are observed for the affected population curves (Figure 11B); the differences can be as large as a factor of 10. Essentially, when the ground motions are more correlated, the increase of the affected populations can happen abruptly. Although the effects of the correlation of MMI values are noticeable, its overall influence is relatively minor compared with the influence due to the earthquake occurrence modeling (e.g., up to 10% differences versus up to 500% differences for the collapse probability curves at the annual exceedance probability levels of 10−2–10−3).
Effects of Exposure Data
Next, the effects of different exposure datasets (i.e., population in year 2010, 2015, and 2020; Figure 3) on the earthquake impact for Mzuzu are examined. The results for the affected population curves and building-collapse curves are displayed in Figure 13 (note: different exposure data do not affect median MMI curves and thus omitted). Essentially, the effects of the increased population result in the shift of the hazard and risk curves toward more severe earthquake consequences. Typically, the differences of the curves for 2010 and 2020 with respect to the curve for 2015 are ±20–25%. It is noteworthy that the increase of the earthquake impact is proportional because the spatial distribution of the local population does not change drastically over the years; in cases of very rapid urbanization where several suburb settlements are created particularly near the active faults, more significant changes to the hazard and risk curves are expected.
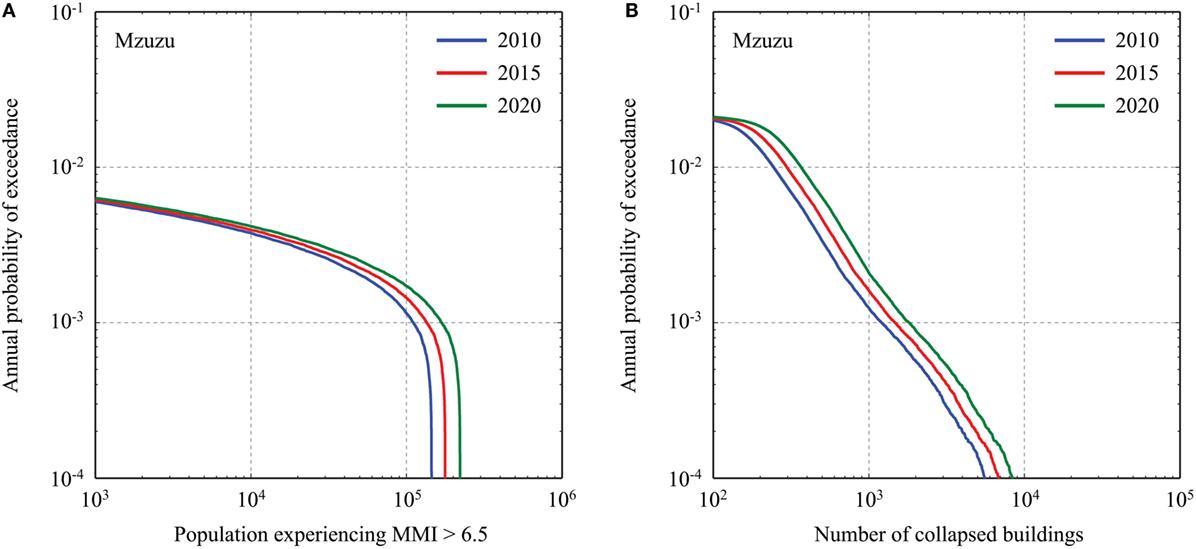
Figure 13. (A) Effects of exposure data (year 2010, 2015, and 2020) on affected population curves (MMI > 6.5) for Mzuzu. (B) Effects of exposure data (year 2010, 2015, and 2020) on building-collapse curves for Mzuzu.
Effects of Seismic Vulnerability Models
The effects of using different seismic vulnerability models (i.e., combinations of the Spence-So, Spence–Foulser-Piggott, and Jaiswal et al. models; Figure 7) on the building-collapse curves for Mzuzu are investigated (note: different vulnerability models affect neither median MMI curves nor affected population curves and thus omitted). In Figure 14A, results based on the three individual models, in comparison with the equal-weight model are presented, whereas in Figure 14B, results based on the combined models consisting of two individual models are shown. The differences of the building-collapse curves shown in Figure 14A are drastic (differences more than a factor of 10 are possible depending on the probability level), highlighting the significant sensitivity of the results to the adopted vulnerability models. When the So-Spence model alone is considered, the risk level for less severe earthquake damage (e.g., number of collapsed buildings less than 1,000) is increased significantly. This is because the weighted collapse rate function of the So-Spence model has a gentle slope and predicts several percent of collapse probability irrespective of MMI values (Figure 7D). This is contrary to the collapse rate functions for the other two vulnerability models, which rapidly increase with MMI values. Consequently, the collapse risk levels for the Spence–Foulser-Piggott and Jaiswal et al. models are relatively low for less severe earthquake damage; however, these models predict devastating earthquake damage consequences for rare cases (resulting in overall collapse rates reaching several tens of percent of the entire building stock). Figure 14B shows similar results but the total effects due to the adopted (combined) vulnerability models are less drastic than those shown in Figure 14A (as expected).
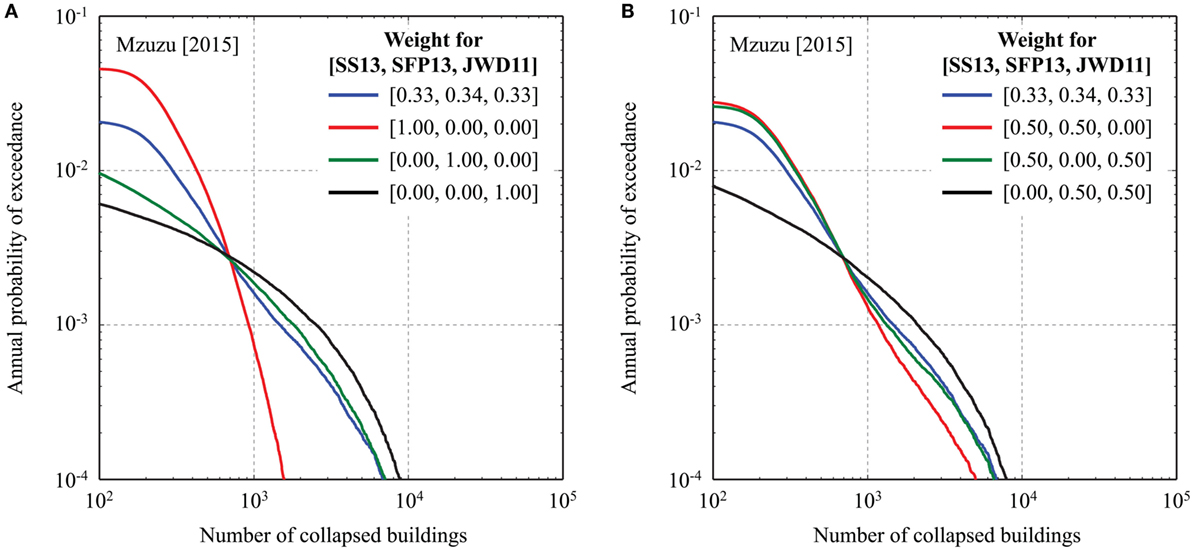
Figure 14. (A) Effects of vulnerability models (equal-weight model versus individual models) on building-collapse curves for Mzuzu. (B) Effects of vulnerability models (equal-weight model versus combined models consisting of two individual models) on building-collapse curves for Mzuzu. In the figure legend, SS13 represents the So-Spence model, SPF13 represents the Spence–Foulser-Piggott model, and JWD11 represents the Jaiswal et al. model.
In addition to the sensitivity results shown in Figure 14, the effects of assigning the 15% of the buildings with unclassified vulnerability (for the base case, D1 class is assumed) to a different class (B or C) are investigated. The final building-collapse curves for the three classifications (i.e., D1, B, or C) are almost identical (i.e., three curves overlap) and, for this reason, the results are not presented in this study. The main reasons for the insignificant influence of the vulnerability class assignment include: (i) collapse prediction models for D1, B, and C are much smaller, by factors of 5–20, than those for A (Figures 7A,B) at MMI levels near 6.5–7.5 (which are the most dominant scenarios for Mzuzu; see Figure 10A) and (ii) the building proportion for the vulnerability class A (80%) is significantly larger than that for the unclassified vulnerability (15%).
In the situations where use of global vulnerability models is inevitable and no suitable models can be identified through retrospective assessment of the past earthquake damage cases (e.g., 2009 Karonga case), it may be prudent to use a composite (weighted) model based on applicable vulnerability models. Nevertheless, it is important to carry out sensitivity analysis related to the choice and weighting of the seismic vulnerability models as the analysis results will provide further insights as to how such extremely low/high risk predictions are derived.
Effects of Site Locations
Finally, the effects of site locations on the hazard and risk analysis results are studied by considering the five settlements (Figure 2). It is noteworthy that the change of site locations alters not only exposure data characteristics but also hazard characteristics (Figure 4). In this subsection, the median MMI hazard curves, affected population curves (MMI > 6.5), and building-collapse curves for the five cities and towns are compared in Figure 15. Because the inclusion/exclusion of the fault-based rupture models has a complex influence at different locations, both instrumental catalog-based model and mixed rupture model are considered.
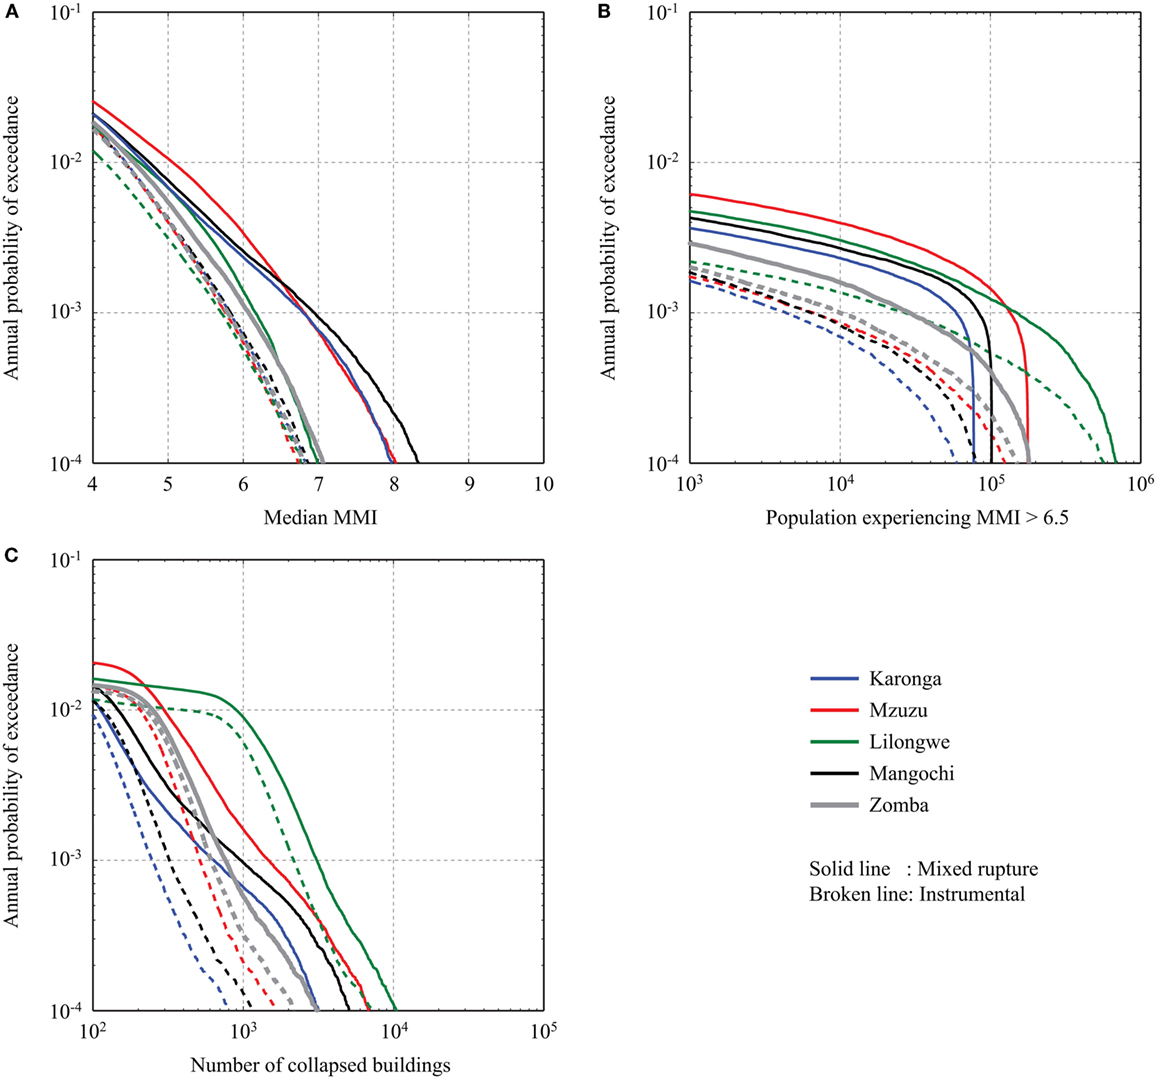
Figure 15. (A) Effects of instrumental catalog-based and mixed rupture models on MMI hazard curves for Karonga, Mzuzu, Lilongwe, Mangochi, and Zomba. (B) Effects of instrumental catalog-based and mixed rupture models on affected population curves (MMI > 6.5) for Karonga, Mzuzu, Lilongwe, Mangochi, and Zomba. (C) Effects of instrumental catalog-based and mixed rupture models on building-collapse curves for Karonga, Mzuzu, Lilongwe, Mangochi, and Zomba.
Figure 15A shows the median MMI hazard curves for the five cities and towns. The differences among the instrumental catalog-based models for the five locations are relatively small (at most 0.3 MMI units). By contrast, the fault-based MMI hazard curves for Karonga, Mzuzu, and Mangochi are significantly greater than those for Lilongwe and Zomba due to the inclusion of the moderate-to-large earthquakes originated from the fault systems (Figure 4). The extent of the seismic hazard levels at these locations is mainly governed by the proximity to the fault systems and their rupture characteristics (i.e., magnitude and recurrence period; Figure 4). A detailed examination of the results for Karonga, Mzuzu, and Mangochi indicates that the seismic hazards for Karonga and Mzuzu are influenced by the continuous rupture of the Livingstone fault and the Bilila-Mtakataka fault, respectively (i.e., no segmentation is considered for these two fault systems), as evidenced by the gradual deviation from the instrumental catalog-based case. On the other hand, for Mzuzu, the seismic hazard is dominated by the segmented rupture case.
Figure 15B shows the affected population curves. The results are more complicated because different population sizes for the five cities and towns affect the saturation levels of the earthquake impact. In this plot, although the overall seismic hazard level for Lilongwe is lower than other locations (differences up to 0.8 MMI units at the annual exceedance probability levels of 10−2 to 10−3; see Figure 15A), the total earthquake impact on the population for Lilongwe is much greater than those for Karonga, Mangochi, and Zomba (differences up to a factor of 2 at the annual exceedance probability levels of 10−2 to 10−3; see Figure 15B). This observation is applicable to both instrumental catalog-based and mixed rupture models. The results highlight the importance of exposure in practical seismic risk management and suggest that the relative seismic risk ranking of the settlements (and thus priority in seismic risk mitigation actions) needs to be determined by taking into account both exposure and hazard characteristics.
Figure 15C shows the comparison of building-collapse curves for the five cities and towns. The overall trends of the collapse risk curves are similar to those of the affected population curves (Figure 15B), although shapes are different. The results confirm the importance of exposure data to the overall earthquake impact in terms of building collapse. Some of the building-collapse curves, such as those for Karonga and Mangochi based on the mixed rupture model, exhibit more complex behavior, e.g., more rapid increase of the collapse risk around the annual exceedance probability levels of 4 × 10⁻² to 10−3. These are due to the changes of the influential fault rupture patterns from more frequent segmented rupture cases to rarer continuous rupture cases.
Conclusion
With more than 60% of Malawi’s population living below the international poverty line of US$1.25 per day, this East African society lacks the resilience to cope with a large-magnitude seismic event. This is mainly due to the high seismic vulnerability of Malawian structures, with a large population of the country living in relatively close proximity to the active Malawi Rift, which can host earthquakes of Mw7.0 or greater. Aiming at enhancing the long-term seismic resilience of Malawi, this study developed the first-generation quantitative seismic risk model for Malawian communities and carried out detailed sensitivity analyses with regard to exposure, hazard, and vulnerability characteristics. The high-resolution population data, regional fault-based seismic hazard model, macroseismic intensity prediction model, and building-collapse prediction models were integrated to evaluate the earthquake impact in terms of affected population experiencing a certain intensity and number of collapsed buildings. The seismic risk model was applied to two types of investigations, a retrospective assessment of the earthquake damage during the 2009 Karonga sequence and the earthquake risk analysis against future major earthquakes for rural and urban settlements in Malawi.
Based on the analysis results, the following conclusions can be drawn:
• The predicted numbers of damaged and collapsed buildings due to the 8th December, 2009 Mw5.9 Karonga earthquake scenario are broadly consistent with the earthquake damage observations. However, the predicted seismic risk estimates have significant variability depending on the adopted seismic vulnerability models. Henceforth, it is not possible to determine which of the candidate vulnerability models, implemented in the developed seismic risk model, is more suitable. Under such circumstances, it may be sensible to consider a composite vulnerability model, rather than a single specific model.
• The sensitivity of the seismic hazard and risk analysis results to the earthquake occurrence modeling has significant impact. In particular, inclusion of fault-based rupture models in the hazard module has a major influence on the median MMI hazard curves, affected population curves, and building-collapse curves for rare, devastating events.
• The seismic vulnerability models (i.e., collapse rate functions) affect the building-collapse risk curves significantly. It is of vital importance to carry out sensitivity analysis related to the choice and weighting of the seismic vulnerability models to gain further insights on derived risk predictions.
• The site locations of interest change both exposure and hazard characteristics of the earthquake impact assessment. The seismic hazard assessment, which is the initial step and is often more focused on in earthquake mitigation studies, only tells us a half of the story. Both exposure and vulnerability assessments are essential to obtain a holistic evaluation of the seismic risk at stake and to decide priority for rational seismic risk mitigation actions.
• Other aspects, such as spatial correlation of macroseismic intensity at different locations and temporal change of the exposure characteristics, have a noticeable influence on the earthquake impact assessment.
It is concluded that Malawi could be at serious risk of building collapse and in turn fatality rates if a large-magnitude event were to strike. The high seismic vulnerability of buildings in Malawi, particularly the high proportion of semi-permanent and traditional structures greatly increases the seismic risk due to their high collapse susceptibility. Significant improvements would have to be made in order to reduce the number of damaged and collapsed buildings. In future studies, it is recommended that this model is further expanded in order to more comprehensively assess the risk posed to the entirety of the country, to realize the model’s full potential. A cost–benefit analysis could then be conducted in order to advise a cost-effective strategy to mitigate future building collapse and reduce fatalities for areas at the most risk, such as assessing the benefits of strengthening and retrofitting existing structures. Finally, the study could be considered to evaluate Malawian building regulations to reduce the seismic risk.
Data Access Statement
No new data were created during this study.
Author Contributions
KG was responsible for carrying out the seismic risk calculations and writing of the manuscript. EG and HS produced the results. JB and MH developed the seismic hazard model.
Conflict of Interest Statement
The authors declare that the research was conducted in the absence of any commercial or financial relationships that could be construed as a potential conflict of interest.
Funding
The work is supported by the Engineering and Physical Sciences Research Council (Global Challenge 620 Research Fund pump-priming grant; EP/P510920/1).
References
Allen, T. I., Wald, D. J., and Worden, C. B. (2012). Intensity attenuation for active crustal regions. J. Seismol. 16, 409–433. doi:10.1007/s10950-012-9278-7
Atkinson, G. M., and Wald, D. J. (2007). “Did you feel it?” intensity data: a surprisingly good measure of earthquake ground motion. Seismol. Res. Lett. 78, 362–368. doi:10.1785/gssrl.78.3.362
Biggs, J., Nissen, E., Craig, T., Jackson, J., and Robinson, D. P. (2010). Breaking up the hanging wall of a rift-border fault: the 2009 Karonga earthquakes, Malawi. Geophys. Res. Lett. 37, L11305. doi:10.1029/2010GL043179
Chapola, L., and Gondwe, J. (2016). Urban development in earthquake prone areas: lessons from 1989 Salima and 2009 Karonga earthquakes. J. Catholic Univ. Malawi 2, 15–26.
Contreras, J., Anders, M. H., and Scholz, C. H. (2000). Growth of a normal fault system: observations from the Lake Malawi basin of the east African rift. J. Struct. Geol. 22, 159–168. doi:10.1016/S0191-8141(99)00157-1
Cua, G., Wald, D. J., Allen, T. I., Garcia, D., Worden, C. B., Lin, K., et al. (2010). “Best Practices” for Using Macroseismic Intensity and Ground Motion-Intensity Conversion Equations for Hazard and Loss Models in GEM1. Pavia, Italy: GEM Foundation, 57.
Earle, P. S., Wald, D. J., Jaiswal, K. S., Allen, T. I., Marano, K. D., Hotovec, A. J., et al. (2009). Prompt Assessment of Global Earthquakes for Response (PAGER): A System for Rapidly Determining the Impact of Global Earthquakes Worldwide (Open-File Report 2009-1131). Reston, VA: US Geological Survey, 15.
Flannery, J. W., and Rosendahl, B. R. (1990). The seismic stratigraphy of Lake Malawi, Africa: implications for interpreting geological processes in lacustrine rifts. J. Afr. Earth Sci. 10, 519–548. doi:10.1016/0899-5362(90)90104-M
Goda, K. (2011). Interevent variability of spatial correlation of peak ground motions and response spectra. Bull. Seismol. Soc. Am. 101, 2522–2531. doi:10.1785/0120110092
Goda, K., Atkinson, G. M., and Hong, H. P. (2011). Seismic loss estimation of wood-frame houses in south-western British Columbia. Struct. Saf. 33, 123–135. doi:10.1016/j.strusafe.2010.11.001
Grünthal, G. (ed.) (1998). European Macroseismic Scale 1998 (EMS-98). Luxembourg: Centre Européen de Géodynamique et de Séismologie, 99.
Gupta, H. K., and Malomo, S. (1995). The Malawi earthquake of March 10, 1989: report of field survey. Seismol. Res. Lett. 66, 20–27. doi:10.1785/gssrl.66.1.20
Gutenberg, B., and Richter, C. F. (1954). Seismicity of the Earth and Associated Phenomena. Princeton, NJ: Princeton University Press.
Hodge, M., Biggs, J., Goda, K., and Aspinall, W. P. (2015). Assessing infrequent large earthquakes using geomorphology and geodesy: the Malawi Rift. Nat. Haz. 76, 1781–1806. doi:10.1007/s11069-014-1572-y
Hough, S. E. (2014). Earthquake intensity distributions: a new view. Bull. Earthq. Eng. 12, 135–155. doi:10.1007/s10518-013-9573-x
Jackson, J., and Blenkinsop, T. (1997). The Bilila-Mtakataka fault in Malawi: an active, 100-km long, normal fault segment in thick seismogenic crust. Tectonics 16, 137–150. doi:10.1029/96TC02494
Jaiswal, K., Wald, D., and D’Ayala, D. (2011). Developing empirical collapse fragility functions for global building types. Earthq. Spectra 27, 775–795. doi:10.1193/1.3606398
Jaiswal, K. S., and Wald, D. J. (2008). Creating a Global Building Inventory for Earthquake Loss Assessment and Risk Management (Open-File Report 2008-1160). Reston, VA: US Geological Survey, 103.
Kreemer, C., Holt, W. E., and Haines, A. J. (2003). An integrated global model of present-day plate motions and plate boundary deformation. Geophys. J. Intl. 154, 8–34. doi:10.1046/j.1365-246X.2003.01917.x
Linard, C., Gilbert, M., Snow, R. W., Noor, A. M., and Tatem, A. J. (2012). Population distribution, settlement patterns and accessibility across Africa in 2010. PLoS ONE 7:e31743. doi:10.1371/journal.pone.0031743
Linard, C., Gilbert, M., and Tatem, A. J. (2011). Assesing the use of global land cover data for guiding large area population distribution modelling. GeoJournal 76, 525–538. doi:10.1007/s10708-010-9364-8
McGuire, R. K. (2004). Seismic Hazard and Risk Analysis. Oakland, CA: Earthquake Engineering Research Institute, 240.
Midzi, V., Hlatywayo, D. J., Chapola, L. S., Kebede, F., Atakan, K., Lombe, D. K., et al. (1999). Seismic hazard assessment in Eastern and Southern Africa. Ann. Geophys. 42, 1067–1083.
Musson, R. M. W., Grünthal, G., and Stucchi, M. (2010). The comparison of macroseismic intensity scales. J. Seismol. 14, 413–428. doi:10.1007/s10950-009-9172-0
National Statistical Office of Malawi. (2008). Population and Housing Census 2008. Zomba, Malawi: National Statistical Office.
So, E., and Spence, R. (2013). Estimating shaking-induced casualties and building damage for global earthquake events: a proposed modelling approach. Bull. Earthq. Eng. 11, 347–363. doi:10.1007/s10518-012-9373-8
Spence, R., and Foulser-Piggott, R. (2013). “The use of macroseismic intensity as a basis for empirical vulnerability assessment,” in Proc. Vienna Congress on Recent Activities in Earthq. Eng. Struct. Dyn (Vienna, Austria), aer374.
Stamps, D. S., Calais, E., Saria, E., Hartnady, C., Nocquet, J. M., Ebinger, C. J., et al. (2008). A kinematic model for the East African rift. Geophys. Res. Lett. 35, L05304. doi:10.1029/2007GL032781
UN-HABITAT, United Nations High Commissioner for Refugees (UNHCR), and International Federation of Red Cross (IFRC). (2012). Shelter Projects 2010: Malawi 2009 Earthquake. Available at: http://www.sheltercasestudies.org/shelterprojects2010/A17-Malawi-2010.pdf
United Nations Resident Coordinator. (2009). Malawi: Karonga Earthquake Situation Report No. 3. Available at: http://reliefweb.int/disaster/eq-2009-000257-mwi
United States Geological Survey. (2009). Significant Earthquakes of the World. Available at: http://earthquake.usgs.gov/earthquakes/browse/significant.php?year=2009
Wald, D. J., and Allen, T. I. (2007). Topographic slope as a proxy for seismic site conditions and amplification. Bull. Seism. Soc. Am. 97, 1379–1395. doi:10.1785/0120060267
Wald, D. J., Quitoriano, V., Heaton, T. H., and Kanamori, H. (1999). Relationships between peak ground acceleration, peak ground velocity, and modified Mercalli intensity in California. Earthq. Spectra 15, 557–564. doi:10.1193/1.1586058
Wheeler, W. H., and Karson, J. A. (1989). Structure and kinematics of the Livingstone Mountains border fault zone, Nyasa (Malawi) Rift, southwestern Tanzania. J. Afr. Earth Sci. 8, 393–413. doi:10.1016/S0899-5362(89)80034-X
World Housing Encyclopedia. (2002). World Housing Encyclopedia Database for Malawi. Available at: http://db.world-housing.net/list
WorldPop. (2014). Malawi Population Map Metadata Report. Available at: http://www.worldpop.org.uk
Keywords: seismic risk, long-term risk mitigation, exposure, population, large-magnitude earthquake, seismic vulnerability, sensitivity analysis
Citation: Goda K, Gibson ED, Smith HR, Biggs J and Hodge M (2016) Seismic Risk Assessment of Urban and Rural Settlements around Lake Malawi. Front. Built Environ. 2:30. doi: 10.3389/fbuil.2016.00030
Received: 26 September 2016; Accepted: 03 November 2016;
Published: 16 November 2016
Edited by:
Michele Palermo, University of Bologna, ItalyReviewed by:
Maria Rota, European Centre for Training and Research in Earthquake Engineering, ItalyMarijana Hadzima-Nyarko, Faculty of Civil Engineering in Osijek, Croatia
Copyright: © 2016 Goda, Gibson, Smith, Biggs and Hodge. This is an open-access article distributed under the terms of the Creative Commons Attribution License (CC BY). The use, distribution or reproduction in other forums is permitted, provided the original author(s) or licensor are credited and that the original publication in this journal is cited, in accordance with accepted academic practice. No use, distribution or reproduction is permitted which does not comply with these terms.
*Correspondence: Katsuichiro Goda, katsu.goda@bristol.ac.uk