O-antigen and virulence profiling of Shiga toxin-producing Escherichia coli by a rapid and cost–effective DNA microarray colorimetric method
- Produce Safety and Microbiology Research Unit, Western Regional Research Center, U.S. Department of Agriculture/Agricultural Research Service, Albany, CA, USA
Shiga toxin-producing Escherichia coli (STEC) is a leading cause of foodborne illness worldwide. The present study developed the use of DNA microarrays with the ampliPHOX colorimetric method to rapidly detect and genotype STEC strains. A low-density 30-mer oligonucleotide DNA microarray was designed to target O-antigen gene clusters of 11 E. coli serogroups (O26, O45, O91, O103, O104, O111, O113, O121, O128, O145, and O157) that have been associated with the majority of STEC infections. In addition, the DNA microarray targeted 11 virulence genes, encoding adhesins, cytotoxins, proteases, and receptor proteins, which have been implicated in conferring increased ability to cause disease for STEC. Results from the validation experiments demonstrated that this microarray-based colorimetric method allowed for a rapid and accurate genotyping of STEC reference strains from environmental and clinical sources and from distinct geographical locations. Positive hybridization signals were detected only for probes targeting serotype and virulence genes known to be present in the STEC reference strains. Quantification analysis indicated that the mean pixel intensities of the signal for probes targeting O-antigen or virulence genes were at least three times higher when compared to the background. Furthermore, this microarray-based colorimetric method was then employed to genotype a group of E. coli isolates from watershed sediment and animal fecal samples that were collected from an important region for leafy-vegetable production in the central coast of California. The results indicated an accurate identification of O-type and virulence genes in the tested isolates and confirmed that the ampliPHOX colorimetric method with low-density DNA microarrays enabled a fast assessment of the virulence potential of STEC using low-cost reagents and instrumentation.
Introduction
Shiga toxin-producing Escherichia coli (STEC) is a food- and water-borne enteric pathogen known to cause human gastrointestinal illnesses with diverse clinical manifestations, ranging from diarrhea, hemorrhagic colitis, and life-threatening hemolytic uremic syndrome (HUS; Rangel et al., 2005; Gyles, 2007). The varying disease severity in humans has been associated with more than 100 serotypes of STEC (Johnson et al., 1996; Gould et al., 2009; Mathusa et al., 2010). In particular, E. coli O157:H7 is the STEC most-commonly reported in the United States (Brooks et al., 2005; Hoefer et al., 2011), and more than 20 outbreaks due to O157:H7 contamination, occurring between 1995 and 2008, were associated with consumption of produce items that were grown in or near the Salinas Valley of California (Mandrell, 2011). Although the O157 serogroup has been associated frequently with hemorrhagic colitis and HUS (Karmali, 1989; Karmali et al., 2003), the reporting of non-O157 infections by public health laboratories has increased considerably in recent years (Brooks et al., 2005; Gould et al., 2009; Hoefer et al., 2011; Stigi et al., 2012). Epidemiological studies have indicated that six non-O157 serogroups, O26, O45, O103, O111, O121, and O145, have been associated with outbreaks and severe disease in the United States (Johnson et al., 1996; Brooks et al., 2005). Additionally, STECs of serogroups, O91, O104, O113, and O128 have been reported to be significant causes of human infections worldwide (Brooks et al., 2005; Bettelheim, 2007; Gyles, 2007; Mathusa et al., 2010). These findings have led to the proposal that certain non-O157 STEC strains are potentially as virulent as O157:H7 strains (Bettelheim, 2007; Coombes et al., 2011).
The onset of life-threatening disease symptoms caused by STEC has been associated with the production of Shiga toxins (Stx), which are considered the primary virulence determinant in STEC (Karmali et al., 1983; Karmali, 1989). However, epidemiological studies revealed that not all STEC strains that produce Stx are clinically significant. The observed difference in virulence among distinct serotypes has been ascribed to genes encoding virulence factors other than Stx and has been linked to genes on pathogenicity islands, such as the locus for enterocyte and effacement (LEE) and the non-LEE (Bettelheim, 2007; Bolton, 2011; Coombes et al., 2011). In addition to these genomic regions, other chromosomal and plasmid-borne virulence genes, encoding adhesins, cytotoxins, proteases, and receptor proteins, are proposed to also contribute to STEC pathogenesis by allowing these bacterial pathogens to attach to and colonize the human epithelium. Screening for these virulence genes in STEC isolates would facilitate an expanded characterization through the identification of risk factors that could lead potentially to sporadic- and outbreak-related human illness. Thus, the development of rapid and cost–effective genotyping tools is imperative for determining the genetic composition of STEC isolates that may pose a threat to food safety and human health.
In contrast to established culturing methods, which only assess a small number of markers, the use of DNA microarrays as a genotyping method enables the examination of multiple gene targets in a single assay (Call, 2005; Uttamchandani et al., 2009). However, development of sensitive and rapid procedures with cost–effective instrumentation has been challenging with current DNA microarray platforms. Fluorescent microarray methods are commonly used procedures but can be inconsistent and highly variable. These methods also utilize expensive and non-portable scanners for data acquisition and analysis (Call, 2005; Kuck and Taylor, 2008). Thus, improvements in the cost–effectiveness and reliability of procedures are required for routine pathogen surveillance. To implement a simpler, rapid, and inexpensive method for identifying and characterizing pathogenic STEC strains, the present study developed the use of the ampliPHOX colorimetric method, based on light-initiated signal amplification through polymerization (Kuck and Taylor, 2008; Sikes et al., 2008), with a low-density microarray to simultaneously detect multiple STEC serotypes and virulence genes. This microarray-based genotyping method was employed to characterize a collection of STECs, recovered from environmental and clinical sources and from distinct geographical locations.
Materials and Methods
Bacterial Strains and Growth Conditions
The characteristics and sources of the STEC reference strains that were used in this study are described in Table 1. For the isolation of STEC isolates from environmental sources, cloacal bird swabs or 10 g samples of watershed sediment/animal feces were subjected to a non-selective enrichment step in 50 or 90 ml of tryptic soy broth (Beckton Dickinson, Sparks, MD, USA), respectively, at 25°C for 2 h, 42°C for 8 h with shaking, and 4°C until the following morning (Cooley et al., submitted). The enrichments were further screened for stx1 and stx2 by real-time PCR, as in previous studies (Cooley et al., 2007). STEC isolates were obtained after plating samples from positive enrichments on Rainbow O157 agar (Biolog, Inc., Hayward, CA, USA) containing 20 μg/ml novobiocin and 0.8 μg/ml potassium tellurite solution (Sigma-Aldrich, St. Louis, MO, USA; NT-Rainbow) or on CHROMagar O157 media (DRG International, Mountainside, NJ, USA) after immunomagnetic separation with Dynabeads® anti-E. coli O157 (Invitrogen, Carlsbad, CA, USA) as reported previously (Cooley et al., 2007). Suspect colonies were selected from NT-Rainbow or CHROMagar plates based on colony colors and morphologies, as recommended by the manufacturer’s product insert. Bacterial cultures were propagated on Luria–Bertani (LB) agar (Difco, Detroit, MI, USA).
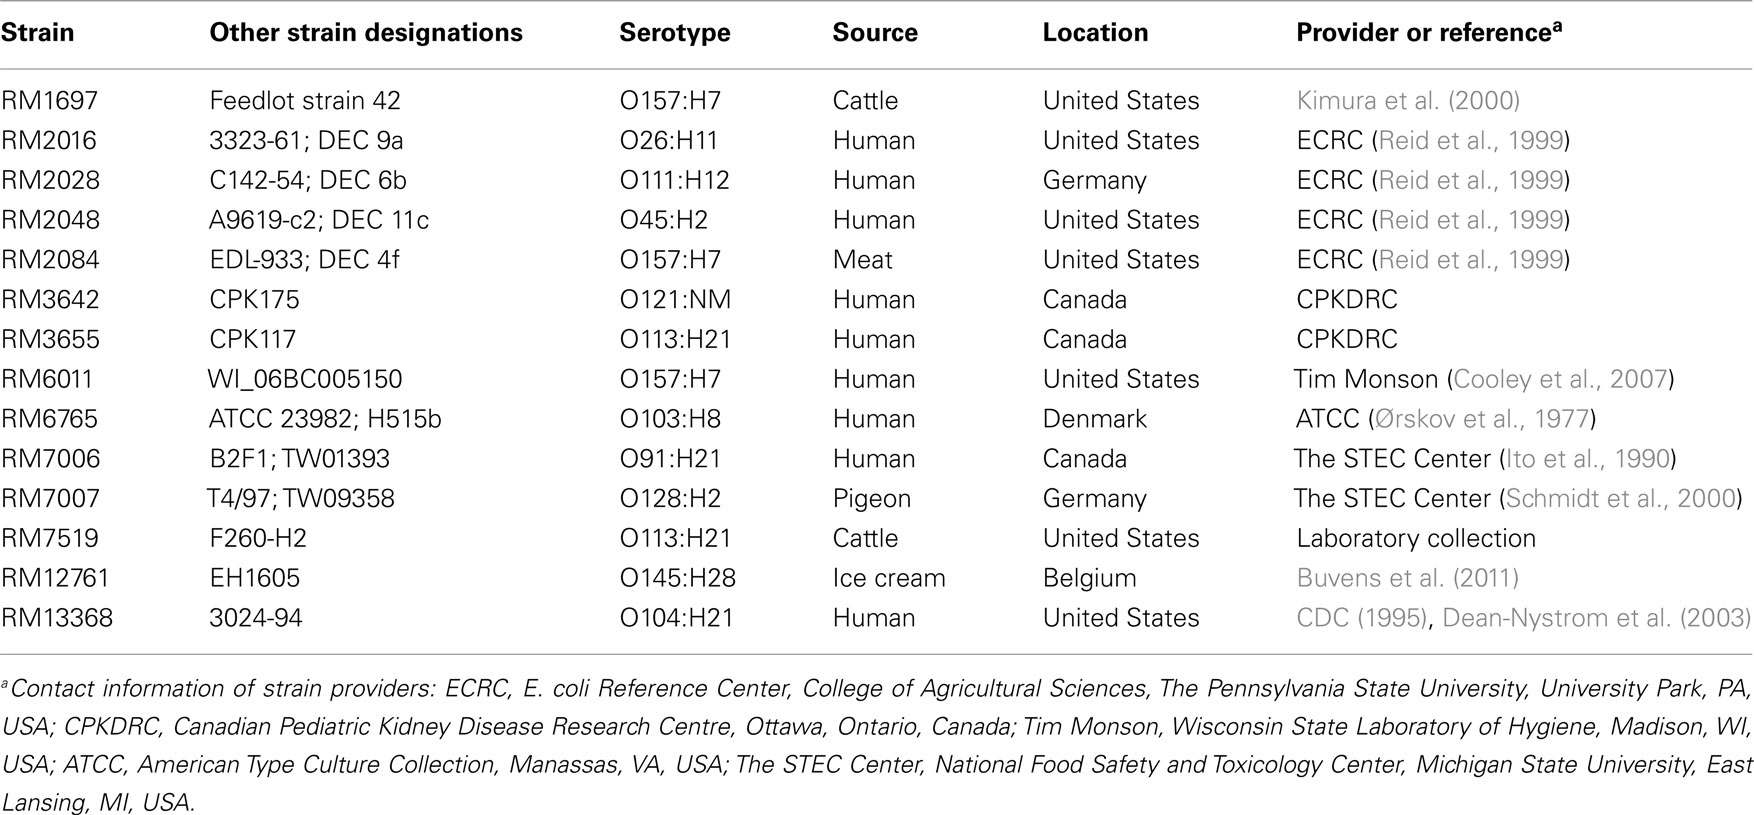
Table 1. Shiga toxin-producing Escherichia coli reference strains used in this study.
Construction of the DNA Microarray
To simultaneously evaluate multiple virulence determinants and serotypes of STEC strains, a 30-mer DNA oligonucleotide microarray was constructed. The serotype-specific probes were designed to target either wzx or wzy genes in the O-antigen gene clusters of 11 serogroups and to target the flagellin H7 antigen (fliC; Table 2). The virulence-specific probes targeted genes encoding Stx (stx1 and stx2), intimin (eae), non-enterocyte effacement effectors (nleA and ent/espL2), extracellular serine protease (espP), catalase peroxidase (katP), autoagglutinating adhesin (saa), subtilase cytotoxin (subA), enterohemolysin (ehxA), and perosamine synthetase (per; Wang et al., 2003; Bettelheim, 2007; Bolton, 2011; Quiñones et al., 2011; Table 2). The gadB gene, encoding glutamate decarboxylase (Smith et al., 1992), was included as a positive control to confirm that the DNA tested was derived from E. coli (Table 2). The probes were designed using PRIMER3 software (Rozen and Skaletsky, 2000), were purchased from Eurofins MWG Operon (Huntsville, AL, USA) with a 5′-amino-C6 modification for covalent binding to the slide surface, and were spotted in duplicate at a final concentration of 50 μM on ArrayIt® SuperEpoxy 2 microarray slides (Arrayit Corporation, Sunnyvale, CA, USA). As a positive control for the ampliPHOX reaction, a synthetic, 24-mer oligonucleotide probe with a 5′-amino-C6 and 3′-biotin modification (InDevR, Inc., Boulder, CO, USA) was spotted at a final concentration of 500 nM; this biotinylated control oligonucleotide does not have any sequence homology to any E coli genes. The microarrays were manufactured with an approximate spot diameter size of 200 μm and a center-to-center spacing of 700 μm (Arrayit Corporation). After printing, an adhesive microarray well (9 mm diameter, InDevR, Inc.) was placed in the center of the printed array, and the microarray slides were stored in a desiccator until further use.
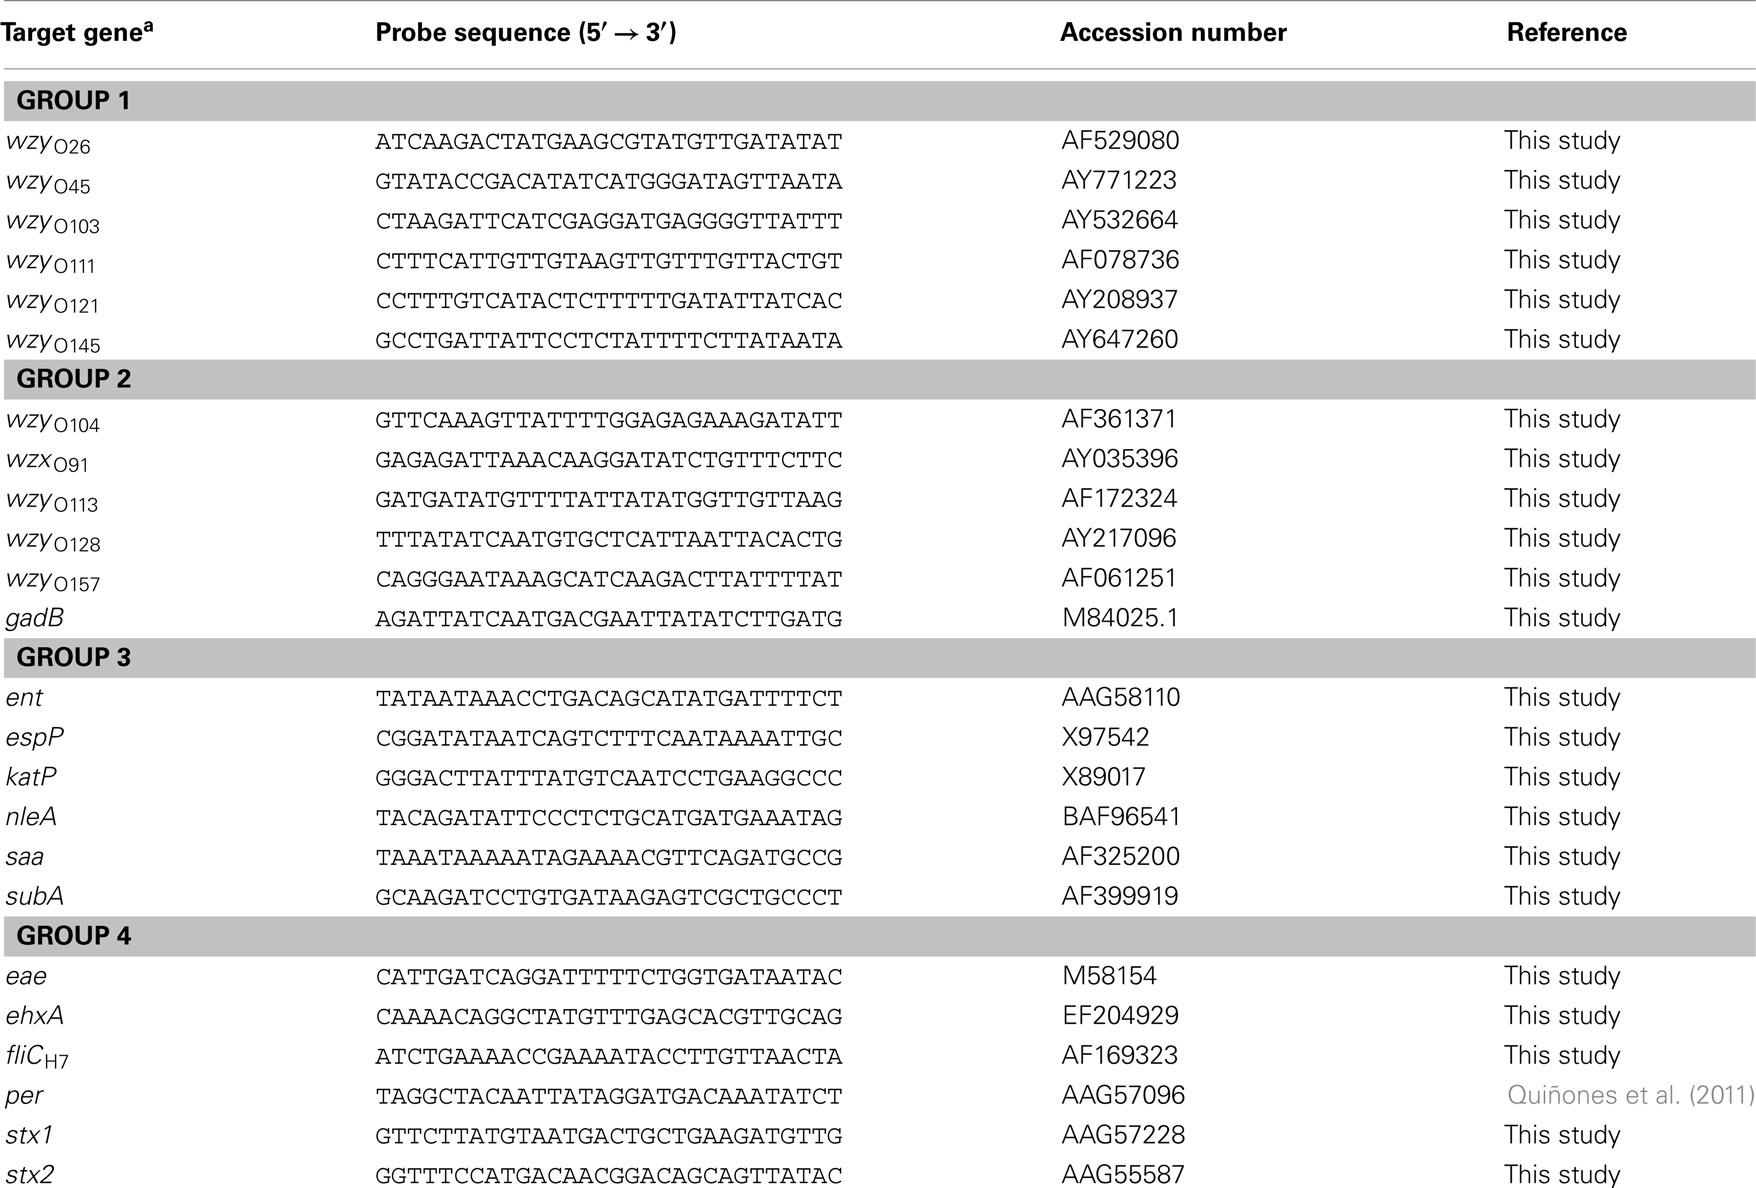
Table 2. List of DNA oligonucleotides probes used in this study for microarray construction.
Polymerase Chain Reaction
The detection of serotyping and virulence genes was achieved by performing a multiplex PCR amplification of biotinylated fragments, ranging in size between 154 and 342 base pairs (Table 3). PCR primers were purchased from Eurofins MWG Operon (Huntsville, AL, USA) with a 5′-phosphorylated modification for the forward primers and a 5′-biotin modification for the reverse primers. The target screen was divided into four groups, and each multiplex PCR reaction amplified six different targets (Table 3). As template for the PCR reaction, bacterial cultures of the reference strains and environmental isolates were grown aerobically in LB broth (Difco) for 24 h with constant shaking (200 rpm) at 37°C, and 100 μl aliquots of the bacterial cultures were collected by centrifugation at 2000 × g for 5 min. Cell pellets were resuspended in 100 μl of HyPure™ molecular biology-grade water (HyClone Laboratories, Inc., Logan, UT, USA) and incubated at 95°C for 20 min. The lysates were centrifuged at 2000 × g for 5 min, and the supernatants were collected and frozen until further use. For each multiplex group (Table 3), the PCR amplification was performed in a 50-μl reaction mixture, containing 3 μl of bacterial crude lysate, 25 μl of 2× GoTaq® Colorless Master Mix (Promega Corporation, Madison, WI, USA), and 5 μl of 10× multiplex group primer mix, as shown in Table 2. The reaction mixtures were placed in a Dyad Peltier Thermal Cycler (Bio-Rad Laboratories, Hercules, CA, USA) with the following settings: 5 min at 94°C, followed by 30 cycles of 45 s at 94°C, 1 min at 60°C (group 1) or 1 min at 55°C (groups 2–4), 1 min at 72°C, and a final extension time of 7 min at 72°C. Identification of serotype and virulence genes in the E. coli isolates was confirmed by a single PCR assay, and each reaction consisted of 12.5 μl of 2× GoTaq® Green Master Mix (Promega Corporation), 0.5 μM of each primer (Table 3), and 3 μl of the bacterial crude lysate in a total volume of 25 μl. Amplified products were analyzed in 2% agarose gels containing 0.04 μl/ml GelRed Nucleic Acid Stain (Phenix Research, Candler, NC, USA).
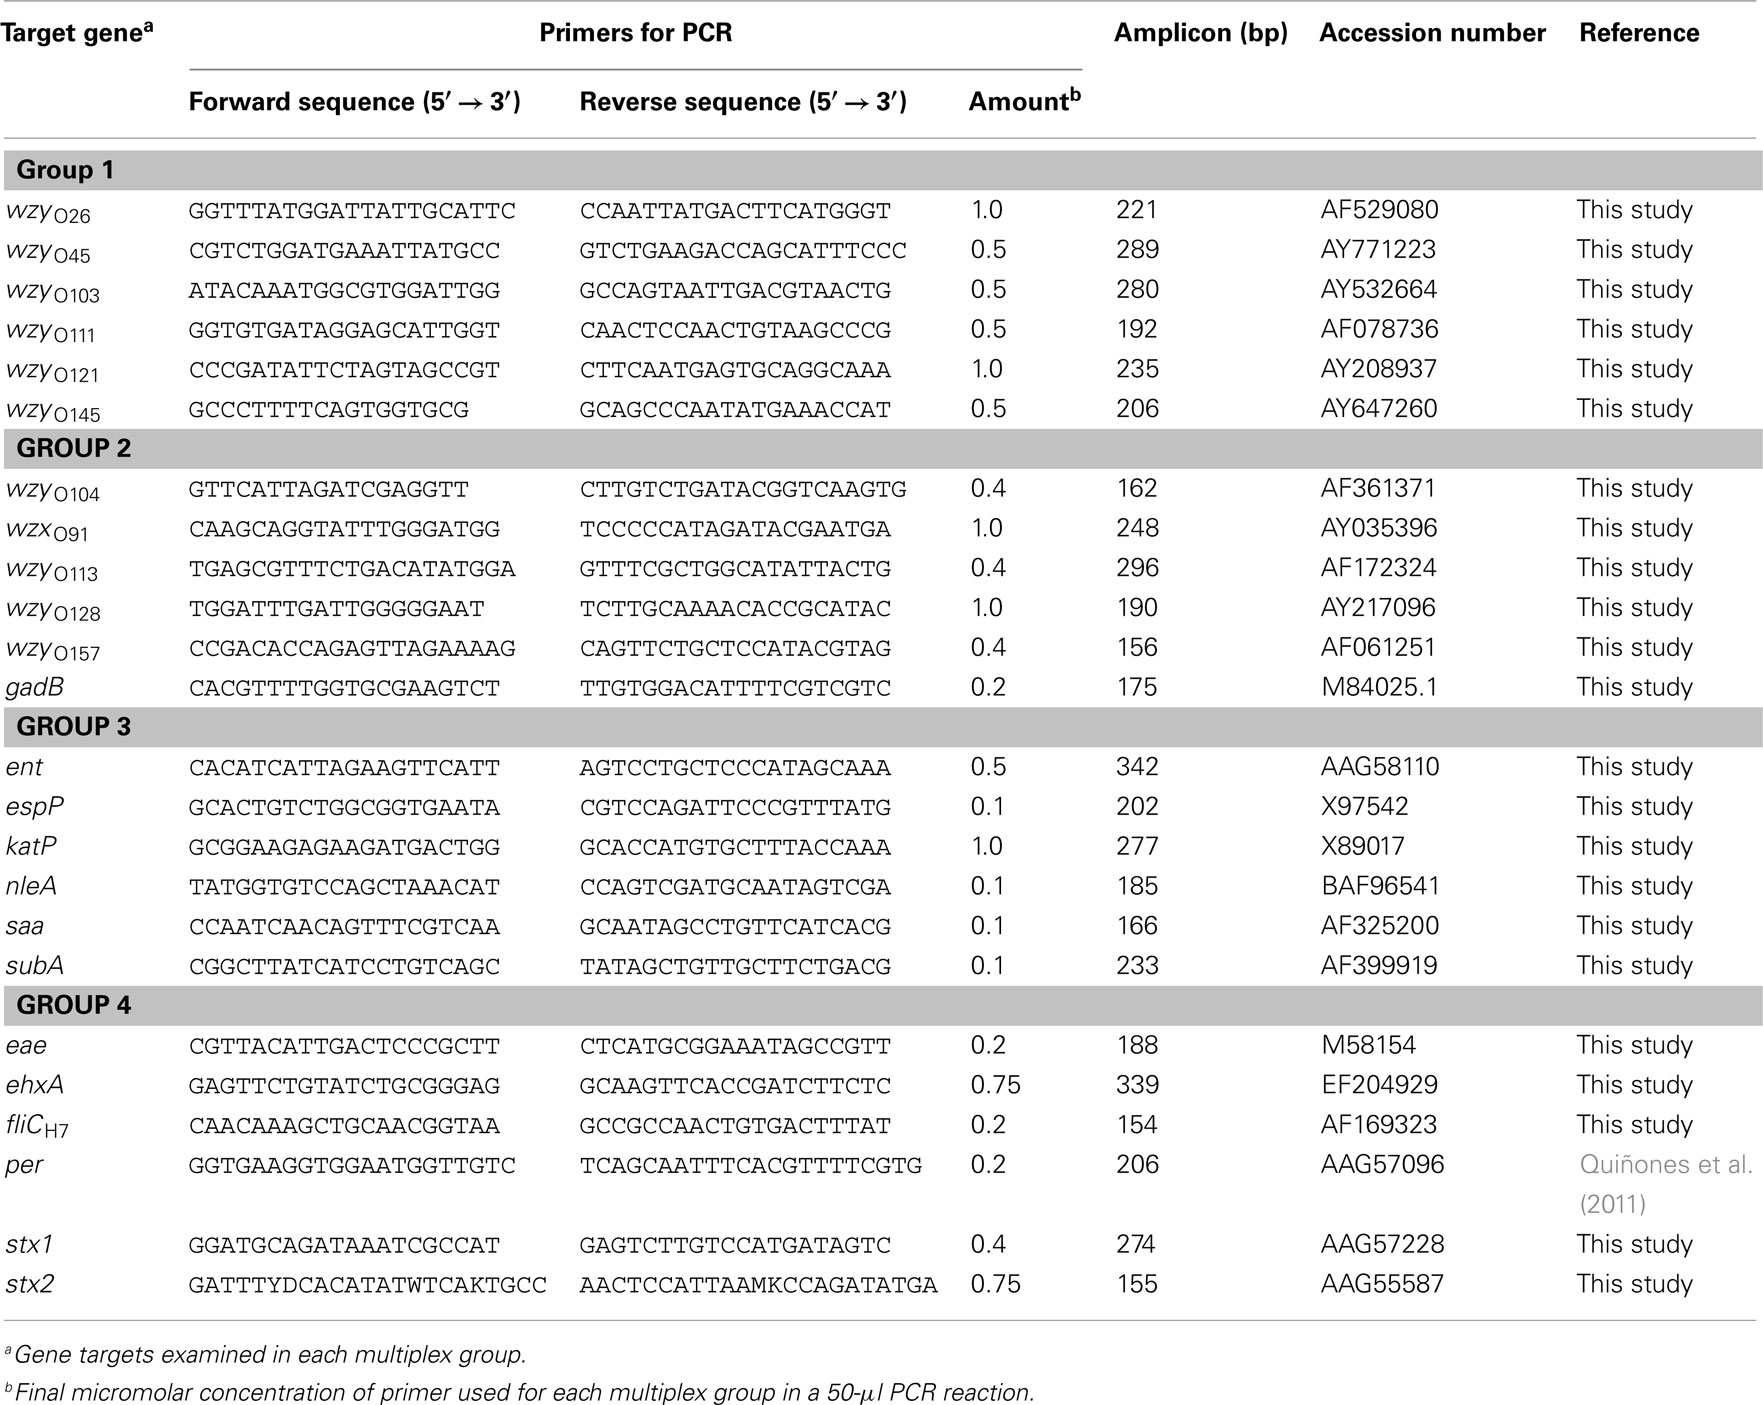
Table 3. List of DNA oligonucleotides used in this study for multiplex PCR amplification of biotinylated fragments.
Microarray Hybridization
For each hybridization reaction, 45 μl of PCR amplicons were purified by using the MinElute® PCR purification kit (Qiagen, Valencia, CA, USA). To achieve a rapid microarray hybridization (Boissinot et al., 2007), single stranded DNA targets were produced after a lambda exonuclease digestion of the PCR-amplified targets, consisting of 10 μl of the eluate, 10 U of lambda exonuclease and 1× lambda exonuclease reaction buffer (Epicenter Biotechnologies, Madison, WI, USA) in a final volume of 23 μl for 15 min at 37°C, followed by addition of 23 μl of 2× Hybridization Buffer (InDevR, Inc.). The hybridization mixture was applied to each microarray, and the slides were incubated in a humidified chamber (InDevR, Inc.) for 1 h at room temperature. Following hybridization, the slides were transferred to a slide drying tray (Evergreen Scientific, Los Angeles, CA, USA) and were rinsed with Microarray Wash Buffers A thru D (InDevR, Inc.) in the following order: wash Buffer D for 5 s, Wash Buffer A for 1 min, Wash Buffer D for 5 s, Wash Buffer B for 5 min, and Wash Buffer C for 5 min. The slides were then dried by centrifugation at 200 × g for 2 min prior to labeling.
Microarray Labeling, Signal Amplification, and Analysis
The hybridized microarrays were labeled after incubation with 40 μl of a streptavidin-conjugated ampliTAG™ labeling solution (InDevR, Inc.) for 5 min at room temperature in a dark humidity chamber, and immediately after labeling, microarrays were rinsed with Wash Buffer D for 5 s, Wash Buffer C for 5 min, distilled water for 5 min, and then dried by centrifugation at 200 × g for 2 min. Positive hybridization signals on each microarray were detected by incubation with 40 μl ampliPHY™ solution (InDevR, Inc.), followed by photoactivation for approximately 1–2 min with the ampliPHOX Reader™ and the associated ampliVIEW™ software 2.0 (InDevR, Inc.), as recommended by the manufacturer. Polymer formation was visualized after a 1-min staining with ampliRED™ solution. Color digital images of the stained arrays were acquired with the ampliPHOX Reader, and for each spot, quantification of signal and background mean pixel intensities were determined with the ampliVIEW software.
Results
A Rapid and Inexpensive Colorimetric Microarray Method for Genotyping STEC
To implement using a rapid and cost–effective method to detect a selected set of genes in STEC isolates, recovered from an important food production region in the central coast of California, the present study explored an alternative procedure for genotyping STEC using DNA microarrays. This novel and innovative colorimetric method is based on light-initiated signal amplification through polymerization (Kuck and Taylor, 2008; Sikes et al., 2008). Instead of using a fluorophore, a streptavidin-conjugated photoinitiator specifically binds to biotin-labeled amplified targets, hybridized to oligonucleotide probes on the microarray (Figure 1). After a short light exposure, a colorless polymer forms where the probe and target sequences hybridized exclusively on the microarray. Polymer formation is easily visualized after a short staining step (Figure 1). The process of photopolymerization, also referred to as ampliPHOX colorimetric detection method, replaces expensive dyes and scanners required for fluorescent-based detection with microarrays (Kuck and Taylor, 2008; Moulton et al., 2011).
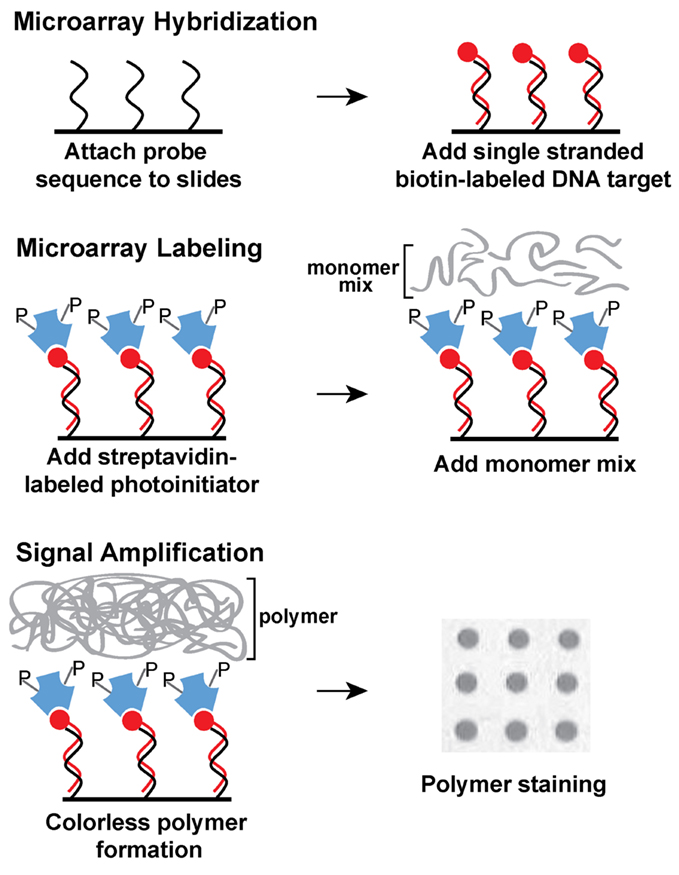
Figure 1. Schematic diagram of ampliPHOX colorimetric method with DNA microarrays. First, DNA microarrays are hybridized with DNA target labeled with biotin (red circles). Second, the microarray is labeled with a photoinitiator (letter P) that is conjugated to streptavidin (blue polygons). Third, a short light-initiated polymerization reaction results in a colorless polymer localized exclusively where the probe and target sequences hybridized on the microarray. Polymer formation is visualized after a quick staining step.
Specificity of STEC Identification
As a proof-of-principle method for routine pathogen surveillance, a low-density microarray was designed to target relevant serotypes and virulence genes, associated with pathogenic STEC. To validate the specificity of using DNA microarrays with the ampliPHOX colorimetric method, several STEC reference strains, recovered from environmental and clinical samples with different genotypes, were examined (Table 1). The results of the validation experiments of group 1 and group 2 probes indicated this microarray method was accurate in detecting the O-antigen types of the STEC reference strains (Figure 2). Polymer formation was observed exclusively where the probe sequences were spotted on the microarrays, and the patterns of photopolymerization correlated with the O-type of the reference strains. For example, analysis of the O26 strain RM2016 resulted in polymer formation exclusively where O26 wzy gene probes were spotted on the microarray. Moreover, analysis of group 2 probes resulted in the accurate O-antigen identification in the reference strains as well as the gadB gene, included as a positive control for detecting all E. coli isolates (Figure 2).
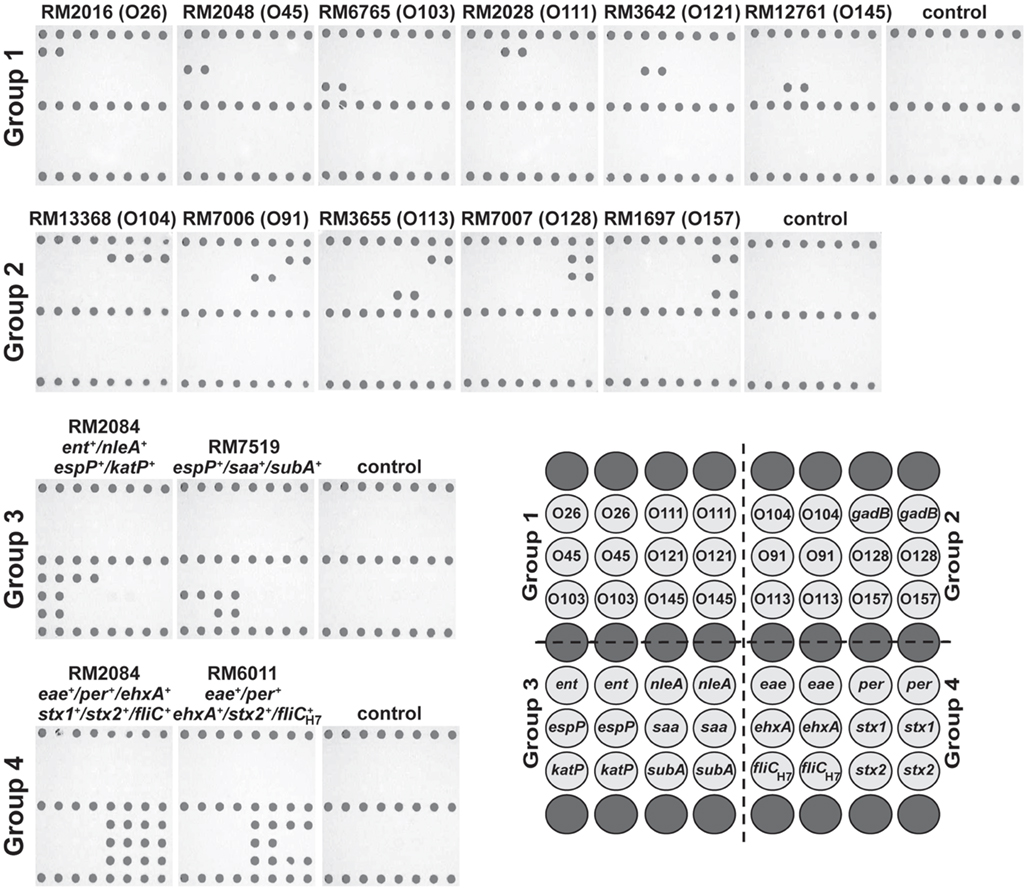
Figure 2. Genotyping Shiga toxin-producing Escherichia coli (STEC) with low-density DNA microarrays and the ampliPHOX colorimetric method. STEC reference strains from clinical or environmental sources with different genotypes (Table 1) were analyzed by 30-mer oligonucleotide DNA microarrays and the ampliPHOX colorimetric method. The panels, shown under strain designations, illustrate polymer formation on spotted probes for microarrays hybridized with amplification reactions testing a particular STEC reference strain or controls lacking a DNA template. The array layout shows the duplicate spots with probes targeting the O-antigen and virulence genes that are represented in groups 1–4. Biotinylated probes spotted along the top, middle and bottom rows (dark gray) of the array layout correspond to positive controls for polymer formation.
Similar results were obtained when assessing the virulence profile of the STEC strains. In particular, analysis of O157:H7 strain RM2084 resulted in polymer formation for probes targeting ent, nleA, espP, and katP genes and for probes targeting eae, per, ehxA, stx1, stx2, and fliCH7 when testing the multiplex group 3 or group 4, respectively (Figure 2). Further examination of the virulence profiles of the O113:H21 strain RM7519 and the O157:H7 strain RM6011 demonstrated that the patterns of polymer formation correlated with their genotype that was determined previously by conventional PCR. For reactions lacking a DNA template, polymer formation was observed only with the biotinylated oligonucleotide probes spotted on the slide as a control for the ampliPHOX polymerization reaction (Figure 2).
High mean pixel intensities of the signal were obtained for spots where polymer formation was detected. Positive signals for O157 O-antigen wzy gene spots from analysis of several experiments for O157:H7 strain RM1697 had mean pixel intensity values ranging from 84.4 ± 4.8 to 97.5 ± 4.5 with background values ranging from 25.2 ± 1.4 to 25.6 ± 1.5. Further, analysis of O157:H7 strains RM2084 and RM6011 and of O113:H21 strain RM7519 indicated positive signal values for all virulence spots ranged from 82.4 ± 2.9 to 108.3 ± 2.5 for the group 3 probes, and for the group 4 probes, mean pixel signal intensities ranged from 70.9 ± 6.1 to 112.8 ± 3.4. These results for the positive signals contrasted with background values, ranging from 25.2 ± 1.4 to 25.9 ± 1.8. Similar values were obtained for other arrays used in several experiments for genotyping reference strains with different O-antigens and virulence profiles. These findings indicated a significant difference between signal intensities and background noise, facilitating microarray data analysis, and accurate interpretation of results with this DNA microarray-based genotyping method.
Genotyping STEC Isolates from a Produce Production Region in California
The high level of specificity of the microarray colorimetric method, obtained in the validation experiments, prompted us to expand the study to genotype E. coli isolates from produce production regions in California. Enrichment broths were prepared from watershed sediment or from wildlife and livestock fecal samples, and the recovery of E. coli isolates was achieved after plating an aliquot of the enrichment broth on selective solid media. A subset of recovered E coli isolates, identified initially to be positive for various relevant O-types by a conventional PCR assay, were selected for analysis with the microarray colorimetric method. As shown in Table 4, the results indicated that this microarray colorimetric method accurately determined the O-antigen serogroup of the tested environmental STEC isolates. The formation of polymer on spots targeting a particular O-type correlated with the O-antigen that was determined previously by a conventional PCR assay (Table 4). Quantification analysis revealed that the mean pixel intensity values of the O-antigen spot signals for all tested isolates ranged from 75.6 ± 6.3 to 110.1 ± 4.8; however, values ranging from 25.1 ± 1.6 to 25.9 ± 2.7 were detected for the background.
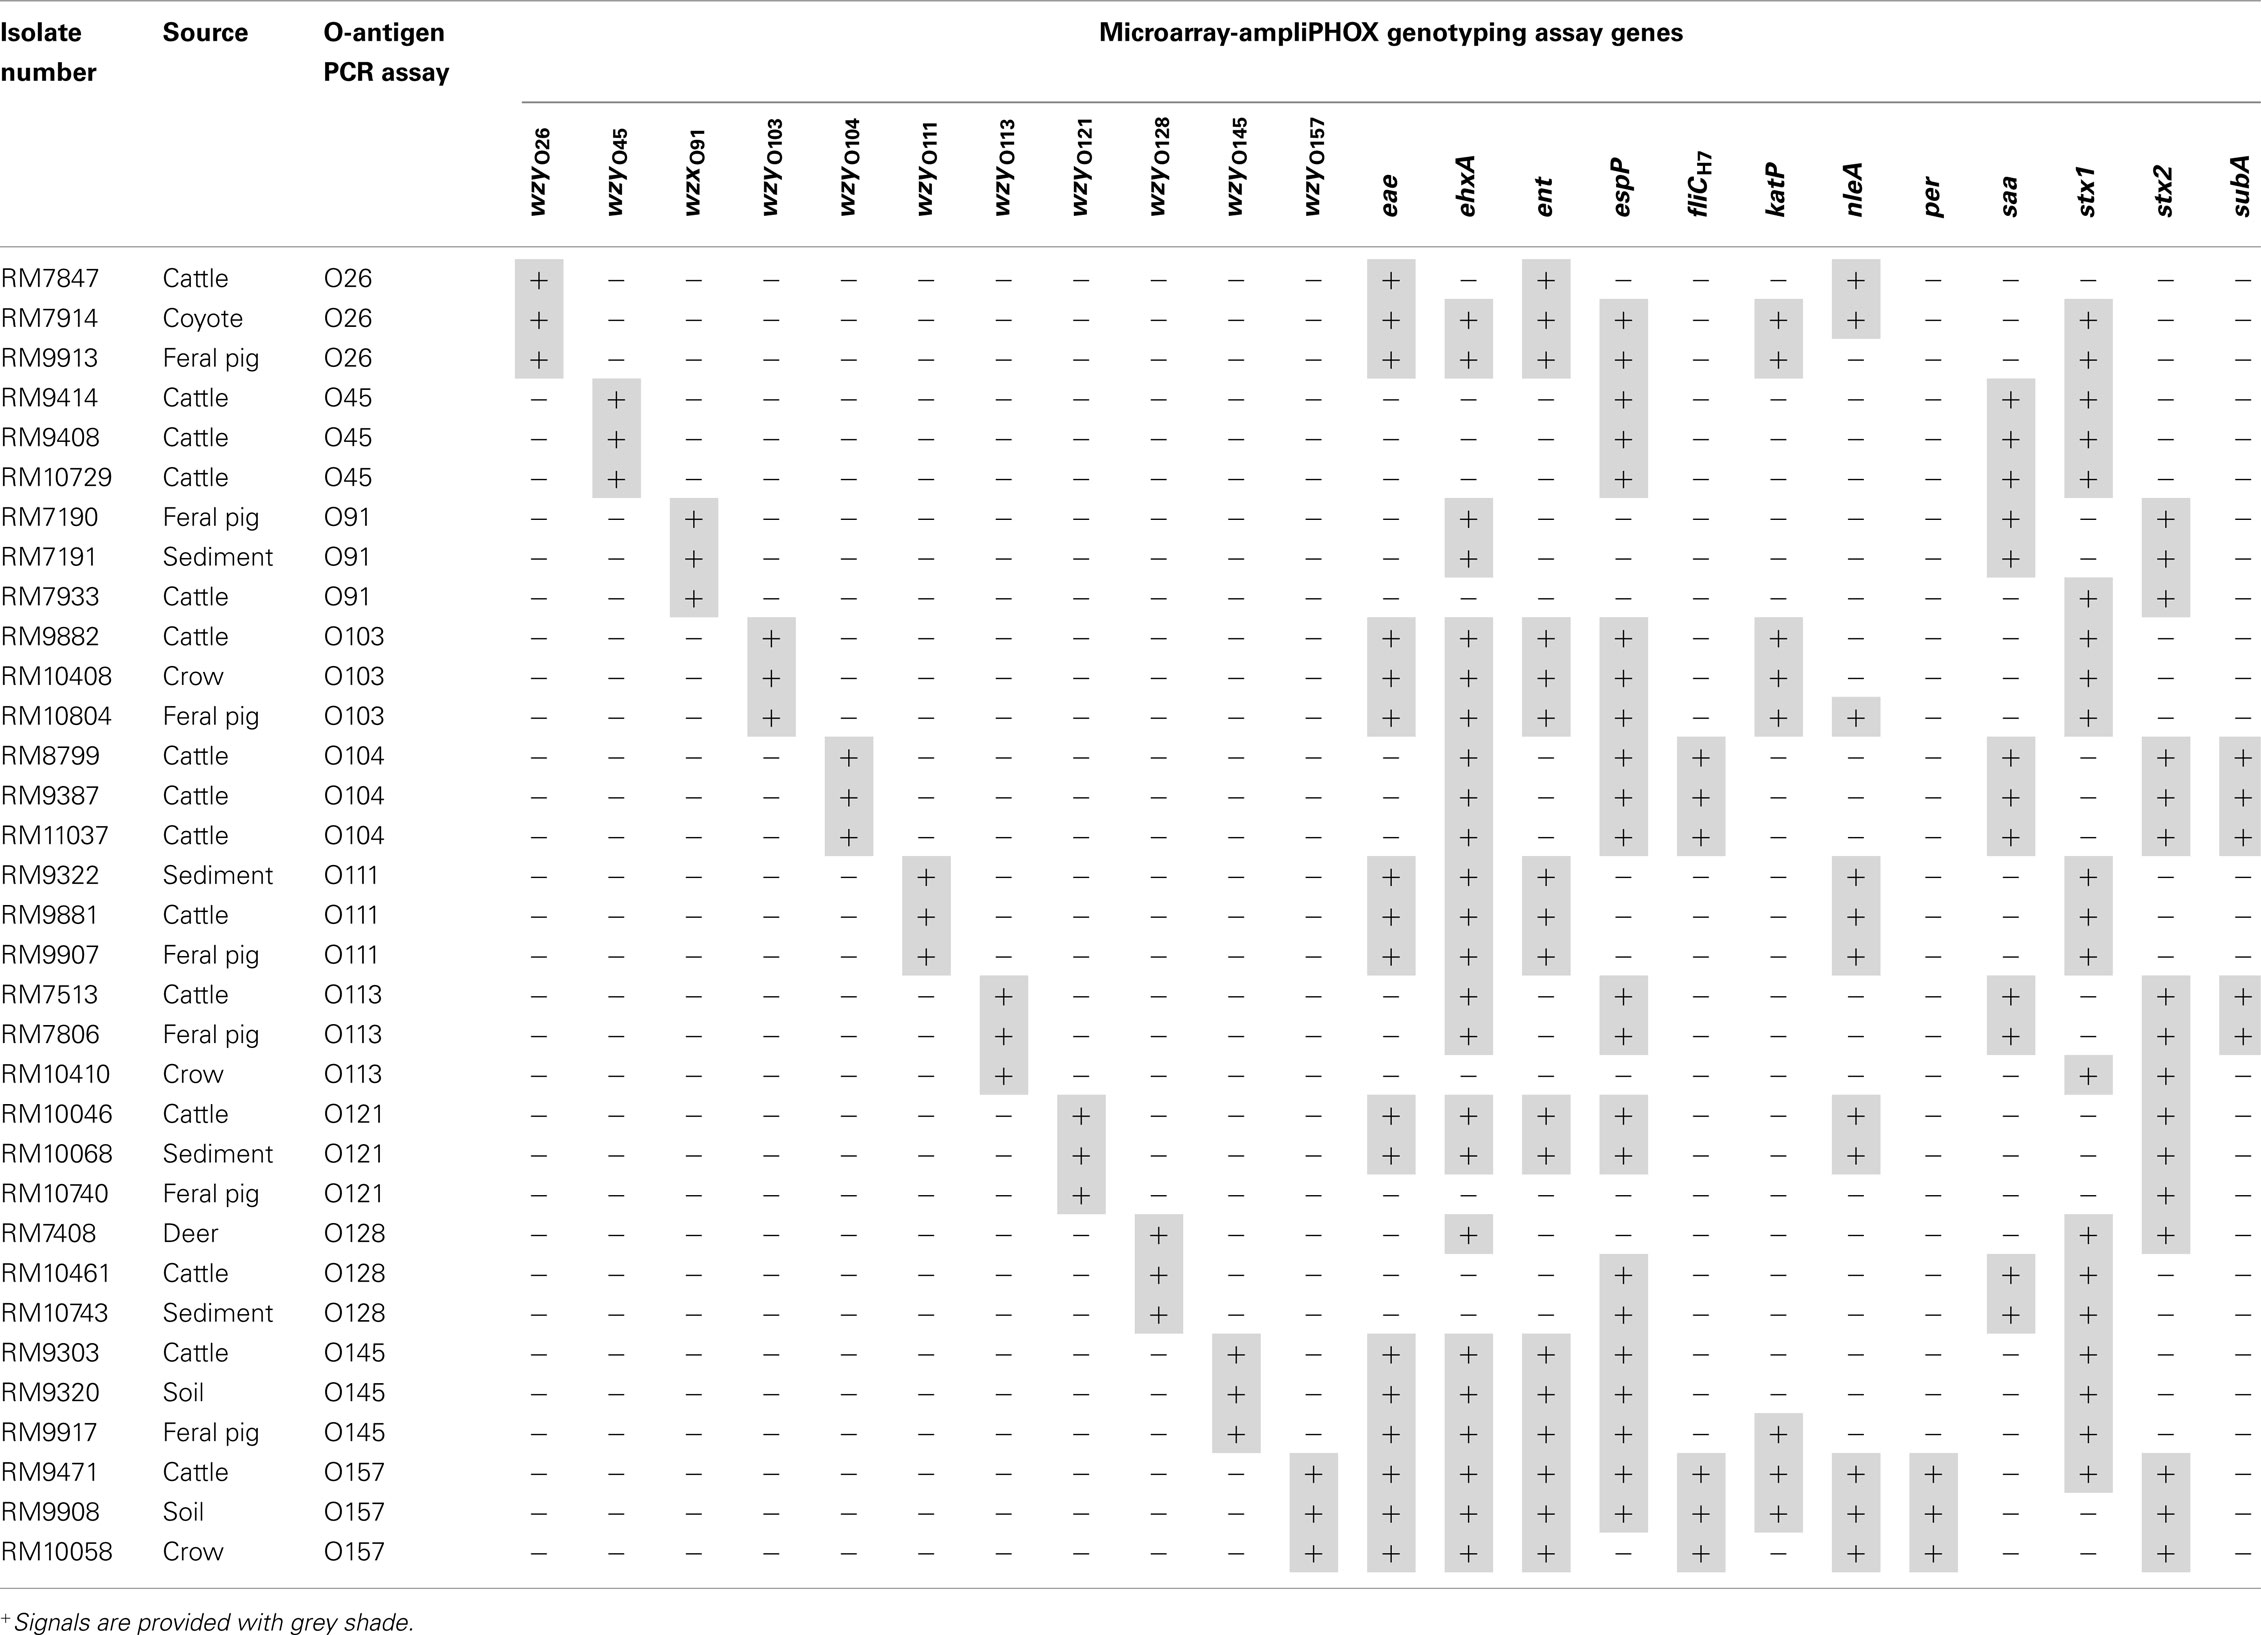
Table 4. Genotyping Shiga toxin-producing Escherichia coli environmental isolates with DNA microarray-based ampliPHOX colorimetric method.
The virulence profile of the isolates was then analyzed by this microarray method. The analysis indicated that more than 50% of the tested isolates were positive for the virulence factors eae, ehxA, ent, espP, and stx1, and STEC isolates harboring the same O-type were also similar in virulence gene profiles (Table 4). Similar to the O-antigen analysis, the virulence profiles were confirmed by a separate analysis using conventional PCR assay (data not shown). Further quantification of the detected microarray signals in the analysis of O45 cattle isolate RM10729 resulted in average signal intensity values of 99.3 ± 4.7, 106.7 ± 6.3, and 78.8 ± 3.8 for spots targeting espP, saa, and stx1 genes, respectively with a background value of 25.3 ± 2.4 for this microarray examined. Moreover, quantification of the mean pixel intensity of stx2 spots had a signal value of 103.1 ± 3.8 and a background value of 25.4 ± 3.5 when analyzing feral pig isolate RM10740. These quantification results were typical for all environmental isolates examined by this microarray method. These results revealed a clear distinction between positive signals, where polymer formation was observed on microarray spots, when compared to the background, and this facilitated accurate genotyping of the tested environmental isolates.
Discussion
The growing concern about sporadic and outbreak illnesses associated with STEC has prompted the development of methods for more efficient detection of STEC in the United States (Johnson et al., 1996; Brooks et al., 2005; Gould et al., 2009; Hoefer et al., 2011; Stigi et al., 2012). To address this issue, the present study developed a simple, rapid, cost–effective, and quantitative colorimetric method for the assessment of molecular risk factors associated with STEC pathogenesis. The advantage of using the DNA microarray platform in conjunction with ampliPHOX colorimetric method was successfully demonstrated by simultaneously detecting highly relevant genes on a selected group of STEC recovered from clinical and environmental sources. Previously, a low-density DNA oligonucleotide microarray was developed to target E. coli O157 (Quiñones et al., 2011), the STEC that has been most-commonly associated with produce outbreaks that traced back to leafy vegetables from the United States (Cooley et al., 2007; Mandrell, 2011). In the present study, additional probes were designed to target six non-O157 serogroups, reported previously to be associated with the majority of STEC infections in the United States and worldwide as well as another set of non-O157 serogroups, linked to sporadic disease and diarrhea (Brooks et al., 2005; Bettelheim, 2007). The selected virulence-specific probes targeted stx, eae, nle, and ent genes, located on pathogenicity islands and implicated in conferring E. coli strains with an increased ability to cause disease (Coombes et al., 2008; Bolton, 2011). In addition to katP, exhA, espP, and subA gene detection, this microarray method targeted saa, encoding an attachment factor that has been found in non-O157 STEC strains isolated from patients suffering from severe disease symptoms (Bettelheim, 2007; Bolton, 2011). An important advantage of the ampliPHOX colorimetric method is the relatively short 30-mer oligonucleotide probes used, thus facilitating the specific detection of target genes without any cross-hybridization of non-target genes. In contrast, the commonly used fluorescent assays for microarray detection require longer probes (70 or 100-mer) to distinguish signals from the background noise (Letowski et al., 2004). Quantification of the colorimetric positive signals in this study revealed that mean pixel intensities were at least three times higher than the colorimetric signals for spots without any specific hybridization, and consequently, positive signal intensities were discriminated easily from background noise.
The use of DNA oligonucleotide arrays on glass slides in conjunction with traditional fluorescence detection assays for genotyping STEC has been reported previously (Call et al., 2001; Chizhikov et al., 2001; Chen et al., 2005; Bruant et al., 2006). The disadvantage of traditional fluorescent assays for microarray-based detection is that the labeling of target DNA with fluorescent Cy dyes can be inconsistent, resulting consequently in decreased assay sensitivity (Call, 2005; Kuck and Taylor, 2008; Vora et al., 2008). Furthermore, the use of traditional fluorescence requires the use of expensive and non-portable confocal scanners for data analysis and quantification (Kuck and Taylor, 2008; Moulton et al., 2011). Recent reports have documented the development of microtube-based DNA arrays as more cost–effective than standard fluorescent methods (Anjum et al., 2007; Ballmer et al., 2007). However, the use of the microtube-based arrays requires microgram amounts of purified genomic DNA from the tested strain to reliably detect all expected genes (Anjum et al., 2007), which is not amenable for high-throughput sampling of a large number of bacterial isolates. In contrast, the ampliPHOX colorimetric detection method, employed in the present study, uses a small, portable, and inexpensive scanner that is at least tenfold lower in cost, compared with confocal microarray scanners (Moulton et al., 2011). Moreover, this colorimetric assay uses 2–3 μl of crude/unpurified bacterial lysates to successfully detect all target genes on the microarray with a rapid assay time. The inclusion of an amplification step coupled with an exonuclease digestion of target DNA allowed for rapid and accurate genotyping of 25–30 STEC isolates in approximately 3–4 h.
The microarray-based colorimetric assay was then employed to examine the genetic composition of environmental isolates from an important produce production region in the United States located on the central coast of California. Our findings indicated that this assay simultaneously detected relevant O-antigens and virulence genes in isolates recovered from multiple types of animal fecal samples (livestock and wildlife) and watershed sediment samples present on or near farms or ranches in this agricultural region. The genotyping results demonstrated that different isolates with the same O-antigen gene had a similar virulence gene profile. Still to be determined is whether the similar virulence gene profiles in non-O157 and in O157 strains represents a stable and predominant genotype in this major produce production region. Future work is aimed at assessing molecular risk factors associated with STEC pathogenesis in a larger and diverse set of environmental isolates recovered from ranches, farms, and watershed sites in produce production regions in California for assessing pathogen incidence, movement, and virulence potential. Thus, the DNA microarray-based ampliPHOX colorimetric system, using low-cost reagents and instrumentation, proved to be a simple and quantitative method that allowed for rapid and high-throughput O-antigen and virulence factor typing of STEC isolates.
Conflict of Interest Statement
The authors declare that the research was conducted in the absence of any commercial or financial relationships that could be construed as a potential conflict of interest.
Acknowledgments
This work was supported by the USDA-Agricultural Research Service CRIS project number 5325-42000-047 and by the National Research Initiative Competitive Grant numbers 2006-55212-16927 and 2007-35212-18239 from the USDA-National Institute of Food and Agriculture. We thank Dr. Erica D. Dawson and Amber T. Taylor (InDevR, Inc., Boulder, CO, USA) for assistance with ampliPHOX reagents and instrumentation. We also thank Drs. E. Robert Atwill and Michelle T. Jay-Russell from the University of California at Davis, the USDA/APHIS-Wildlife Services, and the California Department of Fish and Game for providing wildlife samples.
References
Anjum, M. F., Mafura, M., Slickers, P., Ballmer, K., Kuhnert, P., Woodward, M. J., and Ehricht, R. (2007). Pathotyping Escherichia coli by using miniaturized DNA microarrays. Appl. Environ. Microbiol. 73, 5692–5697.
Ballmer, K., Korczak, B. M., Kuhnert, P., Slickers, P., Ehricht, R., and Hachler, H. (2007). Fast DNA serotyping of Escherichia coli by use of an oligonucleotide microarray. J. Clin. Microbiol. 45, 370–379.
Bettelheim, K. A. (2007). The non-O157 Shiga-toxigenic (verocytotoxigenic) Escherichia coli; under-rated pathogens. Crit. Rev. Microbiol. 33, 67–87.
Boissinot, K., Huletsky, A., Peytavi, R., Turcotte, S., Veillette, V., Boissinot, M., Picard, F. J., Martel, E. A., and Bergeron, M. G. (2007). Rapid exonuclease digestion of PCR-amplified targets for improved microarray hybridization. Clin. Chem. 53, 2020–2023.
Bolton, D. J. (2011). Verocytotoxigenic (Shiga toxin-producing) Escherichia coli: virulence factors and pathogenicity in the farm to fork paradigm. Foodborne Pathog. Dis. 8, 357–365.
Brooks, J. T., Sowers, E. G., Wells, J. G., Greene, K. D., Griffin, P. M., Hoekstra, R. M., and Strockbine, N. A. (2005). Non-O157 Shiga toxin-producing Escherichia coli infections in the United States, 1983-2002. J. Infect. Dis. 192, 1422–1429.
Bruant, G., Maynard, C., Bekal, S., Gaucher, I., Masson, L., Brousseau, R., and Harel, J. (2006). Development and validation of an oligonucleotide microarray for detection of multiple virulence and antimicrobial resistance genes in Escherichia coli. Appl. Environ. Microbiol. 72, 3780–3784.
Buvens, G., Possé, B., De Schrijver, K., De Zutter, L., Lauwers, S., and Piérard, D. (2011). Virulence profiling and quantification of verocytotoxin-producing Escherichia coli O145:H28 and O26:H11 isolated during an ice cream-related hemolytic uremic syndrome outbreak. Foodborne Pathog. Dis. 8, 421–426.
Call, D. R. (2005). Challenges and opportunities for pathogen detection using DNA microarrays. Crit. Rev. Microbiol. 31, 91–99.
Call, D. R., Brockman, F. J., and Chandler, D. P. (2001). Detecting and genotyping Escherichia coli O157:H7 using multiplexed PCR and nucleic acid microarrays. Int. J. Food Microbiol. 67, 71–80.
CDC, Centers for Disease Control, and Prevention. (1995). Outbreak of acute gastroenteritis attributable to Escherichia coli serotype O104:H21 – Helena, Montana, 1994. MMWR Morb. Mortal. Wkly. Rep. 44, 501–503.
Chen, S., Zhao, S., Mcdermott, P. F., Schroeder, C. M., White, D. G., and Meng, J. (2005). A DNA microarray for identification of virulence and antimicrobial resistance genes in Salmonella serovars and Escherichia coli. Mol. Cell. Probes 19, 195–201.
Chizhikov, V., Rasooly, A., Chumakov, K., and Levy, D. D. (2001). Microarray analysis of microbial virulence factors. Appl. Environ. Microbiol. 67, 3258–3263.
Cooley, M., Carychao, D., Crawford-Miksza, L., Jay, M. T., Myers, C., Rose, C., Keys, C., Farrar, J., and Mandrell, R. E. (2007). Incidence and tracking of Escherichia coli O157:H7 in a major produce production region in California. PLoS ONE 2, e1159. doi: 10.1371/journal.pone.0001159
Coombes, B. K., Gilmour, M. W., and Goodman, C. D. (2011). The evolution of virulence in non-O157 Shiga toxin-producing Escherichia coli. Front. Microbiol. 2:90. doi: 10.3389/fmicb.2011.00090
Coombes, B. K., Wickham, M. E., Mascarenhas, M., Gruenheid, S., Finlay, B. B., and Karmali, M. A. (2008). Molecular analysis as an aid to assess the public health risk of non-O157 Shiga toxin-producing Escherichia coli strains. Appl. Environ. Microbiol. 74, 2153–2160.
Dean-Nystrom, E. A., Melton-Celsa, A. R., Pohlenz, J. F. L., Moon, H. W., and O’Brien, A. D. (2003). Comparative pathogenicity of Escherichia coli O157 and intimin-negative non-O157 Shiga toxin-producing E. coli strains in neonatal pigs. Infect. Immun. 71, 6526–6533.
Gould, L. H., Bopp, C., Strockbine, N., Atkinson, R., Baselski, V., Body, B., Carey, R., Crandall, C., Hurd, S., Kaplan, R., Neill, M., Shea, S., Somsel, P., Tobin-D’Angelo, M., Griffin, P. M., and Gerner-Smidt, P. (2009). Recommendations for diagnosis of Shiga toxin-producing Escherichia coli infections by clinical laboratories. MMWR Recomm. Rep. 58, 1–14.
Gyles, C. L. (2007). Shiga toxin-producing Escherichia coli: an overview. J. Anim. Sci. 85, E45–E62.
Hoefer, D., Hurd, S., Medus, C., Cronquist, A., Hanna, S., Hatch, J., Hayes, T., Larson, K., Nicholson, C., Wymore, K., Tobin-D’Angelo, M., Strockbine, N., Snippes, P., Atkinson, R., Griffin, P. M., and Gould, L. H. (2011). Laboratory practices for the identification of Shiga toxin-producing Escherichia coli in the United States, FoodNet sites, 2007. Foodborne Pathog. Dis. 8, 555–560.
Ito, H., Terai, A., Kurazono, H., Takeda, Y., and Nishibuchi, M. (1990). Cloning and nucleotide sequencing of Vero toxin 2 variant genes from Escherichia coli O91:H21 isolated from a patient with the hemolytic uremic syndrome. Microb. Pathog. 8, 47–60.
Johnson, R. P., Clarke, R. C., Wilson, J. B., Read, S. C., Rahn, K., Renwick, S. A., Sandhu, K. A., Alves, D., Karmali, M. A., Lior, H., Mcewen, S. A., Spika, J. S., and Gyles, C. L. (1996). Growing concerns and recent outbreaks involving non-O157:H7 serotypes of verotoxigenic Escherichia coli. J. Food Prot. 59, 1112–1122.
Karmali, M. A. (1989). Infection by verocytotoxin-producing Escherichia coli. Clin. Microbiol. Rev. 2, 15–38.
Karmali, M. A., Mascarenhas, M., Shen, S., Ziebell, K., Johnson, S., Reid-Smith, R., Isaac-Renton, J., Clark, C., Rahn, K., and Kaper, J. B. (2003). Association of genomic O island 122 of Escherichia coli EDL 933 with verocytotoxin-producing Escherichia coli seropathotypes that are linked to epidemic and/or serious disease. J. Clin. Microbiol. 41, 4930–4940.
Karmali, M. A., Steele, B. T., Petric, M., and Lim, C. (1983). Sporadic cases of haemolytic-uraemic syndrome associated with faecal cytotoxin and cytotoxin-producing Escherichia coli in stools. Lancet 321, 619–620.
Kimura, R., Mandrell, R. E., Galland, J. C., Hyatt, D., and Riley, L. W. (2000). Restriction-site-specific PCR as a rapid test to detect enterohemorrhagic Escherichia coli O157:H7 strains in environmental samples. Appl. Environ. Microbiol. 66, 2513–2519.
Kuck, L. R., and Taylor, A. W. (2008). Photopolymerization as an innovative detection technique for low-density microarrays. BioTechniques 45, 179–186.
Letowski, J., Brousseau, R., and Masson, L. (2004). Designing better probes: effect of probe size, mismatch position and number on hybridization in DNA oligonucleotide microarrays. J. Microbiol. Methods 57, 269–278.
Mandrell, R. E. (2011). “Tracing pathogens in fruit and vegetable production chains,” in Tracing Pathogens in the Food Chain, eds S. Brul, P. M. Fratamico, and T. Mcmeekin (Philadelphia, PA: Woodhead Publishing), 548–595.
Mathusa, E. C., Chen, Y., Enache, E., and Hontz, L. (2010). Non-O157 Shiga toxin-producing Escherichia coli in foods. J. Food Prot. 73, 1721–1736.
Moulton, K. R., Taylor, A. W., Rowlen, K. L., and Dawson, E. D. (2011). ampliPHOX colorimetric detection on a DNA microarray for influenza. J. Vis. Exp. 52, e2682.
Ørskov, I., Ørskov, F., Jann, B., and Jann, K. (1977). Serology, chemistry, and genetics of O and K antigens of Escherichia coli. Bacteriol. Rev. 41, 667–710.
Quiñones, B., Swimley, M. S., Taylor, A. W., and Dawson, E. D. (2011). Identification of Escherichia coli O157 by using a novel colorimetric detection method with DNA microarrays. Foodborne Pathog. Dis. 8, 705–711.
Rangel, J. M., Sparling, P. H., Crowe, C., Griffin, P. M., and Swerdlow, D. L. (2005). Epidemiology of Escherichia coli O157:H7 outbreaks, United States, 1982-2002. Emerging Infect. Dis. 11, 603–609.
Reid, S. D., Betting, D. J., and Whittam, T. S. (1999). Molecular detection and identification of intimin alleles in pathogenic Escherichia coli by multiplex PCR. J. Clin. Microbiol. 37, 2719–2722.
Rozen, S., and Skaletsky, H. (2000). “Primer3 on the WWW for general users and for biologist programmers,” in Bioinformatics Methods and Protocols, eds S. Misener, and S. A. Krawetz (Totowa, NJ: Humana Press), 365–386.
Schmidt, H., Scheef, J., Morabito, S., Caprioli, A., Wieler, L. H., and Karch, H. (2000). A new Shiga toxin 2 variant (Stx2f) from Escherichia coli isolated from pigeons. Appl. Environ. Microbiol. 66, 1205–1208.
Sikes, H. D., Hansen, R. R., Johnson, L. M., Jenison, R., Birks, J. W., Rowlen, K. L., and Bowman, C. N. (2008). Using polymeric materials to generate an amplified response to molecular recognition events. Nat. Mater. 7, 52–56.
Smith, D. K., Kassam, T., Singh, B., and Elliott, J. F. (1992). Escherichia coli has two homologous glutamate decarboxylase genes that map to distinct loci. J. Bacteriol. 174, 5820–5826.
Stigi, K. A., Macdonald, J. K., Tellez-Marfin, A. A., and Lofy, K. H. (2012). Laboratory practices and incidence of non-O157 Shiga toxin-producing Escherichia coli infections. Emerging Infect. Dis. 18, 477–479.
Uttamchandani, M., Neo, J. L., Ong, B. N., and Moochhala, S. (2009). Applications of microarrays in pathogen detection and biodefence. Trends Biotechnol. 27, 53–61.
Vora, G. J., Meador, C. E., Anderson, G. P., and Taitt, C. R. (2008). Comparison of detection and signal amplification methods for DNA microarrays. Mol. Cell. Probes 22, 294–300.
Keywords: DNA microarrays, photopolymerization, Shiga toxin, Escherichia coli, foodborne pathogen, ampliPHOX, genotyping, STEC
Citation: Quiñones B, Swimley MS, Narm K-E, Patel RN, Cooley MB and Mandrell RE (2012) O-antigen and virulence profiling of Shiga toxin-producing Escherichia coli by a rapid and cost–effective DNA microarray colorimetric method. Front. Cell. Inf. Microbio. 2:61. doi: 10.3389/fcimb.2012.00061
Received: 16 March 2012; Paper pending published: 13 April 2012;
Accepted: 18 April 2012; Published online: 11 May 2012.
Edited by:
Nora Lía Padola, Universidad Nacional del Centro de la Provincia de Buenos Aires, ArgentinaReviewed by:
Deborah Threadgill, North Carolina State University, USAAnalía Inés Etcheverría, Universidad Nacional del Centro de la Provincia de Buenos Aires, Argentina
Copyright: © 2012 Quiñones, Swimley, Narm, Patel, Cooley and Mandrell. This is an open-access article distributed under the terms of the Creative Commons Attribution Non Commercial License, which permits non-commercial use, distribution, and reproduction in other forums, provided the original authors and source are credited.
*Correspondence: Beatriz Quiñones, Produce Safety and Microbiology Research Unit, Western Regional Research Center, U.S. Department of Agriculture/Agricultural Research Service, 800 Buchanan Street, WAB 214L, Albany, CA 94710, USA. e-mail: beatriz.quinones@ars.usda.gov
†Present address: Koh-Eun Narm, University of Illinois, Department of Microbiology, B212 Chemical and Life Sciences Laboratory, Urbana, IL 61801, USA.