Tissue-Specific Signatures in the Transcriptional Response to Anaplasma phagocytophilum Infection of Ixodes scapularis and Ixodes ricinus Tick Cell Lines
 Pilar Alberdi1†
  Karen L. Mansfield2†
  Raúl Manzano-Román3† Charlotte Cook2
  Nieves Ayllón1
  Margarita Villar1 Nicholas Johnson2 Anthony R. Fooks2,4
  José de la Fuente1,5*
- 1SaBio, Instituto de Investigación en Recursos Cinegéticos IREC-Consejo Superior de Investigaciones Científicas- Universidad de Castilla–La Mancha-Junta de Comunidades de Castilla–La Mancha, Ciudad Real, Spain
- 2Animal and Plant Health Agency, New Haw, Surrey, UK
- 3Parasitología Animal, Instituto de Recursos Naturales y Agrobiología de Salamanca (IRNASA, Consejo Superior de Investigaciones Científicas), Salamanca, Spain
- 4Department of Clinical Infection, Microbiology and Immunology, University of Liverpool, Liverpool, UK
- 5Department of Veterinary Pathobiology, Center for Veterinary Health Sciences, Oklahoma State University, Stillwater, OK, USA
Anaplasma phagocytophilum are transmitted by Ixodes spp. ticks and have become one of the most common and relevant tick-borne pathogens due to their impact on human and animal health. Recent results have increased our understanding of the molecular interactions between Ixodes scapularis and A. phagocytophilum through the demonstration of tissue-specific molecular pathways that ensure pathogen infection, development and transmission by ticks. However, little is known about the Ixodes ricinus genes and proteins involved in the response to A. phagocytophilum infection. The tick species I. scapularis and I. ricinus are evolutionarily closely related and therefore similar responses are expected in A. phagocytophilum-infected cells. However, differences may exist between I. scapularis ISE6 and I. ricinus IRE/CTVM20 tick cells associated with tissue-specific signatures of these cell lines. To address this hypothesis, the transcriptional response to A. phagocytophilum infection was characterized by RNA sequencing and compared between I. scapularis ISE6 and I. ricinus IRE/CTVM20 tick cell lines. The transcriptional response to infection of I. scapularis ISE6 cells resembled that of tick hemocytes while the response in I. ricinus IRE/CTVM20 cells was more closely related to that reported previously in infected tick midguts. The inhibition of cell apoptosis by A. phagocytophilum appears to be a key adaptation mechanism to facilitate infection of both vertebrate and tick cells and was used to investigate further the tissue-specific response of tick cell lines to pathogen infection. The results supported a role for the intrinsic pathway in the inhibition of cell apoptosis by A. phagocytophilum infection of I. scapularis ISE6 cells. In contrast, the results in I. ricinus IRE/CTVM20 cells were similar to those obtained in tick midguts and suggested a role for the JAK/STAT pathway in the inhibition of apoptosis in tick cells infected with A. phagocytophilum. Nevertheless, tick cell lines were derived from embryonated eggs and may contain various cell populations with different morphology and behavior that could affect transcriptional response to infection. These results suggested tissue-specific signatures in I. scapularis ISE6 and I. ricinus IRE/CTVM20 tick cell line response to A. phagocytophilum infection that support their use as models for the study of tick-pathogen interactions.
Introduction
Anaplasma phagocytophilum (Rickettsiales: Anaplasmataceae) is the causative agent of human granulocytic anaplasmosis (HGA), equine and canine granulocytic anaplasmosis, and tick-borne fever of ruminants (TBF; Severo et al., 2015). A. phagocytophilum are transmitted by Ixodes scapularis and I. pacificus in the United States and by I. ricinus in Europe becoming one of the most common and relevant tick-borne pathogens in these regions due to their impact on human and animal health (Goodman, 2005; Stuen, 2007; Severo et al., 2015). Furthermore, the wide host range of A. phagocytophilum (Estrada-Peña et al., 2015) and the extensive distribution and expansion of tick vector populations (Estrada-Peña et al., 2014) will likely make this tick-borne pathogen a growing concern for human and animal health worldwide.
The I. scapularis genome is the only tick genome sequenced and assembled (Geraci et al., 2007) and constitutes a valuable resource for the study of tick biology and tick-pathogen interactions with particular interest for closely related species such as I. ricinus (Genomic Resources Development Consortium et al., 2014). Recent results have increased our understanding of I. scapularis–A. phagocytophilum interactions through the demonstration of tissue-specific molecular pathways that ensure A. phagocytophilum infection, development and transmission by ticks (Ayllón et al., 2013, 2015a; Villar et al., 2015a,b). However, little is known about the genes and proteins of I. ricinus involved in the response to A. phagocytophilum infection (Alberdi et al., 2015; Ayllón et al., 2015b).
Recently, Alberdi et al. (2015) demonstrated that different geographic isolates of A. phagocytophilum inhibit apoptosis in both I. scapularis ISE6 and I. ricinus IRE/CTVM20 tick cells, supporting that pathogen infection inhibits apoptotic pathways to facilitate infection in different tick vector species. However, infection with A. phagocytophilum inhibited the intrinsic apoptosis pathway at different levels in I. scapularis and I. ricinus cells, suggesting that differences may exist between tick species in response to infection (Alberdi et al., 2015). Alternatively, as has been shown in I. scapularis midguts and salivary glands (Ayllón et al., 2015a) and ISE6 cells (Villar et al., 2015a), tick cell lines may reflect tissue-specific differences in response to A. phagocytophilum infection. The I. scapularis ISE6 and I. ricinus IRE/CTVM20 tick cell lines were derived from embryonated eggs and contain cells with different morphology and behavior (Munderloh et al., 1994; Bell-Sakyi et al., 2007).
The I. scapularis and I. ricinus cells infected with A. phagocytophilum may show different response to infection due to (a) differences between tick species or (b) differences between I. scapularis ISE6 and I. ricinus IRE/CTVM20 tick cells derived from tissue-specific signatures of these tick cell lines derived from embryonated eggs. However, due to the close evolutionary relationship between I. scapularis and I. ricinus (Pedra et al., 2010; Dyachenko et al., 2013; Schwarz et al., 2013; Genomic Resources Development Consortium et al., 2014), our hypothesis is that differences between I. scapularis and I. ricinus tick cells in response to A. phagocytophilum are the result of tissue-specific signatures of these tick cells. To address this hypothesis, the transcriptional response to A. phagocytophilum infection was compared between I. scapularis ISE6 and I. ricinus IRE/CTVM20 tick cell lines. The results suggested tissue-specific signatures in tick cell line response to A. phagocytophilum infection that support their use as models for the study of tick-pathogen interactions.
Materials and Methods
I. scapularis and I. ricinus Tick Cells and Sample Preparation
The I. scapularis embryo-derived tick cell line ISE6 (provided by Ulrike Munderloh, University of Minnesota, USA) was cultured in L-15B300 medium and used in these experiments as previously described (Villar et al., 2015a). The I. ricinus embryo-derived tick cell line IRE/CTVM20 (provided by Lesley Bell-Sakyi, Tick Cell Biobank, Pirbright Institute, UK) was maintained in a 1:1 mixture of L-15 (Leibovitz) medium and L-15B medium (Munderloh and Kurtti, 1989) as previously described (Bell-Sakyi et al., 2007). Tick cells were inoculated with A. phagocytophilum (human NY18 isolate) as previously described (Villar et al., 2015a). Mock infected (uninfected) and infected cells (two independent cultures with approximately 107 cells each) were sampled at 7 days post-infection (dpi) [percent infected cells: ISE6, 71-77% (Ave ± SD, 74 ± 3); IRE/CTVM20, 58-62% (Ave ± SD, 60 ± 2)]. The percentage of A. phagocytophilum infected cells was calculated by examining at least 200 cells using a 100x oil immersion objective. The cells were centrifuged at 10,000 × g for 3 min, and cell pellets were frozen in liquid nitrogen until used for RNA extraction. Total RNA was extracted using TRIzol (Invitrogen, Carlsbad, CA, USA) following the manufacturer's recommendations. The RNA was further purified using the RNeasy Mini kit (Qiagen, Venlo, Netherlands). Ribosomal RNA (rRNA) was depleted using Terminator exonuclease (Epicentre, Madison, WI, USA) according to the manufacturer's instructions. Prior to sequencing, the RNA samples were quantified by spectrophotometry to confirm that each sample was at a suitable concentration (>10 ng/μl) for RNA sequencing (RNAseq). The RNA was then used for RNAseq and real-time RT-PCR.
RNAseq and Analysis
RNAseq was undertaken for both tick cell lines with duplicate RNA samples from uninfected and infected cells at each time point. For I. scapularis cell line ISE6, RNAseq was conducted as reported previously (Villar et al., 2015a). For I. ricinus cell line IRE/CTVM20, RNAseq was undertaken using a similar experimental approach. Briefly, RNA (200 ng) was reverse transcribed to generate double-stranded cDNA using the cDNA Synthesis System (Roche, Basel, Switzerland) and random hexamers. Illumina sequencing libraries were prepared using the Nextera XT system (Illumina, San Diego, CA, USA) and sequenced using an Illumina GA IIx instrument. Sequence analysis was undertaken using multiplexed paired-end samples. Pre-analysis sequence quality checking was performed using the FastQC programme (Babraham Institute, Babraham, Cambridgeshire, United Kingdom). The program BowTie2 (http://bowtie-bio.sourceforge.net/bowtie2/index.shtml) was used as an assembler to align sequenced reads with the reference I. scapularis genome sequence (assembly JCVI_ISG_i3_1.0; http://www.ncbi.nlm.nih.gov/nuccore/NZ_ABJB000000000). TopHat2 was then used to analyze the mapping results and identify splice junctions between exons. The Cufflinks program was used to provide an estimation of gene abundance and differential gene expression, allowing for splice variants and gaps due to the genome reference. Within Cufflinks, Cuffmerge was used to merge Cufflinks assemblies to provide normalization of biological replicates. Cuffquant was used to provide abundance estimation across normalized samples. The Cuffdiff algorithm was used to account for biological variability between samples and identify differentially expressed genes; this included non-statistical analysis (log2 fold-change) and statistical analysis (test for variance), in order to identify statistically significant fold-changes in gene expression (p ≤ 0.05; q ≤ 0.05). The TopHat-Cufflinks-Cuffmerge-Cuffquant-Cuffdiff pipeline was also used to analyze RNAseq data for I. scapularis cell line ISE6 (Villar et al., 2015a) and differentially expressed genes were selected for this study based on the same criteria used for the I. ricinus cell line IRE/CTVM20 (p ≤ 0.05; q ≤ 0.05). The RNAseq data for I. scapularis cell line ISE6 were deposited in NCBI's Gene Expression Omnibus and are accessible through GEO Series accession number GSE68881 (http://www.ncbi.nlm.nih.gov/geo/query/acc.cgi?acc=GSE68881; Villar et al., 2015a). For I. ricinus cell line IRE/CTVM20, the RNAseq data have been deposited in NCBI's Gene Expression Omnibus and are accessible through GEO Series accession number GSE76906 (http://www.ncbi.nlm.nih.gov/geo/query/acc.cgi?acc=GSE76906).
Bioinformatics Data Analysis and Gene Ontology (GO) Assignments
Functional annotations for each gene were obtained from Uniprot (www.uniprot.org) using GO annotations, Enzyme Commission (EC) number, and InterPro (www.ebi.ac.uk/interpro) using DAVID functional annotation tool (http://david.abcc.ncifcrf.gov/tools.jsp). Configuration for GO annotation included an E-value-Hit-filter of 1.0E-6, annotation cut off of 55, and GO weight of 5. For visualizing the GO annotations for molecular function (MF) and biological process (BP), the analysis tool of the Blast2GO software (version 2.6.6; www.blast2go.org) was used.
The InterPro motifs obtained using DAVID were used to evaluate the fold enrichment of differentially expressed genes. Functional annotation provides a Chart Report containing an annotation-term-focused view, which lists annotation terms and their associated genes under study. To avoid over counting duplicated genes, the Fisher Exact statistics was calculated based on corresponding DAVID gene IDs in which all redundancies in original IDs were removed. The results of Chart Report have to pass the thresholds (by default, Maximum Probability ≤ 0.1 and Minimum Count ≥ 2) in Chart Option section to ensure that only statistically significant ones are displayed. To evaluate the fold enrichment of differentially expressed genes, which corresponds to a set of genes highly associated with certain terms, the EASE Score Threshold (Maximum Probability) was used. The threshold of EASE Score, a modified Fisher Exact p-value, ranges from 0 to 1. Fisher Exact p = 0 represents perfect enrichment. We used Fisher Exact p ≤ 0.05 to consider enrichment in the annotation categories for differentially expressed genes. Finally, Panther (www.pantherdb.org) was used to calculate overrepresented and underrepresented GO categories. The fold enrichment (FE) of the genes observed in the uploaded list is divided by the expected number. If it is >1, then the category is overrepresented in the dataset. Conversely, the category is underrepresented if it is less than 1. For all BP and MF categories in upregulated and downregulated genes, values were compared between tick cell lines by Chi2 test (p = 0.01).
Characterization of Tick mRNA Levels by Real-Time RT-PCR
The expression of selected differentially expressed genes was characterized using total RNA extracted from infected and uninfected ISE6 and IRE/CTVM20 tick cells. Real-time RT-PCR was performed on RNA samples using gene-specific oligonucleotide primers (Supplementary Table 1) and the iScript One-Step RT-PCR Kit with SYBR Green and the CFX96 Touch Real-Time PCR Detection System (Bio-Rad, Hercules, CA, USA). A dissociation curve was run at the end of the reaction to ensure that only one amplicon was formed and that the amplicons denatured consistently in the same temperature range for every sample. The mRNA levels were normalized against tick 16S rRNA and cyclophilin using the genNorm method (ddCT method as implemented by Bio-Rad iQ5 Standard Edition, Version 2.0) as previously described (Ayllón et al., 2013). Normalized Ct values were compared between infected and uninfected tick cells by Student's t-test with unequal variance (P = 0.05; N = 5 biological replicates).
Results and Discussion
Transcriptional Response to A. phagocytophilum Infection in I. scapularis ISE6 and I. ricinus IRE/CTVM20 Cells
The RNAseq and differential expression analysis in A. phagocytophilum-infected I. scapularis cell line ISE6 was reported previously (Villar et al., 2015a). A total of 37,990 transcripts were identified of which 174 corresponded to differentially expressed genes between infected and uninfected cells (p ≤ 0.05; q ≤ 0.05) and used for this study (Supplementary Table 2). Of them, 45 and 129 genes were upregulated and downregulated, respectively in infected cells when compared to uninfected cells (Supplementary Table 2).
The RNAseq in A. phagocytophilum-infected I. ricinus cell line IRE/CTVM20 resulted in 20,681 genes (Supplementary Tables 3, 4). Differential expression analysis identified 197 differentially expressed genes between infected and uninfected cells (p ≤ 0.05; q ≤ 0.05; Supplementary Table 5). Of them, 154 and 43 genes were upregulated and downregulated, respectively in infected cells when compared to uninfected cells (Supplementary Table 5).
The analysis of transcriptomics results in I. scapularis ISE6 and I. ricinus IRE/CTVM20 tick cells showed that despite similar numbers of differentially expressed genes in response to infection, the number of upregulated and downregulated genes varied between cell lines. Additionally, of the differentially regulated genes only 36 were identified in both cell lines, with differences in response to infection (Table 1). These results evidenced differences in the transcriptional response to A. phagocytophilum infection of I. scapularis ISE6 and I. ricinus IRE/CTVM20 cells.
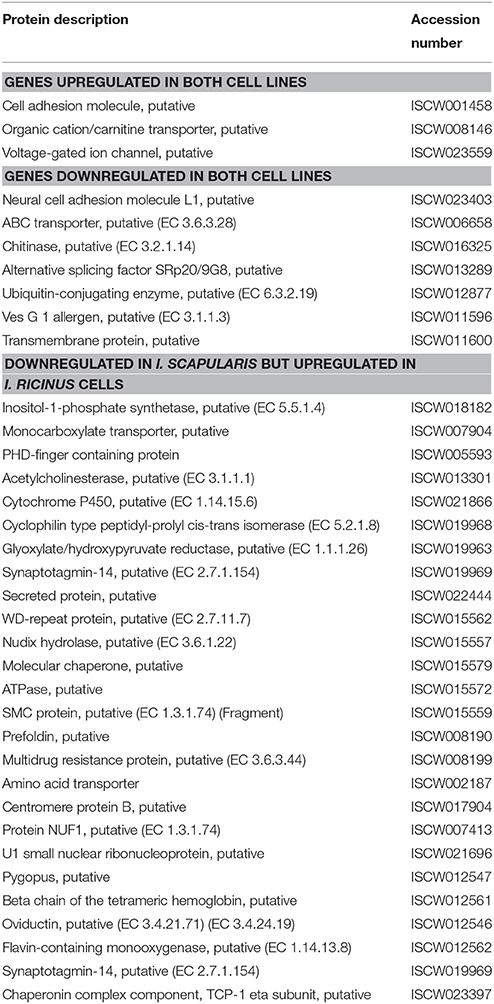
Table 1. Differentially expressed genes identified in both I. ricinus IRE/CTVM20 and I. scapularis ISE6 cell lines.
Twelve genes differentially expressed in both tick cell lines were selected for real-time RT-PCR to validate RNAseq data (Figures 1A,B). The results showed a 75% (9/12) and 67% (8/12) correlation between RNAseq and RT-PCR results for I. scapularis ISE6 and I. ricinus IRE/CTVM20 cells, respectively (Figure 1C). These results validated the RNAseq data and were similar to those obtained in previous experiments (Ayllón et al., 2015a; Villar et al., 2015a). As previously discussed, the differences observed between the results of the two analyses could be attributed to intrinsic variations in gene expression (Ayllón et al., 2015a).
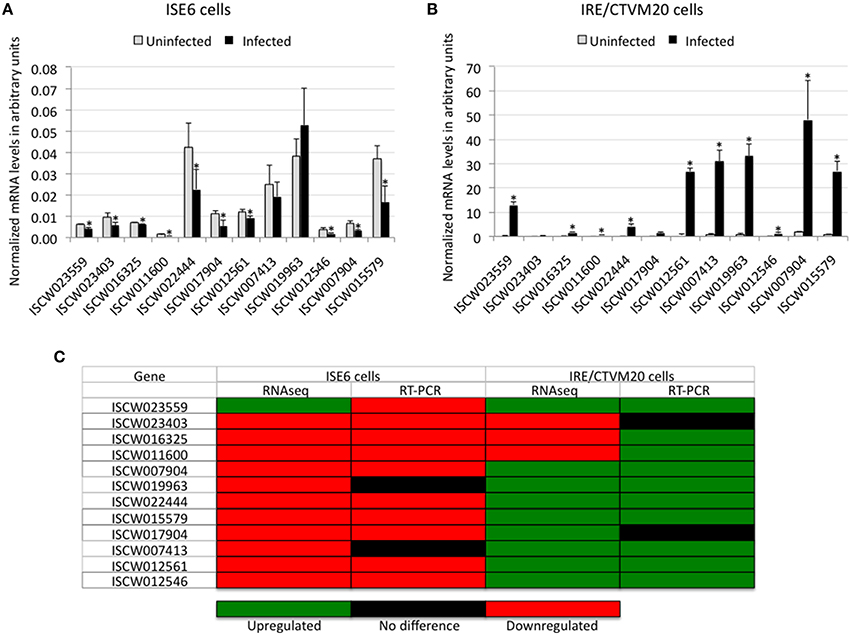
Figure 1. Validation of RNAseq results. (A,B) The expression of selected differentially expressed genes was characterized by real-time RT-PCR using total RNA extracted from infected and uninfected ISE6 and IRE/CTVM20 tick cells. The mRNA levels were normalized against tick 16S rRNA and cyclophilin using the genNorm method. Normalized Ct-values were represented as average + S.D. and compared between infected and uninfected tick cells by Student's t-test with unequal variance (*P < 0.05; N = 5 biological replicates). (C) Comparison between RNAseq and real-time RT-PCR results showing a good correlation between both methods.
Biological Process and Molecular Function of the Differentially Expressed Genes in I. scapularis ISE6 and I. ricinus IRE/CTVM20 Cells
To further characterize differentially expressed genes in response to A. phagocytophilum infection, genes were grouped by encoded proteins and annotated by GO to a single BP or MF to avoid redundancy. The analysis of BP showed that the most represented BP in both cell lines corresponded to cellular processes (50 and 33% of the upregulated genes and 48 and 50% of the downregulated genes in I. ricinus IRE/CTVM20 and I. scapularis ISE6 cells, respectively) and regulation (22 and 18% of the upregulated genes and 25 and 22% of the downregulated genes in I. ricinus IRE/CTVM20 and I. scapularis ISE6 cells, respectively; Figures 2A–C). The analysis of MF showed that the most represented MF in both cell lines corresponded to binding (43 and 30% of upregulated genes and 43 and 44% of the downregulated genes in I. ricinus IRE/CTVM20 and I. scapularis ISE6 cells, respectively) and catalytic activity (45 and 38% of upregulated genes and 47 and 43% of the downregulated genes in I. ricinus IRE/CTVM20 and I. scapularis ISE6 cells, respectively; Figures 3A–C). These results suggested that the most affected BP and MF in response to A. phagocytophilum infection were similar in I. ricinus IRE/CTVM20 and I. scapularis ISE6 cells.
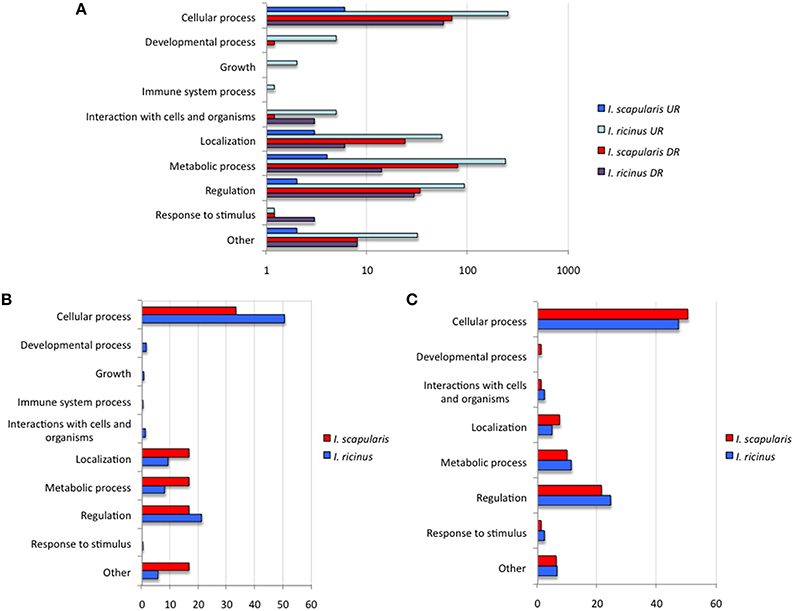
Figure 2. Biological processes affected by A. phagocytophilum infection of I. ricinus IRE/CTVM20 and I. scapularis ISE6 cells. (A) Differentially expressed genes were functionally annotated and grouped according to the BP of the encoded proteins. The number of genes on each BP is shown. (B) Percentage of upregulated genes in each BP. (C) Percentage of downregulated genes in each BP. UR, upregulated genes; DR, downregulated genes.
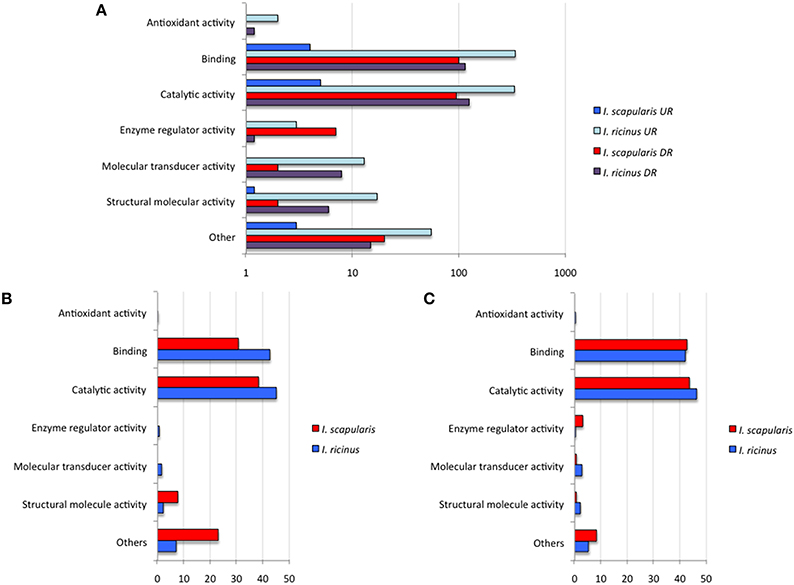
Figure 3. Molecular function of differentially expressed genes in response to A. phagocytophilum infection of I. ricinus IRE/CTVM20 and I. scapularis ISE6 cells. (A) Differentially expressed genes were functionally annotated and grouped according to the MF of the encoded proteins. The number of genes on each MF is shown. (B) Percentage of upregulated genes in each MF. (C) Percentage of downregulated genes in each MF. UR, upregulated genes; DR, downregulated genes.
However, when the analysis was conducted with GO normalized data (Figures 4A–D) significant differences between I. ricinus IRE/CTVM20 and I. scapularis ISE6 cells were observed for both upregulated and downregulated genes in BP (Figures 4A,B) and MF (Figures 4C,D) categories. In general, cell metabolic processes were the most affected BP in both cell lines for upregulated (Figure 4A) and downregulated (Figure 4B) genes. However, significant differences were observed between I. ricinus IRE/CTVM20 and I. scapularis ISE6 cells for all BP (p < 0.01; Figures 4A,B). For MF categories, upregulated but not downregulated genes were significantly different between I. ricinus IRE/CTVM20 and I. scapularis ISE6 cells (p < 0.01; Figures 4C,D).
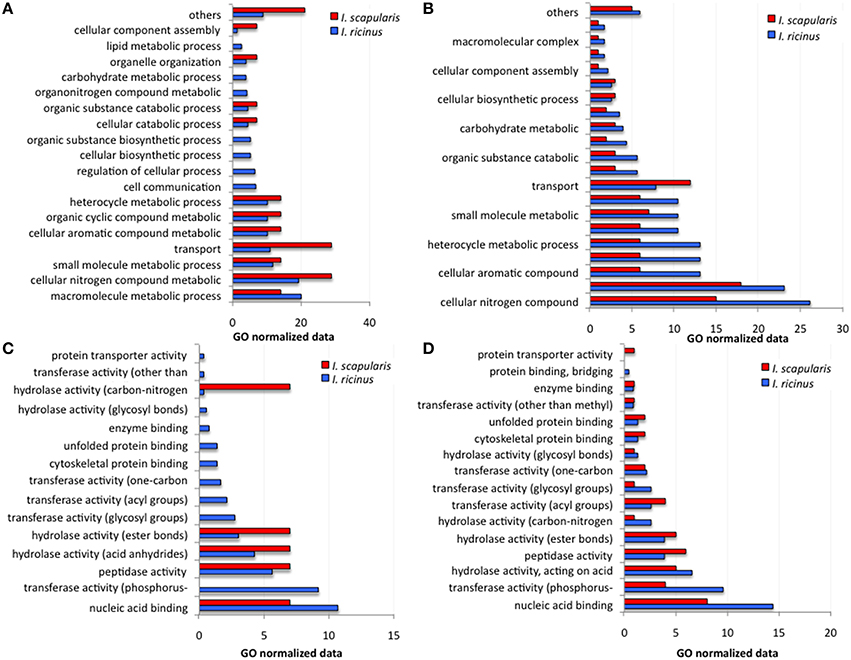
Figure 4. GO normalized data for differentially expressed genes in response to A. phagocytophilum infection of I. ricinus IRE/CTVM20 and I. scapularis ISE6 cells. (A) BP for upregulated genes. (B) BP for downregulated genes. (C) MF for upregulated genes. (D) MF for downregulated genes. For all BP and MF categories in both upregulated and downregulated genes, values were compared between tick cell lines by Chi2 test and resulted in significant differences at p < 0.01 for all except for MF of downregulated genes in which differences were not significant between both tick cell lines.
Focusing on the most upregulated and downregulated genes in response to A. phagocytophilum infection, similarities and differences were found between I. ricinus IRE/CTVM20 and I. scapularis ISE6 cells. For example, the gene coding for Voltage-gated ion channel was among the upregulated genes in both tick cell lines (number of sequences = 2; FE>5; p = 7.8E-03; Table 1). It has been reported that changes in intracellular ion concentrations is required for the activation and function of apoptosis but also that ionic homoeostasis is essential in response to changes in extracellular environment (Hoffmann et al., 2009; Bortner and Cidlowski, 2014). Therefore, upregulation of the Voltage-gated ion channel was probably a of tick cell response to infection. In other organisms, Voltage-gated calcium channels play an important role in pathogen infection (Gupta et al., 2009; Lavanya et al., 2013). In ticks, Voltage-gated calcium channel levels could be manipulated by A. phagocytophilum to regulate key intracellular second messengers such as calcium to evade protective immune responses or protein exocytosis favoring pathogen transmission (Maritz-Olivier et al., 2005). However, most of the highly upregulated (Figures 5A,B) and downregulated (Figures 5C,D) genes showed a significantly different FE (p ≤ 0.05) between I. ricinus IRE/CTVM20 and I. scapularis ISE6 cells.
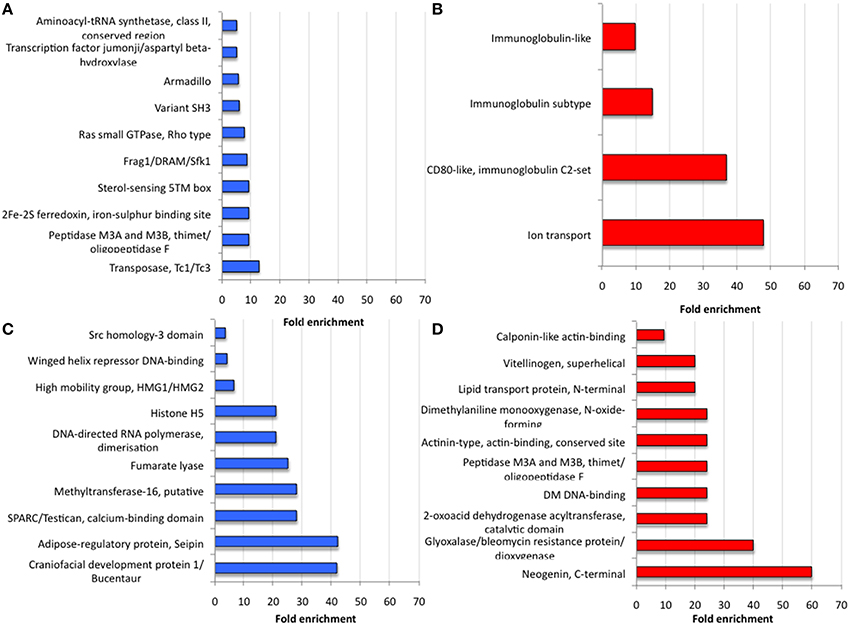
Figure 5. Analysis of most differentially expressed genes in response to A. phagocytophilum infection of I. ricinus IRE/CTVM20 and I. scapularis ISE6 cells. (A) Proteins encoded by the 10 most upregulated genes in I. ricinus IRE/CTVM20 cells. (B) Proteins encoded by the 4 most upregulated genes in I. scapularis ISE6 cells. (C) Proteins encoded by the 10 most downregulated genes in I. ricinus IRE/CTVM20 cells. (D) Proteins encoded by the 10 most downregulated genes in I. scapularis ISE6 cells. The InterPro motifs obtained using DAVID were used to evaluate the fold enrichment of differentially expressed genes in the corresponding tick cell line (p ≤ 0.05).
Tissue-Specific Signatures in Transcriptional Response to A. phagocytophilum Infection in I. scapularis ISE6 and I. ricinus IRE/CTVM20 Cells
These results showed functionally relevant differences in the response of I. ricinus IRE/CTVM20 and I. scapularis ISE6 cells to A. phagocytophilum infection. Tick cell lines are a valuable tool for the study of tick biology and tick-pathogen interactions (Bell-Sakyi et al., 2007; Villar et al., 2015a,b; Weisheit et al., 2015). However, differences have been reported between in vivo and in vitro experiments, probably associated with differences in the cell populations represented in different cell lines (Munderloh et al., 1994; Alberdi et al., 2015; Villar et al., 2015a; Weisheit et al., 2015).
The I. scapularis ISE6 cells, which constitute a model for hemocytes involved in pathogen infection and immune response (Munderloh et al., 1994), produce hemolymph effector proteins associated with tick hemocytes and involved in A. phagocytophilum infection such as P11 and the related protein B7P9I7, Defensins, Complement-like molecules, and Antimicrobial peptides (Villar et al., 2015a). As expected, the results of the present study correlated with those reported previously using integrated metabolomics, transcriptomics, and proteomics data (Villar et al., 2015a) in which cellular processes such as immune response, protein processing and glucose metabolism were affected by A. phagocytophilum infection of I. scapularis ISE6 cells (Figures 5B,D). Furthermore, among the most abundant transcripts differentially expressed in infected I. scapularis ISE6 cells were those encoding Vitellinogen, Lipid transport protein, Monooxygenase, and Immunoglobulin-like proteins that have been previously described in tick hemolymph (Gudderra et al., 2002; Kadota et al., 2002; Figures 5B,D). Therefore, the transcriptional response of ISE6 cells to A. phagocytophilum infection may be similar to that observed in tick hemocytes, thus supporting a tissue-specific signature for ISE6 cells (Villar et al., 2015a).
In order to define a tissue-specific signature for the transcriptional response of I. ricinus IRE/CTVM20 cells to A. phagocytophilum infection, a preliminary analysis was undertaken by comparing the expression of genes differentially expressed in both cell lines with that reported previously in I. scapularis tick samples (Ayllón et al., 2015a; Figure 6). The results demonstrated that in infected I. ricinus IRE/CTVM20 cells, 22, 28, and 6% of the genes had a similar response to that in infected tick nymphs, midguts and salivary glands, respectively. In infected I. scapularis ISE6 cells, 36, 17, and 11% of the genes had a similar response to that in infected tick nymphs, midguts and salivary glands, respectively. Furthermore, the proteins encoded by highly upregulated and downregulated genes in response to A. phagocytophilum infection in I. ricinus IRE/CTVM20 cells had MF associated with catalytic activity, binding, and structural molecules (Figures 5A,C), which were also identified in tick midguts in response to infection (Ayllón et al., 2015a). These results suggested that while I. ricinus IRE/CTVM20 cells responded to infection more like tick midguts, I. scapularis ISE6 cells response to infection appeared more closely related to that in nymphs, the only sample in which hemolymph containing tick hemocytes was present.
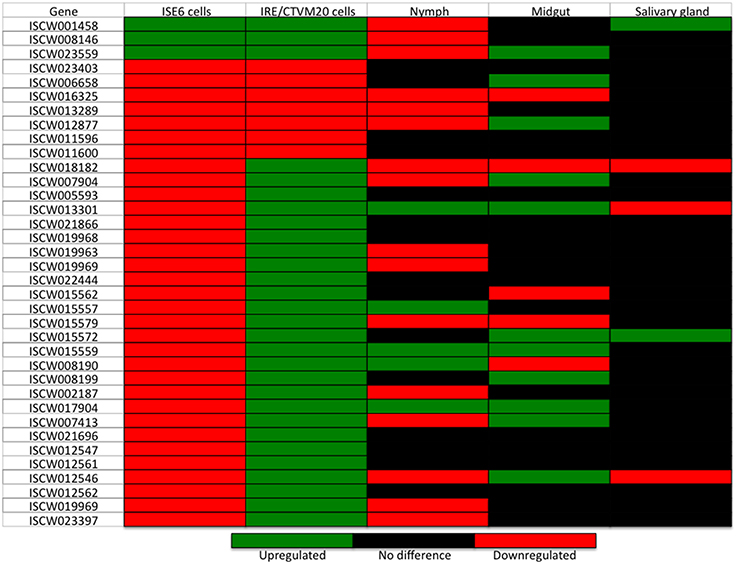
Figure 6. Transcriptional profile of genes differentially expressed in both A. phagocytophilum-infected I. ricinus IRE/CTVM20 and I. scapularis ISE6 cells and in comparison with infected tick samples. Differential expression (p ≤ 0.05; q ≤ 0.05) is shown for I. scapularis ISE6 cells, I. ricinus IRE/CTVM20 cells, and I. scapularis nymphs and adult midguts and salivary glands. Data for tick samples was obtained from Ayllón et al. (2015a).
The Inhibition of Tick Cell Apoptosis by A. phagocytophilum Correlates with Tissue-Specific Signatures in Transcriptional Response to Infection in I. scapularis ISE6 and I. ricinus IRE/CTVM20 Cells
The inhibition of cell apoptosis by A. phagocytophilum appears to be a key adaptation mechanism to facilitate infection of both vertebrate and tick cells and was used to investigate further the tissue-specific response of tick cell lines to pathogen infection (Ayllón et al., 2013, 2015a; Severo et al., 2015; Villar et al., 2015a; de la Fuente et al., 2016).
As previously reported in I. scapularis ISE6 tick cells (Ayllón et al., 2013; Alberdi et al., 2015; Villar et al., 2015a), A. phagocytophilum infection inhibits tick cell apoptosis through different mechanisms including downregulation of porin expression resulting in lower Cytochrome c protein levels as a mechanism to inhibit the intrinsic apoptosis pathway and facilitate infection (Figure 7A). Although not identified previously in I. scapularis nymphs or adult female midguts and salivary glands in response to A. phagocytophilum infection (Ayllón et al., 2013), downregulation of neogenin (ISCW023402) in ISE6 tick cells (Figure 5D and Supplementary Table 2) suggested a new mechanism by which bacterial infection inhibits apoptosis to facilitate infection (Matsunaga et al., 2004). However, in I. ricinus IRE/CTVM20 cells the inhibition of apoptosis appeared to be regulated by lower Caspase (CASP) protein levels in infected tick cells (Alberdi et al., 2015).
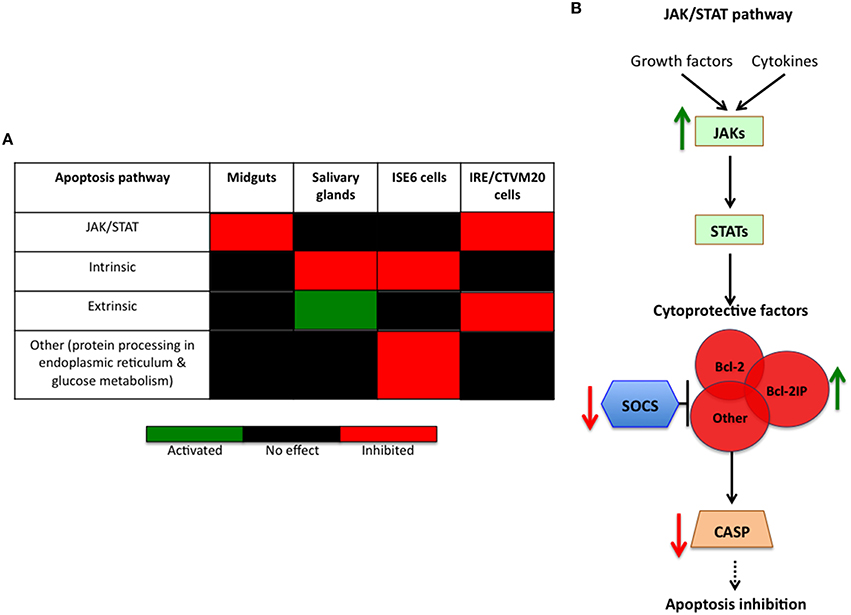
Figure 7. Tissue-specific signatures in the inhibition of tick cell apoptosis by A. phagocytophilum. (A) Tissue-specific response in the inhibition of tick cell apoptosis by A. phagocytophilum. The annotation of JAK/STAT pathway genes and the effect of A. phagocytophilum infection on tick tissue response were obtained from previous reports (Ayllón et al., 2015a; Villar et al., 2015a). (B) Schematic representation of the effect of A. phagocytophilum on the inhibition of the JAK/STAT pathway to establish infection in I. ricinus IRE/CTVM20 cells. In infected I. ricinus IRE/CTVM20 cells, transcriptomics results reported here showed upregulation of JAKs resulting in activation of the JAK/STAT pathway. Additionally, downregulation of SOCS enhances the effect of induced cytoprotective factors such as Bcl-2IP, which in turn reduce CASP expression to inhibit apoptosis.
To further characterize apoptosis inhibition by A. phagocytophilum in I. ricinus IRE/CTVM20 cells, the transcriptional profile of apoptosis pathway genes was obtained from RNAseq data. The results showed downregulation of suppressor of cytokine signaling (SOCS; ISCW019429) and upregulation of Janus kinase (JAK; ISCW016145) involved in activation of the Janus kinase/signal transducers and activators of transcription (JAK/STAT) pathway, upregulation of fatty acid synthase (FAS; ISCW009053) implicated in the extrinsic apoptosis pathway, and upregulation of cytochrome c (CYTC; ISCW008740) and bcl-2 interacting protein (Bcl-2IP; ISCW008098) of the intrinsic apoptosis pathway (Supplementary Table 5).
These results did not support a role for the intrinsic pathway in the inhibition of cell apoptosis by A. phagocytophilum infection of I. ricinus IRE/CTVM20 cells, a mechanism previously described in I. scapularis tick salivary glands and ISE6 cells (Ayllón et al., 2013, 2015a; Alberdi et al., 2015; Figure 7A). In contrast, the results in I. ricinus IRE/CTVM20 cells were similar to those obtained in I. scapularis midguts after infection with A. phagocytophilum (Ayllón et al., 2015a) which together with previous results in tick cells (Alberdi et al., 2015) suggested a role for the JAK/STAT pathway in the inhibition of apoptosis in I. ricinus IRE/CTVM20 infected cells (Negoro et al., 2000; Croker et al., 2008; Figure 7A). In I. ricinus IRE/CTVM20 cells, A. phagocytophilum infection resulted in the upregulation of JAK probably inducing the activation of the JAK/STAT pathway. Additionally, downregulation of SOCS may enhanced the effect of induced cytoprotective factors such as Bcl-2IP, which in turn could reduced CASP expression to inhibit apoptosis (Figure 7B). Additionally, the upregulation of fatty acid synthase suggested a possible effect of A. phagocytophilum infection on the inhibition of the extrinsic apoptosis pathway (Figure 7A), but additional experiments are required to support this result.
Conclusions
The results obtained in the present study provided support for our hypothesis and suggested the presence of tissue-specific signatures in tick cell line response to A. phagocytophilum infection. The transcriptional response to infection of I. scapularis ISE6 cells resembled that of tick hemocytes while the response in I. ricinus IRE/CTVM20 was more closely related to that reported previously in infected tick midguts. Tick infection by A. phagocytophilum results in the inhibition of cell apoptosis to facilitate pathogen infection and multiplication and was therefore used to investigate further the tissue-specific response of tick cell lines to pathogen infection. The results supported a role for the intrinsic pathway in the inhibition of cell apoptosis by A. phagocytophilum infection of I. scapularis ISE6 cells. In contrast, the results in I. ricinus IRE/CTVM20 cells were similar to those obtained in tick midguts and suggested a role for the JAK/STAT pathway in the inhibition of apoptosis in tick cells infected with A. phagocytophilum. However, tick cell lines were derived from embryonated eggs and may contain various cell populations with different morphology and behavior that could affect transcriptional response to infection (Munderloh et al., 1994; Bell-Sakyi et al., 2007). Furthermore, studies comparing infected I. scapularis and I. ricinus ticks are needed to fully address possible differences between tick species in response to A. phagocytophilum infection. Nevertheless, the results reported here support the use of tick cell lines as models to study tissue-specific response to pathogen infection.
Author Contributions
JF, NJ, AF conceived the experiment. PA, KM, RR, CC, NA, MV conducted the experiments. JF, KM, RR, NJ, AF wrote the paper.
Funding
This research was supported by grant BFU2011-23896 from Ministerio de Economía y Competitividad (MINECO), Spain and the European Union FP7 ANTIGONE project number 278976. NA was funded by MINECO, Spain. LMH was supported by a fellowship from the University of Castilla La Mancha (UCLM), Spain. MV was supported by the Research Plan of UCLM, Spain.
Conflict of Interest Statement
The authors declare that the research was conducted in the absence of any commercial or financial relationships that could be construed as a potential conflict of interest.
Acknowledgments
We would like to acknowledge the assistance of Richard Ellis (APHA) for Illumina sequencing and to thank Ulrike Munderloh (University of Minnesota, USA) and Lesley Bell-Sakyi (Tick Cell Biobank, Pirbright Institute, UK) for providing tick cell lines ISE6 and IRE/CTVM20.
Supplementary Material
The Supplementary Material for this article can be found online at: https://www.frontiersin.org/article/10.3389/fcimb.2016.00020
Supplementary Table 1. Sequences of oligonucleotide primers used for real-time RT-PCR. pdf.
Supplementary Table 2. Differentially expressed genes in I. scapularis ISE6 cells. xlsx.
Supplementary Table 3. RNAseq statistics for I. ricinus IRE/CTVM20 cells. pdf.
Supplementary Table 4. Transcriptomics results for I. ricinus IRECTVM20 cells. xlsx.
Supplementary Table 5. Differentially expressed genes in I. ricinus IRECTVM20 cells. xlsx.
References
Alberdi, P., Ayllón, N., Cabezas-Cruz, A., Bell-Sakyi, L., Zweygarth, E., Stuen, S., et al. (2015). Infection of Ixodes spp. tick cells with different Anaplasma phagocytophilum isolates induces the inhibition of apoptotic cell death. Ticks Tick Borne Dis. 6, 758–767. doi: 10.1016/j.ttbdis.2015.07.001
Ayllón, N., Naranjo, V., Hajdušek, O., Villar, M., Galindo, R. C., Kocan, K. M., et al. (2015b). Nuclease Tudor-SN is involved in tick dsRNA-mediated RNA interference and feeding but not in defense against flaviviral or Anaplasma phagocytophilum rickettsial infection. PLoS ONE 10:e0133038. doi: 10.1371/journal.pone.0133038
Ayllón, N., Villar, M., Busby, A. T., Kocan, K. M., Blouin, E. F., Bonzón-Kulichenko, E., et al. (2013). Anaplasma phagocytophilum inhibits apoptosis and promotes cytoskeleton rearrangement for infection of tick cells. Infect. Immun. 81, 2415–2425. doi: 10.1128/IAI.00194-13
Ayllón, N., Villar, V., Galindo, R. C., Kocan, K. M., Šíma, R., López, J. A., et al. (2015a). Systems biology of tissue-specific response to Anaplasma phagocytophilum reveals differentiated apoptosis in the tick vector Ixodes scapularis. PLoS Genet. 11:e1005120. doi: 10.1371/journal.pgen.1005120
Bell-Sakyi, L., Zweygarth, E., Blouin, E. F., Gould, E. A., and Jongejan, F. (2007). Tick cell lines: tools for tick and tick-borne disease research. Trends Parasitol. 23, 450–457. doi: 10.1016/j.pt.2007.07.009
Bortner, C. D., and Cidlowski, J. A. (2014). Ion channels and apoptosis in cancer. Philos. Trans. R. Soc. Lond. B Biol. Sci. 369:20130104. doi: 10.1098/rstb.2013.0104
Croker, B. A., Kiu, H., and Nicholson, S. E. (2008). SOCS regulation of the JAK/STAT signaling pathway. Semin. Cell Dev. Biol. 19, 414–422. doi: 10.1016/j.semcdb.2008.07.010
de la Fuente, J., Estrada-Peña, A., Cabezas-Cruz, A., and Kocan, K. M. (2016). Anaplasma phagocytophilum uses common strategies for infection of ticks and vertebrate hosts. Trends Microbiol. doi: 10.1016/j.tim.2015.12.001. [Epub ahead of print].
Dyachenko, V., Geiger, C., Pantchev, N., Majzoub, M., Bell-Sakyi, L., Krupka, I., et al. (2013). Isolation of canine Anaplasma phagocytophilum strains from clinical blood samples using the Ixodes ricinus cell line IRE/CTVM20. Vet. Microbiol. 162, 980–986. doi: 10.1016/j.vetmic.2012.10.021
Estrada-Peña, A., de la Fuente, J., Ostfeld, R. S., and Cabezas-Cruz, A. (2015). Interactions between tick and transmitted pathogens evolved to minimise competition through nested and coherent networks. Sci. Rep. 5:10361. doi: 10.1038/srep10361
Estrada-Peña, A., Ostfeld, R. S., Peterson, A. T., Poulin, R., and de la Fuente, J. (2014). Effects of environmental change on zoonotic disease risk: an ecological primer. Trends Parasitol. 30, 205–214. doi: 10.1016/j.pt.2014.02.003
Genomic Resources Development Consortium, Contreras, M., de la Fuente, J., Estrada-Peña, A., Grubhoffer, L., and Tobes, R. (2014). Genomic Resources Notes accepted 1 April 2014 – 31 May 2014. Mol. Ecol. Resour. 14:1095. doi: 10.1111/1755-0998.12298
Geraci, N. S., Spencer Johnston, J., Robinson, J. P., Wikel, S. K., and Hill, C. A. (2007). Variation in genome size of argasid and ixodid ticks. Insect. Biochem. Mol. Biol. 37, 399–408. doi: 10.1016/j.ibmb.2006.12.007
Goodman, J. L. (2005). “Human granulocytic anaplasmosis,” in Tick-borne Diseases of Humans, eds J. L. Goodman, D. T. Dennis, D. E. Sonenshine (Washington, DC: ASM Press), 218–238.
Gudderra, N. P., Sonenshine, D. E., Apperson, C. S., and Roe, R. M. (2002). Hemolymph proteins in ticks. J. Insect Physiol. 48, 269–278. doi: 10.1016/S0022-1910(02)00050-1
Gupta, S., Salam, N., Srivastava, V., Singla, R., Behera, D., Khayyam, K. U., et al. (2009). Voltage gated calcium channels negatively regulate protective immunity to Mycobacterium tuberculosis. PLoS ONE 4:e5305. doi: 10.1016/S0022-1910(02)00050-1
Hoffmann, E. K., Lambert, I. H., and Pedersen, S. F. (2009). Physiology of cell volume regulation in vertebrates. Physiol. Rev. 89, 193–277. doi: 10.1152/physrev.00037.2007
Kadota, K., Satoh, E., Ochiai, M., Inoue, N., Tsuji, N., Igarashi, I., et al. (2002). Existence of phenol oxidase in the argasid tick Ornithodoros moubata. Parasitol. Res. 88, 781–784. doi: 10.1007/s00436-002-0664-x
Lavanya, M., Cuevas, C. D., Thomas, M., Cherry, S., and Ross, S. R. (2013). siRNA screen for genes that affect Junín virus entry uncovers voltage-gated calcium channels as a therapeutic target. Sci. Transl. Med. 5:204ra131. doi: 10.1126/scitranslmed.3006827
Maritz-Olivier, C., Louw, A. I., and Neitz, A. W. (2005). Similar mechanisms regulate protein exocytosis from the salivary glands of ixodid and argasid ticks. J. Insect Physiol. 51, 1390–1396. doi: 10.1016/j.jinsphys.2005.08.012
Matsunaga, E., Tauszig-Delamasure, S., Monnier, P. P., Mueller, B. K., Strittmatter, S. M., Mehlen, P., et al. (2004). RGM and its receptor neogenin regulate neuronal survival. Nat. Cell Biol. 6, 749–755. doi: 10.1038/ncb1157
Munderloh, U. G., and Kurtti, T. J. (1989). Formulation of medium for tick cell culture. Exp. Appl. Acarol. 7, 219–229. doi: 10.1007/BF01194061
Munderloh, U. G., Liu, Y., Wang, M., Chen, C., and Kurtti, T. J. (1994). Establishment, maintenance and description of cell lines from the tick Ixodes scapularis. J. Parasitol. 80, 533–543. doi: 10.2307/3283188
Negoro, S., Kunisada, K., Tone, E., Funamoto, M., Oh, H., Kishimoto, T., et al. (2000). Activation of JAK/STAT pathway transduces cytoprotective signal in rat acute myocardial infarction. Cardiovasc. Res. 47, 797–805. doi: 10.1016/S0008-6363(00)00138-3
Pedra, J. H., Narasimhan, S., Rendić, D., DePonte, K., Bell-Sakyi, L., Wilson, I. B., et al. (2010). Fucosylation enhances colonization of ticks by Anaplasma phagocytophilum. Cell. Microbiol. 12, 1222–1234. doi: 10.1111/j.1462-5822.2010.01464.x
Schwarz, A., von Reumont, B. M., Erhart, J., Chagas, A. C., Ribeiro, J. M., and Kotsyfakis, M. (2013). De novo Ixodes ricinus salivary gland transcriptome analysis using two next-generation sequencing methodologies. FASEB J. 27, 4745–4756. doi: 10.1096/fj.13-232140
Severo, M. S., Pedra, J. H. F., Ayllón, N., Kocan, K. M., and de la Fuente, J. (2015). “Anaplasma,” in Molecular Medical Microbiology, 2nd Edn., eds Y. W. Tang, M. Sussman, D. Liu, I. Poxton, and J. Schwartzman (New York, NY: Academic Press; Elsevier), 2033–2042.
Stuen, S. (2007). Anaplasma phagocytophilum - the most widespread tick-borne infection in animals in Europe. Vet. Res. Commun. 31, 79–84. doi: 10.1007/s11259-007-0071-y
Villar, M., Ayllón, N., Alberdi, P., Moreno, A., Moreno, M., Tobes, R., et al. (2015a). Integrated metabolomics, transcriptomics and proteomics identifies metabolic pathways affected by Anaplasma phagocytophilum infection in tick cells. Mol. Cell. Proteomics 14, 3154–3172. doi: 10.1074/mcp.M115.051938
Villar, M., Ayllón, N., Kocan, K. M., Bonzón-Kulichenko, E., Alberdi, P., Blouin, E. F., et al. (2015b). Identification and characterization of Anaplasma phagocytophilum proteins involved in infection of the tick vector, Ixodes scapularis. PLoS ONE 10:e0137237. doi: 10.1371/journal.pone.0137237
Weisheit, S., Villar, M., Tykalová, H., Popara, M., Loecherbach, J., Watson, M., et al. (2015). Ixodes scapularis and Ixodes ricinus tick cell lines respond to infection with tick-borne encephalitis virus: transcriptomic and proteomic analysis. Parasit. Vectors 8, 599. doi: 10.1186/s13071-015-1210-x
Keywords: transcriptomics, tick, rickettsia, anaplasma, apoptosis, tick cell line
Citation: Alberdi P, Mansfield KL, Manzano-Román R, Cook C, Ayllón N, Villar M, Johnson N, Fooks AR and de la Fuente J (2016) Tissue-Specific Signatures in the Transcriptional Response to Anaplasma phagocytophilum Infection of Ixodes scapularis and Ixodes ricinus Tick Cell Lines. Front. Cell. Infect. Microbiol. 6:20. doi: 10.3389/fcimb.2016.00020
Received: 23 November 2015; Accepted: 26 January 2016;
Published: 10 February 2016.
Edited by:
Damien F. Meyer, Centre de Coopération Internationale en Recherche Agronomique pour le Développement, FranceReviewed by:
Daniel E. Voth, University of Arkansas for Medical Sciences, USAJere W. McBride, University of Texas Medical Branch, USA
Copyright © 2016 Alberdi, Mansfield, Manzano-Román, Cook, Ayllón, Villar, Johnson, Fooks and de la Fuente. This is an open-access article distributed under the terms of the Creative Commons Attribution License (CC BY). The use, distribution or reproduction in other forums is permitted, provided the original author(s) or licensor are credited and that the original publication in this journal is cited, in accordance with accepted academic practice. No use, distribution or reproduction is permitted which does not comply with these terms.
*Correspondence: José de la Fuente, jose_delafuente@yahoo.com
†These authors have contributed equally to this work.