No evidence of a causal relationship between plasma homocysteine and type 2 diabetes: a Mendelian randomization study
 Jitender Kumar
 Erik Ingelsson
 Lars Lind2
  Tove Fall
- 1Molecular Epidemiology and Science for Life Laboratory, Department of Medical Sciences, Uppsala University, Uppsala, Sweden
- 2Cardiovascular Epidemiology, Department of Medical Sciences, Uppsala University, Uppsala, Sweden
Background: Several observational studies have shown an association between increased circulating homocysteine and risk of type 2 diabetes (T2D). We aimed to assess whether this relation is causal using genetic data from large populations of individuals of European descent.
Methods: We investigated the association between homocysteine concentrations and blood glucose, plasma insulin, T2D in the Prospective Investigation of the Vasculature in Uppsala Seniors (PIVUS) cohort (n = 1,016). A score of five previously published single nucleotide polymorphisms (SNPs) from genes involved in homocysteine metabolism were utilized as genetic instrument for homocysteine concentrations. The effect estimate of this genetic score with T2D was determined using results from the DIAbetes Genetics Replication And Meta-analysis (DIAGRAM) consortium (including 34,840 cases and 114,981 controls). Further, the effects of the genetic score with fasting glucose and insulin were determined using results from the Meta-Analyses of Glucose and Insulin-related traits Consortium (MAGIC) (up to 38,238 non-diabetic participants).
Results: The genetic score provided a strong instrument for homocysteine concentrations (P = 2.7 × 10−143, F = 650). In the PIVUS cohort, we found an association of homocysteine with fasting insulin [β = 0.056 (95% CI 0.021, 0.090), P = 0.001], but not with incident diabetes. We did not find any evidence of a causal effect of homocysteine on fasting glucose, fasting insulin, or T2D (P > 0.05 for all analyses) when using data from DIAGRAM or MAGIC studies.
Conclusion: No evidence of a causal relationship of levels of plasma homocysteine with fasting glucose, fasting insulin, or T2D was observed.
Introduction
Type 2 diabetes (T2D) is one of the most prevalent metabolic diseases and has already reached epidemic proportion in many countries (1). A multitude of factors (both genetic and environmental) contribute to the pathogenesis of T2D (2–4). If not treated adequately, eventual outcomes due to diabetic complications may be potentially devastating as almost 75% of T2D patients die due to cardiovascular complications (5).
Homocysteine (Hcy) is a sulfur-containing amino acid and is generated from the breakdown of the dietary amino acid methionine (6). Different enzymes, encoded by genes in the Hcy metabolism pathway, play an important role in regulating the levels of Hcy. Several candidate and genome-wide association studies have shown a number of single nucleotide polymorphisms (SNPs) associated with modulated levels of Hcy, many of these within or close to genes implicated in the Hcy metabolic pathway (6–11). Further, dietary factors such as vitamin B12 and folate also play important roles in maintaining optimum level of Hcy (6).
Elevated level of Hcy (hyperhomocysteinemia) has been shown to be a risk factor for cardiovascular diseases and T2D development (12, 13). Many studies have also shown association between increased levels of Hcy with T2D-associated features such as impaired beta-cell function and insulin resistance (3, 14, 15). These adverse outcomes in response to hyperhomocysteinemia have been suggested to be related to various mechanisms such as oxidative stress and inflammation, contributing components of T2D pathogenesis (6, 16).
In Mendelian randomization (MR) study designs, one or several genetic variants, usually SNPs, associated with exposure to a modifiable risk factor are used as instrumental variables (IV) to provide unbiased estimates of the causal relationship of the exposure to the risk factor (here Hcy) with an outcome of interest (here T2D and related traits) (17). Previous MR studies have provided conflicting results about causal effect of Hcy on T2D (18–20).
We applied an MR framework utilizing results from the genome-wide association study (GWAS) meta-analysis including up to 34,840 T2D cases (21) and up to 46,186 individuals of European descent (22) with T2D intermediate trait measures to assess the potential causal relationship between Hcy and diabetes and related traits. We used data from a population-based study to compare estimates derived from causal analyses with estimates derived from conventional analyses.
Materials and Methods
Materials
Prospective investigation of the vasculature in uppsala seniors
We used data from the Prospective Investigation of the Vasculature in Uppsala Seniors (PIVUS) study for assessing the association of Hcy with diabetes and diabetes-related traits. The PIVUS study has been described in detail elsewhere (23). Briefly, all subjects aged 70 years living in Uppsala, Sweden were eligible. The subjects were chosen from the community register and invited in a randomized order from the start of the study in April 2001 to the last included subject in June 2004. Of the 2,025 subjects invited, 1,016 subjects (507 men and 509 women) agreed to participate and were included in the study. All the participants gave their written informed consent and the Ethics committee of Uppsala University, Uppsala approved the study. Participants underwent health assessment including questionnaires, clinical examinations, and a detailed biochemical panel. Participants underwent subsequent examinations at ages 75 and 80 years. During the visit at age 80 years, all medical records were screened for diagnosis of diabetes. Biochemical profiling of blood samples collected at baseline (age 70 years) was performed at the University Hospital, Uppsala, Sweden. Plasma insulin was measured with a chemiluminescence assay (Roche, Basel, Switzerland). Fasting blood glucose was measured in whole blood utilizing HemoCue instrument (HemoCue, Ängelholm, Sweden) following manufacturer’s recommendation and recalibrated to plasma concentrations by multiplying with a factor of 1.11. Diabetes was defined as a doctor-diagnosed history of diabetes or a fasting blood glucose ≥7.0 mmol/l at the examination. Level of Hcy was measured using AxisVR Homocysteine Enzyme Immunoassay (Axis-Shield Diagnostics).
Genetic data
To create genetic instruments, we used results from the largest GWAS of Hcy levels based on meta-analysis of 44,147 individuals of European descent (11). In order to achieve a specific instrument and minimize the risk of pleiotropic effects, we excluded all SNPs mapped to genes outside the Hcy metabolism pathway, e.g., hepatocyte nuclear factor 1 homeobox A (HNF1A). Therefore, the final selection included five SNPs from three loci: 5,10-methylenetetrahydrofolate reductase (MTHFR), 5-methyltetrahydrofolate-homocysteine methyltransferase (MTR), and cystathionine-beta-synthase (CBS), where MTHFR and CBS contained two independent signals each. We assessed the results for the five selected SNPs from van Meurs et al., where effects (β) of each SNP were reported in the per-allele effect on lnHcy (SD-units). The effect estimates of each of the Hcy SNPs on T2D and diabetes-related traits were collected from GWAS meta-analysis results – the largest studies available with GWAS data. The effect on T2D risk was estimated by utilizing a study by DIAbetes Genetics Replication And Meta-analysis (DIAGRAM) consortium including 34,840 cases and 114,981 controls (21). We transformed reported odds ratios for T2D to lnOR scale for further analysis. The effect estimate of each Hcy SNP on measures of glucose homeostasis was based on associations with fasting glucose in up to 46,186 non-diabetic participants and fasting insulin in up to 38,238 non-diabetic participants from the Meta-Analyses of Glucose and Insulin-related traits Consortium (MAGIC) (22). Effects were reported on non-transformed scale for fasting glucose and on log-transformed scale for fasting insulin. The effect of each SNP is reported in Table 1.
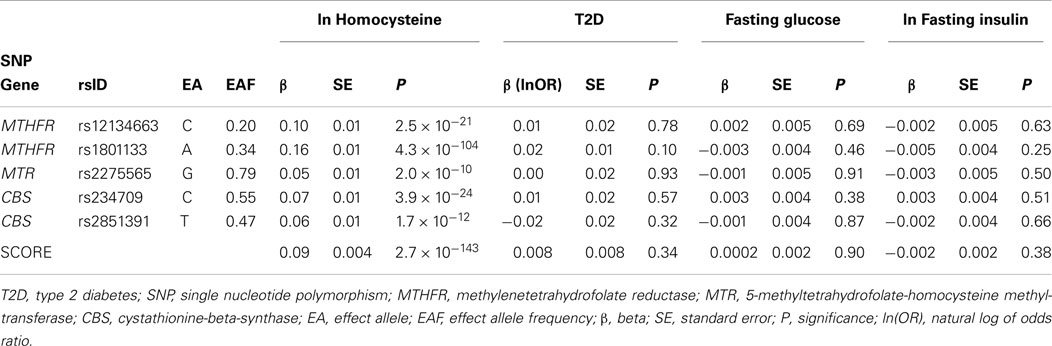
Table 1. Association of Hcy SNPs with diabetes and related traits, based on large genome-wide association studies.
Statistical Analysis
The association of Hcy plasma concentrations with T2D, fasting insulin, and fasting glucose
For all analyses in PIVUS, Hcy was transformed to the natural logarithmic scale and thereafter SD transformed. We assessed the association of Hcy with ln-transformed insulin and glucose in non-diabetic subjects from PIVUS using linear regression modeling with glycemic traits as the dependent variable adjusting for age and sex. We used a logistic regression model to assess the potential association with prevalent diabetes at baseline adjusting for age and sex. We assessed the association of Hcy with incident T2D using Cox proportional hazard models for time-to-T2D adjusting for age and sex. Subjects who died during the study period were censored. The assumption of proportional hazards was assessed by testing the associations of Schoenfeld residuals and time. We also performed secondary analysis in a subset of PIVUS samples where we tested whether adjusting for intake of vitamin B12 and folate were confounders of Hcy with prevalent (n = 853) and incident diabetes outcome (n = 750).
Association of genetic score with levels of Hcy
We identified the Hcy-increasing allele of each SNP in the data together with its reported effect from van Meurs et al. (11) and used the R-package “gtx” to estimate the combined effect of the genetic score (βscore_Hcy) on levels of Hcy based on the summary level data. Briefly, βscore_Hcy was calculated as where βi was the effect of the Hcy-increasing risk alleles on Hcy and si its corresponding standard error (24). The output of the equation gives an estimate of the per-allele increase in lnHcy of the genetic score.
Association of genetic score with T2D, fasting insulin, and fasting glucose
All analyses were performed using the Hcy-increasing allele as the effect allele. The effect of the non-weighted genetic score (βscore_outcome) on the outcomes of interest: T2D, fasting glucose, and fasting insulin, respectively, was calculated as where βi is the effect of the Hcy-increasing risk alleles on T2D or T2D-related trait and si its corresponding standard error using the R-package “gtx.”
Instrumental variable analyses
We used IV estimators to quantify the strength of causal association between Hcy and T2D, fasting glucose, and insulin. The estimator (βIV estimator) was found as a ratio between two regression coefficients determined from the genetic score analysis (Eq. 1): estimated genetic score on given outcome (βscore_outcome) and estimated genetic score effect on Hcy (βscore_Hcy).
The standard errors (SE) for the IV estimators were calculated using the delta method (Eq. 2), which we have previously evaluated for this purpose (25).
Results
The median age of study participants was 70.2 years and almost equal percentage of females and males were present.
The Association between Levels of Plasma Hcy and T2D, Fasting Insulin, and Fasting Glucose
The baseline characteristics of PIVUS participants are shown in Table 2. A total of 11% individuals were found to have hyperhomocysteinemia (levels of Hcy >15.0 μmol/L). One-hundred nineteen individuals had T2D at baseline. Seventy-two individuals developed T2D during 10 years follow-up. In our PIVUS cohort, we found no association between levels of Hcy at age 70 years with prevalent diabetes [odds ratio per SD-unit in ln-transformed Hcy, OR 0.98 (95% CI 0.80, 1.19), P = 0.80], incident T2D [hazard ratio, HR 0.79 (95% CI 0.62, 1.004), P-value 0.054], or with fasting glucose [β = −0.001 (95% CI −0.038, 0.036), P-value 0.96]. Further adjustment in the prevalent and incident diabetes models for intake of vitamin B12 and folate did not change the effect estimates of Hcy. A significant association was observed between levels of Hcy and ln fasting insulin [β = 0.056 (95% CI 0.021, 0.090), P-value 0.001], indicating that 1-SD-unit increase in the level of lnHcy was associated with 5.6% (e0.056) increase in fasting insulin (Table 3).
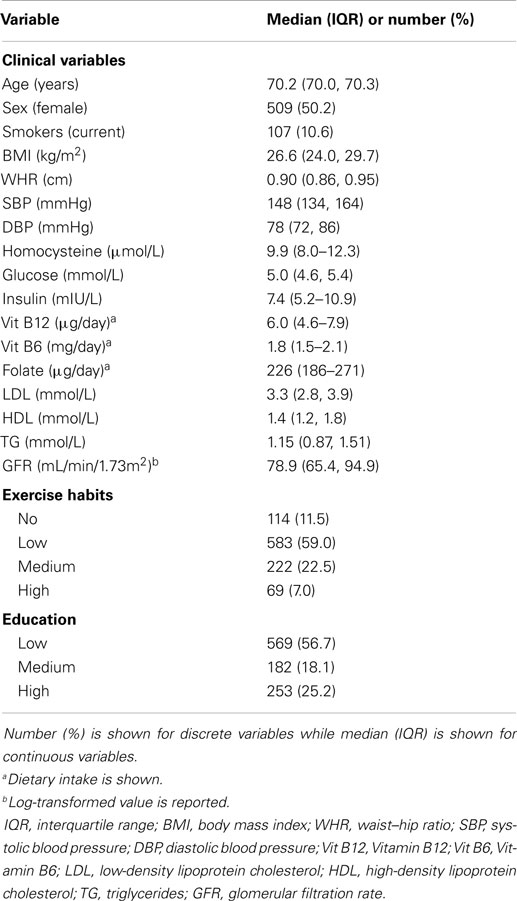
Table 2. Baseline characteristics of the PIVUS cohort (n = 1,016).
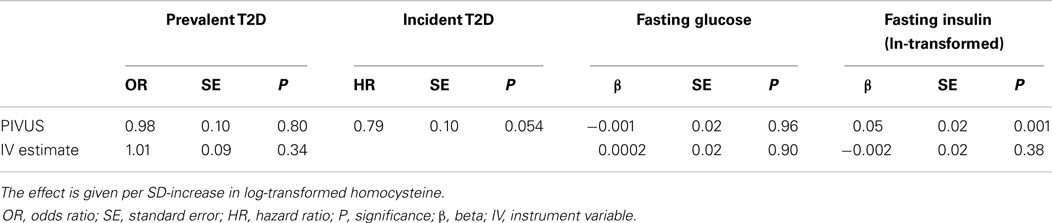
Table 3. The association of homocysteine with diabetes and related traits in the PIVUS cohort and in causal analysis using large genome-wide association studies.
The Association between Genetic Score and Levels of Plasma Hcy
We found a strong association between the genetic score and levels of plasma Hcy using the published genetic associations (11). We estimated that each allele of the score increased lnHcy with 0.092 SD (95% CI: 0.084, 0.100; P-value 2.7 × 10−143). The calculated F-statistics for the score was 650.
The Association between Genetic Score and T2D, Fasting Insulin, and Fasting Glucose
We did not find evidence for an association of the genetic score with T2D, fasting insulin, or fasting glucose. The estimated odds ratio for each additional allele of the genetic score was 1.01 (95% CI 0.99, 1.024; P-value 0.34) for T2D. The estimated per-allele effect of the genetic score on ln fasting insulin was −0.002 (95% CI −0.006, 0.002; P-value 0.38) and 0.0002 (95% CI −0.003, 0.004; P-value 0.90) for fasting glucose (Table 3).
Instrumental Variable Analyses
We did not find evidence for a causal association of levels of Hcy with T2D and related traits. The estimated causal odds ratio for each SD-increase in lnHcy was 1.09 (95% CI 0.92, 1.30; P-value 0.34) for T2D. The estimated causal effect for each SD-increase of Hcy on ln fasting insulin was −0.019 (95% CI −0.060, 0.023; P-value 0.335) and 0.002 (95% CI −0.037, 0.042; P-value 1) for fasting glucose (Table 3).
Discussion
In the present study, we did not observe any evidence of a causal relationship between genetically predicted homocysteine concentrations and T2D development. To the best of our knowledge, we have included the largest number of individuals with data on the effect of Hcy-related SNPs on fasting glucose, fasting insulin, and T2D.
Comparison with Previous Studies
Type 2 diabetes
Several observational studies have found hyperhomocysteinemia to be a risk factor for T2D and related complications (3, 15, 26). However, the results are contradictory and some studies have shown a null effect (27–29). Our observational data from PIVUS did not show evidence of increased risk for T2D with increasing levels of Hcy. On the contrary, our effect estimate was negative, although non-significant (P = 0.054). In a large, long-term randomized clinical trial by Song et al. involving 4,252 women at high risk for cardiovascular diseases, lowering Hcy levels through vitamin B6, B12, and folic acid did not reduce the risk of developing T2D (30). Another possibility to evaluate the possible causal connection of Hcy with T2D is the MR approach, where the association of Hcy-related genetic variants with T2D is evaluated, aiming to assess life-long exposure to augmented levels of Hcy. A recent MR study by Zhu et al. assessed whether the MTHFR C677T polymorphism is a risk factor for T2D in Chinese Han populations (19). The authors meta-analyzed 29 different case–control studies involving 4,656 T2D cases and 2,127 controls from Chinese population. They have found MTHFR C677T polymorphism to be a risk factor for T2D and thereby shown evidence in favor of a causal relation between Hcy and T2D. The variant allele (T) in MTHFR gene leads to the formation of thermolabile enzyme with reduced activity thereby increasing levels of Hcy (31). The distribution of MTHFR C677T polymorphism differs worldwide with Chinese having higher T allele frequency as compared to Europeans, Africans, or other Asian populations, such as Japanese and Indians (8, 32). Since the frequency of this polymorphism varies even within China, the samples were separated into two major groups (northern and southern) based on their region, but similar association results between the polymorphism and T2D were obtained. In a study by Huang et al., the authors collected data on the MTHFR C677T polymorphism, Hcy, and T2D in 4,011 T2D cases and 4,303 controls from published studies (20). The pooled data from 17 studies from different countries showed a significant association of MTHFR C677T polymorphism with levels of Hcy, as well as with T2D. However, the data were pooled for different ethnicities together and the authors reported significant heterogeneity among different study groups involved in meta-analysis. In another study by Zhong et al. involving 4,855 diabetic patients and 5,242 controls from different ethnic backgrounds (Asians, Europeans, and Africans), no association between the Hcy-increasing SNP MTHFR C677T and T2D was observed (18). Even in the repeated meta-analysis including individuals only from same ethnic group, similar results were obtained for Europeans and other populations thereby corroborating our results. The conflicting results obtained in our study as compared to the Chinese study have several possible explanations. Ethnic background of the study subjects is different and there can be variation in gene–environment interaction due to several environmental factors.
Fasting insulin
We observed a significant association between measured levels of plasma Hcy and fasting insulin in the PIVUS study. Several observational studies have shown association between Hcy and insulin resistance (3, 26, 33). In the Framingham offspring study, Meigs et al. studied 2,011 individuals without CVD or T2D, and observed significant association between hyperhomocysteinemia and hyperinsulinemia (3). The results obtained in the causal part of our study do not support the causal relation between homocysteine and fasting insulin concentrations, which indicates that the observed association between Hcy and insulin in PIVUS and other studies may be explained by either reverse causation or residual confounding.
Fasting glucose
We did not observe an association between level of Hcy and blood glucose, in the observational analyses in PIVUS, or in the IV analyses using large-scale data from the MAGIC consortium. Several other observational studies have been performed to understand the relation between Hcy and glucose (34–38). Our study corroborates the results obtained in earlier studies.
Strengths and limitations
The strengths of this study are the inclusion of a large number of individuals and the use of multiple SNPs from Hcy metabolism pathway in the causal analysis, which increases the statistical power of our study. To the best of our knowledge, this is the first MR study that has comprehensively evaluated the association of multiple SNPs from Hcy metabolism pathway with levels of fasting glucose, fasting insulin and T2D in large number of individuals. Although genetic variants in the gene hepatocyte nuclear factor 1-alpha (HNF1A) are associated with Hcy, we chose not to include it in the genetic IV, because of its function in the regulating expression of several liver and pancreatic-islet specific genes and its association with MODY type 3. Due to the regulating action of this gene on several other genes, pleiotropic effects may not be ruled out thereby making this gene unfavorable for inclusion into MR studies. Nevertheless, our study also have potential limitations, which are mainly connected to the validity of the assumptions underlying the causal interpretation within MR. There are three main assumptions for a MR study: (1) independence between the instrument and confounders, i.e., genotypes are randomized; (2) a reliable association between the genetic variant and intermediate phenotype; and (3) conditional independence between the genetic variant and the outcome, given the intermediate phenotype and the confounders, i.e., no pleiotropy. Neither the first nor the third assumption can be tested statistically in the observed data using single genotypes as IV, and conclusions about these have to be based on previous biological knowledge. In the present study, we have used only robustly associated SNPs from large GWAS that reside in genes from the Hcy metabolic pathway, and we therefore regard the instrument as specific and non-pleiotropic. The random distribution of genotypes in the population is the very basis of MR and could be violated if separate ethnic groups with different allele frequencies were analyzed together without accounting for the population substructure. In the present study, all association analysis was done using published GWAS of individuals of European descent. In these studies, extensive work has been made to identify and correct for population stratification. Concerning the reliability of the second assumption (association between genetic score and Hcy), the strength of the association was high.
Conclusion
In conclusion, although a strong association of Hcy with fasting insulin was noted in non-diabetics in observational analyses, we did not find any evidence of a causal link between Hcy with insulin, glucose, or T2D.
Conflict of Interest Statement
The authors declare that the research was conducted in the absence of any commercial or financial relationships that could be construed as a potential conflict of interest.
Acknowledgments
We would like to thank all the participants from PIVUS cohort, DIAGRAM consortium, and MAGIC consortium. Data on glycemic traits have been contributed by MAGIC investigators and have been downloaded from www.magicinvestigators.org. We would also like to acknowledge the DIAGRAM consortium investigators for free access to estimates of SNPs tested for association with T2D. JK was supported by a fellowship from “Åkerhams stiftelse för klinisk forskning” at Uppsala University, Uppsala, Sweden and Swedish Heart-Lung Foundation, Sweden.
References
1. Hu FB. Globalization of diabetes: the role of diet, lifestyle, and genes. Diabetes Care (2011) 34(6):1249–57. doi: 10.2337/dc11-0442
Pubmed Abstract | Pubmed Full Text | CrossRef Full Text | Google Scholar
2. Ley SH, Hamdy O, Mohan V, Hu FB. Prevention and management of type 2 diabetes: dietary components and nutritional strategies. Lancet (2014) 383(9933):1999–2007. doi:10.1016/S0140-6736(14)60613-9
Pubmed Abstract | Pubmed Full Text | CrossRef Full Text | Google Scholar
3. Meigs JB, Jacques PF, Selhub J, Singer DE, Nathan DM, Rifai N, et al. Fasting plasma homocysteine levels in the insulin resistance syndrome: the Framingham offspring study. Diabetes Care (2001) 24(8):1403–10. doi:10.2337/diacare.24.8.1403
Pubmed Abstract | Pubmed Full Text | CrossRef Full Text | Google Scholar
4. Meigs JB, Manning AK, Fox CS, Florez JC, Liu C, Cupples LA, et al. Genome-wide association with diabetes-related traits in the Framingham heart study. BMC Med Genet (2007) 8(Suppl 1):S16. doi:10.1186/1471-2350-8-S1-S16
Pubmed Abstract | Pubmed Full Text | CrossRef Full Text | Google Scholar
5. Grundy SM, Benjamin IJ, Burke GL, Chait A, Eckel RH, Howard BV, et al. Diabetes and cardiovascular disease: a statement for healthcare professionals from the American heart association. Circulation (1999) 100(10):1134–46. doi:10.1161/01.CIR.100.13.1481
Pubmed Abstract | Pubmed Full Text | CrossRef Full Text | Google Scholar
6. Selhub J. Homocysteine metabolism. Annu Rev Nutr (1999) 19:217–46. doi:10.1146/annurev.nutr.19.1.217
Pubmed Abstract | Pubmed Full Text | CrossRef Full Text | Google Scholar
7. Clarke R, Bennett DA, Parish S, Verhoef P, Dötsch-Klerk M, Lathrop M, et al. Homocysteine and coronary heart disease: meta-analysis of MTHFR case-control studies, avoiding publication bias. PLoS Med (2012) 9(2):e1001177. doi:10.1371/journal.pmed.1001177
Pubmed Abstract | Pubmed Full Text | CrossRef Full Text | Google Scholar
8. Kumar J, Garg G, Kumar A, Sundaramoorthy E, Sanapala KR, Ghosh S, et al. Single nucleotide polymorphisms in homocysteine metabolism pathway genes: association of CHDH A119C and MTHFR C677T with hyperhomocysteinemia. Circ Cardiovasc Genet (2009) 2(6):599–606. doi:10.1161/CIRCGENETICS.108.841411
Pubmed Abstract | Pubmed Full Text | CrossRef Full Text | Google Scholar
9. Paré G, Chasman DI, Parker AN, Zee RR, Mälarstig A, Seedorf U, et al. Novel associations of CPS1, MUT, NOX4, and DPEP1 with plasma homocysteine in a healthy population: a genome-wide evaluation of 13 974 participants in the women’s genome health study. Circ Cardiovasc Genet (2009) 2(2):142–50. doi:10.1161/CIRCGENETICS.108.829804
Pubmed Abstract | Pubmed Full Text | CrossRef Full Text | Google Scholar
10. Tanaka T, Scheet P, Giusti B, Bandinelli S, Piras MG, Usala G, et al. Genome-wide association study of vitamin B6, vitamin B12, folate, and homocysteine blood concentrations. Am J Hum Genet (2009) 84(4):477–82. doi:10.1016/j.ajhg.2009.02.011
Pubmed Abstract | Pubmed Full Text | CrossRef Full Text | Google Scholar
11. van Meurs JB, Pare G, Schwartz SM, Hazra A, Tanaka T, Vermeulen SH, et al. Common genetic loci influencing plasma homocysteine concentrations and their effect on risk of coronary artery disease. Am J Clin Nutr (2013) 98(3):668–76. doi:10.3945/ajcn.112.044545
Pubmed Abstract | Pubmed Full Text | CrossRef Full Text | Google Scholar
12. Hoogeveen EK, Kostense PJ, Jakobs C, Dekker JM, Nijpels G, Heine RJ, et al. Hyperhomocysteinemia increases risk of death, especially in type 2 diabetes: 5-year follow-up of the Hoorn Study. Circulation (2000) 101(13):1506–11. doi:10.1161/01.CIR.101.13.1506
Pubmed Abstract | Pubmed Full Text | CrossRef Full Text | Google Scholar
13. Hoogeveen EK, Kostense PJ, Beks PJ, Mackaay AJ, Jakobs C, Bouter LM, et al. Hyperhomocysteinemia is associated with an increased risk of cardiovascular disease, especially in non-insulin-dependent diabetes mellitus: a population-based study. Arterioscler Thromb Vasc Biol (1998) 18(1):133–8. doi:10.1161/01.ATV.18.1.133
Pubmed Abstract | Pubmed Full Text | CrossRef Full Text | Google Scholar
14. Patterson S, Flatt PR, Brennan L, Newsholme P, McClenaghan NH. Detrimental actions of metabolic syndrome risk factor, homocysteine, on pancreatic beta-cell glucose metabolism and insulin secretion. J Endocrinol (2006) 189(2):301–10. doi:10.1677/joe.1.06537
Pubmed Abstract | Pubmed Full Text | CrossRef Full Text | Google Scholar
15. Buysschaert M, Dramais AS, Wallemacq PE, Hermans MP. Hyperhomocysteinemia in type 2 diabetes: relationship to macroangiopathy, nephropathy, and insulin resistance. Diabetes Care (2000) 23(12):1816–22. doi:10.2337/diacare.23.12.1816
Pubmed Abstract | Pubmed Full Text | CrossRef Full Text | Google Scholar
16. McCully KS. Chemical pathology of homocysteine. IV. Excitotoxicity, oxidative stress, endothelial dysfunction, and inflammation. Ann Clin Lab Sci (2009) 39(3):219–32.
17. Sheehan NA, Didelez V, Burton PR, Tobin MD. Mendelian randomisation and causal inference in observational epidemiology. PLoS Med (2008) 5(8):e177. doi:10.1371/journal.pmed.0050177
18. Zhong JH, Rodriguez AC, Yang NN, Li LQ. Methylenetetrahydrofolate reductase gene polymorphism and risk of type 2 diabetes mellitus. PLoS One (2013) 8(9):e74521. doi:10.1371/journal.pone.0074521
Pubmed Abstract | Pubmed Full Text | CrossRef Full Text | Google Scholar
19. Zhu B, Wu X, Zhi X, Liu L, Zheng Q, Sun G. Methylenetetrahydrofolate reductase C677T polymorphism and Type 2 diabetes mellitus in Chinese population: a meta-analysis of 29 case-control studies. PLoS One (2014) 9(7):e102443. doi:10.1371/journal.pone.0102443
Pubmed Abstract | Pubmed Full Text | CrossRef Full Text | Google Scholar
20. Huang T, Ren J, Huang J, Li D. Association of homocysteine with type 2 diabetes: a meta-analysis implementing Mendelian randomization approach. BMC Genomics (2013) 14:867. doi:10.1186/1471-2164-14-867
Pubmed Abstract | Pubmed Full Text | CrossRef Full Text | Google Scholar
21. Morris AP, Voight BF, Teslovich TM, Ferreira T, Segrè AV, Steinthorsdottir V, et al. Large-scale association analysis provides insights into the genetic architecture and pathophysiology of type 2 diabetes. Nat Genet (2012) 44(9):981–90. doi:10.1038/ng.2383
Pubmed Abstract | Pubmed Full Text | CrossRef Full Text | Google Scholar
22. Dupuis J, Langenberg C, Prokopenko I, Saxena R, Soranzo N, Jackson AU, et al. New genetic loci implicated in fasting glucose homeostasis and their impact on type 2 diabetes risk. Nat Genet (2010) 42(2):105–16. doi:10.1038/ng.520
Pubmed Abstract | Pubmed Full Text | CrossRef Full Text | Google Scholar
23. Lind L, Fors N, Hall J, Marttala K, Stenborg A. A comparison of three different methods to evaluate endothelium-dependent vasodilation in the elderly: the prospective investigation of the vasculature in Uppsala seniors (PIVUS) study. Arterioscler Thromb Vasc Biol (2005) 25(11):2368–75. doi:10.1161/01.ATV.0000184769.22061.da
Pubmed Abstract | Pubmed Full Text | CrossRef Full Text | Google Scholar
24. Dastani Z, Johnson T, Kronenberg F, Nelson CP, Assimes TL, März W, et al. The shared allelic architecture of adiponectin levels and coronary artery disease. Atherosclerosis (2013) 229(1):145–8. doi:10.1016/j.atherosclerosis.2013.03.034
Pubmed Abstract | Pubmed Full Text | CrossRef Full Text | Google Scholar
25. Fall T, Hägg S, Mägi R, Ploner A, Fischer K, Horikoshi M, et al. The role of adiposity in cardiometabolic traits: a Mendelian randomization analysis. PLoS Med (2013) 10(6):e1001474. doi:10.1371/journal.pmed.1001474
Pubmed Abstract | Pubmed Full Text | CrossRef Full Text | Google Scholar
26. De Pergola G, Pannacciulli N, Zamboni M, Minenna A, Brocco G, Sciaraffia M, et al. Homocysteine plasma levels are independently associated with insulin resistance in normal weight, overweight and obese pre-menopausal women. Diabetes Nutr Metab (2001) 14(5):253–8.
27. Godsland IF, Rosankiewicz JR, Proudler AJ, Johnston DG. Plasma total homocysteine concentrations are unrelated to insulin sensitivity and components of the metabolic syndrome in healthy men. J Clin Endocrinol Metab (2001) 86(2):719–23. doi:10.1210/jcem.86.2.7213
Pubmed Abstract | Pubmed Full Text | CrossRef Full Text | Google Scholar
28. Pouwels MJ, Den Heijer M, Blom HJ, Tack CJ, Hermus AR. Improved insulin sensitivity and metabolic control in type 2 diabetes does not influence plasma homocysteine. Diabetes Care (2003) 26(5):1637–9. doi:10.2337/diacare.26.5.1637
29. Rosolova H, Simon J, Mayer O Jr, Racek J, Dierze T, Jacobsen DW. Unexpected inverse relationship between insulin resistance and serum homocysteine in healthy subjects. Physiol Res (2002) 51(1):93–8.
30. Song Y, Cook NR, Albert CM, Van Denburgh M, Manson JE. Effect of homocysteine-lowering treatment with folic Acid and B vitamins on risk of type 2 diabetes in women: a randomized, controlled trial. Diabetes (2009) 58(8):1921–8. doi:10.2337/db09-0087
31. Kang SS, Zhou J, Wong PW, Kowalisyn J, Strokosch G. Intermediate homocysteinemia: a thermolabile variant of methylenetetrahydrofolate reductase. Am J Hum Genet (1988) 43(4):414–21.
32. Yang B, Liu Y, Li Y, Fan S, Zhi X, Lu X, et al. Geographical distribution of MTHFR C677T, A1298C and MTRR A66G gene polymorphisms in China: findings from 15357 adults of Han nationality. PLoS One (2013) 8(3):e57917. doi:10.1371/journal.pone.0057917
Pubmed Abstract | Pubmed Full Text | CrossRef Full Text | Google Scholar
33. Giltay EJ, Hoogeveen EK, Elbers JM, Gooren LJ, Asscheman H, Stehouwer CD. Insulin resistance is associated with elevated plasma total homocysteine levels in healthy, non-obese subjects. Atherosclerosis (1998) 139(1):197–8.
34. Chao MC, Hu SL, Hsu HS, Davidson LE, Lin CH, Li CI, et al. Serum homocysteine level is positively associated with chronic kidney disease in a Taiwan Chinese population. J Nephrol (2014) 27(3):299–305. doi:10.1007/s40620-013-0037-9
Pubmed Abstract | Pubmed Full Text | CrossRef Full Text | Google Scholar
35. Vaya A, Carmona P, Badia N, Perez R, Hernandez Mijares A, Corella D. Homocysteine levels and the metabolic syndrome in a Mediterranean population: a case-control study. Clin Hemorheol Microcirc (2011) 47(1):59–66. doi:10.3233/CH-2010-1366
Pubmed Abstract | Pubmed Full Text | CrossRef Full Text | Google Scholar
36. Badiou S, Bariolet S, Dupuy AM, Sultan A, Avignon A, Cristol JPA. New DiaSys colorimetric assay for plasma homocysteine: application in diabetic patients. Ann Clin Lab Sci (2009) 39(3):233–40.
37. Mazza A, Bossone E, Mazza F, Distante A. Reduced serum homocysteine levels in type 2 diabetes. Nutr Metab Cardiovasc Dis (2005) 15(2):118–24. doi:10.1016/j.numecd.2004.03.001
Pubmed Abstract | Pubmed Full Text | CrossRef Full Text | Google Scholar
38. Masuda Y, Kubo A, Kokaze A, Yoshida M, Fukuhara N, Takashima Y. Factors associated with serum total homocysteine level in type 2 diabetes. Environ Health Prev Med (2008) 13(3):148–55. doi:10.1007/s12199-008-0024-2
Pubmed Abstract | Pubmed Full Text | CrossRef Full Text | Google Scholar
Keywords: homocysteine, type 2 diabetes, Mendelian randomization, MTHFR, association
Citation: Kumar J, Ingelsson E, Lind L and Fall T (2015) No evidence of a causal relationship between plasma homocysteine and type 2 diabetes: a Mendelian randomization study. Front. Cardiovasc. Med. 2:11. doi: 10.3389/fcvm.2015.00011
Received: 22 September 2014; Accepted: 18 February 2015;
Published online: 05 March 2015.
Edited by:
Dexter Canoy, University of Oxford, UKReviewed by:
Johannes Tobias Neumann, Hamburg University Heart Center, GermanyRona Juliette Strawbridge, Karolinska Institutet, Sweden
Copyright: © 2015 Kumar, Ingelsson, Lind and Fall. This is an open-access article distributed under the terms of the Creative Commons Attribution License (CC BY). The use, distribution or reproduction in other forums is permitted, provided the original author(s) or licensor are credited and that the original publication in this journal is cited, in accordance with accepted academic practice. No use, distribution or reproduction is permitted which does not comply with these terms.
*Correspondence: Jitender Kumar, Department of Medical Sciences, Molecular Epidemiology, Box 1115, Uppsala University, 751 41 Uppsala, Sweden e-mail: jitender.kumar@medsci.uu.se