The record precipitation and flood event in Iberia in December 1876: description and synoptic analysis
 Ricardo M. Trigo1*
  Filipa Varino1
  Alexandre M. Ramos1
  Maria A. Valente1
  José L. Zêzere2
  José M. Vaquero3
  Célia M. Gouveia1
  Ana Russo1
- 1Instituto Dom Luiz (IDL), Faculdade de Ciências, Universidade de Lisboa, Lisboa, Portugal
- 2CEG, Instituto de Geografia e Ordenamento do Território, Universidade de Lisboa, Lisboa, Portugal
- 3Departamente de Física, Universidad de Extremadura, Mérida, Spain
The first week of December 1876 was marked by extreme weather conditions that affected the south-western sector of the Iberian Peninsula (IP), leading to an all-time record flow in two large international rivers. As a direct consequence, several Portuguese and Spanish towns and villages located in the banks of both rivers suffered serious flood damage on 7 December 1876. These unusual floods were amplified by the preceding particularly autumn wet months, with October 1876 presenting extremely high precipitation anomalies for all western Iberia stations. Two recently digitized stations in Portugal (Lisbon and Evora), present a peak value on 5 December 1876. Furthermore, the values of precipitation registered between 28 November and 7 December were so remarkable that, the episode of 1876 still corresponds to the maximum average daily precipitation values for temporal scales between 2 and 10 days. Using several different data sources, such as historical newspapers of that time, meteorological data recently digitized from several stations in Portugal and Spain and the recently available 20th Century Reanalysis, we provide a detailed analysis on the socio-economic impacts, precipitation values and the atmospheric circulation conditions associated with this event. The atmospheric circulation during these months was assessed at the monthly, daily and sub-daily scales. All months considered present an intense negative NAO index value, with November 1876 corresponding to the lowest NAO value on record since 1865. We have also computed a multivariable analysis of surface and upper air fields in order to provide some enlightening into the evolution of the synoptic conditions in the week prior to the floods. These events resulted from the continuous pouring of precipitation registered between 28 November and 7 December, due to the consecutive passage of Atlantic low-pressure systems fuelled by the presence of an atmospheric-river tropical moisture flow over central Atlantic Ocean.
Introduction
Flooding events are one of most costly and wide reaching natural hazards which, although triggered by characteristic meteorological factors, can also be amplified by human intervention such as vegetation clearing and/or urban development (Smith and Ward, 1998).
The most common causes of floods are climate related, most notably heavy or continuous precipitation and snow melting. Human impacts on river catchments also influence flood behavior, where changes in land use have a direct impact on the magnitude and behavior of floods (Nott, 2006). Over the western sector of Iberia two main types of rain floods can be distinguished: (a) flash floods, usually affecting small hydrographical basins or urban areas, which are caused by very intense convective precipitation such as the case of Madeira in 2010 (Fragoso et al., 2012) and (b) floods in the major rivers that are caused by continuous intense large-scale precipitation (e.g., Lavers et al., 2011).
Changes in precipitation extremes in the Iberian Peninsula (IP) (Gallego et al., 2011; Santo et al., 2014a) are of particular concern since they can be responsible for flash floods (e.g., Ferraris et al., 2002), hydrological droughts (e.g., García-Herrera et al., 2007; Sousa et al., 2011) and landslides (e.g., Zêzere et al., 2008). The IP climate is affected by a relatively small number of large-scale modes of atmospheric circulation variability (e.g., Trigo et al., 2008). Of these patterns the North Atlantic Oscillation (NAO) is the main mode of low-frequency variability in the North Atlantic European sector to explain precipitation variability in western Iberia Peninsula (e.g., Hurrell, 1995; Jones et al., 1997; Rodríguez-Puebla et al., 1998; Trigo et al., 2004; Lorenzo-Lacruz et al., 2011). According to those results, positive (negative) values of NAO indices are related to below (above) average total precipitation over western Iberia Peninsula.
On the other hand, the variability of the dominant storm-tracks in the Northern Hemisphere affects also the surface climate, particularly the precipitation regimes (Trigo, 2006). Extra-tropical cyclones correspond to one of the most prominent features of the mid-latitude climate and represent a major mechanism for poleward transport of heat and moisture (Peixoto and Oort, 1992) and are often associated with extreme weather conditions like precipitation and/or wind extremes (e.g., Raible, 2007; Liberato et al., 2011). In the IP, the hydrological cycle regime is sensitive to the timing and the position of the winter storms that are predominantly conditioned by the NAO phase (Ulbrich et al., 1999; Trigo et al., 2004).
Historical floods in major river basins of western IP, particularly the Tagus basin have been extensively analyzed (e.g., Benito et al., 2003a,b, 2004, 2005; Ortega and Garzón, 2004). These works have evaluated the temporal distribution of flood occurrence and magnitude within the context of climatic variability in Iberia during the last millennium. Some of these works show the existence of a link between historical floods and the NAO index for the basins of Guadalquivir (Benito et al., 2005) and Guadiana (Ortega and Garzón, 2004). Interestingly the impact of solar activity was also identified for some flood periods (Benito et al., 2004; Vaquero, 2004).
Unusual values of precipitation occurred in early December 1876 leading to large scale flood events in several major river basins in the central and southern sectors of the IP. Recently digitized data from several stations has helped to assess how exceptional this period was. According to records, on 5 December 1876, precipitation reached the highest value ever registered in Lisbon (110 mm in 24 h) since the daily measurements started in 1863, being only exceeded in 2008 (Fragoso et al., 2010). Thus, it still corresponds to the second highest value of daily precipitation ever observed in this city since the start of regular measurements. Similarly, the historical city of Evora registered 90 mm of precipitation on 7 December, a value that was only surpassed on 1944 and is also until today the second highest value ever. However, we will provide evidence that this was not a single event but more likely the culmination of consecutive rainfall episodes that struck central and southern sectors of the IP in the weeks since the preceding October of 1876. As a consequence, river banks of several rivers, including two large international Iberian rivers (Tagus, Guadiana) and the Spanish Guadalquivir suffered widespread floods that caused losses of human life and significant socio-economic impacts.
Atmospheric rivers (ARs) have received special attention in the last decade as they are often associated with extreme precipitation events (Ralph et al., 2006; Lavers et al., 2011). ARs are the water vapor core section of the broader warm conveyor belt, occurring over the oceans along the warm sector of extra-tropical cyclones (Bao et al., 2006). These water vapor bands are typically only a few 100 km across and are located in the lower troposphere, but can stretch over thousands of kilometers across the ocean and their water transportation rate can be at times as intense as that of major terrestrial rivers (Newell et al., 1992). The existence of ARs has been linked to previous heavy precipitation events and floods in Norway (Stohl et al., 2008), United Kingdom (Lavers et al., 2011), California (Dettinger, 2011) and also in Portugal (Liberato et al., 2013).
The aim of this work is to evaluate the impacts of December 1876 floods, with an important focus on the characterization of the short and long-term evolution of the atmospheric conditions responsible for such an extreme event. To achieve these goals, the following objectives must be addressed:
(1) To determine the spatial distribution of precipitation anomalies in the IP and the atmospheric conditions in the months prior to the early December 1876 event.
(2) To evaluate objectively, for the recently digitized stations of Lisbon and Evora, how exceptional was this precipitation event, at various temporal scales.
(3) To evaluate the role played by the atmospheric circulation, namely the NAO and ARs at the monthly-seasonal and daily-weekly scales respectively.
Datasets and Methodology
Historical Sources
The historical source data used were extracted from a comprehensive dataset of flooding and landslide events that occurred in Portugal since 1865 (Quaresma, 2009) and aggregated within the scope of DISASTER project (Zêzere et al., 2014). The DISASTER project allowed to construct a database on hydro-geomorphologic disasters in Portugal. This database was collected through the analysis of all available daily Portuguese newspapers since 1870, mainly from “Diario de Noticias” and “Século.” This database provides detailed information on each individual hydro-meteorological event that took place from the late 19th century till the beginning of the 21th century including their specific location, event type (flood or landslide), involved rescue entities, date of the event and date of the publication. Furthermore, it also provides a large amount of additional contextual information for each event and affected town/region, such as the main socio-economic costs, human losses, people injured, disappeared, evacuated, and dislodged.
Additionally, the Spanish newspapers “La Ilustración Española y Americana,” “El Magisterio Extremeño,” and “La Crónica,” were also analyzed for the days following the 1876 floods to improve the knowledge of the impacts of this event in Spain.
The 20th Century Reanalysis
The new 20th Century Reanalysis version 2 (Compo et al., 2011) from the National Oceanic and Atmospheric Administration/Earth System Research Laboratory Physical Sciences Division (NOAA/ERSL PSD) was used. This dataset is suitable for this type of analysis because it is currently the only dataset that can provide a continuous 3-D description of many meteorological fields since 1871, i.e., a much longer period than the standard NCEP/NCAR (since 1948) or ECMWF (since 1958) Reanalysis datasets. Here the ensemble mean fields on a 2 by 2° global latitude-longitude grid were used.
Several fields were extracted related to both surface and troposphere levels: 3-h and daily precipitation rate, 6-h and daily sea level pressure and convective available potential energy (CAPE). In addition, for the upper levels (850, 500, and 250 hPa), the 6-h fields of geopotential height, air temperature, both wind components and specific moisture were also extracted.
Station Data
Precipitation data from different sources were used in this work and a summary is provided in Table 1 including the name, period and hour of observation. Two long term daily precipitation stations for Portugal (Lisbon and Evora) were digitized recently by the Geophysical Institute Infante Dom Luiz. Data from the Lisbon station was registered from 0 a.m. to 24 p.m. between 1863 and 1940 and from 9 a.m to 9 a.m of the following day from 1941 until 2010. The second precipitation extended series, corresponds to the stations of Evora with daily data recorded from 1873 to 1887 and 1906 to 2006 which were recorded between 9 a.m. and 9 a.m. These long-term time series have been digitized within the framework of the FP7 project ERA-CLIIM (Stickler et al., 2014). In a recent work by one of us the longest time series available for Portugal was evaluated comprehensively (Kutiel and Trigo, 2014). The series of monthly means of the Lisbon daily precipitation was examined in detail for temporal homogeneity using the software package RHTestsV3 (Wang and Feng, 2010) and no significant change-points were found. The choice of the test was based on its robustness and also based on one of the authors experience with it in recent applications to Portuguese temperature (Santo et al., 2014a) and precipitation (Santo et al., 2014b) series.
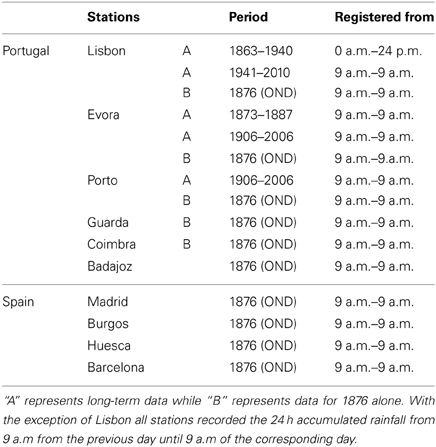
Table 1. Available precipitation station data from Portugal and Spain.
Moreover, we used additionally monthly precipitation data from three important locations in Portugal (Porto, Guarda and Coimbra) and five Spanish stations. For these stations, the extracted data corresponds to the period of the event: October–December 1876. In summary, the location of the 10 available stations (shown in Figure 1), is distributed as follows, five in mainland Portugal (Porto, Guarda, Coimbra, Evora, Lisbon) and five in Spain (Badajoz, Madrid, Burgos, Huesca, Barcelona). For all stations considered here, the climatological reference period used corresponds to the 1971–2000 normal.
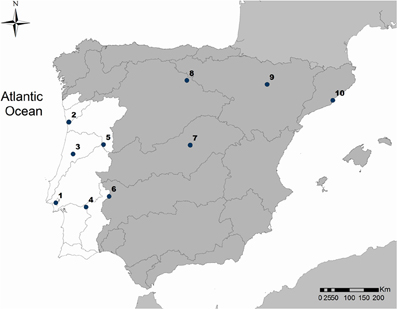
Figure 1. Location of the available stations. 1- Lisbon, 2- Porto, 3- Coimbra, 4- Évora, 5- Guarda, 6- Badajoz, 7- Madrid, 8- Burgos, 9- Huesca, and 10- Barcelona.
NAO Data
NAO data was accessed through the National Centre of Atmospheric Research (NCAR), Climate and Global Dynamics Division. Extracted data corresponds to the normalized difference of sea level pressures between Lisbon (Portugal) and Stykkisholmur/Reykjavik (Iceland) (Hurrell, 1995). Here we used the monthly mean NAO index from 1865 to 2012.
Historical Description of the Record Breaking Precipitation and Floods Episodes in December 1876
During the autumn and winter of 1876, the central and southern sectors of the IP were affected by consecutive rainy episodes during several weeks. In particular, the last week of November and the first week of December were characterized by the occurrence of precipitation every day with exceptionally high aggregated values.
As a consequence, river flows of several major rivers, including two large international Iberian rivers (Tagus and Guadiana) and the Spanish Guadalquivir mounted to impressive values on 7 of December leading to widespread floods throughout its embankments that caused scores of human casualties and widespread socio-economic impacts. In fact, a large number of villages and towns located on the shores of these rivers experienced major floods. The geographical location of some of these impacts can be seen in Figure 2 where one can see that the most affected places are located in the Guadiana basin (SW of Iberia).
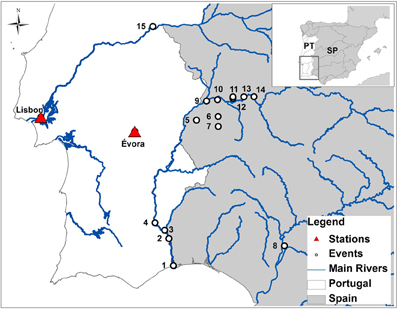
Figure 2. Location of some of the most affected places by the flood of 1876 mentioned by several newspapers. 1- Vila Real de St António, 2- Alcoutim, 3- Pomerão, 4-Mértola, 5-Olivenza, 6-La Albuera, 7- Almendral, 8- Seville, 9- Badajoz, 10- Talavera la Real, 11- Puebla de la Calzada, 12- Montijo, 13- Gévora, 14- Mérida, 15- Vila Velha de Rodão.
At this late stages of the 19th century both Iberian countries (Portugal and Spain) had developed regional and national wide newspapers that were keen to describe (and illustrate) the most important impacts of this episode. Among other publications, we have looked in detail into the following regularly published newspapers in Portugal (Diário de Noticias and Gazeta do Algarve) and in Spain (La Crónica, El Magisterio Extremeño and La Ilustración Española). According to the “Diário de Noticias” (14 December 1876), in Mértola (#4 in Figure 2) the Guadiana river had raised 25 meters—a fish was found inside a desk drawer, alive. In this town from the original 64 buildings on the left bank of the Guadiana river (the most sparsely populated part) only 3 left standing. Thus, almost 95% of the buildings were razed. Other Portuguese newspaper “Gazeta do Algarve” (13 December 1876) published: “For 3 days the Guadiana has an amazing current… Pomarão has disappeared (#3 in Figure 2). All houses were dragged, and we cannot recognize the place where they use to be anymore.” The nearby towns of Alcoutim (right bank, Portugal, #2 in Figure 2) and Sanlucar del Guadiana (left bank, Spain) almost disappeared and only the houses in the highest places remained. The town of Vila Real de St António, located at the mouth of river Guadiana (#1 in Figure 2) was devastated and there were at least 11 deaths.
In Spain, the damage caused by this flood event was also impressive. The consequences were particularly severe around Badajoz, a Spanish city located right on the border with Portugal (#9 in Figure 2). Some of the most important infrastructures of the city of Badajoz were destroyed (Figure 3) including communication routes by road and rail and telegraph lines. Moreover, the most important infrastructure in the city, the great Palmas bridge over the Guadiana river, collapsed after losing seven arches (Figures 3A–C). This bridge was a strategic point on the route Lisbon-Madrid and had never collapsed before, since it had been re-erected in 1612 (González Rodríguez, 1995). As a consequence of this event the city of Badajoz was isolated, almost surrounded by water, for 4 days. The communication route by rail was recovered only on 13 December, 1 week after the flood. The newspapers indicate widespread damage to homes and business, with a large number of houses presenting partial or total collapse, and in the aftermath hundreds of families become homeless.
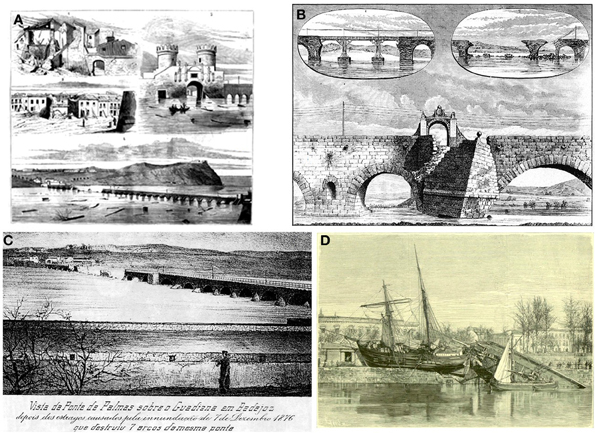
Figure 3. Some engravings on the floods of December 1876. (A) four scenes from the city of Badajoz flooded by the waters of the Guadiana, including a picture of the importantly damaged Bridge of Palmas; (B) damages in the great Roman Bridge in the city of Mérida caused by the rising of Guadiana river; (C) an anonymous Portuguese engraving showing the seven lost arches in the Bridge of Palmas in Badajoz; and (D) shipwreck of a Swedish boat in Seville caused by the rising of Guadalquivir river. Engravings (A,B,D) were published in the newspaper “La Ilustración Española y Americana.”
Other cities located close to Badajoz in the Guadiana basin were equally affected (Figure 2), such as Mérida (where the bridge on the Guadiana river was also damaged, #14 in Figure 2), Olivenza, La Albuera, Gévora, Almendral, Talavera la Real, Puebla de la Calzada, Montijo (#5,6,13,7,10,11,12 in Figure 2), and other minor villages. See, for example, the chronicles appeared in the local newspapers “La Crónica” (December 1876) and “El Magisterio Extremeño” (15 December 1876). In Seville, in the basin of the Guadalquivir river (#8 in Figure 2), a Swedish and an English ship were dragged into the city as a consequence of the intense river flow (Figure 3D).
According to Benito et al. (2003a), who have used the record from Vila Velha do Ródão gauge station the 1876 episode corresponds to the largest flood with an estimated discharge of 15,850 m3 s−1. The authors were analysing flooding in the Tagus river basin over the last millennium and the case of Alcantara, about 100 km upstream from Vila Velha de Rodão. The seven documented floods are referred to the Alcantara Roman bridge (built in AD 103,) and the largest flood during the last 200 years were also recorded in 1876 for which model peak discharge estimates of 14,800 m3 s−1 (Benito et al., 2003a). Additionally, palaeoflood hydrology of the Tagus River (Central Spain) was reconstructed from slackwater deposits and palaeostage indicators (Benito et al., 2003b) indicating that in Alcantara, the largest floods of the last 200 years were recorded in AD 1876, 1941, 1947, and 1856 in which the exact water stages documented floods mentioned before.
According to Loureiro (2009), the flood of 1876 was referenced as the biggest one ever recorded in Tagus when entering into Portuguese territory (in Vila Velha do Rodão, #15 in Figure 2). Besides measuring the river elevations in a cross section at this station, the Portuguese Hydrological Services had introduced in 1852 a hydrometer flay (measuring the river flow speed), thus allowing to put the outstanding flood of 1876 into a longer perspective. The flow rate was computed by Loureiro (2009) using the velocity-height curve equation also depicted in Figure 4. It should be noted that the curve calibration was restricted to the century prior to the introduction of major dams in river Tagus in the 1950s and 1960s, that have altered the river flow regime, smoothing large peak values (Trigo et al., 2004). Taking into account that the river height at Vila Velha do Rodão had been monitored (for river surface elevation) since the beginning of the 19th century, we are confident that the early December 1876 floods correspond to the absolute maximum since around 1800 and surpassing the other major floods that occurred in 1823, 1855, 1912, and 1941.
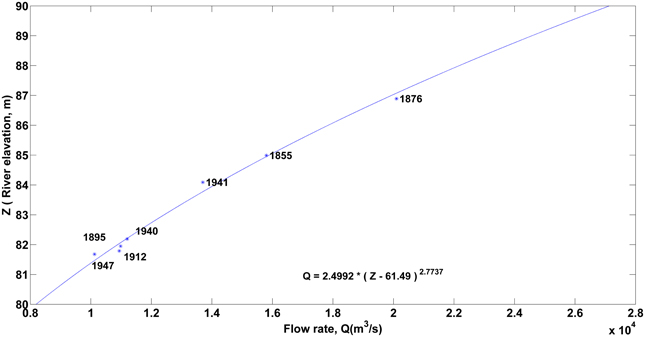
Figure 4. Relation between river elevation (y-axis) and flow rate (x-axis) according to Loureiro (2009).
Assessing the Observed Precipitation
The Exceptional Weekly Precipitation at Lisbon and Evora
Looking at long-term daily series evaluated (Lisbon and Evora) it becomes evident that both stations present an extreme value on the 5 December 1876, but preceded by significant amounts of rainfall in, at least, the previous week. Therefore, with the aim of understanding the extent in time and the magnitude of this multi-daily event, we have computed the daily average for the accumulated precipitation values (from 1 to 10 days) for the entire time series and rank all values, with the top 10 events being represented in Figure 5A (Lisbon) and Figure 5B (Evora). This figure presents the 10 highest values of daily average accumulated precipitation (X axis) relative to events with successively more days (lengthier) as obtained by adding either; 1, 2, 3, or more (up to 10) days (Y axis). The colors allow a simple identification of the years in which the event occurred while the daily average of the accumulated precipitation for each time period is represented by the bar high (Z axis). Several conclusions can be inferred from this graphic, namely that:
(a) The 1876 episode (dark blue) was so intense (in magnitude but also in temporal span) that this episode dominates the upper ranks of rainiest events at longer time scales, hence the blue triangular shape of records that extends between 2 and 10 days.
(b) In Evora, two of the top 10 rainiest 1-day events (dark blue) were registered only 2 days apart during the December 1876 episode. Therefore, it is quite natural the overall dominance of record precipitation in upper ranks of rainiest events between 2 and 10 days.
(c) With the exception of 1876, the rainiest events in Lisbon at the daily scale have been observed in the last 30 years (1983, 1997, 2004, and 2008). In fact, the recent episode in February 2008 (dark red) corresponds to the absolute maximum daily value (Fragoso et al., 2010). On the contrary, in Evora, the rainiest events at the daily scale have occurred until the mid-20th century (1876, 1917, 1944, and 1951). This different time line in extreme rainy events is consistent with previous works that have shown an increase in extreme rainy episodes in Lisbon and a decrease in Evora and central IP during the last decades (Gallego et al., 2011; Kutiel and Trigo, 2014).
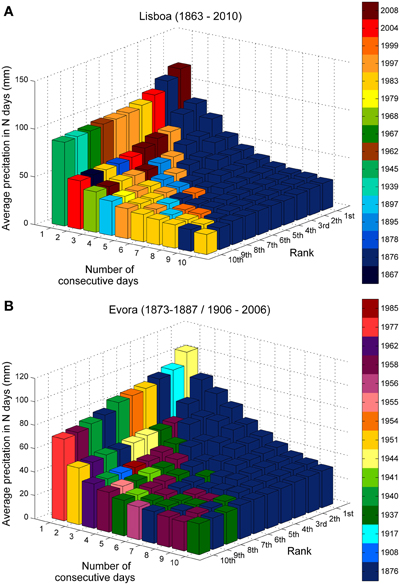
Figure 5. The 10 highest values (rank) of accumulated precipitation from 1 to 10 consecutive days in (A) Lisbon for the period 1863–2010 and (B) Evora for the period 1873–1887, 1906–2006 respectively. The color bar scale represents the year with an extreme event that is included in the graphic. The vertical axis represents the average precipitation amount in 24 h.
In order to summarize these results, Table 2 shows the highest daily average precipitation in Lisbon and Evora (from 1 to 10 days) and the corresponding time interval. Again, it is possible to confirm that the record for 1 day precipitation belongs to 18 February 2008 (Lisbon) and 4 October 1944 (Evora), while looking at 2 and more days, the 1876 event is always the rainiest episode and the time interval persistently matches between 28 November and 7 December 1876. The longest period in which 1876 holds the highest value of accumulated precipitation corresponds to 14 days.

Table 2. Values and time period for higher precipitation value from 1 to 10 days.
The Wet Autumn of 1876
The early days of December 1876 were characterized by high values of precipitation in Lisbon and other Portuguese stations. However, the extreme flood events that struck large rivers such as Tagus and Guadiana would not have materialize if they depended only on the concentrated daily-to-weekly scale precipitation described in the previous section. In fact, the unusual precipitation observed in early December was preceded by intense rainfall throughout most of autumn. This is clearly depicted in Figure 6 that shows the daily cumulative precipitation for both stations between 1 September and 10 December. Accordingly, during October and November the cumulative precipitation was close to the 95th percentile. However, the extreme rainy period in the first week of December prompted this rainfall index into absolute record values in both stations on 10 December 1876. Thus, it never rained so much in Lisbon and Evora during the first 100 days of the hydrological year (that starts at the beginning of September) as in that year of 1876.
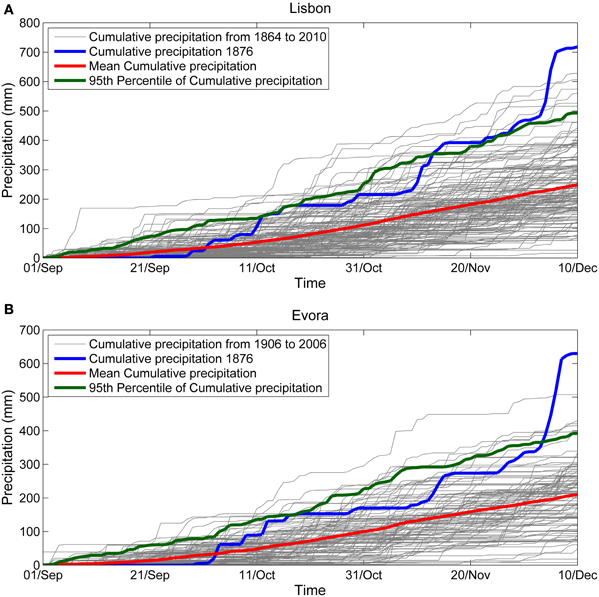
Figure 6. Cumulative precipitation from the 1st of Setember to the 10th of December using sation data. Each year of cumulative precipitation for (A) Lisbon (1864–2010) and (B) Evora (1906–2006) is represented in gray. Mean and 95th percentile of precipitation is represented in red and green respectively and acumulated preciptiation in the year of 1876 is represented by the blue line.
We have computed the ratio of monthly precipitation for the months of October, November and December of 1876 in comparison with a 30-years normal period (1971–2000) and results are presented in Figure 7. In November and December most available stations in IP recorded more than twice the average climatological value. It is immediately striking the concentration of stations with high ratios within Portugal, particularly in December where almost all the stations registered 2–4 times more than the long-term average. We should stress the two most extreme case studies, namely; (1) Evora station that registered more than four times the average precipitation in December and (2) and Lisbon also in December that received more than three times the average precipitation. This implies that the last 3 months of 1876 registered considerable more precipitation than the average in western Iberia, even before the record 2–10 day precipitation observed in early December. We are confident that the pouring of almost continuous precipitation throughout these months contributed undoubtedly to soak the upper layers of soil and, thus, amplifying the intensity of floods on the days 6–8 December.
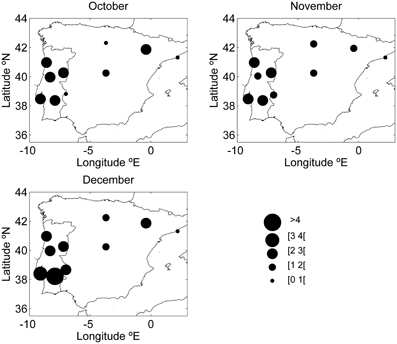
Figure 7. Precipitation ratio in October, November and December 1876 when compared to the 1971–2000 average in several stations (Porto, Guarda, Coimbra, Lisbon, Evora, Badajoz, Madrid, Burgos, and Huesca). The climatological data for Spanish stations was obtained from Aemet (Agencia Estatal de Meteorología), and for Portuguese stations from IPMA (Portuguese Sea and Atmosphere Institute).
Assessing the Atmospheric Circulation
The Influence of the NAO
Until recently, the unavailability of long-term reanalyses datasets excluded the possibility to study the atmospheric circulation associated with this event at different temporal and spatial scales, particularly in relation to mid and upper troposphere variables. The feasibility of such an approach has been made possible through the use of the 20CR (Compo et al., 2011) currently starting in 1871, i.e., sufficient to describe in detail the outstanding prolonged event of late 1876. Here, we will focus on the large-scale atmospheric circulation patterns over the North-Atlantic and Europe at the monthly scale, based on the monthly mean and anomaly pressure fields. Figure 8 provides the anomalous pressure field for the November (Figure 8A) and December (Figure 8B) months. For November, an intense pressure dipole appears over the Atlantic with a negative anomaly over Azores and a positive center located close to Iceland, i.e., a striking negative NAO configuration (Hurrell, 1995). The following month of December 1876 is also characterized by a similar North-South SLP dipole although with the negative and positive centers shifted toward the northeast. It is possible to state that all the 3 considered months (Oct/Nov/Dec) present an overall large-scale pattern that resemblance the NAO mode to a large extent, presenting strong negative NAO index values of −1.9, −4.4, and −2.1 respectively. It is important to stress that the NAO index registered in November 1876 corresponds to the absolute minimum record for the month of November between 1865 and 2012 (Figure 9). It is now well accepted that negative NAO index winter months are overwhelmingly associated with wetter-than-usual months over Iberia (e.g., Hurrell, 1995; Trigo et al., 2004), consequence of a southward shift of the main storm tracks in the Atlantic (Trigo et al., 2004; Trigo, 2006). In this regard the low NAO values registered between October and December of 1876 are bound to be reflected in the Iberian precipitation as previously described in Figure 7. These results are in good agreement with the ones obtained by Salgueiro et al. (2013) that used a new methodology to access the influence of NAO on flood magnitude of Tagus River since mid-19th century. They showed that the largest floods prior to construction of largest Tagus river dams (return period equal and over 25-years) occurred when a negative NAO dominated over a period of 10 days, starting at least 25 days prior to the peak.
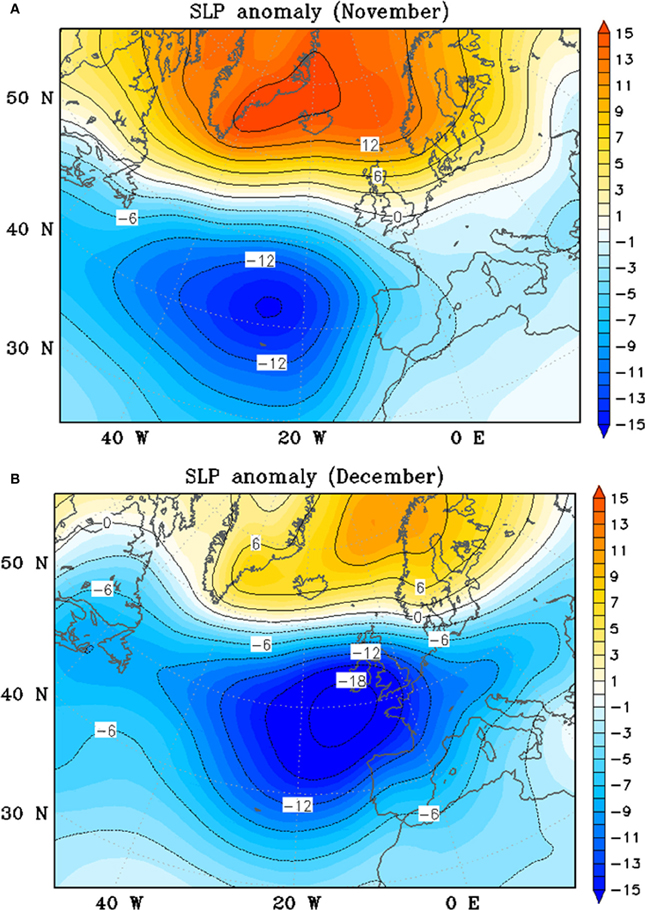
Figure 8. November (A) and December (B) 1876 sea level pressure anomaly in hPa when compared with the average period 1901–2000.
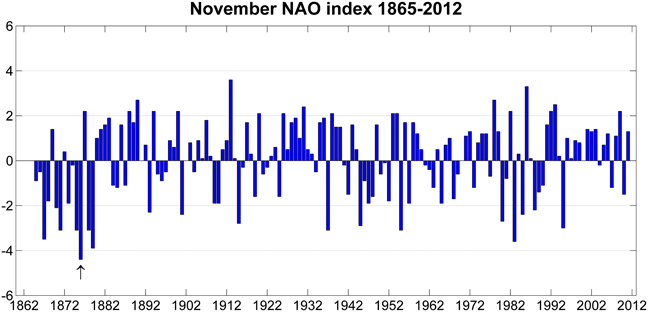
Figure 9. November NAO index from 1865 to 2012.
Nevertheless, in order to reinforce the message we used the 2° × 2° precipitation fields form the 20CR reanalysis data to compute the monthly precipitation anomaly for the entire Iberia (Figure 10). The rationale for assessing the precipitation impact with the 20CR dataset is the possibility to provide a continuous representation of Iberia, unlike the sparse representation with the few available stations, additionally it also allows a visualization of sub-daily dynamics (every 6 h) that can be useful for some purposes. Despite the uncertainties of reanalysis values, a positive monthly anomaly over 200 mm appeared south and west of Iberia during November and above 250 mm in most western Iberia in December.
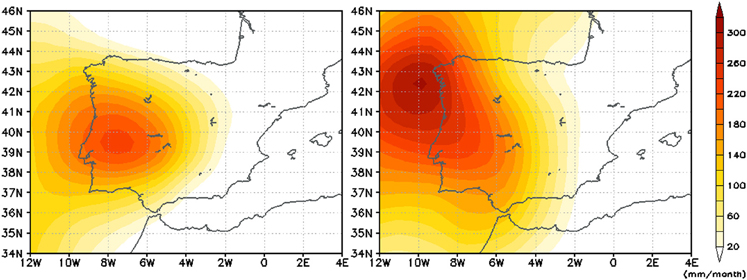
Figure 10. Monthly precipitation anomaly from the 20CR for November (left) and December (right) 1876 (climatological normal for the period 1901–2000).
Synoptic Analysis Leading to the December 1876 Event
Besides the analysis at the monthly scale presented above, the 20CR reanalyses allows a more in depth study of the atmospheric conditions associated to the severe weather event at the 1–10 days scale in early December 1876. With the aim of promoting the visualization of complementary explanatory meteorological fields we have obtained sequences of 6-h (or daily at fixed hours) synoptic charts for several days during the peak precipitation period in early December (e.g., daily accumulated precipitation and daily mean sea level pressure evolution in Figure 11). Additionally, we have also computed hourly panels for surface and upper air fields that are capable of providing some additional light into the overall evolution of the synoptic conditions (e.g., 12 U.T.C example in Figure 12). Among these meteorological fields, we have paired precipitation rate and mean sea level pressure (SLP) (Figure 12A); precipitation rate and CAPE (Figure 12B); air temperature at 850 hPa and geopotential height at 500 hPa (Figure 12C); upper troposphere wind speed intensity and divergence at 250 hPa (Figure 12D). To complement these we provide also additional fields also at 12 UTC, namely; lower troposphere wind speed vectors and specific moisture content at 900 hPa (Figure 13) and wind speed intensity and divergence at 900 hPa on Figure 13). In order to avoid an excess usage of images, we will restrict the analysis to the most important panels for each case.
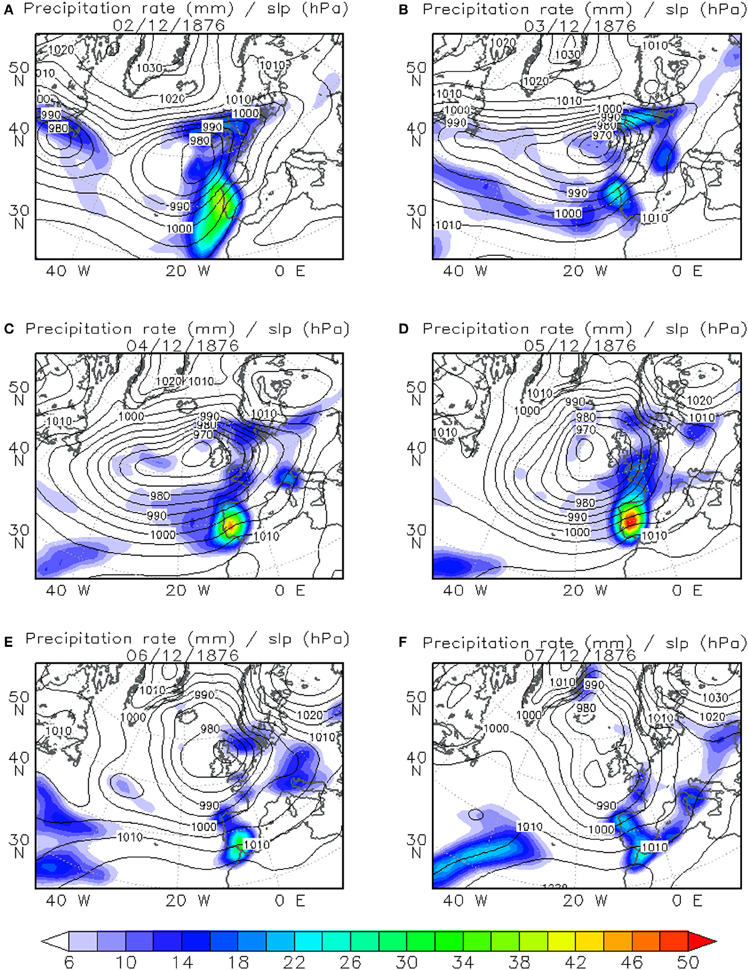
Figure 11. Daily mean precipitation intensity colors (mm) and daily mean sea level pressure, contours (hPa), for: (A) 02/12/1876; (B) 03/12/1876; (C) 04/12/1876; (D) 05/12/1876; (E) 06/12/1876; (F) 07/12/1876.
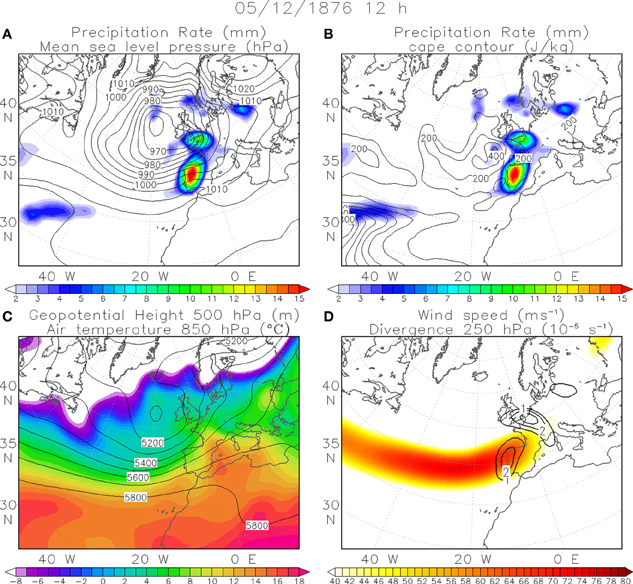
Figure 12. Weather conditions on the 5 December 1876 at 12 a.m. (A) precipitation rate (colors, mm) and mean sea level pressure contours (hPa); (B) precipitation rate (colors, mm) and CAPE contours (J kg−1); (C) geopotential height at 500 hPa (m, contours) and air temperature (°C, colors) 850 hPa, (D) wind speed intensity (colors, ms−1) and divergence (solid) and convergence (dotted) contours at 250 hPa.
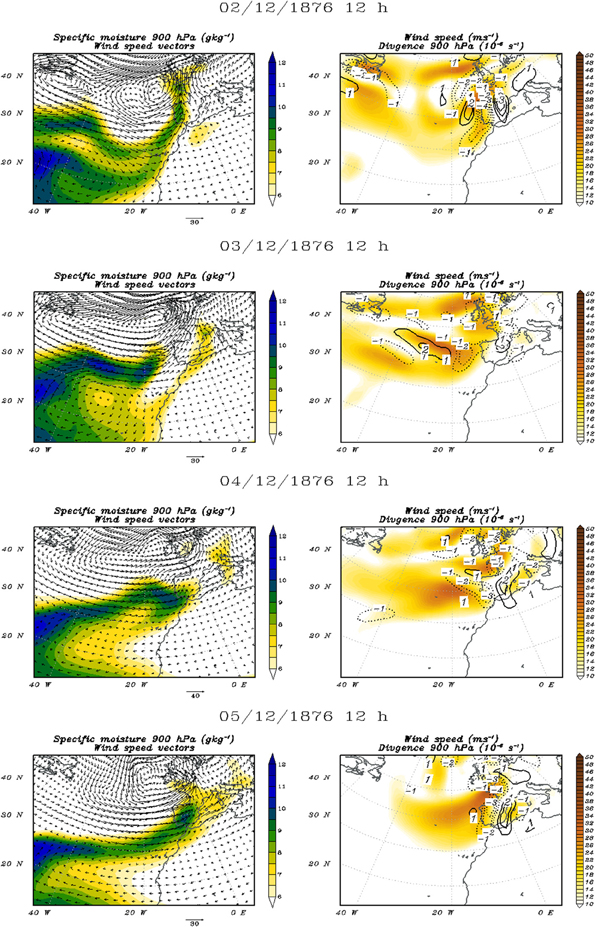
Figure 13. Wind speed and direction (arrows) and specific moisture (gkg−1) color contours at 900 hPa (left panels), wind speed intensity (colors, ms−1) and divergence (solid) and convergence (dotted) contours at 900 hPa (right panels) for selected days.
The evolution of daily accumulated precipitation values and associated daily mean sea level pressure contours from 2 until 7 of December 1876 are shown on Figure 11. A closer look at these fields reveals a persistent large region of significant precipitation lingering almost continuously over south-western Iberia. Moreover, from a dynamic perspective, it is also visible that these high values of precipitation are related to successive frontal systems that kept crossing the Atlantic Ocean, with a predominant SW to NE direction, while other low pressure system centers (albeit more intense) travel at higher latitudes, than what is usual at this time of the year (Trigo, 2006). A similar analysis was performed between 28 November and 2 December (figure not shown).
It is possible to state that during these 10 days western and southern Iberia were often under the influence of these consecutive low pressure systems between Azores, Madeira and western IP, characterized by strong winds and precipitation, particularly between 2 and 7 December. According to the 20 CR fields (and consistent with the observed data in Lisbon and Evora) the southern Portuguese territory registered precipitation throughout the entire analyzed period. Furthermore, based on these datasets it is possible to realize that the heaviest precipitation occurred in two main phases:
(1) The first pulse corresponds to the movement of the low pressure system crossing the Atlantic Ocean between the 28 and 30 November, increasing considerably the amount of precipitation rate over the coastal western IP, that had remained on that sector for more than 48 h until it finally dissipated on the night of 30 November. The movement of the geopotential height field at 500 hPa (not shown) exhibits a cut-off low over the ocean moving northeast while the low pressure system moved in the same direction at surface (Nieto et al., 2005);
(2) The second pulse, started on 2 December, with a new air frontal system mass, that had developed over the Atlantic ocean and reached the western IP (Figure 11). In this occasion, the pulse is more enduring and remains over Portugal almost uninterruptedly until 7 December. For this second phase the main center of the associated depression kept an almost stationary location west of the British Islands, but allowing the associated successive frontal systems and squall instability lines to reach Iberia.
A more in depth analysis of the synoptic conditions for the 5 December 1876 (the day with the highest amount of precipitation in the entire event) can be seen in Figures 11, 12. In Figure 12C it is possible to observe the geopotential height at 500 hPa and air temperature at 850 hPa, being dominated by the presence in altitude of a low pressure center and the clear fingerprint of the warm mass intrusion just west of the IP. One of the factors that contributed for the maintenance of this low pressure system for so long at roughly the same location was most probably the presence of the southward displaced jet stream at 250 hPa (Figure 12D). For the period spanning between 2 and 7 December, the westerly winds remained at an average latitude of 42°N, lower than usual (Trigo, 2006), inducing strong divergence in altitude at the end of the jet (over western Iberia) as shown on Figure 12D (solid lines). This upper level divergence was accompanied by intense convergence at the surface (Figure 13, dotted lines), responsible for the intensification of the lower pressure system.
In addition, and looking in more detail into the dynamic fields of specific moisture during those days (2–5 December—Figure 13) one can identify a distant source of moisture. Throughout this period there is a long and narrow band of moisture at 900 hPa being transported from sub-tropical latitudes, over the Atlantic Ocean, toward extratropical latitudes, by southwestern winds at 900 hPa above 20 m/s strengthen the atmospheric flow toward Iberia. This combination of wind and specific moisture characteristics concentrated in such a narrow band suggests the presence of an AR (Ralph et al., 2004; Ralph and Dettinger, 2011). The identification of AR in the Atlantic region has actually been mentioned in some studies as the trigger factor of some floods in Europe, namely in Britain (Lavers et al., 2011), Norway (Stohl et al., 2008), as well as in Portugal (Liberato et al., 2013). The criterion to the identification of AR involve the presence of, a long (>2000 km) and narrow (<500 km) band of moisture in the lowest atmospheric levels from the tropics with high integrated water vapor (above 2 cm) which is equivalent to 5 g/kg of specific moisture but also wind speed above 12.5 ms−1 (Lavers et al., 2011). These characteristics are all present not only between 2 and 5 December (Figure 13) but also during some of the previous days. The presence of this AR is responsible for an additional content of moisture availability reaching the western IP in the days prior to the floods.
Favorable large-scale conditions for vertical movements (uplift mechanism which induced deep convection activity) in addition with the presence of the AR (high specific humidity) contributed to enhanced the precipitation for more than a week. The combined effect of these physical mechanisms allows putting in context the extraordinary amounts of precipitation registered in both Lisbon and Evora during those days. In Lisbon it was registered 238.8 mm from 2 December until 7 December (i.e., 60% of the monthly total for this December) and in Evora the total amount reached 275.8 mm (68% of monthly total). In both cases the precipitation felt during that week was more than 2.5 times the long-term December average. The rainiest day in Lisbon was 5 December 1876 having registered from 0 a.m. to 24 p.m., 110 mm, the second highest value in Lisbon series since 1863 and surpassed recently in 2008 (Fragoso et al., 2010).
Concluding Remarks
The December of the year 1876 was characterized by exceptionally high aggregated values of precipitation in Southern Portugal and Spain culminating on the extreme flow levels reached on the 7 December in several rivers, including two large international Iberian rivers (Tagus and Guadiana) as well as the Spanish river Guadalquivir. I the case of Guadiana and Tagus rivers it is possible to state that these floods correspond to the largest events since the early 19th century (surpassing the other major floods that took place in 1823 and 1855). This extremeness is quantified objectively for Tagus that had already a river speed gauge working since 1852 attributing the value of 20,000 cubic meters per second for the 7 December's flow rate. Moreover, the extraordinary magnitude of the Guadiana floods can be assessed by the destruction of large sections of the bridge crossing the river in Badajoz, and the destruction of the rail link to Madrid. Despite the widespread floods throughout the embankments of these rivers, natural disasters were not evaluated as seriously as today and we were not able to obtain conclusive figures for the scores of human casualties and dislodge people neither the total economic losses.
The two long term precipitation time series available (Lisbon and Evora) were analyzed to put the December 1876 event into a longer temporal context. For Lisbon, the 1876 episode was so intense (in magnitude but also in temporal span) that it dominates the upper ranks of rainiest events at longer time scales showing accumulated precipitation records that extends between 2 and 10 days. In Evora two of the top 10 rainiest 1-day events were registered only 2 days apart during the December 1876 episode resulting again on the pre-eminence of record precipitation in upper ranks of rainiest events between 2 and 10 days.
Looking at the daily cumulative precipitation for both stations between 1 September and 10 December we were able to assess the evolution throughout autumn months of the precipitation affecting southern Iberia. Accordingly, during October and November the cumulative precipitation was close to the 95th percentile. Therefore, the extreme rainy period in early December implied new absolute record values in both stations.
The large-scale circulation affecting the North-Atlantic area favored the occurrence of such anomalous rainfall periods in southern Iberia In particular the low NAO values registered between October and December of 1876 (−1.9, −4.4, and −2.1 respectively) are associated with the Iberian precipitation since it is well known that negative NAO index in winter months are associated with wetter-than-usual months over Iberia (e.g., Hurrell, 1995; Trigo et al., 2004).
As mention before, the period of most intense precipitation occurred between 28 November and 7 December. Several frontal systems stroke the IP almost continually during those days with a particular intense period of precipitations on the 3–5 December that culminated on the 7th of December flood events. To evaluate the role of the atmospheric circulation at a daily basis, several meteorological fields were analyzed during this first week of December 1876. During this period, two different meteorological situation affected the IP at the synoptical scale: (a) between the 28 and 30 November, the movement of the low pressure system crossing the Atlantic Ocean associated with a cut-off low increasing considerably the amount of precipitation rate over the coastal western IP, and (b) started on 2 December, an extra-tropical cyclone near the British Island become almost stationary, during the following days where its frontal system mass remains over Portugal almost uninterruptedly until 7 December. We have also shown that the intense precipitation observed in the 2nd period was associated to a combination of wind and specific moisture characteristics at 900 hPa (concentrated in a quite narrow strip) clearly suggesting the presence of an AR.
Conflict of Interest Statement
The authors declare that the research was conducted in the absence of any commercial or financial relationships that could be construed as a potential conflict of interest.
Acknowledgments
This work was supported by the Portuguese Foundation for Science and Technology (FCT) through project Klimhist (PTDC/AACCLI/119078/2010). Ricardo Trigo and Maria Antonia Valente were supported by ERA-CLIM (European Union, FP7, Grant Agreement Nr. 265229). Alexandre M. Ramos was supported by the Portuguese Foundation for Science and Technology (FCT) through grant FCT—DFRH—SFRH/BPD/84328/2012. The event data impacts information and newspapers was provided by Ivânia Quaresma.
References
Bao, J.-W., Michelson, S. A., Neiman, P. J., Ralph, F. M., and Wilczak, J. M. (2006). Interpretation of enhanced integrated water vapor bands associated with extratropical cyclones: their formation and connection to tropical moisture. Mon. Weather Rev. 134, 1063–1080. doi: 10.1175/MWR3123.1
Benito, G., Barriendos, M., Llasat, C., Machado, M., and Thorndycraft, V. R. (2005). “Impactos sobre los riesgos naturales de origen climático,” in Evaluación preliminar de los impactos en España por efecto del Cambio Climático, ed J. M. Moreno (Coordinador) (Madrid: Ministerio de Medioambiente), 527–548.
Benito, G., Díez-Herrero, A., and Fernandez de Villalta, M. (2003a). Magnitude and frequency of flooding in the Tagus Basin (Central Spain) over the last millennium. Clim. Change 58, 171–192. doi: 10.1023/A:1023417102053
Benito, G., Díez-Herrero, A., and Fernández de Villalta, M. (2004). Flood response to NAO and Solar Activity in the Tagus Basin (Cental Spain) over the last millennium. Clim. Change 66, 27–28. doi: 10.1023/B:CLIM.0000043334.30365.e0
Benito, G., Sopeña, A., Sánchez-Moya, Y., Machado, M. J., and Pérez-González, A. (2003b). Palaeoflood record of the Tagus River (Central Spain) during the Late Pleistocene and Holocene. Quaternary Sci. Rev. 22, 1737–1756. doi: 10.1016/S0277-3791(03)00133-1
Compo, G. P., Whitaker, J. S., Sardeshmukh, P. D., Matsui, N., Allan, R. J., Yin, X., et al. (2011). The twentieth century reanalysis project. Q. J. R. Meteorol. Soc. 137, 1–28. doi: 10.1002/qj.776
Dettinger, M. (2011). Climate change, atmospheric rivers, and floods in california - a multimodel analysis of storm frequency and magnitude changes1. J. Am. Water Resour. Assoc. 47, 514–523. doi: 10.1111/j.1752-1688.2011.00546.x
Ferraris, L., Rudari, R., and Siccardi, F. (2002). The uncertainty in the prediction of flash floods in the northern Mediterranean environment. J. Hydrometeorol. 3, 714–727. doi: 10.1175/1525-7541(2002)003%3C0714:TUITPO%3E2.0.CO;2
Fragoso, M., Trigo, R. M., Pinto, J. G., Lopes, S., Lopes, A., Ulbrich, S., et al. (2012). The 20 February 2010 Madeira flash-floods: synoptic analysis and extreme rainfall assessment. Nat. Hazards Earth Syst. Sci. 12, 715–730. doi: 10.5194/nhess-12-715-2012
Fragoso, M., Trigo, R. M., Zêzere, J. L., and Valente, M. A. (2010). The exceptional rainfall event in Lisbon on 18 February 2008. Weather 65, 31–35. doi: 10.1002/wea.513
Gallego, M. C., Trigo, R. M., Vaquero, J. M., Brunet, M., García, J. A., Sigró, J., et al. (2011). Trends in frequency indices of daily precipitation over the Iberian Peninsula during the last century. J. Geophys. Res. 116, 1–18. doi: 10.1029/2010JD014255
García-Herrera, R., Hernández, E., Barriopedro, D., Paredes, D., Trigo, R. M., Trigo, I. F., et al. (2007). The outstanding 2004/05 drought in the iberian peninsula: associated atmospheric circulation. J. Hydrometeorol. 8, 483–498. doi: 10.1175/JHM578.1
González Rodríguez, A. (1995). La puerta de Palmas y el puente viejo (1460–1994): Badajoz cara al Guadiana. Badajoz: Caja Rural.
Hurrell, J. W. (1995). Decadal trends in the North Atlantic Oscillation: regional temperatures and precipitation. Science 269:676. doi: 10.1126/science.269.5224.676
Jones, P., Jonsson, T., and Wheeler, D. (1997). Extension to the North Atlantic Oscillation using early instrumental pressure observations from Gibraltar and south−west Iceland. Int. J. Climatol. 17, 1433–1450. doi: 10.1002/(SICI)1097-0088(19971115)17:13<1433::AID-JOC203>3.0.CO;2-P
Kutiel, H., and Trigo, R. M. (2014). The rainfall regime in Lisbon in the last 150 years. Theor. Appl. Climatol. doi: 10.1007/s00704-013-1066-y
Lavers, D. A., Allan, R. P., Wood, E. F., Villarini, G., Brayshaw, D. J., and Wade, A. J. (2011). Winter floods in Britain are connected to atmospheric rivers. Geophys. Res. Lett. 38:L23803. doi: 10.1029/2011GL049783
Liberato, M., Pinto, J., Trigo, I., and Trigo, R. (2011). Klaus–an exceptional winter storm over northern Iberia and southern France. Weather 66, 330–334. doi: 10.1002/wea.755
Liberato, M. L. R., Pinto, J. G., Trigo, R. M., Ludwig, P., Ordóñez, P., Yuen, D., et al. (2013). Explosive development of winter storm Xynthia over the subtropical North Atlantic Ocean. Nat. Hazards Earth Syst. Sci. 13, 2239–2251. doi: 10.5194/nhess-13-2239-2013
Lorenzo-Lacruz, J., Vicente-Serrano, S. M., López-Moreno, J. I., González-Hidalgo, J. C., and Morán-Tejeda, E. (2011). The response of Iberian rivers to the North Atlantic Oscillation. Hydrol. Earth Syst. Sci. 15, 2581–2597. doi: 10.5194/hess-15-2581-2011
Loureiro, J. M. (2009). Rio Tejo: as grandes cheias: 1800–2007, 1st Edn. Tágides, Lisboa: ARH do Tejo I.P.
Newell, R. E., Newell, N. E., Zhu, Y., and Scott, C. (1992). Tropospheric rivers? A pilot study. Geophys. Res. Lett. 19, 2401–2404. doi: 10.1029/92GL02916
Nieto, R., Gimeno, L., de la Torre, L., Ribera, P., Gallego, D., García-Herrera, R., et al. (2005). Climatological features of cutoff low systems in the northern hemisphere. J. Clim. 18, 3085–3103. doi: 10.1175/JCLI3386.1
Nott, J. (2006). Extreme Events: A Physical Reconstruction and Risk Assessment. Cambridge: Cambridge University Press. doi: 10.1017/CBO9780511606625
Ortega, J. A., and Garzón, G. (2004). “Influencia de la oscilación del Atlántico norte en las inundaciones del Río Guadiana,” in Riesgos naturales y antrópicos en Geomorfología, eds G. Benito and A. Díez Herrero (Madrid: CSIC), 117–126.
Peixoto, J. P., and Oort, A. H. (1992). Physics of Climate. New York, NY: American Institute of Physics, 412–433.
Quaresma, I. (2009). Inventariação e Análise de Eventos Hidro-Geomorfológicos com Carácter Danoso em Portugal Continental. M.S. thesis, Faculty of Letters, University of Lisbon, 100.
Raible, C. C. (2007). On the relation between extremes of midlatitude cyclones and the atmospheric circulation using ERA40. Geophys. Res. Lett. 34:L07703. doi: 10.1029/2006GL029084
Ralph, F. M., and Dettinger, M. D. (2011). Storms, floods, and the science of atmospheric rivers. Eos Trans. Am. Geophys. Union 92, 265. doi: 10.1029/2011EO320001
Ralph, F. M., Neiman, P. J., Wick, G. A., Gutman, S. I., Dettinger, M. D., Cayan, D. R., et al. (2006). Flooding on California's Russian River: role of atmospheric rivers. Geophys. Res. Lett. 33:L13801. doi: 10.1029/2006GL026689
Ralph, F., Neiman, P., and Wick, G. (2004). Satellite and CALJET aircraft observations of atmospheric rivers over the eastern North Pacific Ocean during the winter of 1997/98. Mon. Weather Rev. 132, 1721–1745. doi: 10.1175/1520-0493(2004)132%3C1721:SACAOO%3E2.0.CO;2
Rodríguez-Puebla, C., Encinas, A. H., Nieto, S., and Garmendia, J. (1998). Spatial and temporal patterns of annual precipitation variability over the Iberian Peninsula. Int. J. Climatol. 18, 299–316.
Salgueiro, A. R., Machado, M. J., Barriendos, M., Pereira, H. G., and Benito, G. (2013). Flood magnitudes in the Tagus River (Iberian Peninsula) and its stochastic relationship with daily North Atlantic Oscillation since mid-19th Century. J. Hydrol. 502, 191–201 doi: 10.1016/j.jhydrol.2013.08.008
Santo, F. E., de Lima, M. I. P., Ramos, A., and Trigo, R. M. (2014b). Trends in seasonal surface air temperature in mainland Portugal, since 1941. Int. J. Climatol. doi: 10.1002/joc.3803
Santo, F. E., Ramos, A. M., Lima, M. I. P., and Trigo, R. M. (2014a). Seasonal changes in daily precipitation extremes in mainland Portugal from 1941 to 2007. Reg. Environ. Chang. doi: 10.1007/s10113-013-0515-6
Smith, K., and Ward, R. (1998). Floods: Physical Processes and Human Impacts. Chichester: John Wiley and Sons.
Sousa, P. M., Trigo, R. M., Aizpurua, P., Nieto, R., Gimeno, L., and Garcia-Herrera, R. (2011). Trends and extremes of drought indices throughout the 20th century in the Mediterranean. Nat. Hazards Earth Syst. Sci. 11, 33–51. doi: 10.5194/nhess-11-33-2011
Stickler, A., Bronnimann, S., Valente, M. A., Bethke, J., Sterin, A., Jourdain, S., et al. (2014). ERA-CLIM: historical surface and upper-air data for future reanalyses. Am. Met. Soc. doi: 10.1175/BAMS-D-13-00147.1
Stohl, A., Forster, C., and Sodemann, H. (2008). Remote sources of water vapor forming precipitation on the Norwegian west coast at 60°N–a tale of hurricanes and an atmospheric river. J. Geophys. Res. 113:D05102. doi: 10.1029/2007JD009006
Trigo, I. F. (2006). Climatology and interannual variability of storm-tracks in the Euro-Atlantic sector: a comparison between ERA-40 and NCEP/NCAR reanalyses. Clim. Dyn. 26, 127–143. doi: 10.1007/s00382-005-0065-9
Trigo, R. M., Pozo-Vázquez, D., Osborn, T. J., Castro-Díez, Y., Gámiz-Fortis, S., and Esteban-Parra, M. J. (2004). North Atlantic oscillation influence on precipitation, river flow and water resources in the Iberian Peninsula. Int. J. Climatol. 24, 925–944. doi: 10.1002/joc.1048
Trigo, R. M., Valente, M. A., Trigo, I. F., Miranda, P. M. A., Ramos, A. M., Paredes, D., et al. (2008). The impact of North Atlantic wind and cyclone trends on European precipitation and significant wave height in the Atlantic. Ann. N.Y. Acad. Sci. 1146, 212–34. doi: 10.1196/annals.1446.014
Ulbrich, U., Christoph, M., Pinto, J. G., and Corte-Real, J. (1999). Dependence of winter precipitation over Portugal on NAO and baroclinic wave activity. Int. J. Climatol. 390, 379–390.
Vaquero, J. M. (2004). Solar Signal in the number of floods recorded for the Tagus River Basin over the Last Millenium. Clim. Change 66, 27–28. doi: 10.1023/B:CLIM.0000043146.37662.de
Wang, X. L., and Feng, Y. (2010). RHtestsV3 User Manual. Toronto, ON: Climate Research Division, Science and Technology Branch, Environment Canada.
Zêzere, J. L., Pereira, S., Tavares, A. O., Bateira, C., Trigo, R. M., Quaresma, I., et al. (2014). DISASTER: a GIS database on hydro-geomorphologic disasters in Portugal. Nat. Hazards. doi: 10.1007/s11069-013-1018-y
Keywords: floods, extremes precipitation, natural hazard, NAO, atlantic storms, atmospheric river
Citation: Trigo RM, Varino F, Ramos AM, Valente MA, Zêzere JL, Vaquero JM, Gouveia CM and Russo A (2014) The record precipitation and flood event in Iberia in December 1876: description and synoptic analysis. Front. Earth Sci. 2:3. doi: 10.3389/feart.2014.00003
Received: 03 February 2014; Accepted: 16 March 2014;
Published online: 03 April 2014.
Edited by:
Anita Drumond, University of Vigo, SpainReviewed by:
Sergio M. Vicente-Serrano, Spanish National Research Council, SpainEduardo Zorita, Hemlholtz-Zentrum Geesthacht, Germany
Copyright © 2014 Trigo, Varino, Ramos, Valente, Zêzere, Vaquero, Gouveia and Russo. This is an open-access article distributed under the terms of the Creative Commons Attribution License (CC BY). The use, distribution or reproduction in other forums is permitted, provided the original author(s) or licensor are credited and that the original publication in this journal is cited, in accordance with accepted academic practice. No use, distribution or reproduction is permitted which does not comply with these terms.
*Correspondence: Ricardo M. Trigo, Instituto Dom Luiz (IDL), Faculdade de Ciências, Universidade de Lisboa, Campo Grande, Ed C8, Piso 3, 1749-016 Lisboa, Portugal e-mail: rmtrigo@fc.ul.pt