Displacement and stress fields around rock fractures opened by irregular overpressure variations
 Shigekazu Kusumoto
 Agust Gudmundsson
- 1Graduate School of Science and Engineering for Research, University of Toyama, Toyama, Japan
- 2Department of Earth Sciences, Royal Holloway, University of London, Surrey, UK
Many rock fractures are entirely driven open by fluids such as ground water, geothermal water, gas, oil, and magma. These are a subset of extension fractures (mode I cracks; e.g., dikes, mineral veins and joints) and are referred to as hydrofractures. Field measurements show that many hydrofractures have great variations in aperture. However, most analytical solutions for fracture displacement and stress fields assume the loading to be either constant or with a linear variation. While these solutions have been widely used, it is clear that a fracture hosted by heterogeneous and anisotropic rock is normally subject to loading that is neither constant nor with a linear variation. Here we present new general solutions for the displacement and stress fields around hydrofractures, modeled as two-dimensional elastic cracks, opened by irregular overpressure variations given by the Fourier cosine series. Each solution has two terms. The first term gives the displacement and stress fields due to the average overpressure acting inside the crack; it is given by the initial term of the Fourier coefficients expressing the overpressure variation. The second term gives the displacement and stress fields caused by the overpressure variation; it is given by general terms of the Fourier coefficients and solved through numerical integration. Our numerical examples show that the crack aperture variation closely reflects the overpressure variation. Also, that the general displacement and stress fields close to the crack follow the overpressure variation but tend to be more uniform far from the crack. The present solutions can be used to estimate the displacement and stress fields around any fluid-driven crack, that is, any hydrofracture, as well as its aperture, provided the variation in overpressure can be described by Fourier series. The solutions add to our understanding of local stresses, displacements, and fluid transport associated with hydrofractures in the crust.
Introduction
Rock fractures play a fundamental role in a variety of geological processes. For example, volcanic eruptions worldwide are primarily fed through magma-driven fractures (dikes or inclined sheets) that significantly affect the tectonic evolution of the crust (e.g., Spence et al., 1987; Clemens and Mawer, 1992; Rubin, 1995; Gudmundsson, 2006). Similarly, assessments of likely dike paths and rates of propagation play an important role in volcanic hazard maps. Paths for fluids are commonly formed through the generation of interconnected clusters of fractures. The propagation and liking up of fractures of various sizes have been widely discussed and modeled (e.g., Macdonald et al., 1984; Pollard and Aydin, 1984; Gudmundsson, 1987a,b; Pollard and Segall, 1987; Baud and Reuschle, 1997; Andrew and Gudmundsson, 2008). The results indicate that geometric arrangement of the fractures, and the distances between them, largely control their linking up into interconnected clusters.
Most fluids transported by rock fractures are less dense than the host rock and thus buoyant. Many have studied buoyancy effects on hydrofracture propagation in the crust (e.g., Spence et al., 1987; Lister, 1990; Lister and Kerr, 1991; Meriaux and Jaupart, 1998; Roper and Lister, 2005; Becerril et al., 2013; Philipp et al., 2013). In particular, the effects of neutral buoyancy, that is, levels in the crust where the magma density in a dike equals that of the crustal layers through which the dike propagates, has received considerable attention (Rivalta and Dahm, 2006; Kuhn and Dahm, 2008; Becerril et al., 2013). One result, discussed in detail by Chen et al. (2007), is that the dike rate of propagation may decrease as its tip approaches a level of neutral buoyancy. However, field observations show that basaltic dikes commonly propagate easily through less dense crustal layers, suggesting that neutral buoyancy alone is not sufficient to arrest the dikes or deflect them into sills (Gudmundsson, 2011, 2012; Galindo and Gudmundsson, 2012). It has been suggested that simultaneous injection of narrowly spaced dikes may also reduce their rate of propagation (Jin and Johnson, 2008), a very interesting process which may, however, be rare in nature. An overpressured elastic crack, with or without buoyancy effects, is the standard model of dike emplacement, a process that can normally be detected and monitored through associated crustal deformation, gravity changes, and earthquakes (e.g., Okubo and Watanabe, 1989; Okada and Yamamoto, 1991; Davis et al., 2001; Hayashi and Morita, 2003; Jousset et al., 2003; Klügel et al., 2005; Morita et al., 2006; Bonforte et al., 2007; Galindo and Gudmundsson, 2012; Becerril et al., 2013).
There are many analytical solutions for the displacement, strain, and stress fields around overpressured elastic cracks (e.g., Sneddon and Lowengrub, 1969; Okada, 1985, 1992; Pollard and Segall, 1987; Maugis, 2000; Tada et al., 2000; Becerril et al., 2013). While some allow the overpressure to vary linearly within the crack (e.g., Valko and Economides, 1995; Gudmundsson et al., 2002), most solutions assume that the overpressure is constant and the crack hosted by a homogeneous, isotropic, elastic material. These solutions have been widely used in applied and theoretical work (e.g., Sneddon and Lowengrub, 1969; Valko and Economides, 1995; Economides and Nolte, 2000; Geshi et al., 2010; Becerril et al., 2013; Kusumoto et al., 2013a) but are less appropriate for cracks subject to an overpressure that varies irregularly, such as is common in heterogeneous and anisotropic rocks. While crack problems in heterogeneous and anisotropic materials can, theoretically, be tackled using numerical programs (e.g., Geshi et al., 2012; Gudmundsson et al., 2012), analytical solutions provide important tests of the numerical results (and vice versa) and offer insight into the physics of the associated processes.
Overpressure variations and associated opening displacements can be modeled analytically in several ways. Some authors use polynomials (Valko and Economides, 1995; Gudmundsson et al., 2002), while others use Maclaurin series (Sneddon, 1951). For example, Bonafede et al. (1985) analyzed the stress field at the tip of a crack using Chebyshev polynomials to describe overpressure variation in the crack, and Bonafede and Olivieri (1995) used this approach for dike emplacement at shallow depth in the crust. Gudmundsson (2011), Gudmundsson et al. (2012) and Kusumoto et al. (2013b) describe the overpressure variation in the crack by Fourier series and derived solutions giving crack shapes for cracks subject to irregular variation in overpressure. Kusumoto et al. (2013b) presented the solution for the inverse model that estimates the fluid overpressure distribution in the crack from its shape. These solutions are helpful for understanding and discussing relationship between fracture shape and overpressure. However, these solutions would not be suitable for analysing the deformation and stress fields of a rock hosting a fracture whose opening is controlled by an irregular overpressure.
Hence, as the principal aim of this paper, we present new, general solutions for the displacements (opening) and stress fields generated by fluid-driven cracks (hydrofractures) subject to irregular overpressure variations. In order to utilize results and/or modeling methods given by Gudmundsson (2011), Gudmundsson et al. (2012) and Kusumoto et al. (2013b), we describe the overpressure in the crack by Fourier cosine series and derive the solutions from the basic formulas based on the Fourier transform (e.g., Sneddon, 1951; Sneddon and Lowengrub, 1969). Our observational motivation for providing the solutions is given in the next section. Because the Fourier series can express all overpressure variations in cracks, including those presented by discontinuity functions, these general solutions can be used to calculate the displacements or openings and stress fields around a variety of rock fractures.
Motivation
Field observations show that the apertures (double opening displacements) of rock fractures, when measured along their lengths (strike dimensions) as well as their heights (dip dimensions), commonly vary irregularly (Figure 1). This applies, for example, to many mineral veins, ranging in lengths from a few tens of centimeters to many meters. The same applies to dikes, large tension fractures, and normal faults ranging in lengths from a few hundred meters to many kilometers or tens of kilometers. For all these fractures, the aperture variations are normally too large to be explained in terms of inaccuracy in the measurements.
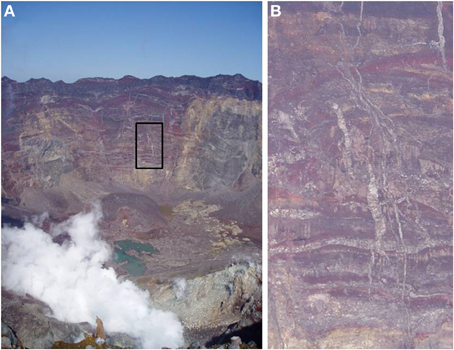
Figure 1. Dikes varying in thickness in the caldera walls of the Miyake-jima volcano, Japan. (A) Dike swarm observed at the northwestern part of the caldera wall. Area closed by a rectangle at the center of this figure is presented in (B). (B) Dikes at the center of this picture have conspicuous thickness variations. Other thin dikes around these have also thickness variations.
As an example of large fluid-driven fractures (hydrofractures) with variable aperture, consider regional dikes. Delaney and Pollard (1981) and Gudmundsson (1983a) studied the variation in aperture, measured as thickness, of regional mafic (basaltic) dikes in New Mexico and East Iceland, respectively, with lengths of several kilometers. The host rock of the New Mexico dikes is shale, whereas the host rock of the Icelandic dikes is a pile of basaltic lava flows and, in between the lava flows, scoria and soil layers. A 200-m-long dike segment studied by Delaney and Pollard (1981) shows irregular thickness variations of 0.5–1 m near its central part, while the maximum dike thickness in this central part is about 3 m. Gudmundsson (1983a) measured the thickness variation along 2–2.5-km-long parts of two dikes in East Iceland, both of which have a maximum thickness of 9–10 m. The dikes show irregular thickness variations of 2–3 m and, in places, by as much as 4–6 m. Thus, all three dikes vary irregularly in thickness by about 30%, and the Icelandic dikes by up to 50%, of the maximum thickness. Thickness variations of dikes along their heights are also documented (Gudmundsson, 1983a).
Similar thickness variations occur in mineral veins. As an example, consider the measurements of the thickness variations of several 2–3 m long mineral veins in North Iceland (Berg, 2000; Skurtveit, 2000). The veins are hosted by basaltic lava flows and are non-restricted, that is, do not end in other veins or structures. The mineral fill is mostly zeolites, quartz and calcite. Some veins have a maximum thickness of 10–15 mm, others as much as 20–25 mm. The thicknesses vary irregularly along the vein lengths, but commonly by about 5 mm, the variations being generally larger for the thicker veins, occasionally as much as 10–15 mm. The variation is normally 20–40%, but in places 50–70%, of the maximum vein thickness. Similar results were obtained for the thickness variation of several 2–5-m-long quartz veins in gneiss in West Norway (Simmenes, 2002). Thickness variations of mineral veins along their heights, particularly in layered rocks, are also documented (e.g., Philipp, 2012; Philipp et al., 2013).
All hydrofractures are primarily driven open by the internal fluid overpressure. The fluid is magma for dikes and geothermal water for mineral veins, but for other hydrofractures the fluid may be ground water, gas, and oil. Apart from its theoretical interest, aperture variation in fractures has important mechanical implications, in particular as regards flow channeling (Tsang and Neretnieks, 1998). The cubic law implies that the volumetric rate of flow of fluid through a fracture is related to the cube (the third power) of the fracture aperture. It follows that any significant variation in fracture aperture may lead to much of the fluid flow becoming confined to those segments of the fracture that have unusually large apertures. Flow channeling is thus of importance for understanding transport of fluids in the crust, such as in fractured reservoirs, seismogenic fault zones, and volcanoes.
Consider, for example, the supply of magma during dike-fed fissure eruptions. Overpressure variations may help explain the formation of exceptionally wide (large-aperture) segments along dikes (Delaney and Pollard, 1981; Gudmundsson, 1983a), segments that subsequently may develop into circular conduits and, on solidification, plugs, or necks. While thermal erosion may also play a part in their formation (Delaney and Pollard, 1981; Bruce and Hubbert, 1989; Ida, 1992), we suggest that flow channeling in the feeder dike is one principal reason for the formation of crater cones, a fundamental volcanotectonic feature of fissure eruptions worldwide (e.g., Thordarson and Self, 1993).
Most fluid-driven fractures (dikes, sheets, sills, mineral veins, and many joints) are extension fractures. By definition, the stress acting perpendicular to an extension fracture is the minimum compressive (maximum tensile) principal stress, σ3. In heterogeneous and anisotropic rocks, the mechanical properties, in particular the Young's moduli, of the layers and units through which a fluid-driven fracture propagates commonly vary abruptly. Even in single Holocene basaltic lava flows, in which many of the fractures discussed above are located, Young's modulus may vary considerably (Gudmundsson, 1983b). This follows, first, because the frequency and orientation of joints, other discontinuities and cavities varies throughout the flow. Second, because cavities such as gas bubbles generally concentrate in layers or zones within the lava flows (or flow units in pahoehoe flows), commonly at its bottom and top, where the rock material also tends to be more compliant (with a lower Young's modulus) because of scoria—particularly in aa lava flows. Young's modulus may vary by a factor of four within a single flow (Gudmundsson, 1983b). In addition, as a rule, Young's modulus decreases with increasing number of discontinuities and cavities in a direction perpendicular to the loading (Priest, 1993; Nemat-Nasser and Hori, 1999). Thus, even when the remote tectonic loading is constant, the local stresses in the host rock, including σ3, may change irregularly between layers and units. Since the fluid overpressure in a fracture depends on the magnitude of σ3 in each rock unit dissected by the fracture,it follows that the overpressure may also vary irregularly between the units.
The principal aim of this study is to understand better the common irregular and large changes in rock-fracture apertures. In the analytical models, we present the overpressure variations by Fourier cosine series, allowing calculations of the aperture variation as well as the local displacement and stress fields around the factures. The aperture variations of the tension fractures and normal faults are mostly related to variation in driving (tensile or shear) stress. Because the driving stress is the difference between the remote applied (tensile or shear) stress and the residual strength (tensile or shear) on the fracture surface after opening or sliding, the present method can also be used to model opening and slip variations along tension fractures and faults. In this paper, however, the focus is on aperture variations and stress and displacement fields generated by overpressure in fluid-driven fractures, that is, hydrofractures.
In the next section, we show the basic model describing displacement and stress fields in two-dimensional elastic crack problems, and derive the common fundamental solutions for overpressure expressed by the Fourier cosine series. Moreover, in the sections of DISPLACEMENT FIELDS and STRESS FIELDS we will show the solutions for displacement fields and stress fields under the given conditions. In these sections, we derive each solution step by step by showing the necessary integral formulas. Well-known solutions for the uniform overpressure model are also shown for comparison with our model.
Basic Model
The fundamental solutions for the displacement (ux, uy) and stress (σxx, σyy, τxy) fields around an elastic crack in the two-dimensional x–y coordinate system (Figure 2) were obtained by Sneddon and Lowengrub (1969) by means of the Fourier transform, namely as
where E and v are Young's modulus and Poisson's ratio, respectively, and:
and J0(ξt) is the zero-order Bessel function of the first kind. In addition, f(t) is defined as
and p(x) is the function expressing the fluid overpressure in the crack of which half-length is c. In order to solve this problem, Sneddon and Lowengrub (1969) set the following boundary conditions (Figure 2).
and the condition for the half-plane y ≥ 0 at infinity () are as follows
These boundary conditions indicate that the problem is symmetric, the symmetry axes being x = 0 and y = 0. Thus, the overpressure variation in the crack can be given by the even function p( − x) = p(x). For the function p(x), describing overpressure in the crack, we introduce the Fourier cosine series, which can cover all function, including discontinuous function, namely
where a0 and an (n = 1, 2, 3, …) are the Fourier coefficients and ω is an angular frequency defined by ω = π/c. The initial term a0/2 indicates the average value; here it denotes the average fluid overpressure in the crack. The general terms, an, indicates the variation in amplitude; here it denotes the variation in amplitude of the overpressure.
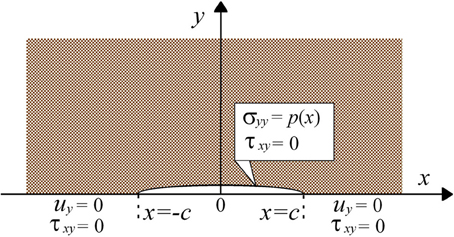
Figure 2. Illustration of the basic crack model and boundary conditions used in this study. The stress field is symmetrical about the line y = 0. The components of the displacement vector normal to the x-axis and the shear stress τxy are both zero outside the crack. Inside the crack, the normal component of stress is prescribed to be equal to p(x) and the shear stress to be zero. The fluid overpressure inside the crack is given by even function, p( − x) = p(x).
Substituting Equation (10) into Equation (7) and applying the following integral formula (e.g., Gradshteyn and Ryzhik, 2007)
the function f(t) becomes
Applying the integral formula
and the Lommel's integral formula (e.g., Sneddon, 1951)
to the first and second terms of the Equation given by substituting Equation (12) into Equation (6), we obtain the function Ψ (ξ) as
Here, J1(cξ) is the first-order Bessel function of the first kind. In the following equations, we rewrite the second term of Equation (15) using
so that the function Ψ becomes
We can obtain the displacement and stress fields around the crack by integrating the expressions obtained when the function Ψ, given by Equation (17), is put into Equations (1) to (5). Following the tradition in structural geology and rock physics (e.g., Jaeger et al., 2007; Gudmundsson, 2011), compressive stress is considered positive and tensile stress negative.
Displacement Fields
By substituting Equation (17) into Equations (1) and (2), we obtain the following expressions for the displacement field
Here we introduce the complex number z = x + iy and the complex conjugate of z = x − iy, and rewrite the first integrals in Equations (18) and (19) so as to obtain
For polar coordinates with the center and tips (edges) of the crack as the origins (Figure 3), we have
where r = (x2 + y2)1/2, r1 = [(x − c)2 + y2]1/2 and r2 = [(x + c)2 + y2]1/2. Also, θ, θ1, and θ2 are defined by the counter-clockwise from the x-axis and their origins are x = 0, c and –c, respectively.
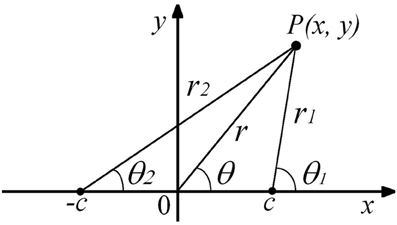
Figure 3. The coordinates of (r, θ), (r1, θ1), and (r2, θ2).
Using the polar coordinates, the integral formulas
can be rewritten as
From these formulas, the displacement field around a crack opened by irregular overpressure variations is given by
Equations (29) and (30) consist of a first term and a second term, including the initial term and the general terms of the Fourier coefficients. In calculations, one must ensure that the angles θ, θ1, and θ2 (Figure 3) are always positive. Also, the reverse of the sign of y and of the symbol (+ or −) connecting the first term and second term must be used for y < 0, so as to avoid divergence of any integration including exp(-y). The integration of the second terms in Equations (29) and (30) cannot be carried out analytically and so must be done numerically, using the double exponential transformation method for numerical integration (e.g., Takahashi and Mori, 1974; Mori, 2005; Davis and Rabinowitz, 2007).
If the fluid overpressure in the crack is constant, then p(x) = p0 and we can obtain the following simple formulas (with a0 = 2p0 and an = 0)
From Equation (32), the crack shape and its maximum opening displacement (half the maximum aperture for a hydrofracture) can be obtained. The crack shape is the given as the following well-known formula (e.g., Sneddon and Lowengrub, 1969) under the conditions of y = 0, θ = θ2 = 0, θ1 = π, −c ≤ r ≤ c, −2c ≤ r1 ≤ 0, and 0 ≤ r2 ≤ 2c.
The maximum opening displacement occurs at the point x = 0 and y = 0 (the center of the crack), namely r = 0, r1 = r2 = c and (θ1 + θ2)/2 = π/2. This follows because this point is at the greatest distance from the crack tips (the lateral ends of the crack) where, by definition, the displacement is zero (Figure 2). The relationship between p0 and uy(0,0), from Equation (32) or (33), is given by
This well-known Equation (e.g., Sneddon and Lowengrub, 1969) shows that the maximum opening displacement depends much on the crack half-length, c, and the host-rock Young's modulus, E. Fluid-driven fractures seen in the field range in lengths from a few centimeters (some joints and mineral veins) to hundreds of kilometers (some dikes) (e.g., Baer and Heimann, 1995; Gudmundsson et al., 2002). Also, the Young's moduli of common rocks differ by three orders of a magnitude or more (Carmichael, 1989; Bell, 2000; Gudmundsson, 2011). By contrast, the effect of Poisson's ratio ν on the displacement is small because its value is in the narrow range of 0.1–0.3 for most rocks (Bell, 2000; Gudmundsson, 2011). Equation (34) can be used not only as a calculation check for the case of a constant overpressure in a rock fracture, but also to make crude estimates of the average fluid overpressure during emplacement of mineral veins and dikes and other hydrofractures (e.g., Delaney and Pollard, 1981; Gudmundsson, 1983a, 2011; Pollard and Segall, 1987; Gudmundsson et al., 2002; Geshi et al., 2010). For man-made hydraulic fractures, Equation (34) is occasionally used for a field estimate of Young's modulus (Valko and Economides, 1995).
Stress Fields
Substituting Equation (17) into Equations (3), (4), and (5), the stresses are
Using complex numbers in each first term, Equations (35–37) become
Using Equations (27) and (28) and the formula
in the following form
Equations (38–40) can be rewritten to so as to give the stress fields thus
The stress field Equations (44–46) have basically the same structure as the displacement field Equations (29) and (30). Both sets of Equations consist of first terms, giving the stresses and displacement related to the average fluid overpressure in the crack, and second terms, giving the stresses and displacements related to the overpressure variations (amplitudes). The integration of the second terms of Equations (44–46) cannot be carried out analytically and must, therefore, be done numerically. Again, the numerical evaluation was made using the double exponential transformation method (e.g., Takahashi and Mori, 1974; Mori, 2005; Davis and Rabinowitz, 2007).
If the overpressure in the crack is constant, then p(x) = p0 (and a0 = 2p0, an = 0), we obtain the simple well-known formulas for the stress fields, namely (Sneddon and Lowengrub, 1969)
Numerical Examples and Discussion
As numerical examples, consider the displacement and stress fields around a crack subject to the various overpressure conditions illustrated in Figures 4A–C. Each overpressure condition was approximated by applying Fourier series of 1000 orders.
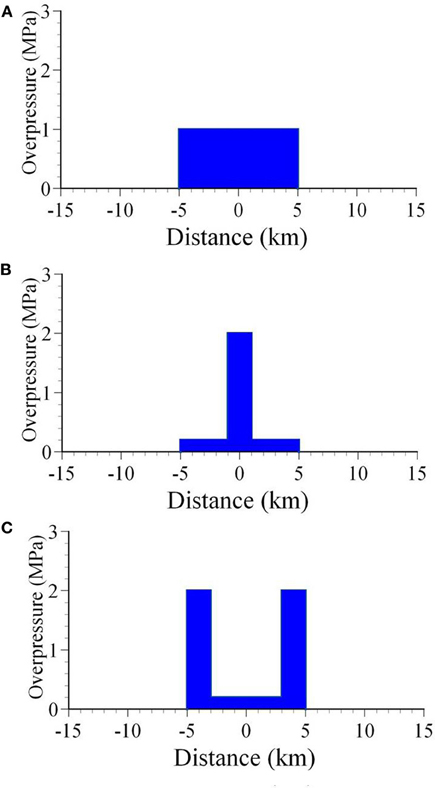
Figure 4. Crack-overpressure conditions. (A) Constant overpressure (1MPa). (B) In the central 2-km-long part of the crack the overpressure is 2 MPa, otherwise 0.2 MPa. (C) In a 2-km-long part at either tip (end) of the crack the overpressure is 2 MPa, otherwise 0.2 MPa.
In these calculations, a static host-rock Poisson's ratio of 0.25 and a Young modulus of 1 GPa are used; these are common values for many near-surface volcanic rocks (Carmichael, 1989; Bell, 2000; cf. Gudmundsson, 2011). The crack half length (half the strike dimension) is taken as 5 km, similar to that of many of the regional dikes measured in Iceland (Gudmundsson, 1983a). The crack half length, however, is arbitrary; if it were taken as 0.5 m, rather than 5 km, the length would be similar to that of many mineral veins (Berg, 2000; Skurtveit, 2000; Gudmundsson et al., 2002; Philipp, 2012; Philipp et al., 2013). Some of the overpressure variations in Figure 4 are made somewhat extreme, so as to maximize their potential effects on the displacement and stress fields. Variation in fracture overpressure of the kind shown in Figures 4B,C are to be expected in lateral and vertical sections through heterogeneous and anisotropic rocks where Young's modulus, hence the local minimum compressive (maximum tensile) principal stress, σ 3, changes abruptly between rock units or layers. Similar local stress changes are well known in layered rocks (Economides and Nolte, 2000; Gudmundsson, 2011).
The overpressure variation may also, partly, be due to the effect of gas, which can change its volume rapidly as a result of temperature and/or pressure changes. There is, therefore, a possibility that gas in the magma might change the overpressure distribution rapidly and significantly in a short time independently of the stiffness variation of the host rock along the crack. It is necessary to study on this potential dynamic effect of gas on overpressure in a further development of the present work.
The results are shown in Figures 5–8. In each figure, illustrations (A–C) correspond to the overpressure condition in Figures 4A–C. More specifically, Figure 5 is a vector description of displacement field whereas Figure 6 shows the crack aperture (geometry) resulting from the overpressure distribution. Close to y = 0, the numerical integration is unstable and the results are less accurate although we can calculate aperture near the crack (e.g., opening displacements at the distance of 1 m from y = 0) by Equation (30). The exact solutions giving the crack aperture along y = 0 have been given by Gudmundsson et al. (2012) and Kusumoto et al. (2013b) as follows.
and/or
Here, εn = 2 if n = 0, and εn = 1 if n ≠ 0. These exact solutions are obtained by changing the order of integration in Equation (2), as described in detail by Kusumoto et al. (2013b). The crack shapes shown in Figure 6 were calculated using Equation (50) and Gauss-Legendre numerical integration (e.g., Davis and Rabinowitz, 2007) was employed for calculations of the second term of Equation (50). Figure 7 shows the orientations (trajectories) and relative magnitudes (indicated by the lengths of the ticks) of the maximum (σ 1) and minimum (σ3) compressive principal stresses. Figure 8 is contour map of the maximum shear stress, τmax = (σ1-σ3)/2.
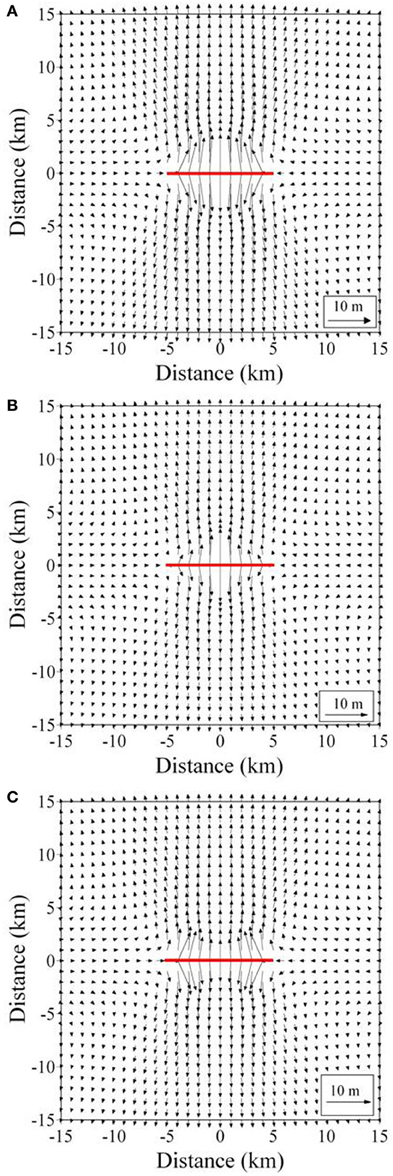
Figure 5. Vector description of the horizontal displacement field under the overpressure conditions in Figure 4. Each figure (A), (B) and (C) shows the results calculated for the conditions shown in Figures 4A–C. Red bold line in each figure indicates the location of the crack.
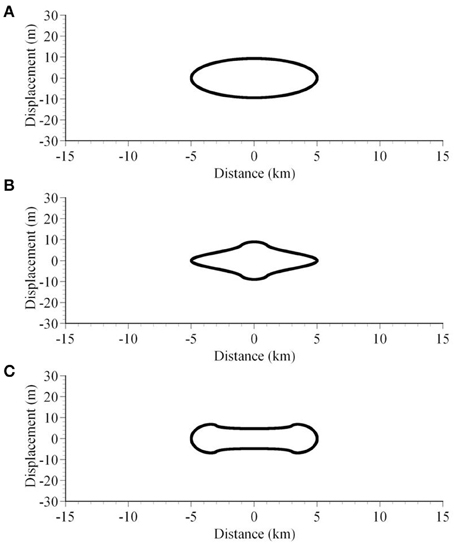
Figure 6. Crack aperture (double crack-opening displacement) as a result of the overpressure conditions in Figure 4. Each figure (A–C) shows the results calculated for the conditions shown in Figures 4A–C.
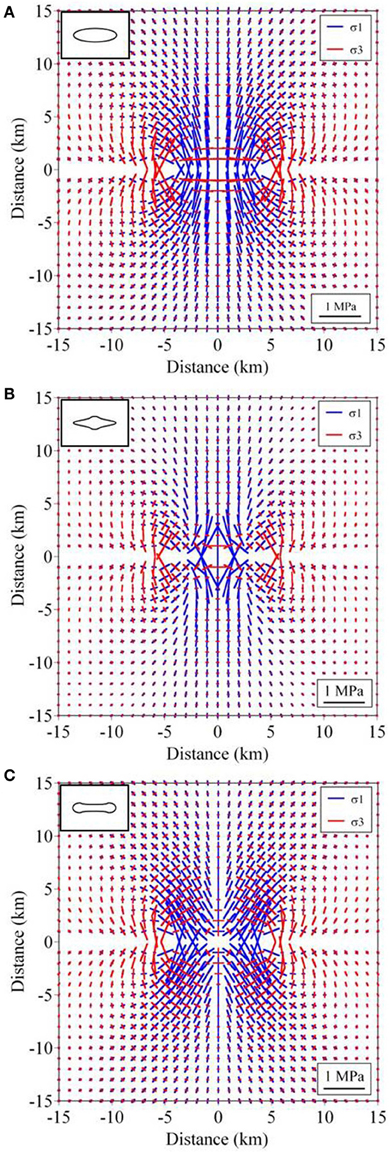
Figure 7. The principal stresses (stress trajectories) for the overpressure condition in Figure 4. Each figure (A–C) shows the results calculated for the conditions shown in Figures 4A–C. Figures shown in the upper left of each figure are schematic illustrations of the crack aperture (Figure 6).
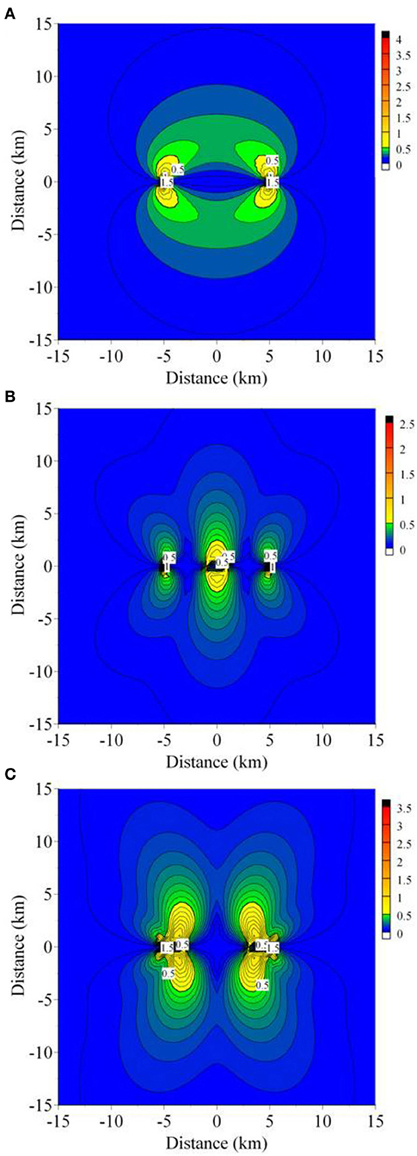
Figure 8. Distribution of the maximum shear stress field, τmax = (σ1 − σ3)/2, under the overpressure conditions in Figure 4. Each figure (A–C) shows the results calculated for the conditions in Figures 4A–C. The stress magnitudes are in mega-pascals (MPa). Contour interval in (A) is 0.1 MPa, and contour intervals in (B) and (C) are 0.05 MPa.
Clearly, the displacement field near to the crack (Figure 5) and the crack shape or aperture variation (Figure 6) closely reflect the overpressure variations. Comparatively far from the crack, however, the displacement field becomes more uniform. In the present models, it is difficult to recognize the overpressure variation in the displacements at distances of more than about one-fourth of the crack length, that is, for a crack of length 10 km, a distance of more than 2.5 km (Figure 5).
These results have implications for geodetic measurements during dike emplacement in volcanoes and rift zones. Although it is known from field measurements that dike thicknesses vary considerably along their lengths (Delaney and Pollard, 1981; Gudmundsson, 1983a; Pollard and Segall, 1987), and that feeder-dikes commonly develop crater cones (Thordarson and Self, 1993), indicating irregular variations in apertures (fracture opening displacements), the far-field crustal displacements attributed to a dike emplacement tend to be smooth curves. Thus, Tryggvason's (1983, 1984) geodetic measurements of the widening of the Krafla Fissure Swarm in North Iceland as a results dike emplacement yielded smooth variation in displacement. Similar results are obtained through more recent geodetic studies, such as during the emplacement of a 8-m-thick and 60-km-long dike in the Afar Rift (Wright et al., 2006). Thus, displacements measured far from a dike would normally indicate a thickness variation similar to that of a flat ellipse and, therefore, that the overpressure in the dike was constant. If remote sensing methods such as InSAR would be applied to observation of crustal movement due to dike emplacement reaching the free surface, it would be able to observe complex displacement field reflecting irregular overpressure at the surface and can be helpful to get details of emplacement mechanics and/or overpressure information.
Figure 7 shows that the stress field close to the crack also reflects its overpressure variation quite well. Again, however, at greater distances (more than about 5 km) the stresses become more uniform and thus difficult to use to distinguish between the various overpressure distributions, in agreement with the displacement-field variation (Figure 5). When the crack overpressure is constant (Figure 4A) or maximum at the crack tips (Figure 4C), the shear stress peaks at the tips of the crack (Figures 8A,C). By contrast, when the overpressure is maximum in the crack center (Figure 4B), the large shear stress occurs around the central part of the crack (Figure 8B). However, the shear stress peaks at the tips of the crack. Thus, for most of these loading conditions, new shear fractures might be expected to develop from the tips of the existing fluid-driven crack provided the fracture toughness of the material is reached (Tada et al., 2000).
The solutions in this paper for the displacement and stress fields around a single crack opened by an irregular overpressure can be extended to problems involving several cracks. Because the present solutions are based on linear elasticity, superposition of solutions allows us to consider crack-crack interaction as well as external loading in addition to internal fluid overpressure. In Figures 5–8 we present the displacements fields, the fracture geometry, the stress trajectories, and the maximum shear-stress magnitudes, but not the strains. The strain fields can easily be derived by the Hooke's law between stress and strain (e.g., Jaeger et al., 2007).
In this paper, we deal with the displacement and stress fields caused by the overpressure variation along an elastic crack in the homogeneous material (host rock). However, there is also the case of host-rock heterogeneity to be considered, namely stiffness variation, along the crack. For this case, it is generally difficult to obtain analytical solutions so that the effects of heterogeneity of the host rock are normally discussed using numerical simulations (e.g., Geshi et al., 2012; Gudmundsson et al., 2012). These simulations show that the crack opening is large in a soft layer and small in a stiff layer and that stress fields change abruptly at the layer boundaries, even if the initial applied overpressure in the crack is constant.
Application to Field Data
Here we apply the solutions given in Equations (29), (30), (44), (45) and (46) to a mineral vein observed in Norway (Figure 9) and estimate the displacement and stress fields around the mineral vein. The vein is composed of quartz and the host rock is gneiss. As shown in Figure 9, its central part is somewhat thinner than the closer to the tips, and the shape is symmetry.
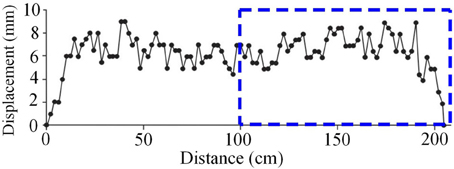
Figure 9. Aperture (double opening displacement) variation of a mineral vein observed in gneiss in West Norway. The mineral filling is quartz. The vein length in strike dimension is about 205 cm and its maximum thickness is 9 mm. The Fourier coefficients of the overpressure giving its shape were estimated using the half aperture geometry within the rectangle closed by blue dashed lines.
The Fourier coefficients of the overpressure giving its shape have been estimated already by Kusumoto et al. (2013b) and their important low degree coefficients, a0 and a1, are 5.717473 and −3.125885, respectively. In the estimation of the Fourier coefficients, Young's modulus and Poisson's ratio of 1GPa and 0.25, respectively, were assumed for the host rock. The comparatively low Young's modulus assumed here is because the host rock is assumed close to the surface at the time of crack formation. Figure 10 shows the overpressure distribution given by the Fourier coefficients, a0 and a1. The overpressure increases toward the tip of the mineral vein and reaches about 6 MPa near the tip (Figure 10). This value is close to the maximum in-situ tensile strength of the rock (e.g., Gudmundsson, 2011). In Figure 11, we show the theoretical geometry of the vein given by the estimated Fourier coefficients, a0 and a1. The theoretical geometry was calculated using Equation (51) and is shown here as twice the displacement given by Equation (51). This follows since the Equation gives the displacement of the upper half of the crack, so that the aperture in Figure 9 must be double the opening displacements. Figure 11 indicates that the theoretical geometry fits very well with the actual thickness variation of the mineral vein and its basic geometry.
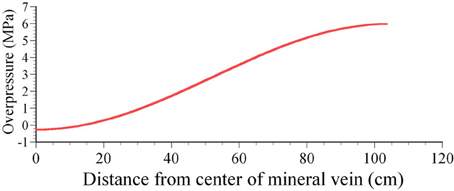
Figure 10. Overpressure distribution explaining the basic geometry of the mineral vein shown in Figure 9. The overpressure increases toward the tip of the vein and its maximum magnitude reaches about 6 MPa.
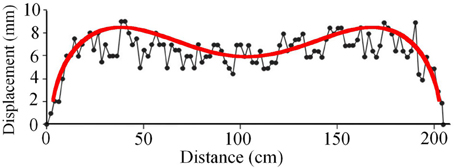
Figure 11. Theoretical geometry (red line) calculated from Equation (51) by the overpressure distribution shown in Figure 10. Since the aperture in Figure 9 is shown as double opening displacement and Equation (51) gives displacement in the upper half of the crack, the theoretical geometry here is given as twice the displacement calculated from Equation (51). Theoretical geometry fits very well with the aperture variation of the observed mineral vein.
Figures 12A–C show the displacement field, principal stress field and maximum shear stress field, respectively. Since the overpressure near the tip is larger than that of the central part, each distribution pattern of displacement field, principal stress field and maximum shear stress field is similar to each distribution pattern shown in Figures 5C, 7C, 8C derived by the overpressure distribution shown in Figure 4C. In addition, it is difficult to recognize the overpressure variation in the displacement and principal stress fields at distances of more than about one-fourth and/or half of the mineral vein length. This characteristic was found in Figures 5, 7 as discussed in the previous section, although the fracture size and the magnitude of the overpressure are different. Thus, in problems of this kind, it is common characteristic that the displacement and stress fields near the crack closely reflect the overpressure variations and become uniform far from the crack.
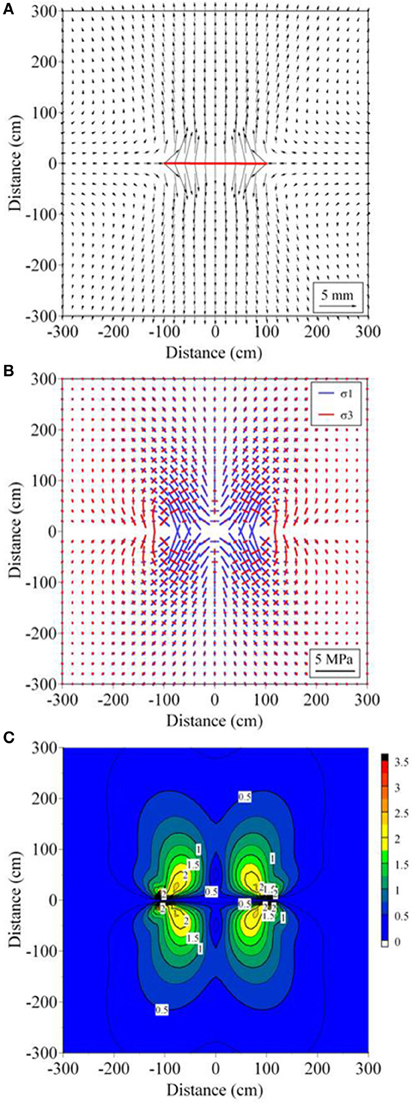
Figure 12. Displacement, principal stress and maximum shear stress fields around the mineral vein shown in Figure 9. (A) Vector presentation of the horizontal displacement field under the overpressure conditions in Figure 10. Red bold line indicates the location of the mineral vein. (B) The principal stresses (stress trajectories) for the overpressure condition in Figure 10. (C) Distribution of the maximum shear stress, τmax = (σ1 − σ 3)/2, under the overpressure conditions in Figure 10. The stress magnitude is in mega-pascals (MPa), and contour interval is 0.25 MPa.
In addition to implications of the results for geodetic measurements, discussed in the previous section, they are important for understanding better the initiation and development of rock fractures. One basic result is that the stress and displacement effects of irregular overpressure distribution in a single crack diminish rapidly with distance from the crack. That is, at a distance from the crack, the displacements are similar to those generated by a crack subject to uniform (constant) overpressure. Close to the crack, however, the irregular variations in overpressure may generate stress concentrations in the host rock that contribute to the formation of associated cracks, thereby contributing to the generation of a damage zone around the crack (Gudmundsson, 2011). The results also imply that the irregularities in the overpressure may not have great effects on the chosen large-scale propagation path of the crack. For example, the general propagation paths of dikes are known to depend on the regional stress field (e.g., Muller and Pollard, 1977; Nakamura, 1977) and much less so on magmatic overpressures, and their variations, in the dikes. Linking up of fractures, however, is not only affected by the regional stress field, but also by the local stress field, partly due to crack-crack interactions, and the local stress effects related to variation in fluid overpressure may affect the way the fractures link up (e.g., Pollard and Segall, 1987; Baud and Reuschle, 1997; Gudmundsson et al., 2003; Gudmundsson, 2011).
The crack-crack interactions are well known from field observations and numerical simulations, mostly using the constant-overpressure models. By combining regional stress field with the local effects of interacting cracks with varying overpressures, results presented here should be helpful in understanding better the development of observed fracture patterns, aperture variations, and associated fluid transport and flow channeling in rock-fracture networks.
Conclusions
The main conclusions of the paper may be summarized as follows:
Field observations show that many extension fractures are driven open by fluids such as ground water, geothermal water, gas, oil, and magma. These include dikes, mineral veins and many joints and are generally referred to as hydrofracctures. While some of the fractures have smoothly varying apertures or thicknesses, many show irregular aperture variations. Variations in fracture aperture commonly lead to flow channeling, which is of fundamental importance for understanding fluid transport in the crust. In particular, flow channeling plays an important role in fluid flow in fractured reservoirs and in magma transport and crater-cone formation during volcanic fissure eruptions.
The overpressure of a fluid-driven fracture, such as a dike or a mineral vein, is the total fluid pressure inside the fracture minus the normal stress (the minimum principal compressive stress σ3) perpendicular to the fracture. In anisotropic and heterogeneous rocks, such as in layered rocks, σ3 may vary abruptly from one layer or rock unit to the next. It follows that the overpressure varies in a similar way. For such conditions, analytical solutions where the fluid overpressure is assumed constant or linearly varying are not appropriate. Thus, in the present paper we have derived new, general two-dimensional analytical solutions for the displacement and stress fields around a crack opened by overpressure that varies irregularly along its length, using Fourier cosine series.
The new analytical solutions have two terms. The first terms give the displacements and stresses caused by the average overpressure in the crack. These are given by the initial terms of the Fourier coefficients and are solved analytically. The second terms give the displacements and stresses caused by the overpressure variations (amplitude) in the crack. These are given by the general terms of the Fourier coefficients, and are solved by employing numerical integration. For a crack opened by constant overpressure, only the first terms of each formula are used to calculate the displacements and stresses around the crack.
As numerical examples, we calculated the displacement and stress fields around cracks subject to the following loading conditions (Figure 4): (1) constant overpressure, (2) overpressure with a maximum at the center of the crack, and (3) overpressure with a maximum at either tip (lateral end) of the crack. The results show that the crack-opening displacement (Figure 6) and the near-field stresses and displacements (Figures 5, 7, 8) closely reflect the overpressure distribution. Thus, for example, if the complex displacement field due to fissure eruption or dike emplacement reaching the free surface would be observed by the remote sensing methods such as InSAR, we would be able to estimate overpressure distribution from displacement field close to fissure eruption or dike emplacement. And, if the overpressure variation is known, we can calculate quite accurately the likely resulting aperture of the crack (Figure 6). By contrast, the far-field displacements and stresses are more uniform, making it difficult to recognize the overpressure variation in the displacements at distances of more than about one-fourth of the crack length. Thus, regional geodetic studies made during a dike emplacement would commonly yield only the average opening-displacement of the dike rather than the details in the dike aperture and, for a feeder-dike, their potential for flow channeling and crater-cone formation.
The analytical solutions given here can be used to estimate the displacement and stress fields around any type of fluid-driven extension fracture, as well as its aperture variation, so long as the (sometimes highly irregular) variation in overpressure inside the fracture can be described by Fourier cosine series. The results should advance our understanding of fluid transport and flow channeling, as well as local stresses, displacements, and crack-crack interactions in fractured reservoirs, geothermal fields, fault zones, and volcanoes.
Author Contributions
SK derived main equations and he obtained results by performing calculations based on equations obtained. And he made the figures and wrote the manuscript. AG suggested basic idea of this study and wrote parts of the manuscript. And he revised the entire manuscript.
Conflict of Interest Statement
The authors declare that the research was conducted in the absence of any commercial or financial relationships that could be construed as a potential conflict of interest.
Acknowledgments
This work was done when the first author stayed in University of Göttingen, supported by a grant from the Tokai University General Research Organization Research Promotion Plan and Overseas Research Visit Program of the Tokai University. The first author is most grateful to Tokai University and to many people that supported him in Germany and Japan. The authors are also most grateful to Joel Ruch and Philippe Jousset for their constructive reviews and comments on the manuscript, and to Valerio Acocella for his editorial advice and cooperation. These helpful comments considerably improved the final version of the manuscript.
References
Andrew, R. E. B., and Gudmundsson, A. (2008). Volcanoes as elastic inclusions: their effects on the propagation of dikes, volcanic fissures, and volcanic zones in Iceland. J. Volcanol. Geotherm. Res. 177, 1045–1054. doi: 10.1016/j.jvolgeores.2008.07.025
Baud, P., and Reuschle, T. (1997). A theoretical approach to the propagation of interacting cracks. Geophys. J. Int. 130, 460–468. doi: 10.1111/j.1365-246X.1997.tb05661.x
Becerril, L., Galindo, I., Gudmundsson, A., and Morales, J. M. (2013). Depth of origin of magma in eruptions. Sci. Rep. 3:2762. doi: 10.1038/srep02762
Berg, S. S. (2000). Structural Analysis of Fracture Zones in Relation to Groundwater Potential of Fractured Rocks. M. Sc. thesis, University of Bergen, Bergen, 145.
Bonafede, M., Dragoni, M., and Boschi, E. (1985). Quasi-static models and the frictional stress threshold criterion for slip arrest. Geophys. J. R. Astron. Soc. 83, 615–635. doi: 10.1111/j.1365-246X.1985.tb04329.x
Bonafede, M., and Olivieri, M. (1995). Displacement and gravity anomaly produced by a shallow vertical dike in a cohesionless medium. Geophys. J. Int. 123, 639–652. doi: 10.1111/j.1365-246X.1995.tb06880.x
Bonforte, A., Carbone, D., Greco, F., and Palano, M. (2007). Intrusive mechanism of the 2002 NE-rift eruption at Mt Etna (Italy) modelled using GPS and gravity data. Geophys. J. Int. 169, 339–347. doi: 10.1111/j.1365-246X.2006.03249.x
Bruce, P. M., and Hubbert, H. E. (1989). Thermal control of basaltic fissure eruptions. Nature 342, 665–667. doi: 10.1038/342665a0
Carmichael, R. S. (1989). Practical Handbook of Physical Properties of Rocks and Minerals. London: CRC Press.
Chen, Z., Jin, Z. H., and Johnson, S. E. (2007). A perturbation solution for dike propagation in an elastic medium with graded density. Geophys. J. Int. 169, 348–356. doi: 10.1111/j.1365-246X.2006.03297.x
Clemens, J. D., and Mawer, C. K. (1992). Granitic magma transport by fracture propagation. Tectonophysics 204, 339–360. doi: 10.1016/0040-1951(92)90316-X
Davis, E., Wang, K., Thomson, R., Becker, K., and Cassidy, J. (2001). An episode of seafloor spreading and associated plate deformation inferred from crustal fluid pressure transients, J. Geophys. Res. 106, 21953–21963. doi: 10.1029/2000JB000040
Davis, P. J., and Rabinowitz, P. (2007). Methods of Numerical Integration, 2nd Edn. New York, NY: Dover.
Delaney, P., and Pollard, D. D. (1981). “Deformation of host rock and flow of mafic magma during growth of minette dikes and breccias-bearing intrusions near Ship Rock, New Mexico,” in U.S. Geological Survey Professional Paper (Washington, DC: United States Government Printing Office), 1202.
Galindo, I., and Gudmundsson, A. (2012). Basaltic feeder dykes in rift zones: geometry, emplacement, and effusion rates. Nat. Hazards Earth Syst. Sci. 12, 3683–3700. doi: 10.5194/nhess-12-3683-2012
Geshi, N., Kusumoto, S., and Gudmundsson, A. (2010). Geometric difference between non-feeder and feeder dikes. Geology 38, 195–198. doi: 10.1130/G30350.1
Geshi, N., Kusumoto, S., and Gudmundsson, A. (2012). Effects of mechanical layering of host rocks on dike growth and arrest. J. Volcanol. Geotherm. Res. 223, 74–82. doi: 10.1016/j.jvolgeores.2012.02.004
Gradshteyn, I. S., and Ryzhik, I. M. (2007). Table of Integrals, Series and Products, 7th Edn. London: Academic Press.
Gudmundsson, A. (1983a). Form and dimensions of dikes in eastern Iceland. Tectonophysics 95, 295–307. doi: 10.1016/0040-1951(83)90074-4
Gudmundsson, A. (1983b). Stress estimates from the length/width ratios of fractures. J. Struct. Geol. 5, 623–626. doi: 10.1016/0191-8141(83)90075-5
Gudmundsson, A. (1987a). Tectonics of the Thingvellir fissure swarm, SW Iceland. J. Struct. Geol. 9, 61–69. doi: 10.1016/0191-8141(87)90044-7
Gudmundsson, A. (1987b). Geometry, formation and development of tectonic fractures on the Reykjanes Peninsula, southwest Iceland. Tectonophysics 139, 295–308. doi: 10.1016/0040-1951(87)90103-X
Gudmundsson, A. (2006), How local stresses control magma-chamber ruptures, dike injections, and eruptions in composite volcanoes. Earth Sci. Rev. 79, 1–31. doi: 10.1016/j.earscirev.2006.06.006
Gudmundsson, A. (2011). Rock Fractures in Geological Processes. Cambridge: Cambridge University Press. doi: 10.1017/CBO9780511975684
Gudmundsson, A. (2012). Magma chambers: formation, local stresses, excess pressures, and compartments. J. Volcanol. Geotherm. Res. 237–238, 19–41. doi: 10.1016/j.jvolgeores.2012.05.015
Gudmundsson, A., Fjeldskaar, I., and Brenner, S. L. (2002). Propagation pathways and fluid transport of hydrofractures in jointed and layered rocks in geothermal fields. J. Volcanol. Geotherm. Res. 116, 257–278. doi: 10.1016/S0377-0273(02)00225-1
Gudmundsson, A., Gjesdal, O., Brenner, S. L., and Fjeldskaar, I. (2003). Effects of growth of fractures through linking up of discontinuities on groundwater transport. Hydrogeol. J. 11, 84–99. doi: 10.1007/s10040-002-0238-0
Gudmundsson, A., Kusumoto, S., Simmenes, T. H., Philipp, S. L., Larsen, B., and Lotveit, I. F. (2012). Effects of overpressure variations on fracture aperture and fluid transport. Tectonophysics 581, 220–230. doi: 10.1016/j.tecto.2012.05.003
Hayashi, Y., and Morita, Y. (2003). An image of a magma intrusion process inferred from precise hypocentral migrations of the earthquake swarm east of the Izu Peninsula. Geophys. J. Int. 153, 159–174. doi: 10.1046/j.1365-246X.2003.01892.x
Ida, Y. (1992). Width change of a planar magma path: implication for the evolution and style of volcanic eruptions. Phys. Earth Planet. Int. 74, 127–138. doi: 10.1016/0031-9201(92)90004-F
Jaeger, J. C., Cook, N. G. W., and Zimmermann, R. W. (2007). Fundamentals of Rock Mechanics, 4th Edn. Oxford: Blackwell.
Jin, Z. H., and Johnson, S. E. (2008). Magma-driven multiple dike propagation and fracture toughness of crustal rocks. J. Geophys. Res. 113:B03206. doi: 10.1029/2006JB004761
Jousset, P., Mori, H., and Okada, H. (2003). Elastic models for the magma intrusion associated with the 2000 eruption of Usu Volcano, Hokkaido, Japan. J. Volcanol. Geotherm. Res. 125, 81–106. doi: 10.1016/S0377-0273(03)00090-8
Klügel, A., Walter, T. R., Schwarz, S., and Geldmacher, J. (2005). Gravitational spreading caused by en-echelon diking along a rift zone of Madeira Archipelago: an experimental approach and implications for magma transport. Bull. Volcanol. 68, 37–46. doi: 10.1007/s00445-005-0418-6
Kuhn, D., and Dahm, T. (2008). Numerical modelling of dike interaction and its influence on oceanic crust formation. Tectonophysics 447, 53–65. doi: 10.1016/j.tecto.2006.09.018
Kusumoto, S., Geshi, N., and Gudmundsson, A. (2013a). Aspect ratios and magma overpressures of non-feeder dikes observed in the Miyake-jima volcano (Japan), and fracture toughness of its upper part. Geophys. Res. Lett. 40, 1065–1068. doi: 10.1002/grl.50284
Kusumoto, S., Gudmundsson, A., Simmenes, T. H., Geshi, N., and Philipp, S. L. (2013b). Inverse modeling for estimating fluid-overpressure distributions and stress intensity factors from an arbitrary open-fracture geometry. J. Struct. Geol. 46, 92–98. doi: 10.1016/j.jsg.2012.10.004
Lister, J. R. (1990). Buoyancy-driven fluid fracture: the effects of material toughness and low-viscosity precursors. J. Fluid Mech. 210, 263–280. doi: 10.1017/S0022112090001288
Lister, J. R., and Kerr, R. C. (1991). Fluid-mechanical models of crack propagation and their application to magma transport in dikes. J. Geophys. Res. 96, 10049–10077. doi: 10.1029/91JB00600
Macdonald, K., Sempere, J.-C., and Fox, P. J. (1984). East Pacific Rise from Siqueiros to Orozco fracture zones: along-strike continuity of axial neovolcanic zone and structure and evolution of overlapping spreading centers. J. Geophys. Res. 89, 6049–6069. doi: 10.1029/JB089iB07p06049
Maugis, D. (2000). Contact, Adhesion and Rupture of Elastic Solids. Berlin: Springer. doi: 10.1007/978-3-662-04125-3
Meriaux, C., and Jaupart, C. (1998). Crack propagation through an elastic plate. J. Geophys. Res. 103, 18295–18314. doi: 10.1029/98JB00905
Mori, M. (2005). Discovery of the double exponential transformation and its developments, Publ. RIMS Kyoto Univ. 41, 897–935. doi: 10.2977/prims/1145474600
Morita, Y., Nakao, S., and Hayashi, Y. (2006). A quantitative approach to the dike intrusion process inferred from a joint analysis of geodetic and seismological data for the 1998 earthquake swarm off the east coast of Izu Peninsula, central Japan. J. Geophys. Res. 111:B06208. doi: 10.1029/2005JB003860
Muller, O. H., and Pollard, D. D. (1977). The stress state near Spanish Peaks, Colorado, determined from a dike pattern. Pure Appl. Geophys. 115, 69–85. doi: 10.1007/BF01637098
Nakamura, K. (1977). Volcanoes as possible indicators of tectonic stress orientation: principal and proposal. J. Volcanol. Geotherm. Res. 2, 1–16. doi: 10.1016/0377-0273(77)90012-9
Nemat-Nasser, S., and Hori, M. (1999). Micromechanics: Overall Properties of Heterogeneous Materials, 2nd Edn. Amsterdam: Elsevier.
Okada, Y. (1985). Surface deformation due to shear and tensile faults in a half-space. Bull. Seismol. Soc. Am. 75, 1135–1154.
Okada, Y. (1992). Internal deformation due to shear and tensile faults in a half-space, Bull. Seismol. Soc. Am. 82, 1018 –1040.
Okada, Y., and Yamamoto, E. (1991). Dike intrusion model for the 1989 seismovolcanic activity off Ito, central Japan. J. Geophys. Res. 96, 10361–10376. doi: 10.1029/91JB00427
Okubo, S., and Watanabe, H. (1989). Gravity change cause by a fissure eruption. Geophys. Res. Lett. 16, 445–448. doi: 10.1029/GL016i005p00445
Philipp, S. L. (2012). Fluid overpressure estimates from the aspect ratios of mineral veins. Tectonophysics 581, 35–47. doi: 10.1016/j.tecto.2012.01.015
Philipp, S. L., Afsar, F., and Gudmundsson, A. (2013). Effects of mechanical layering on hydrofracture emplacement and fluid transport in reservoirs. Front. Earth Sci. 1:4. doi: 10.3389/feart.2013.00004
Pollard, D. D., and Aydin, A. (1984). Propagation and linkage of oceanic ridge segments. J. Geophys. Res. 89, 10017–10028. doi: 10.1029/JB089iB12p10017
Pollard, D. D., and Segall, P. (1987). “Theoretical displacement and stresses near fractures in rocks: with application to faults, points, veins, dikes, and solution surfaces,” in Fracture Mechanics of Rocks, ed B. Atkinson (London: Academic Press), 277–349. doi: 10.1016/B978-0-12-066266-1.50013-2
Priest, S. D. (1993). Discontinuity Analysis for Rock Engineering. London: Chapman & Hall. doi: 10.1007/978-94-011-1498-1
Rivalta, E., and Dahm, T. (2006). Acceleration of buoyancy-driven fractures and magmatic dikes beneath the free surface. Geophys. J. Int. 166, 1424–1439. doi: 10.1111/j.1365-246X.2006.02962.x
Roper, S. M., and Lister, J. R. (2005). Buoyancy-driven crack propagation from an over-pressured source, J. Fluid Mech. 536, 79–98. doi: 10.1017/S0022112005004337
Rubin, A. M. (1995). Propagation of magma-filled cracks. Annu. Rev. Earth Planet. Sci. 23, 287–336. doi: 10.1146/annurev.ea.23.050195.001443
Simmenes, T. H. (2002). Fracture Systems, Fault Development and Fluid Transport in Vaksdal, West Norway. M.Sc. thesis, University of Bergen, Bergen, 143.
Skurtveit, E. (2000). Fracture Systems, Stresses and Groundwater Flow: Examples from Iceland and Norway. M.Sc. thesis, University of Bergen, Bergen, 120.
Sneddon, I. N., and Lowengrub, M. (1969). Crack Problems in the Classical Theory of Elasticity. New York, NY: Wiley.
Spence, D., Sharp, P., and Turcotte, D. L. (1987). Buoyancy-driven crack propagation: a mechanism for magma migration. J. Fluid Mech. 174, 135–153. doi: 10.1017/S0022112087000077
Tada, H., Paris, P. C., and Irwin, G. R. (2000). The Stress Analysis of Cracks Handbook, 3rd Edn. New York, NY: ASME. doi: 10.1115/1.801535
Takahashi, H., and Mori, M. (1974). Double exponential formulas for numerical integration. Publ. RIMS Kyoto Univ. 9, 721–741. doi: 10.2977/prims/1195192451
Thordarson, T., and Self, S. (1993). The Laki (Skaftar Fires) and Grimsvötn eruptions in 1783–1785, Bull. Volcanol. 55, 233–263. doi: 10.1007/BF00624353
Tryggvason, E. (1983). The widening of the Krafla fissure swarm during the 1975–1981 volcano-tectonic episode. Nordic Volcanol. Inst. Prof. Pap. 8304, 48.
Tryggvason, E. (1984). Widening of the Krafla fissure swarm during the 1975-1981 volcano-tectonic episode. Bull. Volcanol. 47, 47–69. doi: 10.1007/BF01960540
Tsang, C. F., and Neretnieks, I. (1998). Flow channelling in heterogeneous fractured rocks, Rev. Geophys. 36, 275–298. doi: 10.1029/97RG03319
Keywords: fractures and faults, mechanics, theory and modeling, permeability and porosity, elasticity and anelasticity, geomechanics, effusive volcanism
Citation: Kusumoto S and Gudmundsson A (2014) Displacement and stress fields around rock fractures opened by irregular overpressure variations. Front. Earth Sci. 2:7. doi: 10.3389/feart.2014.00007
Received: 17 February 2014; Accepted: 24 April 2014;
Published online: 20 May 2014.
Edited by:
Valerio Acocella, Università Roma Tre, ItalyReviewed by:
Joel Ruch, Univeristà Roma Tre, ItalyPhilippe Jousset, German Center for Research in Geosciences, GFZ, Antarctica
Copyright © 2014 Kusumoto and Gudmundsson. This is an open-access article distributed under the terms of the Creative Commons Attribution License (CC BY). The use, distribution or reproduction in other forums is permitted, provided the original author(s) or licensor are credited and that the original publication in this journal is cited, in accordance with accepted academic practice. No use, distribution or reproduction is permitted which does not comply with these terms.
*Correspondence: Shigekazu Kusumoto, Graduate School of Science and Engineering for Research, University of Toyama, 3190 Gofuku, Toyama-shi, Toyama 930-8555, Japan e-mail: kusu@sci.u-toyama.ac.jp