Recognizing the threshold magnetic anisotropy for inclination shallowing: implications for correcting inclination errors of sedimentary rocks
 Yong-Xiang Li
 Shipeng Wang1
  Wenjun Jiao
- 1State Key Laboratory for Mineral Research Deposits, School of Earth Sciences and Engineering, Nanjing University, Nanjing, China
- 2Guangzhou Marine Geological Survey, Guangzhou, China
Post-depositional compaction is an integral part of sedimentary rock formation and thus has been reasonably deemed as a major culprit for the long-recognized inclination-shallowing problem in sedimentary rocks. Although theoretical treatment elegantly envisions magnetic anisotropy (or oblate fabrics) to correspond to the degree of compaction and the magnitude of inclination flattening, such correspondence has rarely been seen in nature quantitavely, which leaves the possibility of misidentification and/or over-correction for inclination shallowing using magnetic anisotropy. This is because the extent to which oblate magnetic fabrics are developed strongly enough for inclination to start becoming shallow is not yet known. Here, we present sedimentary paleomagnetic data from two ~6 m long gravity cores GHE24L and GHE27L from the northern slope of the South China Sea (SCS) to examine the down-core changes in magnetic anisotropy and inclinations, and to explore the possible connection between the two parameters. The results show that oblate fabrics are dominantly developed at depths >~2 m and the degree of anisotropy displays an overall gradual increase with depth. Inclination shallowing occurs in the >5 m segment of the relatively distal core GHE27L and the amount of shallowing largely correlates with the degree of anisotropy, suggesting a causal relation between the development of magnetic anisotropy and the degree of inclination shallowing. Examination of down-core changes in inclination and magnetic anisotropy suggests that a threshold anisotropy of PAMS~1.04 and PAAR~1.10 exists for inclination shallowing in the cores. For PAAR < 1.10, over-correction is mostly negligible, but can amount >10° if particle anisotropy is <1.4. This study provides strong field evidence that complements and substantiates the theoretical model and suggests that the threshold anisotropy can be used as a first-order criterion to identify inclination errors of some sedimentary rocks.
Introduction
Sediments and sedimentary rocks are important targets for paleomagnetic studies because of their widespread occurrence and their ability to provide a continuous record of the geomagnetic field. The ubiquitous distribution of sediments and sedimentary rocks on the earth, ranging from low latitudes to high latitudes in various depositional environments, makes them valuable archives for studying spatial characteristics of the geomagnetic field and permits tests of different models for the behavior of the Earth's magnetic field (e.g., Opdyke and Henry, 1969; Constable and Johnson, 1999; Tauxe and Kent, 2004; Kodama, 2012). The slow, relatively continuous nature of depositional processes gives sedimentary rocks the ability to preserve nearly continuous readings of the geomagnetic field, and thus sedimentary rocks are well-suited to study the long-term temporal behavior of the Earth's magnetic field (e.g., Guyodo and Valet, 1999; Valet, 2003; Valet et al., 2005).
The power of sedimentary rocks for recording the spatial and temporal characteristics of the geomagnetic field hinges on the correspondence of the remanent magnetization to the local geomagnetic field at the time of deposition. Yet acquisition of detrital remanent magnetization (DRM) is complicated because it can involve physical, chemical, and biological processes during deposition and lithification of sedimentary rocks (Verosub et al., 1979; Tauxe and Kent, 1984; Anson and Kodama, 1987; Tauxe et al., 2006; Mitra and Tauxe, 2009; Lund et al., 2010; Scherbakov and Sycheva, 2010; Kodama, 2012). These processes may cause misalignment of magnetization with the ambient field, resulting in an inclination shallower than that of the ambient field, known as “inclination shallowing.” This phenomenon was noticed more than half a century ago (King, 1955), and has been observed in some natural sediments (e.g., Tauxe et al., 1980; Collombat et al., 1993) and repeatedly reported in laboratory redeposition experiments (e.g., Tauxe and Kent, 1984; Deamer and Kodama, 1990). Inclination shallowing has been attributed to depositional effects that are associated with various aspects such as particle size and shape (e.g., King, 1955; Griffiths et al., 1960; Bilardello, 2013; Bilardello et al., 2013), aggregation of sediments, or flocculation (e.g., Lu et al., 1990; Scherbakov and Sycheva, 2008), Brownian motion (e.g., Collinson, 1965), bottom current shear (e.g., Rees, 1961), viscosity, pH, deposition rate and so on (Verosub, 1977; Tauxe et al., 2006; Mitra and Tauxe, 2009; Scherbakov and Sycheva, 2010). Post-depositional processes such as bioturbation and burial compaction can modify the magnetization prior to being fully locked-in (Roberts and Winklhofer, 2004), leading to an acquisition of post-depositional remanent magnetization, or pDRM (Verosub, 1977). While bioturbation may enhance the alignment of magnetization with ambient field, post-depositional compaction can rotate magnetic particles toward the horizontal and thus cause inclination errors (e.g., Anson and Kodama, 1987; Deamer and Kodama, 1990).
Despite the fact that the acquisition mechanism of DRM remains poorly understood and inclination errors are frequently observed in the redeposition experiments, in nature, the inclination shallowing problem does not appear to occur widely in recent sediments. Recent unconsolidated sediments from low through high latitudes show an expected distribution of inclinations as predicted by the GAD model (Opdyke and Henry, 1969; Lund et al., 2010). Also, comparisons of paleomagnetic records of unconsolidated sediments to that of coeval igneous rocks often show that sediments can indeed accurately record the ambient geomagnetic field (e.g., Lund, 1985). In lithified sedimentary rocks, while faithful recording of the geomagnetic field can be demonstrated for many cases (e.g., Li et al., 2013), inclination shallowing does occur sometimes (Kodama, 1997; Tan and Kodama, 1998; Gilder et al., 2001, 2003; Tan et al., 2003, 2010; Vaughn et al., 2005; Tauxe et al., 2008; Bilardello and Kodama, 2010a,b; Kodama, 2012; Huang et al., 2013), and is recognized by comparing sedimentary records either with well-established apparent polar wander path, with coeval igneous paleomagnetic data or by rock magnetic analyses. For some sedimentary rocks such as pelagic carbonates, while many pelagic carbonates preserve high-fidelity records of geomagnetic field, some pelagic carbonates may experience diagnesis and can even be remagnetized (Roberts et al., 2013). Nevertheless, the wide absence of inclination shallowing in recent unconsolidated sediments but its presence in lithified sedimentary rocks point to a universal, common process, that is, post-depositional burial compaction during lithification, as a likely cause to the problem. This notion gains support from the paleomagnetic data of deep sea sediments that underwent compaction. The inclination shallowing of sediments from DSDP site 578 shows a general trend that corresponds to the down-core porosity variations and, overall, the degree of inclination shallowing increases with decreasing porosity down core (Arason and Levi, 1990).
Given the fact that some sedimentary rocks do suffer from inclination shallowing and over half of the paleomagnetic data in the Global Paleomagnetic Database (http://www.ngu.no/geodynamics/gpmdb/) were derived from sediments and sedimentary rocks (Kodama, 2012), it is crucial to detect and correct for inclination shallowing in sedimentary records in order to achieve accurate interpretation. To this end, it is important to first identify inclination shallowing when a coeval igneous record or a well-established reference apparent polar wander path is not available.
One way of recognizing magnetic inclination shallowing is to examine the distribution of paleomagnetic directions. Distribution of paleomagnetic directions of geomagnetic origin can be predicted from statistical paleosecular variation (PSV) models that are based on paleomagnetic data of lava flows over the past 5 Myrs (e.g., Constable and Parker, 1988; Constable and Johnson, 1999). If the PSV models are applicable to ancient times, distributions of paleomagnetic directions can then be assessed by comparing the directions with those from PSV model predictions. Tauxe and Kent (2004) proposed a PSV model, TK03.GAD, that quantifies the distribution of directions with an elongation parameter E. This model also predicts that E decreases with increasing latitudes, i.e., inclinations, defining a trend of Elongation -Inclination changes (E/I). If observed paleomagnetic directions agree with the E/I trend, the scatter of these directions is consistent with that resulting from geomagnetic secular variation. The PSV model predicts that an elongation direction of paleomagnetic directions should be in the vertical, N-S plane. It can then be deduced that the occurrence of elongation in the horizontal, E-W plane indicates inclination shallowing (Tauxe and Kent, 2004). The inclination shallowing can be corrected by finding the optimum flattening factor f using the E/I method of Tauxe and Kent (2004). The flattening factor f is defined as the ratio of (tan Io)/(tan If) (King, 1955), where Io is the observed inclination and If is that of the applied field. This approach needs a large dataset so that the field distribution can be sufficiently sampled and well represented.
Another approach is to study the magnetic anisotropy of samples. Magnetic anisotropy, also known as magnetic fabrics, measures the preferred orientation of magnetic particles in a rock and is represented graphically by an ellipsoid. It is widely accepted that an oblate fabric is typically produced during deposition in many sedimentary environments, which is characterized by the minimum axes K3 perpendicular or subperpendicular to the bedding (Tarling and Hrouda, 1993). The primary depositional fabrics can be further modified by post-depositional processes. During lithification, post-depositional compaction of sediments would lead to vertical shortening and development of oblate magnetic fabrics, which are characterized by the steepening of the minimum axes and the scatter of the maximum axes K1 and intermediate axes K2 within the bedding plane. Post-depositional compaction would also rotate magnetic particles toward the horizontal plane, giving rise to inclinations shallower than that of the ambient field. Consequently, the occurrence of oblate fabrics is often used as evidence for identifying inclination shallowing. Jackson et al. (1991) developed an elegant theoretical model that relates inclination shallowing to magnetic anisotropy of sedimentary rocks. The model assumes that inclination shallowing is a function of both the bulk magnetic anisotropy of remanence-carrying grains and the magnetic anisotropy of individual magnetic particles. Thus, correction for inclination shallowing can be made after bulk magnetic anisotropy and individual particle anisotropy are determined (e.g., Kodama, 1997; Tan, 2001; Kodama, 2009). This approach has been used in correcting for inclination shallowing of sedimentary rocks of different ages (e.g., Kodama and Davi, 1995; Tan and Kodama, 1998; Tan, 2001; Vaughn et al., 2005; Tan et al., 2010; Bilardello and Kodama, 2010a,b,c; Huang et al., 2013).
The anisotropy-based inclination correction model is based on a fundamental assumption that the development of magnetic anisotropy is directly related to the degree of inclination flattening. Although this is a reasonable assumption and has gained support from the laboratory compaction experiments with clay-rich sediments (Sun and Kodama, 1992), the assumed relationship between magnetic anisotropy and inclination flattening has rarely been documented in nature. Garcés et al. (1996) showed that laminated redbeds display stronger magnetic susceptibility foliation and shallower inclinations than the bioturbated and massive mass-flow facies in the extensional basin on the Iberia continental margin. Kim and Kodama (2004) reported that shale units carry shallower inclinations and better defined foliations than concretionary intervals in the Northumberland Formation on Hornby Island, British Columbia. Vaughn et al. (2005) found that well-foliated samples carry shallower inclinations than do non-foliated samples from the Cretaceous sedimentary rocks in Baja California. These studies essentially provide semi-quantitative correlation between inclination shallowing and magnetic anisotropy for different lithologies. However, a detailed, correlated progressive development of magnetic anisotropy and inclination shallowing has not been well documented in nature. This is particularly important because oblate fabrics would be gradually developed with depth in a stratigraphic column as overburden loading increases. Inclination flattening would not occur until loading-induced compaction is large enough to rotate magnetic grains toward the horizontal. Therefore, there exists a threshold bulk anisotropy, i.e., the extent to which oblate fabrics develop when compaction-induced inclination shallowing starts to occur. A lack of knowledge about the threshold bulk anisotropy could lead to misidentification and/or over-correction of inclination shallowing using magnetic anisotropy.
In this study, we collected sediment cores from the northern continental slope of the South China Sea (SCS) (Figure 1). The core sites are located ~300 km away from the mouth of Pear River to avoid high sand content that would prevent inclination from shallowing because clay content was found an important controlling factor for inclination shallowing (Sun and Kodama, 1992). Yet the core sites are not from the deepest part of the SCS, but from the continental slope in order to achieve a relatively high or moderate accumulation rate so that details of the gradual development of magnetic fabrics and corresponding changes in inclinations may be recorded.
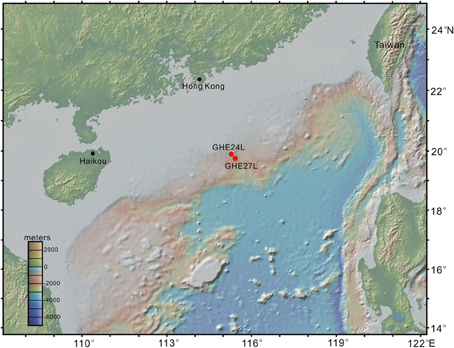
Figure 1. Digital elevation map of the studying area (http://www.geomapapp.org; Ryan et al., 2009) showing the locations of Cores GHE24L and GHE27L on the northern slope of the South China Sea.
Geologic Setting
SCS is one of the largest marginal seas in the western Pacific Ocean. The opening of the SCS resulted from the long-lasting extension along the continental margin of the South China Block due to either extrusion tectonism associated with the collision of India and Eurasia (e.g., Tapponnier et al., 1982) or the subduction of the Pacific plate toward Asia (e.g., Hall, 2002). Continued rifting and subsequent spreading of the SCS led to the formation of a series of predominantly NE-striking grabens/basins along the continental margin of the South China Block, i.e., on the northern slope of the SCS, at least since Eocene-Oligocene (Tapponnier et al., 2001). The basins receive continuous sedimentation all the way to the present day. The sediments deposited since the Late Pleistocene in these basins mainly consist of hemipelagic clays with ~40% of carbonate, and the terrigenous accumulation rates at the middle part of the northern slope reach ~3 g/cm2*103 year (Schönfeld and Kudrass, 1993), which is higher than those in the Miocene and early Pliocene (Li et al., 2011). With the relatively high accumulation rate, sediments in these basins on the northern slope of the SCS provide excellent testing grounds for examining the development of magnetic fabrics and changes in inclinations with depth in response to compaction in the course of sedimentary rock formation. It is conceivable that the gradual changes in magnetic fabrics and inclinations with depth could be observed, provided that long enough cores are retrieved, as deposition and post-depositional compaction in these basins are occurring.
Methods
Two gravity cores GHE24 L and GHE27L were retrieved from the northern slope of the SCS (Figure 1) in 2011. GHE24L is 5.98 m long and was collected from the water depth of 1387 m. GHE27L is 5.73 m long and was taken from the water depth of 1533 m (Figure 1).
Two cores were split into halves and paleomagnetic specimens were collected at an ~2 cm interval using non-magnetic 2.0 × 2.0 × 2.0 cm3 plastic cubes. Each plastic cube was gently pushed into the soft sediments with the arrow at the bottom of the plastic cube pointing upcore and was then carefully removed to avoid disturbance. A total of 286 and 298 oriented cubic specimens were collected from GHE24L and GHE27L, respectively.
Anisotropy of magnetic susceptibility (AMS) of all specimens was measured with a kappabridge KLY-3 susceptibility meter to estimate changes in magnetic fabrics with depth. Anisotropy of anhysteretic remanence (AAR) of selected samples from both GHE24L and GHE27L were determined following McCabe et al. (1985)'s approach in which an ARM was applied along nine different orientations in a coercivity window, typically 20–80 mT, in a 0.023 mT DC field and between the AAR acquisition of each orientation is the demagnetization of the samples at 100 mT. The AAR experiments were conducted in the paleomagnetism laboratory of the Institute of SCS Oceanography in the Chinese Academy of Science. Thermomagnetic properties of representative samples were measured by heating the samples up to 700°C while their susceptibilities were monitored in order to constrain the magnetic mineralogy. In addition, magnetic hysteresis of selected samples was measured in the Institute of Geology and Geophysics in the Chinese Academy of Science to estimate the grain size of the magnetic particles.
To obtain a record of changes in magnetic inclination with depth, a total of 118 selected specimens, on an average of ~10 cm spacing, were subjected to stepwise, typically 12 steps, alternating field demagnetization with a Molspin demagnetizer. The remanence of these samples was measured with a 2G Enterprise Inc. 755 rock magnetometer that is housed in a magnetically shielded room (residual field is less than 300 nT) in the paleomagnetism laboratory of Nanjing University. The demagnetization data are presented graphically with vector-endpoint diagrams (Zijderveld, 1967) and were analyzed using principal component analysis (Kirschvink, 1980). Fisher statistics (Fisher, 1953) was utilized to calculate mean directions. The paleomagnetic software packages PaleoMac v6.2 (Cogné, 2003) and Anisoft 4.2 (by Martin Chadima and Vit Jelinek) were used to perform data analyses. In addition, regression analyses were performed to quantify the down-core changes in the degree of magnetic anisotropy and Jackson et al. (1991)'s model was employed to correct for inclination shallowing and to estimate particle anisotropy “a”.
Results
Lithology
Both GHE24L and GHE27L consist of light gray to gray, foraminifera-bearing, clays and silty clays (Figures 2A, 3A). The core sediments show uniform features and display no laminations. Both cores exhibit a slight down-core change in color, from light gray in the upper part, transition to light brownish gray, to gray in the lower part (Figures 2A, 3A). Another subtle change is the apparent gradual decline in the abundance of foraminifera down core. Also, water content decreases with depth as soft sediments gradually become hard. Visual inspection did not find any obvious compositional difference between Core GHE24L and GHE27L. Grain size analyses reveal that the content of the >63 μm particles varies from ~1 to 7% in GHE24L and from 2 to 8% in GHE27L (Xiang Rong, written communication). Carbonate contents of GHE24L and GHE27L are similar, ranging from ~10 to 32% (Xiang Rong, written communication). Overall the materials of both cores appear to be highly homogenous.
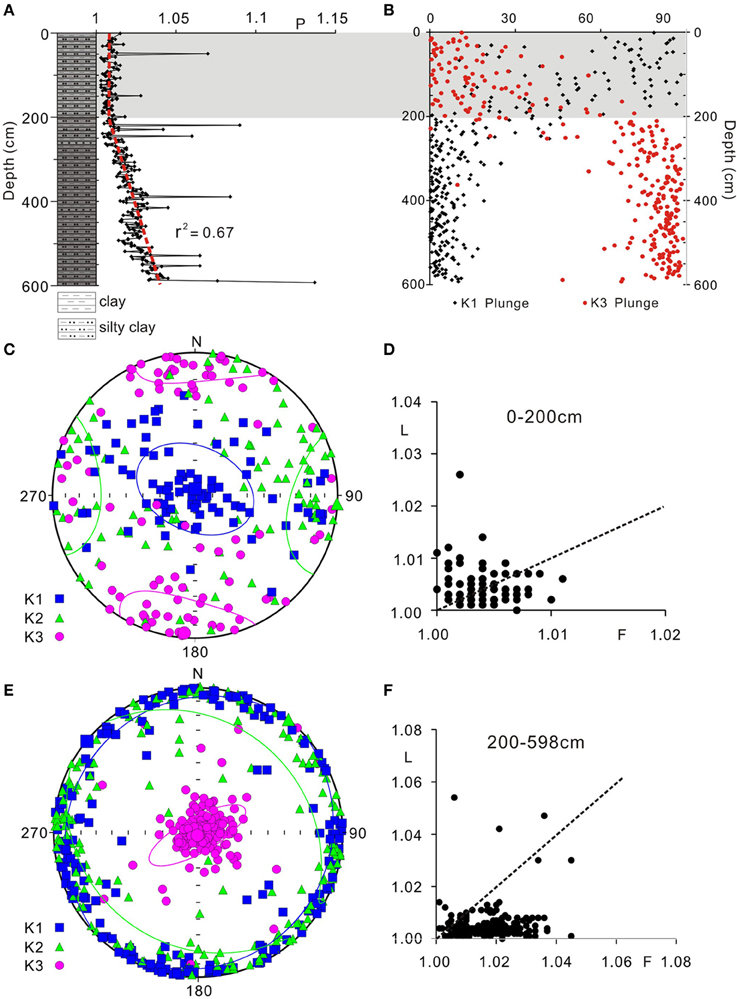
Figure 2. Down-core changes in composition and anisotropy of magnetic susceptibility (AMS) of Core GHE24L. The core consists mainly of light gray to gray clays and silty clays (A). The upper 2 m sediments display a weak triaxial fabrics (B–D) with the intensity of anisotropy around 1.01 (A). The >2 m sediments show well-defined oblate fabrics (E,F) and a gradual increase in anisotropy intensity with depth (A). Ellipses in (C,E) represent the confidence intervals of the mean of the maximum, intermediate, and minimum eigenvector. L and F in (D,F) denote lineation and foliation, respectively, and are defined as L = k1/k2 and F = k2/k3.
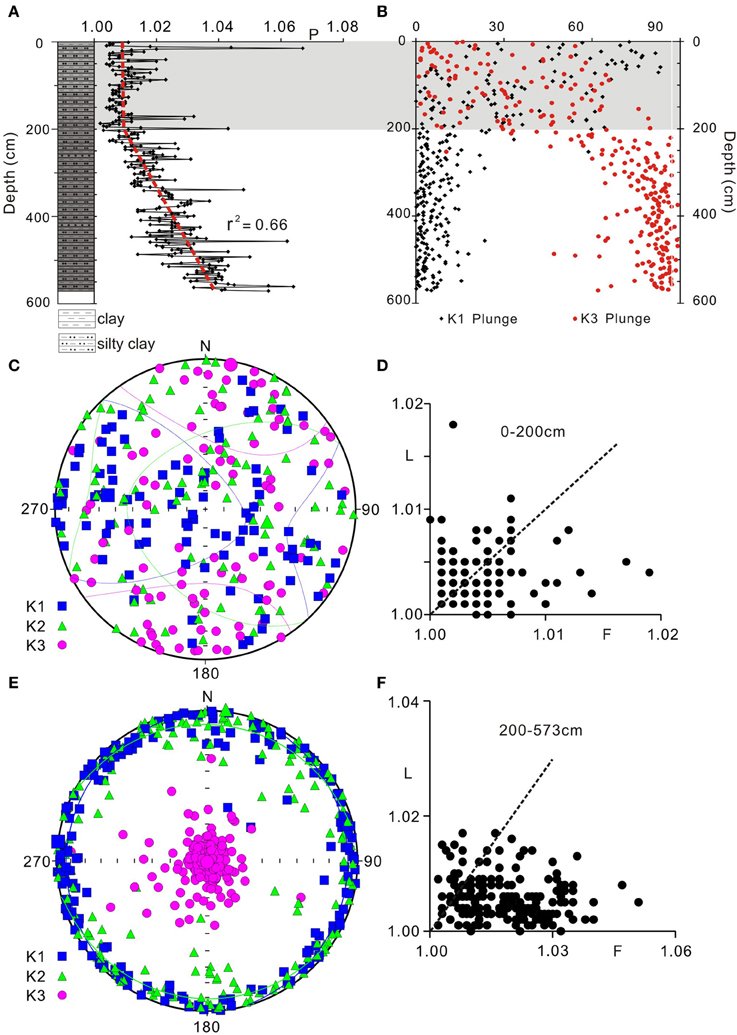
Figure 3. Down-core changes in composition and AMS of Core GHE27L. The composition (A) and AMS characteristics (B–F) are similar to those of GHE24L (Figure 2). The upper 2 m display random AMS fabrics (B–D) and the >2 m exhibit well-defined oblate fabrics (E,F) and a gradual increase in anisotropy intensity with depth (A). Legends are the same as in Figure 2.
Rock Magnetic Results
The AMS data of GHE24L and GHE27L are shown in Figures 2, 3, respectively. The intensity of anisotropy, PAMS value, for GHE24L varies, but is generally less than 1.1. Although there are some spiky PAMS values, the general variation pattern of PAMS vs. depth is clear, that is, PAMS values fluctuate around 1.01 for the uppermost 2 m and display a linear trend of increase with depth for the >2 m segment (Figure 2A). For the uppermost 2 m sediments, the AMS data show very weak (PAMS = 1.01), triaxial fabrics (Figures 2B–D) with the maximum axes K1 dominantly subvertical and the intermediate axes K2 (trending mainly E-W) and minimum axes K3 (N-S) mostly subhorizontal (Figures 2B,C); For sediments deeper than 2 m, well-defined oblate fabrics are developed (Figures 2E,F) with minimum axes K3 perpendicular to bedding, and the maximum K1 and intermediate K2 axes subparallel to bedding and spreading over the periphery of the stereonet (Figure 2E). K1 axes are close to the horizontal with plunges generally less than 15° and K3 axes are close to the vertical with plunges mostly greater than 75° (Figures 2B,E). After the spiky anisotropy values are removed, linear regression analyses of the down-core variations in AMS intensity of the >2 m segment show a high degree of correlation with r2 = 0.67 (Figure 2A). AMS fabrics of GHE27L are very similar to those of GHE24L (Figure 3). The top 2 m exhibits random AMS fabrics with a mean anisotropy of 1.01 (Figures 3A–D). For the stratigraphic levels greater than 2 m, oblate fabrics are also formed (Figures 3E,F) and the down-core variations in AMS intensity also show a linear trend with r2 = 0.66 (Figure 3A), but the overall trend of linear increase in PAMS values with depth appears to be slightly stronger than those of GHE24L (Figures 2A, 3A).
The AAR data of GHE24L and GHE27L are summarized in Table 1 and graphically shown in Figure 4. For the uppermost 2 m sediments, the principal axes of the AAR data from both GHE24L and GHE27L exhibit non-bedding parallel foliated fabrics with the minimum axes K3 subhorizontal along the N-S plane and the intermediate axes K2 and maximum axes K1 apparently girdling the E-W vertical plane (Figures 4A–D). Since the foliation is perpendicular to bedding, this is not a primary fabric. The intensities of anisotropy, PAAR, also appear to show random variations, fluctuating between 1.05 and 1.15 for the uppermost 2 m sediments (Figure 4E). For sediments deeper than 2 m, weak, dominantly foliated fabrics are formed with the minimum axes K3 predominantly sub-perpendicular to bedding, and the intermediate axes K2 and maximum axes K1 subparallel to bedding (Figures 4A,C). Although the minimum axes K3 are not tightly grouped and their distributions do not appear to closely correlate with depth (Figures 4A,C), a general trend of steepening of the minimum axes K3 with depth exists, as indicated by arrows in Figures 4A,C. For instance, K3 axes of two samples from the 2–3 m segment of GHE27L plunge northerly at <25°, but K3 axes of samples from the 3–5.7 m segment plunge at around 60° or greater (Figure 4C). The most striking feature is that the intensities of AAR fabrics, PAAR, appear to increase with depth for the >2 m segment of both GHE24L and GHE27L (Figure 4E). The trend of PAAR increase with depth appears to be slightly more persistent and prominent in GHE27L than in GHE24L (Figure 4E). Overall, PAAR values of GHE27L samples appear to increase quasilinearly from ~1.04 at ~2.5 m to ~1.15 at 5.7 m, while PAAR values of GHE24L samples largely increase quasilinearly from ~1.04 at ~2.6 m to ~1.07 at 4.7 m (Figure 4E).
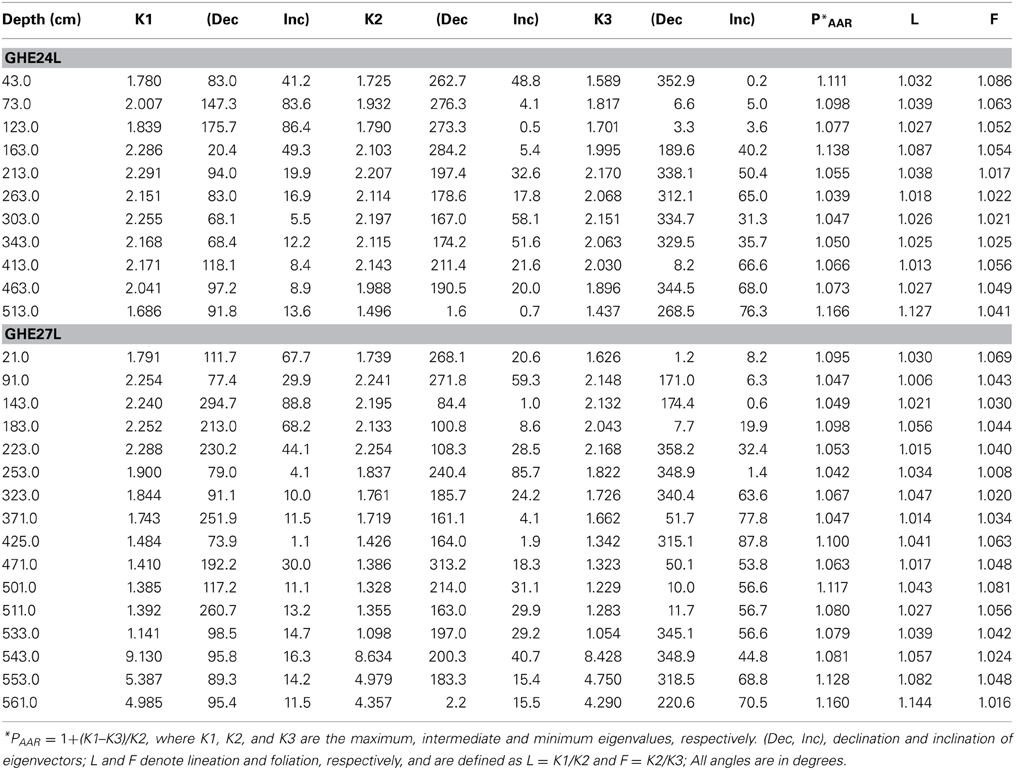
Table 1. Anisotropy of anhysteretic remanence (AAR) data of selected samples from Cores GHE24L and GHE27L.
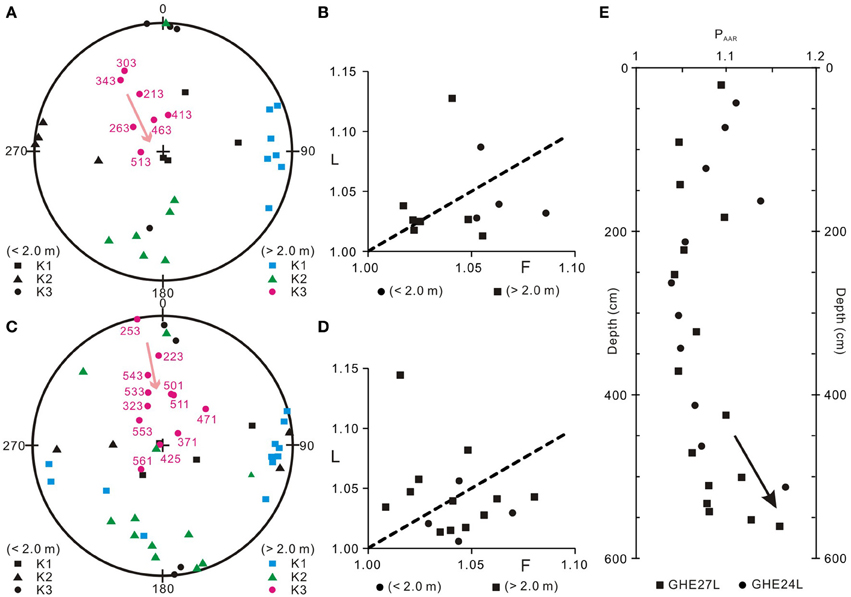
Figure 4. Anisotropy of anhysteretic remanence (AAR) data of Core GHE24L (A,B) and GHE27L (C,D) and the down-core variations in the magnitude of AAR of the two cores (E). The upper 2 m sediments show non-bedding parallel foliated AAR fabrics (A,C) and the >2 m sediments exhibit a weak, predominantly foliated fabrics (A,C). Pink arrows in (A,C) indicate the overall trend of steepening of the minimum axes K3 with depth, i.e., the general trend of the development of predominantly foliated fabrics with depth. The intensity of AAR shows a trend of an apparent quasilinear increase with depth (E) for the >2 m sediments. The arrow in (E) shows the general trend of increase in AAR intensity with depth.
Thermomagnetic measurements of representative specimens show that magnetic susceptibility is not reversible in a heating-and-cooling cycle (Figure 5). During heating, magnetic susceptibility remains stable until the temperature reaches 550–580°C at which magnetic susceptibility drops rapidly, indicative of the presence of magnetite. During cooling, magnetic susceptibility increases sharply at ~580°C, suggesting that new magnetite grains were produced during the prior heating. Hysteresis parameters of selected samples show that magnetite particles are either in the pseudo-single domain (PSD) size (Day et al., 1977) or a mixture of single domain and multi-domain grains (Dunlop, 2002a,b) (Figure 6). In addition, the hysteresis parameters are closely clustered (Figure 6), suggesting that the magnetic particles in GHE24L and GHE27L are magnetically homogenous.
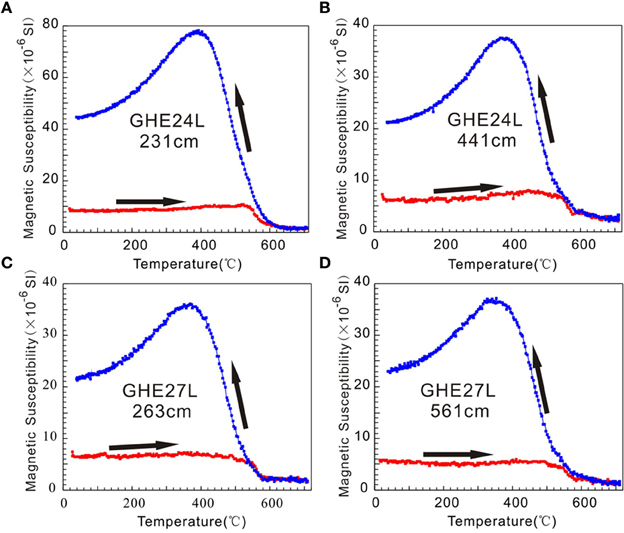
Figure 5. Thermomagnetic properties of Cores GHE24L (A,B) and GHE27L (C,D) sediments suggest that magnetite is the main magnetic phase in the sediments. (A–D) Show similar irreversible features with a rapid decline in magnetic susceptibility at around 580°C during heating and elevated magnetic susceptibility during cooling.
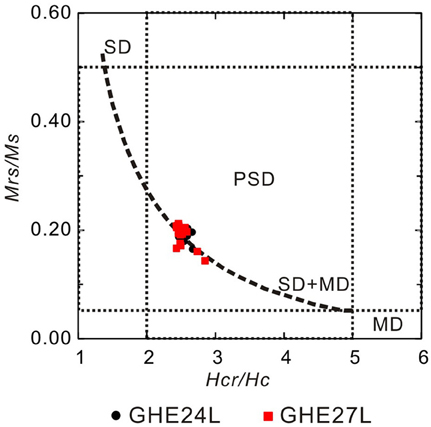
Figure 6. Day plot showing that magnetite grains in the sediments are either in the PSD range or a mixture of single domain and multi-domain particles (Day et al., 1977; Dunlop, 2002a,b). The dashed curve represents the mixing of SD and MD grains.
Paleomagnetic Results
Natural remanent magnetization (NRM) of the specimens ranges from 2.5 × 10⁻⁸ A/m to 1.2 × 10⁻⁷ A/m. AF demagnetization is effective to isolate characteristic remanent magnetization for all specimens except three specimens. Two of these specimens are from the top and the bottom of GHE24L and one is from the top of GHE27L. These three specimens are resistant to af demagnetization and about 80% of the remanence remains after the alternating field reaches 80 mT and no characteristic remanence is isolated as shown in Figure 7A for one of the three specimens. These three specimens are thus excluded for further analyses. For the remaining 115 specimens, the majority (Figures 7B–F) exhibit a one-component magnetization with the demagnetization trajectories decaying toward the origin, defining the characteristic remanent magnetization (ChRM) of each specimen. Only 4 out of 115 specimens display a weak two-component magnetization (Figure 7D), but the directional difference of the two components is minimal. The paleomagnetic results are summarized in Table 2 and the down-core variations in inclinations of ChRMs of GHE24L and GHE27L are shown in Figures 8A,B.
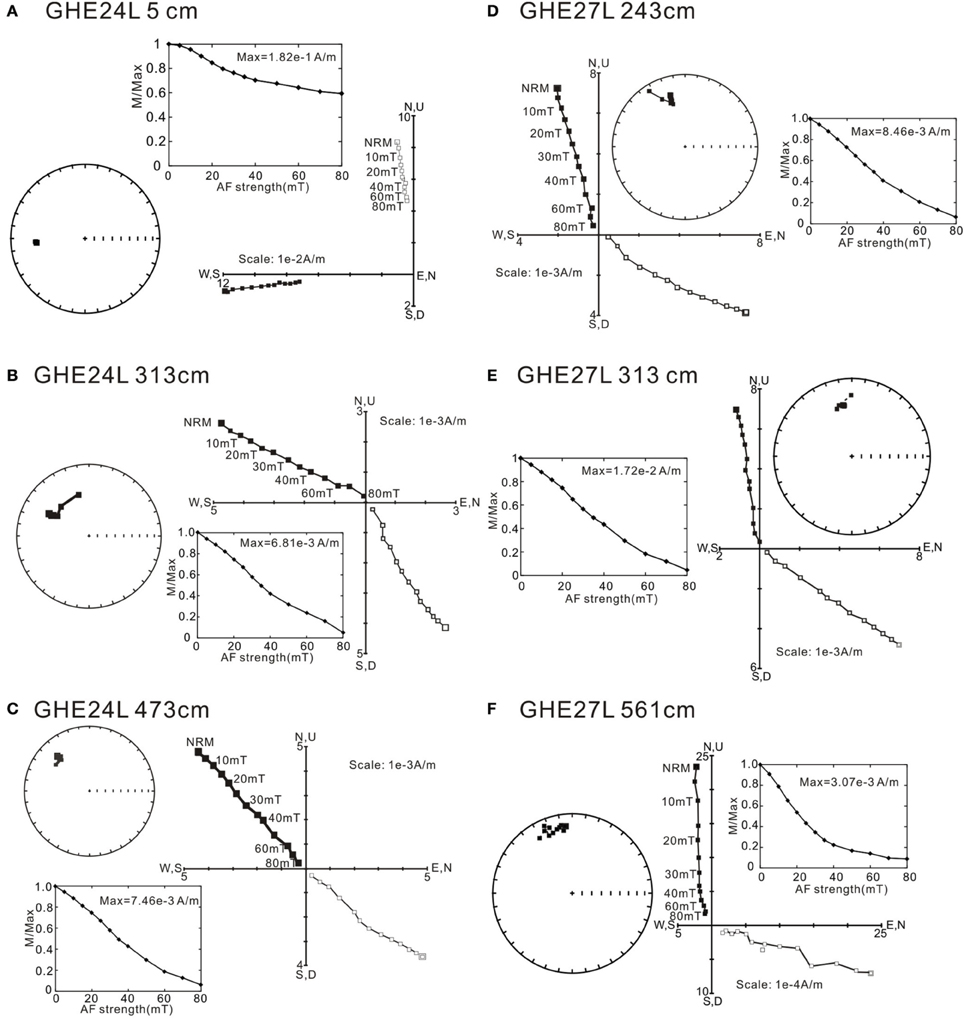
Figure 7. Representative demagnetization data of Cores GHE24L (A–C) and GHE27L (D–F) sediments. Solid squares indicate the horizontal components and the open squares denote the vertical components.
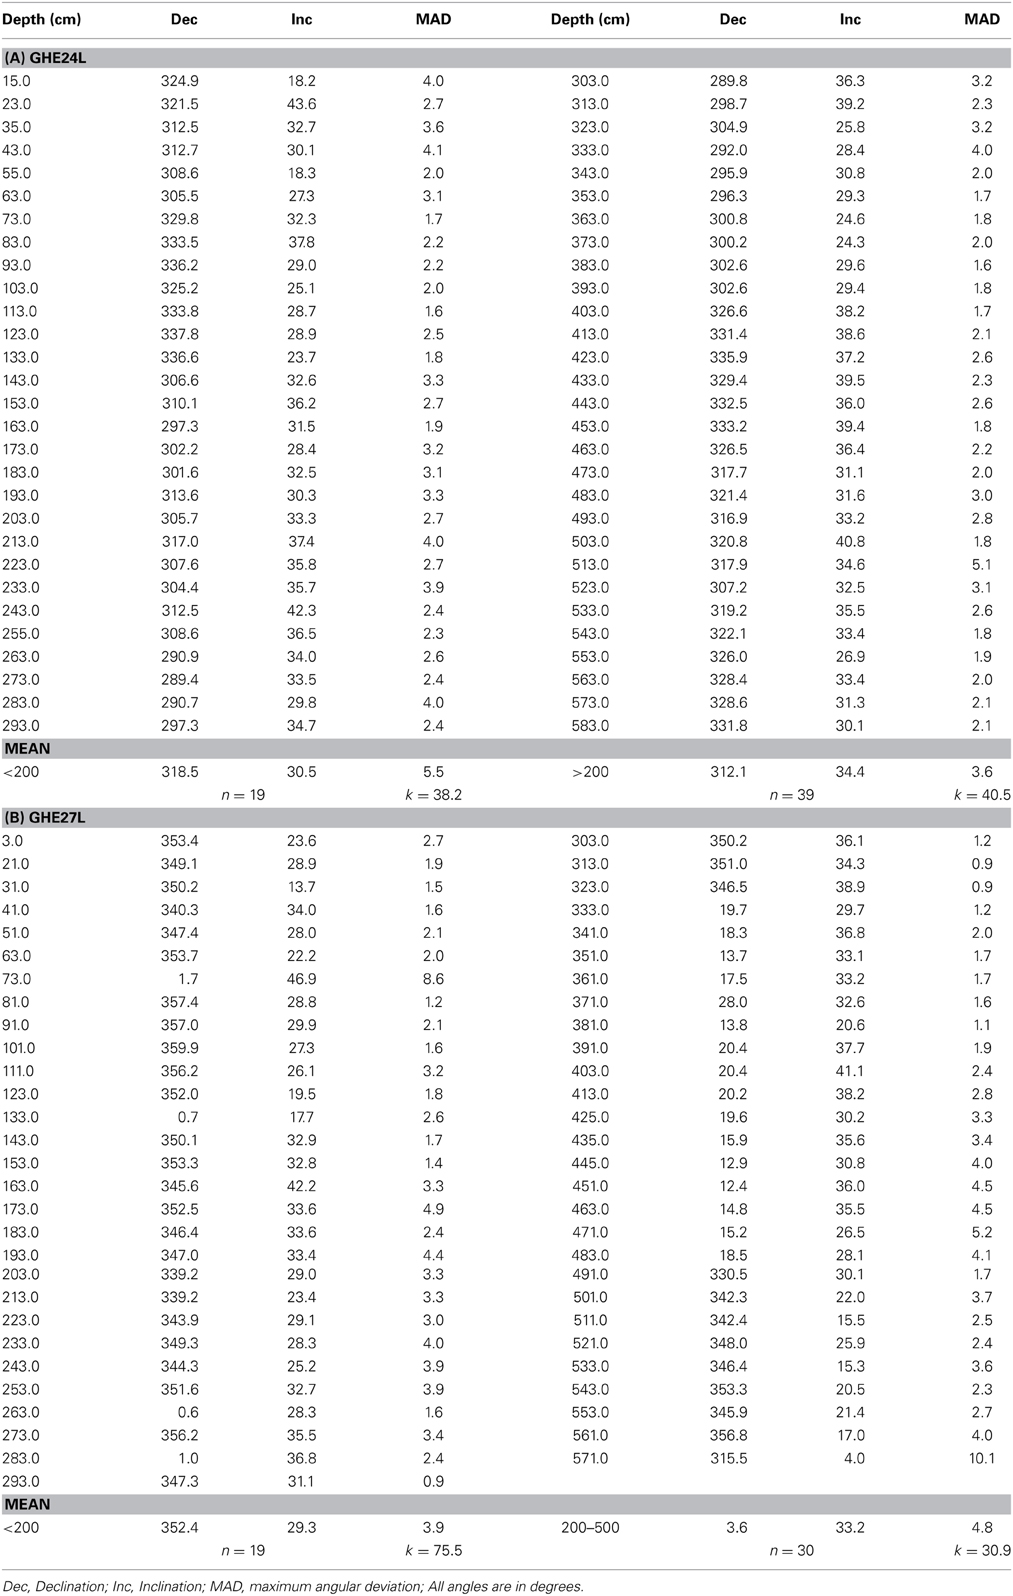
Table 2. Paleomagnetic results from Cores GHE24L and GHE27L.
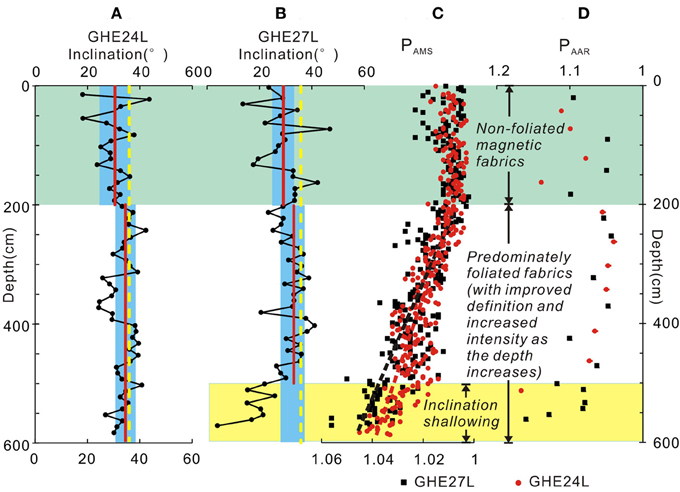
Figure 8. Comparison of down-core variations in the inclinations of ChRMs (A,B) and changes in both AMS (C) and AAR (D) of Cores GHE24L and GHE27L. The red solid lines and the yellow dashed lines in (A,B) indicate the mean inclinations of the corresponding segments and the expected inclinations of the geocentric axial dipole (GAD) field at the sites. The dashed lines in (C) represent the linear regression lines for GHE24L and GHE27L sediments, respectively.
Discussion
In order to determine whether inclination shallowing occurred in these two cores and how much the inclination is shallowed, the expected inclinations at the core sites must be calculated. According to the geocentric axial dipole model (GAD), the expected inclinations of GHE24L and GHE27L are 35.9 and 35.8°, respectively (Figures 8A,B).
Down-core variations of AMS and AAR of both GHE24L and GHE27L exhibit different characteristics above and below 2 m (Figures 2–4), i.e., non-foliated fabrics above 2 m and predominantly foliated fabrics with a general trend of linear or quasilinear increase in intensity with depth below 2 m (Figures 2A, 3A, 4E). These disparate features of AMS and AAR fabrics between the above 2 m and the below 2 m segments of the two cores encourage us to believe that variations of inclination with depth should be treated separately to examine the relationship between development of magnetic fabrics and recording accuracy of inclinations with increasing depth.
The <2 m Segment
To estimate the range of variations in inclinations of the upper 2 m sediments, Fisher means and 95% confidence intervals of GHE24L and GHE27L are calculated (Table 2) and graphically shown in Figures 8A,B. For GHE24L, the mean inclination is 30.5°, with an α95 = 5.5°. The inclinations are overall slightly shallower than the expected inclination of 35.9° at GHE24L, though the 95% confidence interval narrowly includes the expected inclination value (Figure 8A). For GHE27L, the mean inclination is 29.3°, with an α95 = 3.9°. The inclinations are clearly shallower than the expected inclination of 35.8° at GHE27L and even the 95% confidence interval does not include the expected inclination value (Figure 8B). The inclinations of the uppermost samples of both GHE24L and GHE27L are also shallower than the expected inclination of 27.5° of the modern local field of IGRF 2011 (Finlay et al., 2010). It seems that the upper 2 m sediments did not faithfully record the ambient field, but carry inclinations biased toward lower values. Both GHE24L and GHE27L do not show a depositional magnetic fabric. GHE27L displays a random AMS fabric (Figure 3C). GHE24L exhibits a triaxial AMS (Figure 2C) and AAR (Figure 4A) fabric with principal axes of AMS parallel to those of AAR and the minimum axes of both AMS and AAR subparallel to the bedding, indicating that magnetic particles were disturbed from accurately recording the ambient field. In essence, the lack of a bedding-parallel, depositional magnetic fabric in the upper 2 m sediments suggests that magnetite particles were not fully aligned to collectively show a preferred orientation along the ambient field. Rather, magnetic particles are likely mobile and readily disturbed in the upper 2 m due to high water content and high porosity. Perhaps the gravitational force overwhelms the magnetic force so that a shallower-than-expected inclination results.
The >2 m Segment
AMS vs. depth
One prominent feature of the > 2 m segments of both GHE24L and GHE27L sediments is that the magnetic anisotropy is characterized by oblate fabrics with the intensity (PAMS) of anisotropy increasing with depth (Figures 2A,E,F, 3A,E,F). As both GHE24L and GHE27L cores contain highly homogenous material, i.e., light gray to gray clays and silty clays, this prominent feature provides clear evidence for the gradual development of compaction-induced magnetic anisotropy with depth. As sediments accumulate during deposition, loading of sediments led to the formation of oblate fabrics at depth. Continued loading of sediments gives rise to the increase in the intensity (PAMS) of oblate fabrics with depth.
AAR vs. depth
Unlike AMS that measures the anisotropy of all grains in a sample, AAR measures anisotropy of remanence-carrying grains in a sample and thus has direct relevance to the accuracy of inclination of the remanence for the sample. AAR data of both GHE24L and GHE27L sediments show that weak, predominantly foliated fabrics are developed (Figures 4A–D). There is a tendency of an overall steepening of the minimum axes K3 with depth and, as a result, predominantly foliated fabrics appear to become overall better defined as the depth increases (Figures 4A,C). In addition, the intensities of AAR fabrics, PAAR, of GHE24L and GHE27L appear to show an overall quasilinear increase with depth (Figure 4E). These features are consistent with those of AMS fabrics, suggesting that (1) compaction affected not only the bulk samples, but also the remanence-carrying grains; (2) remanence-carrying grains respond to increased compaction in a similar fashion to the bulk samples by the development of increased degree of remanence fabrics. In particular, the overall quasilinear trend of increase in PAAR with depth suggests that the degree of magnetic anisotropy of remanence-carrying grains closely correspond to the degree of compaction.
Inclination vs. depth
Inclinations of the 2–5.8 m sediments of Core GHE24L vary between ~24 and 42°, and the amplitude of variation is relatively smaller than those in the upper 2 m where inclinations vary from ~18 to 44° (Figure 8A, Table 2). The Fisher means of inclinations of the 2–5.8 m in GHE24L is 34.4°, with an α95 = 3.6°, which is statistically indistinguishable from the expected inclination of 35.9° at Core GHE24L (Figure 8A), suggesting accurate recording of the geomagnetic field. For Core GHE27L, sediments at depth greater than 2 m also appear to display down-core variations in inclination with relatively smaller amplitude than those in the upper 2 m (Figure 8B, Table 2). But this pattern changes in the lower part of Core GHE27L, where the trend of down-core inclination variations deviates significantly from that of the rest of inclinations (Figure 8B). The deviation is so large that it is inappropriate to take the mean of all >2 m inclinations, instead we treat the bottom ~1 m, i.e., 5.0–5.71 m, separately (Figure 8B). The Fisher mean of inclinations from the 2–5 m segment is computed to be 33.2°, with an α95 = 4.8°, which is also statistically indistinguishable from the expected inclination of 35.8° at Core GHE27L (Figure 8B). Since sediments at 2–5.8 m of Core GHE24L and 2–5.0 m of Core GHE27L exhibit inclinations that are statistically same as the expected GAD field inclinations of core sites, these sediments accurately recorded the geomagnetic field in spite of the presence of predominantly oblate magnetic fabrics. The implication is that the presence of oblate magnetic fabrics does not necessarily indicate the occurrence of inclination shallowing.
Since neither the uppermost of the two cores show inclinations similar to the expected inclination of the local IGRF, nor the other parts of the upper 2 m segments show inclinations similar to the expected inclination of the GAD field (Section The <2 m Segment), DRM did not faithfully record the geomagnetic field. However, the 2–5 m of GHE27L and >2 m of GHE24L exhibit inclinations similar to the expected inclination of the GAD field, suggesting that pDRM processes must have taken place to allow accurate recording of the geomagnetic field in the >2 m segments. The >2 m segments must have also undergone compaction because the degree of magnetic anisotropy for the >2 m segments increases gradually down-core (Sections AMS vs. Depth, Figures 2–4). The compaction effect on the pDRMs appears to be small for the > 2 m segment of GHE24L because this segment recorded inclinations similar to the expected inclination of the GAD field (Figure 8A). Similarly, the 2–5 m segment of GHE27L also appears to have accurately documented the expected inclination of the GAD field (Figure 8B). Significant inclination shallowing did not occur until in the lowermost segment of GHE27L (Figure 8B). This suggests that, with increasing depth, the compaction effect becomes large enough in the lowermost segment of GHE27L to cause pDRMs of this segment to rotate toward the horizontal in responses to the increased compaction, leading to inclination shallowing. The lowermost segment of GHE27L also exhibits an increased degree of inclination shallowing and increased intensity of compaction-induced AMS and AAR with depth, i.e., the increasing compaction. This is best illustrated in Figure 8 in which down-core variations in both inclinations and magnitude of magnetic anisotropy with depth are shown. It is reasonable to assume that the greater the P values, the greater influence of compaction on inclination. However, the extent to which the compaction effect becomes significant to cause inclination shallowing is not known. Figures 8B–D show that inclination shallowing in Core GHE27L did not occur until the intensity of AMS and AAR reaches ~1.04 and ~1.10 at ~5.0 m, respectively. The lower part of GHE24L shows magnetic anisotropy of PAMS < ~1.04 and PAAR predominantly <~1.10, and does not display inclination shallowing (Figures 8A,C,D). Taken together, the results appear to suggest that PAMS = 1.04 and PAAR = 1.10 are the cutoff values for the intensity of bulk magnetic anisotropy over which inclination shallowing takes place.
It is interesting to note that the intensities of magnetic anisotropy at similar sediment depths, i.e., similar sediment loading-induced compaction, of GHE24L and GHE27L are different (Figures 8C,D) despite the fact that both cores contain largely homogenous sediments. At the similar sediment depth, both AMS and AAR intensities of GHE24L are overall slightly weaker than those of GHE27L (Figures 8C,D). The difference is possibly related to the fact that GHE27L is situated at ~150 m deeper in water depth than GHE24L because the difference in clay contents of the two cores is too subtle (see Section Lithology) to cause large differential compaction effect for the two cores.
It is important to point out that each sample is assumed to have averaged out PSVs. Although the sedimentation rate is not constrained, the assumption appears to be valid because samples from the >2 m segment of GHE24L and the 2–5 m segment of GHE27L yield inclinations similar to the expected inclinations of the GAD field at the two sites (Figures 8A,B). Furthermore, the down-core inclination variations of the two cores show a high degree of resemblance (Figure 9), suggesting that the documented signals of the two cores are reproducible and reliable. Therefore, the anomalously low inclinations of the >5 m segment of Core GHE27L were not likely caused by PSVs, but most likely by burial compaction.
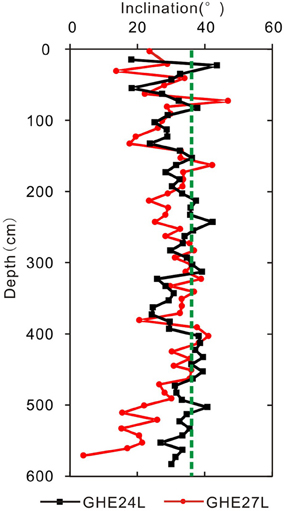
Figure 9. Down-core changes in the inclinations of the ChRMs of sediments from Cores GHE24L and GHE27L, showing a similar pattern of variation except the lower part of GHE27L where inclinations are markedly shallow. The green dashed line indicates the expected inclination of the GAD field at the sites.
Correction for inclination shallowing
An important assumption of Jackson et al. (1991)'s theoretical model is that the degree of inclination shallowing is directly related to the degree of magnetic anisotropy. Both GHE24L and GHE27L sediments from the >2 m segments exhibit a gradual increase in magnetic anisotropy with depth, but significant inclination shallowing occurs only in the >5 m segment of GHE27L where the PAAR values are generally greater than ~1.10. This raises concerns about over-correction for the sediments with magnetic anisotropy less than ~1.10. To examine the effect of over-correction for the 2–5 m segment of GHE27L where significant inclination shallowing does not occur, we first estimate the particle anisotropy “a” by correcting the shallow inclinations of the >5 m segment of the GHE27L sediments to the expected GAD inclination of 35.8° using Jackson et al. (1991)'s approach. This approach relates inclination shallowing and AAR fabrics as follows.
where Io = the observed inclination of the characteristic remanent magnetization; Ie = the expected magnetic field inclination; qx = k1/(k1 + k2 + k3); qy = k2/(k1 + k2 + k3); qz = k3/(k1 + k2 + k3); k1, k2, and k3 are the maximum, intermediate, and minimum principal axes of the AAR ellipsoid; and “a” is the individual particle anisotropy. Equation (1) can be rewritten below to find “a”:
Given qx + qy + qz = 1, we derive qx and qz for oblate and prolate deformations that accommodate compaction as follows:
For oblate deformation, qx = qy > qz (Kodama and Davi, 1995);
for prolate deformation, qx > qy = qz (Kodama and Davi, 1995);
Three samples at 501, 553, and 561 cm that best represent the trend of inclination - anisotropy (PAAR) connection, i.e., increased inclination shallowing corresponds to increased degree of magnetic anisotropy, are chosen to estimate the “a” factor by correcting their inclinations to the expected inclination, i.e., 35.8°, of the GAD field at the GHE27L site using Equations (2) and (3) or Equations (2) and (4). AAR data of sample at 501 cm show an oblate deformation and samples from 553 and 561 cm show a prolate deformation (Table 1, L, F). The three samples yield an “a” factor of 1.69, 1.56, and 1.55, respectively, with a mean “a” factor of 1.6. Since the sediments in GHE27L are highly homogenous throughout the core, the particle anisotropy “a” of 1.6 is applicable to the 2–5 m segment of the GHE27L as well. Five samples that have a PAAR < ~1.10 from the 2–5 m segment (Figures 4E, 8D) yield a mean uncorrected inclination of 32.0 ± 6.2° (the black dashed line and the gray shaded area in Figure 10). Using “a” = 1.6 and the AAR data of these five samples (Table 1), we corrected the observed inclinations of these five samples and obtained a mean corrected inclination of 39.6 ± 6.7° (Figure 10). The corrected inclinations are statistically indistinguishable with the expected inclination and the over-correction with respect to the expected inclination of 35.8° amounts only 3.8°, which is well within the uncertainty of 6.7° (Figure 10). Therefore, the over-correction is negligible for the 2–5 m segment of Core GHE27L.
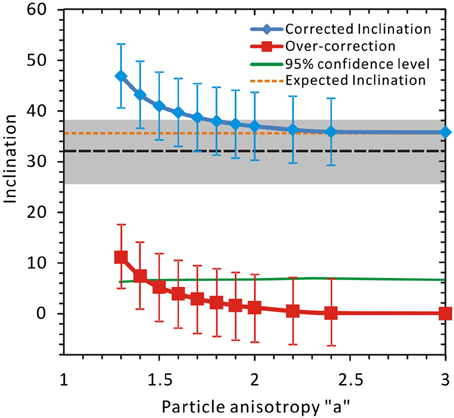
Figure 10. Examination of over-correction of inclinations with varying individual particle anisotropy “a” from 1.3 to 3 for the 2–5 m segment of the GHE27L. The black dashed line and the gray shaded area indicate the mean uncorrected inclination and associated 95% confidence interval for the 2–5 m segment of Core GHE27L. Over-correction is defined as the difference between the corrected inclination (blue curve) and the expected inclination (orange dashed line) for a given “a” factor. The over-correction is indicated by the red curve. The green curve represents the 95% confidence limit of the corrected inclinations. If a mean over-correction exceeds the green curve for a given “a” factor, the over-correction is considered significant. The over-correction becomes significant for “a” <1.4 at which the mean over-corrections exceed the 95% confidence limit.
Because individual particle anisotropy “a” can vary from sediments to sediments in a natural environment, the extent of over-correction of inclinations of sediments with different “a” factors needs to be assessed. Laboratory determination of “a” factor in many previous studies show that the “a” factor of magnetite particles appears to vary mainly between ~1.3 and 3 (e.g., Kodama and Davi, 1995; Kodama, 1997; Tan and Kodama, 1998; Li et al., 2004; Vaughn et al., 2005). As such, we examine the extent of over-correction for the 2–5 m segment of Core GHE27L by modeling inclination correction using “a” factors ranging from 1.3 to 3. Assuming that both bulk anisotropy and particle anisotropy are accurately determined, inclination corrections for samples from the 2–5 m segment of Core GHE27L are performed for an “a” factor using Jackson et al. (1991)'s approach and then the mean corrected inclination and associated α95 of these samples are computed for the “a” factor. By varying the “a” factor from 1.3 to 3.0, the corrected inclinations for each “a” factor are obtained (blue curve in Figure 10). The corrected inclinations are then subtracted by the expected inclination (orange dashed line in Figure 10) to determine the amount of over-correction for a given “a” factor (red curve in Figure 10). If a mean over-correction exceeds the α95 limit (green curve in Figure 10) of the corrected inclination for a given “a” factor, the over-correction is considered significant. The results show that the corrected inclinations are statistically indistinguishable from the expected inclination for “a” > 1.4 and thus over-correction is negligible. But for “a” < 1.4, the corrected inclination is statistically higher than the expected inclination, indicating a significant over-correction that can amount to more than 10° (Figure 10).
To summarize, a threshold magnetic anisotropy of PAMS~1.04 and PAAR~1.10 is recognized in this study on the basis of the following observations: (1) the core sediments are highly homogenous; (2) remanence mainly resides in magnetite; (3) the magnitude of magnetic anisotropy increases gradually with depth for the > 2 m segments and inclination shallowing occurs only in the lower part of GHE27L, implying that the inclination shallowing in GHE27L was most likely caused by compaction. Because the two cores consist mainly of clays, which are prone to compaction, the recognized threshold anisotropy in this study is conservative and thus should be useful in identifying compaction-induced inclination shallowing in some sedimentary rocks in which magnetite is the major remanence carrier. Since AMS can be determined quickly and precisely, AMS should be routinely measured and examined with respect to the threshold anisotropy of PAMS~1.04. If PAMS > ~1.04, AAR of selected samples can be determined and correction for inclination shallowing is followed if PAAR>~1.10. In the meantime, as a cautionary note, these threshold anisotropy values should not be used blindly without examining magnetic mineralogy, grain sizes, and sediment composition because variations in these factors may complicate the connection between the degree of magnetic anisotropy and the amount of inclination shallowing. Future studies need to invetigate the relationship between magnetic anisotropy and inclination shallowing in sediments and sedimentary rocks that have varying compositions.
Conclusions
Paleomagnetic and rock magnetic analyses of two gravity cores GHE24L and GHE27L from the northern slope of the SCS reveal that these two cores document the detailed changes in inclinations and the gradual development of magnetic anisotropy in a stratigraphic column where compaction is occurring. The results allow us to draw the following conclusions.
(1) The upper 2 m of both GHE24L and GHE 27L exhibit non-foliated fabrics and inclinations within this depth interval appear to be slightly shallower than the expected inclination of the GAD field of the study sites. This is probably due to high water content preventing development of magnetic fabrics and locking-in remanence.
(2) For sediments with depth greater than 2 m, predominantly foliated magnetic fabrics are developed in both GHE24L and GHE27L. In addition, the degree of anisotropy in both magnetic susceptibility (AMS) and remanence (AAR) tends to increase linearly or quasilinearly with depth, strongly indicating that sediment compaction is the cause of magnetic anisotropy of the stratigraphic columns. The GAD field inclination is well within the confidence interval for the mean uncorrected inclination of sediments from Core GHE24L and the 2–5 m segment of Core GHE27L; while the >5 m segment of GHE27L displays inclination shallowing. For the >5 m segment of GHE27L, the magnitude of inclination shallowing appears to generally increase with depth and largely corresponds with the degree of magnetic fabrics, particularly the AAR fabrics, thus documenting a close connection between the development of magnetic anisotropy and inclination shallowing in response to compaction. This thus provides field evidence to substantiate the fundamental assumption of Jackson et al. (1991)'s theoretical model. In addition, this provides a basis for taking foliated remanence fabrics as direct physical evidence for identifying inclination shallowing.
(3) Examination of the down-core inclination-anisotropy connection of GHE24L and GHE27L suggests that a threshold anisotropy of PAMS ~1.04 and PAAR ~1.10 exists for compaction-induced inclination shallowing to occur in the cores. The implication would be that occurrence of oblate fabrics alone cannot indicate inclination shallowing, only oblate fabrics with anisotropy greater than the threshold anisotropy values may cause compaction-induced inclination shallowing.
(4) Investigation of the degree of over-correction for the 2–5 m segment of Core GHE27L, which shows less-than-the threshold anisotropy and displays no inclination shallowing, with varying individual particle anisotropy suggests that over-correction is mostly negligible, but more than 10° over-correction is possible if individual particle anisotropy is less than 1.4.
(5) Collectively, the results provide field evidence that complements and substantiates the assumption for Jackson et al. (1991)'s theoretical model for the inclination correction technique. The implication is that magnetic anisotropy can serve as “physical” evidence for recognizing inclination shallowing and can be used to quantitatively correct for inclination errors of sedimentary rocks with confidence. Also, the recognized threshold bulk magnetic anisotropy could be useful in identifying compaction-induced inclination shallowing in studying paleomagnetism of some sedimentary rocks in which remanence is mainly carried by magnetite. However, it is worth noting that these threshold anisotropy values should not be used blindly without examining magnetic mineralogy, grain size, and sediment composition because variations in these factors may complicate the connection between magnetic anisotropy and inclination shallowing. Future studies need to investigate the relationship between magnetic anisotropy and inclination shallowing in sediments and sedimentary rocks that have varying compositions.
Conflict of Interest Statement
The authors declare that the research was conducted in the absence of any commercial or financial relationships that could be construed as a potential conflict of interest.
Acknowledgments
This study was supported by a grant from Guangzhou Marine Geological Survey (GMGS) of China (GZH201100311-02) and partly by grants from the National Natural Science Foundation of China (41274071, 41230208, 41321062). Xiang Rong contributed the unpublished grain size and carbonate content data of the studied cores. We thank Xiang Rong, Hu Jianfang, and the staff in the core repository of GMGS for helping with sample collection. We would like to thank Xiaodong Tan and Yulin Han for helping with AAR measurements, and Ken Kodama for providing comments on an early version of the manuscript. Three reviewers and Associate Editor Joshua Feinberg are thanked for their constructive reviews that help improve the manuscript.
References
Anson, G. L., and Kodama, K. P. (1987). Compaction-induced inclination shallowing of the post-depositional remanentmagnetization in a synthetic sediment. Geophys. J. R. Astron. Soc. 88, 673–692. doi: 10.1111/j.1365-246X.1987.tb01651.x
Arason, P., and Levi, S. (1990). Compaction and inclination shallowing in deep sea sediments from the Pacific Ocean. J. Geophys. Res. 95, 4501–4510. doi: 10.1029/JB095iB04p04501
Bilardello, D. (2013). Understanding DRM acquisition of plates and spheres: a first comparative experimental approach. Geophys. J. Int. 195, 148–158. doi: 10.1093/gji/ggt240
Bilardello, D., Jezek, J., and Gilder, S. A. (2013). Role of spherical particles on magnetic field recording in sediments: experimental and numerical results. Phys. Earth Planet. Int. 214, 1–13. doi: 10.1016/j.pepi.2012.10.014
Bilardello, D., and Kodama, K. P. (2010a). Paleomagnetism and magnetic anisotropy of Carboniferous red beds from the Maritime Provinces of Canada: evidence for shallow paleomagnetic inclinations and implications for North American apparent polar wander. Geophys. J. Int. 180, 1013–1029. doi: 10.1111/j.1365-246X.2009.04457.x
Bilardello, D., and Kodama, K. P. (2010b). Rock magnetic evidence for inclination shallowing in the early Carboniferous Deer Lake Group red beds of western Newfoundland. Geophys. J. Int. 181, 275–289. doi: 10.1111/j.1365-246X.2010.04537.x
Bilardello, D., and Kodama, K. P. (2010c). A new inclination shallowing correction of the Mauch Chunk Formation of Pennsylvania, based on high-field AIR results: implications for the Carboniferous North American APW path and Pangea reconstructions. Earth Planet. Sci. Lett. 299, 218–227. doi: 10.1016/j.epsl.2010.09.002
Cogné, J. P. (2003). PaleoMac: aMacintoshTM application for treating paleomagnetic data and making plate reconstructions. Geochem. Geophys. Geosyst. 4, 1007. doi: 10.1029/2001GC000227
Collinson, D. W. (1965). DRM in sediments. J. Geophys. Res. 70, 4663–4668. doi: 10.1029/JZ070i018p04663
Collombat, H., Rochette, P., and Kent, D. V. (1993). Detection and correction of inclinations hallowing in deep sea sediments using the anisotropy of anhysteretic remanence. Bull. Soc. gdol France 164, 103–111.
Constable, C., and Parker, L. (1988). Statistics of the geomagnetic secular variation for the past 5 m.y. J. Geophys. Res. 93, 11569–11581. doi: 10.1029/JB093iB10p11569
Constable, C., and Johnson, C. (1999). Anisotropic paleosecular variation models: implications for geomagnetic field observables. Phys. Earth Planet. Inter. 115, 35–51. doi: 10.1016/S0031-9201(99)00065-5
Day, R., Fuller, M., and Schmidt, V. A. (1977). Hysteresis properties of titanomagnetites: grain-size and compositional dependence. Phys. Earth Planet. Inter. 13, 260–267. doi: 10.1016/0031-9201(77)90108-X
Deamer, G. A., and Kodama, K. P. (1990). Compaction-induced inclination shallowing in synthetic and clay-rich sediments. J. Geophys. Res. 95, 4511–4529. doi: 10.1029/JB095iB04p04511
Dunlop, D. (2002a). Theory and application of the Day plot (Mrs/Ms versus Hcr/Hc) 1. Theoretical curves and tests using titanomagnetite data. J. Geophys. Res. 107, NO. B3, 2056. doi: 10.1029/2001JB000486
Dunlop, D. (2002b). Theory and application of the Day plot (Mrs/Ms versus Hcr/Hc) 2. Application to data for rocks, sediments, and soils. J. Geophys. Res. 107, NO. B3, 2057. doi: 10.1029/2001JB000487
Finlay, C. C., Maus, S., Beggan, C. D., Bondar, T. N., Chambodut, A., Chernova, T. A., et al. (2010). International geomagnetic reference field: the eleventh generation. International Association of Geomagnetism and Aeronomy, Working Group V-MOD. Geophys. J. Int. 183, 1216–1230. doi: 10.1111/j.1365-246X.2010.04804.x
Fisher, R. A. (1953). Dispersion on a sphere. Proc. R. Soc. Lond. A 217, 295–305. doi: 10.1098/rspa.1953.0064
Garcés, M., Parés, J. M., and Cabrera, L. (1996). Further evidence for inclination shallowing in red beds. Geophys. Res. Lett. 23, 2065–2068. doi: 10.1029/96GL02060
Gilder, S., Chen, Y., and Sen, S. (2001). Oligo-Miocene magnetostratigraphy and rock magnetism of the Xishuigou section, Subei (Gansu Province, western China) and implications for shallow inclinations in central Asia. J. Geophys. Res. 106, 30505–30521. doi: 10.1029/2001JB000325
Gilder, S. A., Chen, Y., Cogné, J. P., Tan, X., Courtillot, V., Sun, D., et al. (2003). Paleomagnetism of Upper Jurassic to Lower Cretaceous volcanic and sedimentary rocks from the western Tarim Basin and implications for inclination shallowing and absolute dating of the M-0 (ISEA?) chron. Earth planet. Sci. Lett. 206, 587–600. doi: 10.1016/S0012-821X(02)01074-9
Griffiths, D. H., King, R. F., Rees, A. I., and Wright, A. E. (1960). Remanent magnetism of some recent varved sediments. Proc. R. Soc. A 256, 359–383. doi: 10.1098/rspa.1960.0113
Guyodo, Y., and Valet, J. P. (1999). Global changes in geomagnetic intensity during the past 800 thousand years. Nature 399, 249–252 doi: 10.1038/20420
Hall, R. (2002). Cenozoic geological and plate tectonic evolution of SE Asia and the SW Pacific: computer-based reconstructions, model and animations. J. Asian Earth Sci. 20, 353–431. doi: 10.1016/S1367-9120(01)00069-4
Huang, W. T., Guilaume, D. N., Peter. C. L., Douwe, J. J., and Erwan, H. (2013). Inclination shallowing in Eocene Linzizong sedimentary rocks from Southern Tibet: correction, possible causes and implications for reconstructing the India–Asia collision. Geophys. J. Int. 194, 1390–1411. doi: 10.1093/gji/ggt188
Jackson, M. J., Banerjee, S. K., Marvin, J. A., Lu, R., and Gruber, W. (1991). Detrital remanence inclination errors and anhysteretic remanence anisotropy: quantitative model and experimental results. Geophys. J. Int. 104, 95–103. doi: 10.1111/j.1365-246X.1991.tb02496.x
Kim, B. Y., and Kodama, K. P. (2004). A compaction correction for the paleomagnetism of the Nanaimo Group sedimentary rocks: implications for the Baja British Columbia hypothesis. J. Geophys. Res. 109, B02102. doi: 10.1029/2003JB002696
King, R. F. (1955). The remanent magnetism of artificially deposited sediments. Geophys. J. Int. 7, 115–134. doi: 10.1111/j.1365-246X.1955.tb06558.x
Kirschvink, J. L. (1980). The least-squares line and plane and the analysis of paleomagnetic data, Geophys. J. Int. 62, 699–18. doi: 10.1111/j.1365-246X.1980.tb02601.x
Kodama, K. P. (1997). A successful rock magnetic technique for correcting paleomagnetic inclination shallowing: case study of the Nacimiento Formation, New Mexico. J. Geophys. Res. 102, 5193–5206. doi: 10.1029/96JB03833
Kodama, K. P. (2009). Simplification of the anisotropy-based inclination correction technique for magnetite- and haematite-bearing rocks: a case study for the Carboniferous Glenshaw and Mauch Chunk Formations, North America. Geophys. J. Int. 176, 467–477. doi: 10.1111/j.1365-246X.2008.04013.x
Kodama, K. P. (2012). Paleomagnetism of Sedimentary Rocks: Process and Interpretation. Oxford: Wiley-Blackwell.
Kodama, K. P., and Davi, J. M. (1995). A compaction correction for the paleomagnetism of the Cretaceous Pigeon Point formation of California. Tectonics 14, 1153–1164. doi: 10.1029/95TC01648
Li, A. C., Huang, J., Jiang, H. Y., Wan, S. M. (2011). Sedimentary evolution in the northern slope of the South China Sea since the Oligocene and its response to tectonics. Chinese J. Geophys. 54, 1084–1096. doi: 10.1002/cjg2.1686
Li, Y. X., Kodama, K. P., and Smith, D. P. (2004). New paleomagnetic, rock magnetic, and petrographic results from the Valle Group, Baja California, Mexico: exploring the causes of anomalously shallow paleomagnetic inclinations. J. Geophys. Res. 109, B11101. doi: 10.1029/2004JB003127
Li, Y. X., Shu, L. S., Wen, B., Yang, Z. Y., and Ali, J. R. (2013). Magnetic inclination shallowing problem and the issue of Eurasia's rigidity: insights following a paleomagnetic study of Upper Cretaceous basalts and redbeds from SE China. Geophys. J. Int. 194, 1374–1389. doi: 10.1093/gji/ggt181
Lu, R., Banerjee, S., and Marvin, J. (1990). Effects of clay mineralogy and the electrical conductivity ofwater in the acquisition of depositional remanent magnetism in sediments. J. geophys. Res. B95, 4531–4538. doi: 10.1029/JB095iB04p04531
Lund, S., Platzman, E., Thouveny, N., Camoin, G., Corsetti, F., and Berelson, W. (2010). Biological control of paleomagnetic remanence acquisition in carbonate framework rocks of the Tahiti coral reef. Earth Planet. Sci. Lett. 298, 14–22. doi: 10.1016/j.epsl.2010.07.010
Lund, S. P. (1985). A comparison of the statistical secular variation recorded in some Late Quaternary lava flows and sediments and its implications. Geophys. Res. Lett. 12, 251–254. doi: 10.1029/GL012i005p00251
McCabe, C., Jackson, M., and Ellwood, B. B. (1985). Magnetic anisotropy in the Trenton limestone: results of a new technique, anisotropy of anhysteretic susceptibility. Geophys. Res. Lett. 12, 333–336. doi: 10.1029/GL012i006p00333
Mitra, R., and Tauxe, L. (2009). Full vector model for magnetization in sediments. Earth Planet. Sci. Lett. 286, 535–545. doi: 10.1016/j.epsl.2009.07.019
Opdyke, N. D., and Henry, K. W. (1969). A test of the dipole hypothesis. Earth Planet. Sci. Lett. 6, 139–151. doi: 10.1016/0012-821X(69)90132-0
Rees, A. I. (1961). The effect of water currents on the magnetic remanence and anisotropy of susceptibility of some sediments. Geophys. J. R. Astron. Soc. 5, 235–251. doi: 10.1111/j.1365-246X.1961.tb00431.x
Roberts, A., and Winklhofer, M. (2004). Why are geomagnetic excursions not always recorded in sediments? Constraints from post-depositional remanent magnetization lock-in modeling. Earth Planet. Sci. Lett. 227, 345–359. doi: 10.1016/j.epsl.2004.07.040
Roberts, A. P., Florindo, F., Chang, L., Heslop, D., Jovane, L., and Larrasoaña, J. C. (2013). Magnetic properties of pelagic marine carbonates. Earth Sci. Rev. 127, 111–139. doi: 10.1016/j.earscirev.2013.09.009
Ryan, W. B. F., Carbotte, S. M., Coplan, J. O., O'Hara, S., Melkonian, A., Arko, R., et al. (2009). Global multiresolution topography synthesis. Geochem. Geophys. Geosyst. 10, Q03014. doi: 10.1029/2008GC002332
Scherbakov, V., and Sycheva, N. K. (2008). Flocculation mechanism of the acquisition of remanent magnetization by sedimentary rocks. Phys. Solid Earth 44, 804–815. doi: 10.1134/S106935130810008X
Scherbakov, V., and Sycheva, N. K. (2010). On the mechanism of formation of depositional remanent magnetization. Geochem. Geophys. Geosyst. 11, Q02Z13. doi: 10.1029/2009GC002830
Schönfeld, J., and Kudrass, H. R. (1993). Hemiplegic sediment accumulation rates in the South China Sea related to Late Quaternary sea level changes. Quaternary Res. 40, 368–379. doi: 10.1006/qres.1993.1090
Sun, W. W., and Kodama, K. P. (1992). Magnetic anisotropy, scanning electron microscopy, and X ray pole figure goniometry study of inclination shallowing in a compacting clay-rich sediments. J. Geophys. Res. 97, 19599–19615. doi: 10.1029/92JB01589
Tan, X. D. (2001). Correcting the bias Toward Shallow Paleomagnetic Inclinations In Hematite-Bearing Sedimentary Rocks: Theory, Experiments, and Applications. Ph.D. thesis, Lehigh University.
Tan, X. D., Gilder, S., Kodama, K. P., Jiang, W., Han, Y., Zhang, H., et al. (2010). New paleomagnetic results from the Lhasa block: revised estimation of latitudinal shortening across Tibet and implications for dating the India-Asia collision. Earth Planet. Sci. Lett. 293, 396–404. doi: 10.1016/j.epsl.2010.03.013
Tan, X. D., and Kodama, K. P. (1998). Compaction-corrected inclinations from southern California Cretaceous marine sedimentary rocks indicate no paleolatitudinal offset for the Peninsular Ranges terrane. J. Geophys. Res. 103, 27169–27192. doi: 10.1029/98JB02343
Tan, X. D., Kodama, K. P., Chen, H., Fang, D., Sun, D., and Li, Y. (2003). Paleomagnetism and magnetic anisotropy of Cretaceous red beds from the Tarim basin, northwest China: evidence for a rock magnetic cause of anomalously shallow paleomagnetic inclinations from Central Asia. J. Geophys. Res. 108, 2107. doi: 10.1029/2001JB001608
Tapponnier, P., Peltzer, G., Le Dain, A. Y., Armijo, R., and Cobbold, P. (1982). Propagating extrusion tectonics in Asia: new insights from simple experiments with plasticine. Geology 10, 611–616.
Tapponnier, P., Xu, Z., Roger, F., Meyer, B., Arnaud, N., Wittlinger, G., et al. (2001). Oblique stepwise rise and growth of the Tibetan Plateau. Science 294, 1671–1677. doi: 10.1126/science.105978
Tauxe, L., and Kent, D. V. (1984). Properties of a detrital remanence carried by hematite from study of modern river deposits and laboratory redeposition experiments. Geophys. J. R. Astron. Soc. 76, 543–561. doi: 10.1111/j.1365-246X.1984.tb01909.x
Tauxe, L., and Kent, D. V. (2004). A simplified statistical model for the geomagnetic field and the detection of shallow bias in paleomagnetic inclinations: was the ancient magnetic field dipolar? Timescales Paleomagnetic Field 145, 101–116. doi: 10.1029/145GM08
Tauxe, L., Kent, D. V., and Opdyke, N. D. (1980). Magnetic components contributing to the NRM of Middle Siwaliks Red Beds. Earth Planet. Sci. Lett. 47, 279–284. doi: 10.1016/0012-821X(80)90044-8
Tauxe, L., Kodama, K., and Kent, D. V. (2008). Testing corrections for paleomagnetic inclination error in sedimentary rocks: a comparative approach. Phys. Earth Planet. Int. 169, 152–165. doi: 10.1016/j.pepi.2008.05.006
Tauxe, L., Steindorf, J. L., and Harris, A. (2006). Depositional remanent magnetization: toward an improved theoretical and experimental foundation. Earth Planet. Sci. Lett. 244, 515–529. doi: 10.1016/j.epsl.2006.02.003
Valet, J. P. (2003). Time variations in geomagnetic intensity. Rev. Geophys. 41, 1004. doi: 10.1029/2001RG000104
Valet, J. P., Meynadier, L., and Guyodo, Y. (2005). Geomagnetic dipole strength and reversal rate over the past two million years. Nature 435, 802–805. doi: 10.1038/nature03674
Vaughn, J., Kodama, K. P., and Smith, D. P. (2005). Correction of inclination shallowing and its tectonic implications: the Cretaceous Perforada Formation, Baja California. Earth planet. Sci. Lett. 232, 71–82. doi: 10.1016/j.epsl.2004.11.026
Verosub, K. L. (1977). Depositional and postdepositional processes in the magnetization of sediments. Rev. Geophys. Space Phys. 15, 129–143. doi: 10.1029/RG015i002p00129
Keywords: sedimentary rocks, compaction, magnetic anisotropy, magnetite, inclination shallowing, South China Sea
Citation: Li Y-X, Wang S, Fu S and Jiao W (2014) Recognizing the threshold magnetic anisotropy for inclination shallowing: implications for correcting inclination errors of sedimentary rocks. Front. Earth Sci. 2:8. doi: 10.3389/feart.2014.00008
Received: 17 February 2014; Accepted: 25 April 2014;
Published online: 16 May 2014.
Edited by:
Joshua M. Feinberg, University of Minnesota, USAReviewed by:
Dario Bilardello, University of Minnesota, USANicholas L. Swanson-Hysell, University of California, Berkeley, USA
Mike Jackson, University of Minnesota, USA
Copyright © 2014 Li, Wang, Fu and Jiao. This is an open-access article distributed under the terms of the Creative Commons Attribution License (CC BY). The use, distribution or reproduction in other forums is permitted, provided the original author(s) or licensor are credited and that the original publication in this journal is cited, in accordance with accepted academic practice. No use, distribution or reproduction is permitted which does not comply with these terms.
*Correspondence: Yong-Xiang Li, State Key Laboratory for Mineral Research Deposits, School of Earth Sciences and Engineering, Nanjing University, 163 Xianlin Avenue, Nanjing 210046, China e-mail: yxli@nju.edu.cn