The modulation of oceanic moisture transport by the hemispheric annular modes
 Raquel Nieto
 Rodrigo Castillo
 Anita Drumond
- Environmental Physics Laboratory, Departamento de Física Aplicada, Facultade de Ciencias, Universidade de Vigo, Ourense, Spain
Leaving aside the contribution made by recycling, it is the main oceanic moisture sources that are responsible for most of the precipitation that falls on the continents. The transport of moisture from these sources can be affected by large-scale variability according to the hemispheric annular modes. The influence of the two dominant modes of extratropical winter climate: the Northern and the Southern Annular Modes (NAM and SAM) are herein investigated to assess how they affect the transport of moisture from the major oceanic moisture sources. A Lagrangian model was used, together with ERA-Interim reanalysis data (1979–2012), and differences between the composites of the six strongest higher and lower events observed for both phases of the two modes for the period were analyzed. The method is able to reproduce the general pattern of known variations for both annular patterns. Lower values of the NAM Index are associated with the displacement of the storm track toward tropical latitudes. Thus, moisture transport is enhanced from the Northern Pacific toward the northeastern basin and from the Northern Atlantic and Mediterranean toward southern Europe. On the other hand, during higher values of NAM, moisture transport is favored from the Northern Pacific toward eastern Asia, and moisture transport is enhanced from the Northern Atlantic toward the Caribbean Sea. In the Southern Hemisphere, during higher values of SAM more moisture is transported from the Atlantic and Indian oceanic sources southwards and eastwards than during the opposite phase. In this SAM phase it is also noted by an enhancement of moisture transport from the Coral Sea and Southern Pacific sources toward the Indian Ocean/West Pacific Warm Pool. Southeastern South America received more moisture from the Pacific and Atlantic sources during years with a lower SAM, episodes which also favored the influx of moisture from the Southern Atlantic toward Africa, causing monsoon conditions to occur.
Introduction
The characterization of the hydrological cycle has become one of the main topics of debate for the climate community in recent years. Knowledge of transport of moisture may be considered one of the grand challenges of atmospheric science (Gimeno, 2013) given that this branch of the hydrological cycle is essential to the global climate. In recent years, many studies have characterized the sources of moisture for climatological areas of interest (e.g., the Sahel, Nieto et al., 2006), the Monsoon System in South America (Drumond et al., 2008), Central America (Durán-Quesada et al., 2010), the areas over Antarctic ice-cores (Sodemann and Stohl, 2009; Nieto et al., 2010), the Ethiopian highlands (Viste and Sorteberg, 2013), and the Indian Peninsula (Ordóñez et al., 2012); or else they have assessed sources of moisture at a global scale (e.g., Stohl and James, 2005; Dirmeyer and Brubaker, 2007; Gimeno et al., 2010; Knippertz et al., 2013). Many of these studies have used Lagrangian models to detect sources of moisture, and we use this approach here. This sophisticated method is highly powerful, having the remarkable ability to evaluate net changes in specific humidity along defined trajectories in order to identify the points at which the atmosphere gains or loses moisture.
The general pattern of moisture transport from a climatological perspective was characterized by Gimeno et al. (2010) and updated by Castillo et al. (2014). These authors found 12 main oceanic evaporative sources, and showed that the supply of moisture to the continents is highly asymmetric, with strong seasonal variability. However, to date no studies have been undertaken of the variability of the contribution of the oceanic moisture sources due to the major teleconnection modes. On interannual to multidecadal timescales, atmospheric moisture transport must be strongly modulated by large-scale climate modes due to associated changes in atmospheric circulation, sea surface temperature, air temperature and precipitation (Rogers et al., 2001). The Northern Annular Mode (NAM) and the Southern Annular Mode (SAM) are the two dominant modes for the extratropical winter climate (Thompson and Wallace, 2000; Thompson et al., 2000), and their influence on the main oceanic moisture sources and associated precipitation is therefore a key objective in our understanding of the present-day atmospheric water cycle. In literature, as far as we know, there are no works which analyse the moisture source-receptor relationship under the influence of the Annular Modes using a Lagrangian approach. We can find a few studies that estimate the source regions of evaporation supplying precipitation during the extreme phases of the North Atlantic Oscillation (NAO), being the NAO the Atlantic fingerprint of NAM. As an example, Sodemann et al. (2008) analyzed the sources for Greenland during winter, and Gómez-Hernández et al. (2013) studied the variability moisture sources for the surrounding Mediterranean areas.
Both annular modes are characterized by north-south shifts in atmospheric mass between the middle and polar latitudes. They describe oscillations in the wind pattern between the latitude bands centered on latitudes ~55–60° and ~30–35°. By convention, when the Sea Level Pressure (SLP) shows anomalously lower (higher) values in the polar areas and the opposite anomalies are detected over the middle latitudes, the mode is said to be in a higher or positive (lower or negative) phase (Figure 1). Thus, high indices correspond to lower than average pressures over the polar regions, to more intense polar vortices and to stronger westerlies along the band centered on ~55–60° in the troposphere. For lower values of the indices, the reverse conditions apply. As described above, the modes may modify the atmospheric dynamics, and may therefore affect the respective hemispheric climate. Under high values of NAM Index, surface temperatures increase over northern Eurasia and North America, and sea-surface temperatures (SSTs) increase over the North Atlantic (Thompson and Wallace, 2000). An increase in precipitation may be also detected over the same areas due to the northerly movement of the storm track (Hurrell, 1995). Large anomalies associated with the distribution and extension of Arctic sea-ice are linked with high values of NAM Index (Deser and Teng, 2008; Ogi and Yamazaki, 2010). The mode also affects the modulation of the spatial distribution of the ozone in the lower stratosphere (Thompson and Wallace, 2001). In a similar way, the SAM modulates the climate in the southern hemisphere through modulations in Antarctic temperatures (Marshall et al., 2011) and the distribution of the sea-ice surrounding that continent (Parkinson and Cavalieri, 2012). Southern Ocean SSTs exhibit positive anomalies for high SAM indices (Thompson et al., 2000). Both modes can occur throughout the year, but the indices are generally highest during colder months (Baldwin and Dunkerton, 1999).
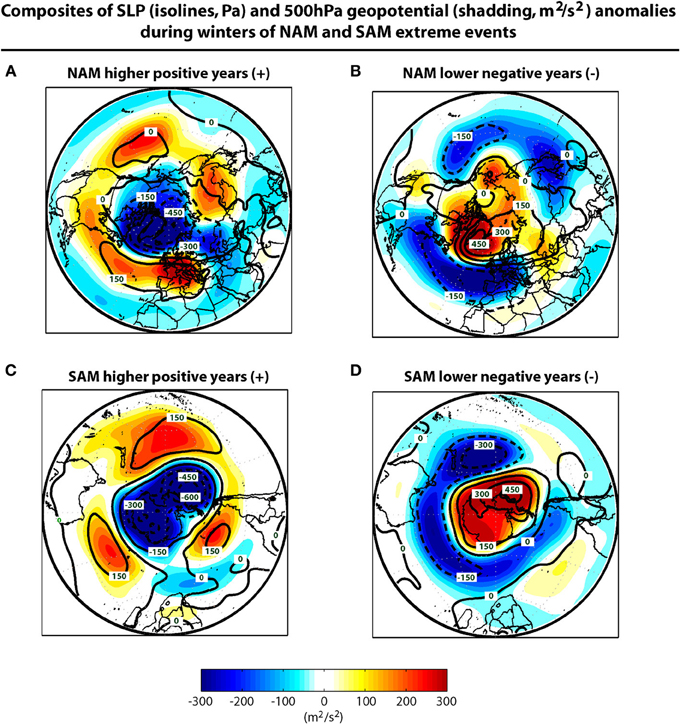
Figure 1. Composites of SLP (isolines, units Pa) and 500 hPa geopotential (shading, units m2 s−2) anomalies during the winters of the Northern and Southern Annular Modes events (see Table 1 for the years included in the composites). Top: NAM winters (November-April) of (A) high-index and (B) low-index values. Bottom: SAM winters (May–October) of (C) high-index and (D) low-index values. Positive or zero (negative) anomalies are shown in continuous (dotted) lines.
In light of the foregoing, we herein attempt to explain the modulation of moisture transport from the major oceanic moisture sources under the influence of the main hemispheric modes of climate variability using a Lagrangian methodology.
Data and Methods
In the present study, we applied a Lagrangian moisture source diagnostic scheme to examine the influence of NAM and SAM on the variability of the uptake and transport of moisture from the major oceanic sources. Figure 2 shows the moisture source regions identified following the criteria of Gimeno et al. (2010) but now considering a longer period of 33 years (from November 1979 to October 2012) and the ERA-Interim Reanalysis data set (Dee et al., 2011) on a regular 1 × 1° horizontal grid and with 61 vertical levels (from the surface to 0.1 hPa). ERA-Interim reproduces the hydrological cycle in a more realistic way than previous ERA reanalysis versions (Trenberth et al., 2011). We do not use data from the years prior to 1979 because the results of the reanalysis are of insufficient quality (especially over the oceans) to run the FLEXPART model before the inclusion of satellite data (Bengtsson et al., 2004). Ten oceanic moisture source regions were directly identified by the method, namely: NATL, North Atlantic; SATL, South Atlantic; MEXCAR, Mexico Caribbean; NPAC, North Pacific; SPAC, South Pacific; IND, Indian Ocean; ARAB, Arabian Sea; ZAN, Zanzibar Current; AGU, Agulhas Current; and CORALS, Coral Sea. The Mediterranean Sea (MED) and Red Sea (REDS) sources were defined using the physical boundaries of their oceanic basins.
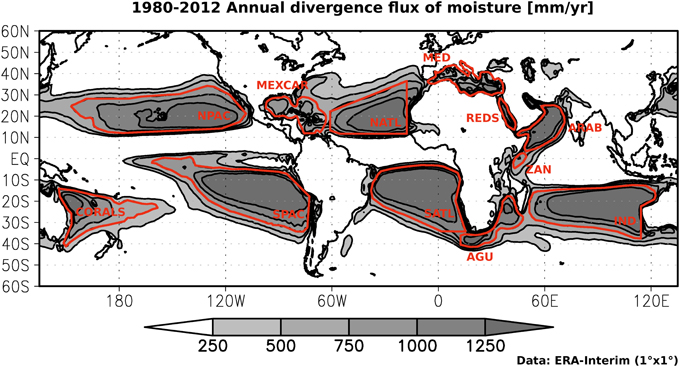
Figure 2. Main oceanic sources of moisture: Climatological annual vertically integrated moisture flux divergence (mm/year) for the period 1980–2012 using data from ERA-Interim. The red lines indicate the threshold of 750 mm/year of the annual vertically integrated moisture flux that defines the oceanic moisture sources in Gimeno et al. (2010). Following this criteria 10 sources were defined: North Pacific (NPAC), South Pacific (SPAC), North Atlantic (NATL), South Atlantic (SATL), Mexico Caribbean (MEXCAR), Arabian Sea (ARAB), Zanzibar Current (ZAN), Agulhas Current (AGU), Indian Ocean (IND), and Coral Sea (CORALS). Two further sources were defined using their physical boundaries: the Mediterranean (MED) and the Red (REDS) Seas. A schematic representation of these 12 oceanic moisture sources is shown above Figures 3–6.
The Lagrangian method is today considered the most suitable method for the evaluation of the origin of the water that precipitates over a continental area (Gimeno et al., 2012). The advantages, disadvantages, uncertainties, limitations and significance of the methodology were discussed in a complete review by Gimeno et al. (2012). In addition, these authors provided a detailed comparison of all approaches establishing source-sink relationships for atmospheric water vapor available to the scientific community, such as the Eulerian technique using numerical water vapor tracers, “analytical and box models,” and “physical water vapor tracers” (isotopes).
Our Lagrangian approach makes use of the FLEXPART V9.0 particle dispersion model (Stohl and James, 2004, 2005) forced by ERA-Interim data. The methodology permits a description of air movement (in space and time) by individual trajectories of “air parcels” or “particles.” These “particles” are three-dimensional finite elements created via the homogeneous discretization of the atmosphere, and their trajectories are tracked following advection by three-dimensional wind fields in a regular 1 × 1° grid. Values of latitude, longitude and specific humidity are stored along each trajectory at 6-h intervals. Variations in moisture along each trajectory are obtained via changes in specific humidity (q) with time, which is proportional to the difference between the increase of the evaporation (e) and decrease of the precipitation (p) in moisture for the particle concerned, i.e., e-p = m dq/dt, where (m) is the mass of the particle. Considering an atmospheric column over a given area, the net difference between evaporation (E) and precipitation (P) is the result of adding together (e-p) for all particles. To derive this, we integrated the (E-P) column values over each 1 × 1° global grid considering only those particles that leave the moisture source of interest. From the analysis of (E-P) we can identify whether the atmosphere in a region received (E-P > 0) or lost (E-P < 0) moisture.
In order to simulate the transport of the air masses, a global data set of approximately 2.0 million “particles” was created using FLEXPART. These particles were moved by wind for a time period limited to 10 days, which represents the average residence time of water vapor in the atmosphere (Numaguti, 1999). (E-P) values integrated along these10-day forward trajectories were analyzed in order to investigate the main moisture sinks observed along trajectories starting in each of the 12 evaporative sources considered. The positions and the changes in (q) were recorded at intervals of 6 h (00, 06, 12, and 18 UTC).
The influence of NAM and SAM on the transport of moisture from the oceanic sources was explored using composites. We obtained composite differences of moisture transport between the positive and negative phases of each mode of variability. The events were selected based on the monthly NAM and SAM Indices (NAMI and SAMI). NAM and SAM are more active during their respective hemispheric winters (from December to February for NAM and from June to August for SAM), and we therefore chose the corresponding semi-annual period, i.e., from November to April for NAM and from May to October for SAM. The most common methods used to identify extreme events of SAM and NAM are those that (1) formulate the first principal components (PC) of some meteorological variable over the extratropics (e.g., geopotential height, mean SLP, wind, temperature) (Thompson and Wallace, 2000; Nan and Li, 2003), (2) calculate the difference between normalized zonal mean pressure between two latitudes using reanalysis data (Gong and Wang, 1999; Li and Wang, 2003) or between two selected points (Hurrell, 1995), (3) are based on data obtained from observational stations (Marshall, 2003; Visbeck, 2009). The literature reveals that there are some inconsistencies regarding the identification of the extreme episodes of both modes, particularly for SAM, and primarily arising due to the different methodologies and data sets applied in the definition of the indices (Ho et al., 2012). For the SAM index, but also applying to NAM, Ho et al. (2012) showed that those indices calculated using reanalysis data are more effective where there is some attempt to understand the relationship with their impacts. However, prior to the assimilation of satellite data (pre-1979) the reanalysis-based indices are likely to be flawed, and it is better to choose those that are station-based. With this in mind, for each mode we considered two indices based on different methods using normalized monthly SLP data: one station-based and other reanalysis-based; the respective semi-annual averages are shown in Table 1 (in red for lower values of the indices and in blue for the higher ones). The station-based NAMI was the available on https://climatedataguide.ucar.edu/sites/default/files/climate_index_files/nao_station_monthly.txt obtained from SLP differences between Lisbon (Portugal) and Stykkisholmur/Reykjavik (Iceland) (Hurrell, 1995; Hurrell and National Center for Atmospheric Research Staff, 2013), while the SAMI was obtained from Marshall (2003) on http://www.nerc-bas.ac.uk/icd/gjma/sam.html, who produced a similar SAM index based on 12 appropriately located station-based observations. Those that use reanalysis data (NCEP/NCAR; Kalnay et al., 1996) can be found at http://ljp.lasg.ac.cn/dct/page/65544. The NAMI is defined as the difference in the normalized monthly zonal-mean SLP between 35 and 65°N, and the SAMI is taken to be the same difference between 40 and 70°S (Li and Wang, 2003; Nan and Li, 2003, respectively). Our composites consider the six highest intensity episodes for both phases of each mode for the period 1979–2012; where there are discrepancies between the two indices we select the year with the higher (or lower) value using reanalysis data. Thus for the NAM Index the positive high values occurred in 1989, 1990, 1993, 2000, 2007, and 2012; and the negative high values occurred in 1981, 1986, 1996, 2006, 2010, and 2011 (the year shown here refers to the January of the interval). For the SAMI the positive high values occurred in 1989, 1993, 1998, 2008, 2010, and 2012, and the negative high values occurred in 1980, 1981, 1988, 1992, 1994, and 2002. To test the statistical significance of the composite, we used the bootstrap method proposed by Wei et al. (2012). We obtained the differences for two 6-year period random samples (a total of 12 years) 1000 times from the 33-yr climatology. The absolute value of the difference composite was considered significant if it was greater than 90% of the 1000 iterations.
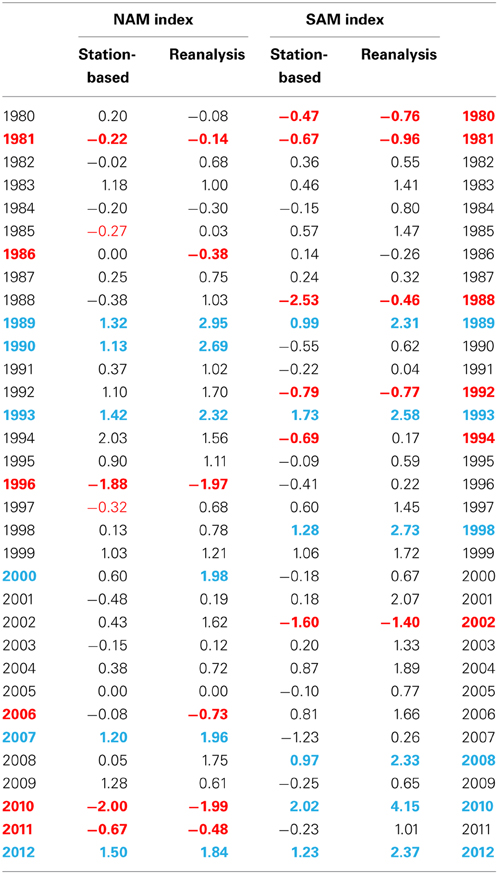
Table 1. Semiannual periods considered for the composites of both phases of NAM and SAM from 1979 to 2012; in red for lower values of the indices and in blue for the higher values.
Monthly composite differences in the precipitation and in the divergence of the vertically integrated flux of moisture (Θ) between opposite phases of the modes were also obtained. We used data obtained from the Global Precipitation Climatology Project (GPCP; Adler et al., 2003; Huffman et al., 2009), and from ERA-Interim, respectively; both datasets were estimated over the entire globe for the 33-year period.
Results
We studied the fingerprint of NAM and SAM in the moisture transport from the main oceanic sources of moisture in order to assess their impact. It must be remembered that the boundaries of each oceanic source were defined as stationary throughout the 33-year period considered (Figure 2). The composites of the 6 years associated with the extreme phases of each mode were evaluated month by month during the corresponding winter season. The resulting maps are shown in Figures 3, 4, for NAM and SAM respectively, where the monthly variability of the favored sink regions is summarized. Figure 3 shows the contribution of those oceanic sources of moisture located in the Northern hemisphere (NPAC, MEXCAR, NATL, MED, REDS, and ARAB), and Figure 4 shows the same for the Southern hemisphere (SPAC, SATL, ZAN, AGU, IND, and CORALS). The two figures only show contors with average values of (E-P) integrated over the 10 days of transport larger than of −0.05 mm/day. It must be stressed that we included in these figures only those sources of moisture in the same hemisphere as the variability mode concerned. From a simple visual inspection, and focusing on one source of moisture as an example, the NATL (Figure 3) provides moisture over larger areas of Eurasia during lower values of NAM Index (Hurrell et al., 2013), and the method is able to detect the known absence of precipitation during higher NAM over the Iberian Peninsula during early spring (Paredes et al., 2006), although in general it is not possible to extract detailed information on the differences between the two phases of the modes from these patterns. The differences between the composites of the two phases for both modes may help explain the significant changes in moisture transport, however.
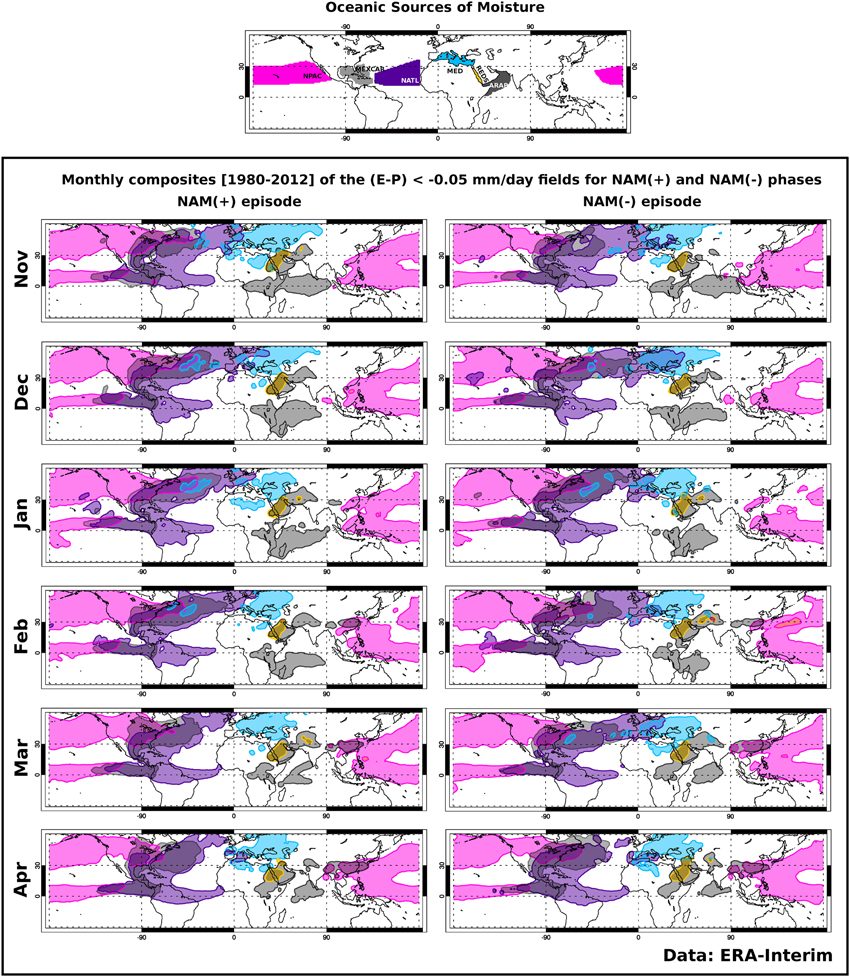
Figure 3. Monthly composites of moisture sink areas detected for the NAM for the semi-annual winter period 1980–2012. The sink areas are shown in the same color as the corresponding oceanic source regions (top panel, schematic representation of Figure 2). Only negative values of E-P, calculated by forward tracking from the defined moisture sources, larger than −0.05 mm d−1, are plotted for (left) higher values of NAM Index and (right) lower values of NAM Index.
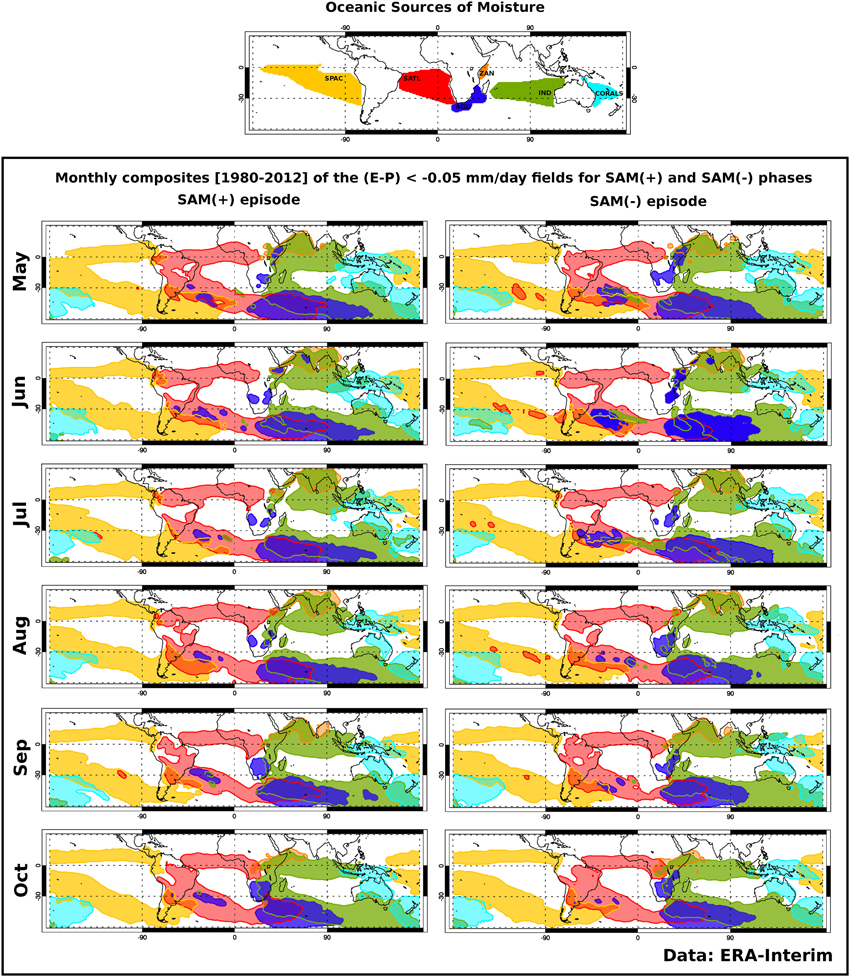
Figure 4. As Figure 3, for SAM.
The monthly differences in the influence of the oceanic moisture sources on the sink areas throughout the NAM and SAM cycles are summarized in Figures 5, 6, respectively. These two figures show the differences between the composites of the two mode phases in terms of the precipitation (left-hand column) and the divergence of the vertically integrated moisture transport (2nd column). The favored sink areas observed during the higher and lower phases of the mode are shown in the 3rd and right-hand columns, respectively. In the panels showing precipitation and the favored sink regions, we show only those areas where the differences are significant at the 90% confidence level using a bootstrap test.
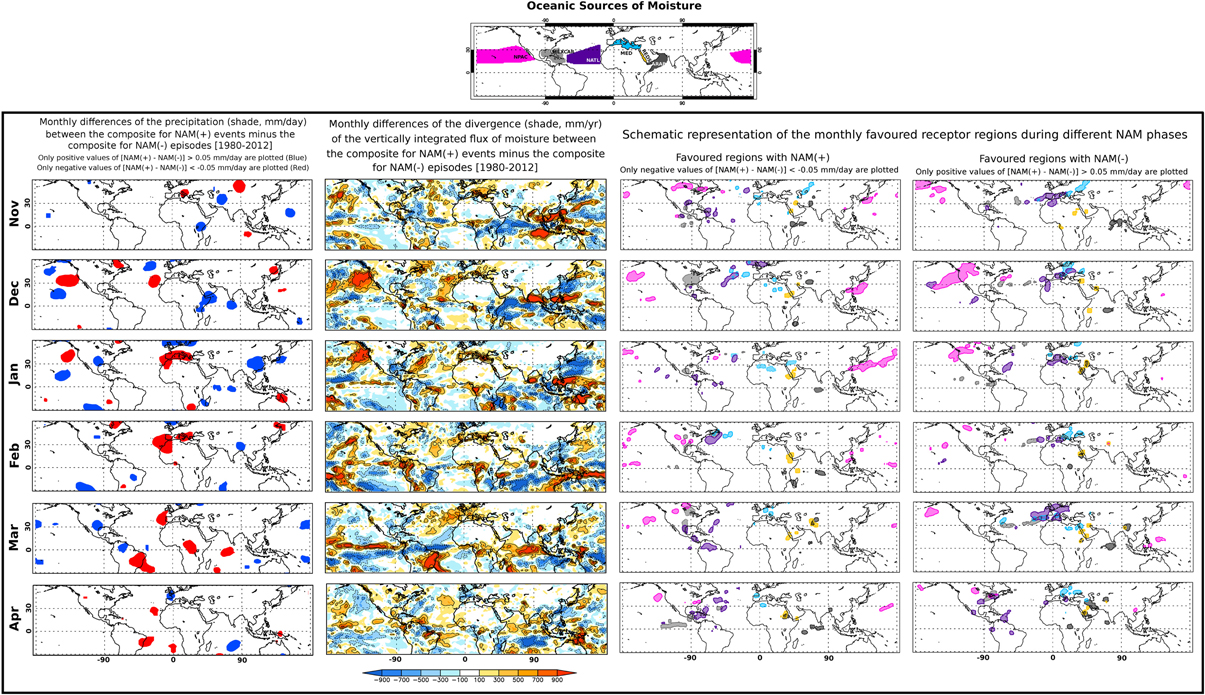
Figure 5. Monthly influence of the evolution of the NAM during November to April (boreal winter) over the moisture transport of the main oceanic sources of precipitation for 1980–2012. Top: Schematic representation of the main oceanic sources of moisture. Bottom, left-hand column: Monthly differences in precipitation (in mm/day, data from GPCP) between the composites for years with higher and lower values of NAMI. Bottom, 2nd column: Monthly differences in divergence of the vertically integrated moisture flux (in mm/year, data from ERA-Interim) between the composites for the years with higher (bluish colors) and lower (reddish colors) values of NAMI. Bottom, 3rd and right-hand columns: The composite differences in E-P generated by each moisture source between higher and lower NAMI values. 3rd column: Schematic representation of the favored receptor regions of precipitation during the higher NAMI; Right-hand column: during lower NAMI. Following a bootstrap test, only those areas where the absolute value of differences greater than 0.05 mm/day significant at the 90% confidence level are plotted.
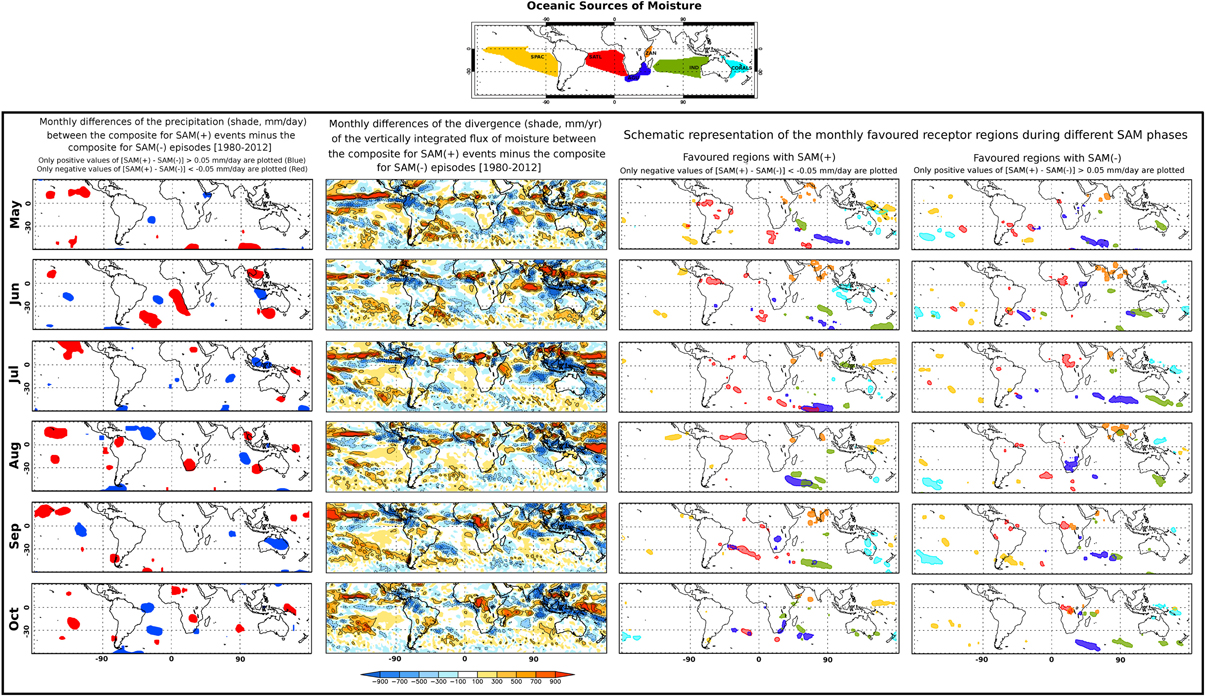
Figure 6. As Figure 5, for SAM.
The blueish (reddish) areas in the variations of vertically integrated moisture transport observed for NAM or SAM (2nd column of Figures 5, 6) show where the transport is favored during higher (lower) values of the mode. In general, the favored regions of moisture transport coincide with the favored sink areas indicated in the 3rd (right-hand) column, and with enhanced precipitation (the left-hand columns show the monthly differences in the composites of precipitation).
A detailed analysis of Figures 5, 6 could point to the areas where the transport of moisture from the sources investigated is enhanced during the different phases of the modes. An increase in moisture does not imply in a direct response in terms of precipitation, because it also depends on the existence of other dynamical precursors (e.g., instability, local convergence, etc.), but the method does allow us to analyse the preferred sinks.
In the case of the NAM (Figure 5), for lower values of NAMI (right-hand column), enhanced convergence of Θ (red contors) and increased precipitation (red areas in the left-hand column) were observed over the northeastern Atlantic Ocean, the Mediterranean Sea areas, and over western and southern Europe. The pattern suffers a northward displacement during April, the last winter month analyzed. As a whole this area receives an enhanced moisture contribution from the NATL and MED sources. Increased moisture transport from NPAC was verified over the western North American region together with enhanced transport of Θ in the eastern Northern Pacific Ocean, especially during the first months.
During periods of higher values of NAMI (Figure 5, 3rd column) enhanced transport of Θ (blue contors in the 2nd column) was observed over the western North Pacific Ocean, associated with an enhanced moisture contribution from the NPAC source over the Asian coast, preferentially during early winter. Transport of Θ was also enhanced over the inland parts of the North American continent, a region receiving a higher moisture contribution from the NPAC, MEXCAR, and NATL sources. The MEXCAR shows a greater influence over the mid-east part of North America during December. Other regions that showed an intensification of the transport of Θ are Central America with higher contributions from NATL and MEXCAR, and northern South America, with an enhanced contribution from NATL during March.
The REDS and ARAB sources of moisture show no discernible pattern of behavior between the two phases of NAM.
For lower values of SAMI (Figure 6, right-hand column), the transport of moisture was enhanced toward central Africa, with increased contributions mainly from the SATL. Over the same continent, albeit to a lesser extent, the east coast receives intensified moisture transport from AGU and IND during some months. The higher transport of moisture from AGU to southern Africa during August is remarkable. Southeastern South America and the adjacent extratropical Atlantic region receive more moisture from the SATL, AGU and SPAC sources, and southern Australia and the neighboring oceans receive moisture from the IND source.
In respect of the higher values of the SAM Index (Figure 6, 3rd column), an enhanced transport of Θ was detected from the Indian Ocean/West Pacific Warm Pool toward northern Australia (blue contors in the 2nd column). This region received a higher moisture contribution from the IND, CORALS, and SPAC sources. The CORALS source has its major influence during September over Eastern Australia and the adjacent ocean, when the other sources show no significant contribution. During the early austral winter, the northern part of South America and the Atlantic ITCZ receive enhanced transport of Θ with a contribution from the SATL source. Around the middle to the end of the austral winter, an enhancement of moisture transport from the SATL and AGU sources reaches the southwestern tropical Atlantic Ocean, while increased transport from the AGU and IND sources reaches southern Africa and the southwestern Indian Ocean.
The ZAN source of moisture contributes to the Indian region either during higher or lower values of SAM Index (Figure 6, 3rd and right-hand columns), showing that the transport is due to other reasons not attributable to this mode.
It must be stressed that the oceanic moisture sources used to characterize the role played by the annular modes in the transport of moisture were defined as stationary (Figure 2) following the definition of Gimeno et al. (2010), based on their annual mean values. As previously discussed, the attributes of the sources may vary in intensity and/or size along the year, besides probably having some interannual variability. The areal mean divergence of the vertically integrated moisture flux over each oceanic source considered could therefore be an alternative means of comparing the possible impact of the two phases of NAM and SAM on the intensity of the sources. We calculated the monthly climatological values for each source defined as their annual mean value and we also composited the divergence of the vertically integrated moisture flux of both phases of each annular mode. In attempting to find some linear variability in the results it would appear that there is an intensification (weakening) of the MED and NATL sources during the higher (lower) NAM episodes considered as compared with annual climatology. For the MED source the values of the higher NAM episodes from November to March exceed the average annual ones by between 116 and 157%, and for the lower NAM episodes the equivalent figure is between 31 and 93% lower than for average annual values for the winter, reaching the lowest during February. The other source that shows any appreciable difference is the NATL, but the signal is weaker: around 104% for higher NAM episodes and between 70 and 98% for lower values of the index (the minimum occurs in December). For the SAM the results do not indicate any linear joint variability of the index and the divergence of the moisture transport for the sources considered.
Another means of finding possible differences between the two phases of the modes would be to try to identify modifications in the areal extents or positions of the sources. We therefore redefined all the oceanic sources of moisture using the composites of the highest and lowest years of both modes of variability. It is important to stress that in this case the composites were only evaluated for the winter months. Comparing these values with those for the whole semiannual period (1979–2012) showed that the sources maintained their positions and sizes (plot not shown).
Concluding Remarks and Discussion
We have herein investigated the impact of the Northern and Southern hemisphere annular modes on the moisture transport from the major oceanic moisture sources during winter using the Lagrangian FLEXPART dataset fed by ERA-Interim Reanalysis data. We calculated differences between the composites of the divergence of vertically integrated moisture transport, of the precipitation, and of the favored sink regions characterizing the six strongest events selected for both phases of the two modes during the period 1979–2012.
As a summary of the detailed analysis of income in the previous paragraphs, for the NAM mode it must be expected that the impacts of the extreme episodes in moisture transport mainly occur over the sources placed over the Atlantic and Pacific oceanic regions, due that the main centers of action of the mode in the middle latitudes are located over the Atlantic and Pacific subtropical high pressure systems. Although we have considered the sources to be stationary throughout the experiment, we must also consider possible changes in location and/or intensity of the areas of divergence of Θ. In respect of the NPAC source in the northern Pacific Ocean, it is interesting to note the enhanced moisture transport toward the northeastern basin for the lower values of NAM Index associated with the weakening of the Pacific high pressure center and weak westerlies over the polar latitudes. Under these conditions, the storm tracks tends toward tropical latitudes affecting the northwestern part of North America (Wang et al., 2006). On the other hand, for higher values of the NAM Index the Pacific high pressure center is expected to intensify, and moisture transport from NPAC is favored toward eastern Asia. The East Asian Monsoon characterizes the major moisture pattern for the region, but although the East Asian Monsoon is not favored during winter there nevertheless exists a significant interaction with the Siberian High, which is modulated in its intensity by the NAM. So, the NAM plays an important role in the changes of the Siberian High, via a positive correlation in which a lower NAMI is related to a lower intensity of the Siberian High. This fact favors the influx of moisture from the ocean (Gong et al., 2001).
Over the North Atlantic Ocean the years with lower values of NAMI are characterized by lower than normal atmospheric pressures and weak westerlies over northern Europe. Enhanced moisture transport from the NATL, MEXCAR, and MED sources toward southern Europe and the Mediterranean basin therefore occurs; while the reverse applies for a high NAM index, when the transport is northwards over Europe (Dickson et al., 2000) and when droughts can occur over the southern part of the continent (Vicente-Serrano et al., 2011). Nevertheless, the intensification of the Atlantic high pressure center during higher NAM years, and the associated easterly trade winds at its southern flank, occur with enhanced moisture transport from the NATL and MEXCAR sources toward the Caribbean Sea. The flow is thus intensified forming the Caribbean Low Level Jet (CLLJ) that splits into two branches, one following its way westwards across Central America, and the other turning northwards to North America crossing the Gulf of Mexico. This result accords with the variability of the CLLJ (Wang, 2007; Amador, 2008) and the characteristics of the moisture transport patterns over the area (Durán-Quesada et al., 2010). A higher (lower) NAM is therefore associated with a reinforcing (weakening) of transport from NATL and MEXCAR to Central and North America throughout the CLLJ. The intensification or weakening of the Atlantic High pressure system could be also related to the interannual variability found for the MED and NATL sources when the vertically integrated moisture divergence was analyzed.
In the Southern Hemisphere, the position and intensity of the semipermanent high pressures also define the circulation, and the influence of both phases of SAM over them defines the advection of moisture from the sources to the sinks. In this context, during higher values of SAM (Marshall et al., 2012), with high-pressure systems stronger than the normal, the belt of westerlies and the trade winds intensify, and the ITCZ is positioned to the north, the pattern found for the transport of moisture is, in general, as described. The moisture was transported southwards and eastwards from the AGU, IND, and SATL sources more than during the positive phase of SAM. Thus, in the Indian Ocean a horizontal band of precipitation over the southern basin appears with moisture that originates from the AGU source, and little areas from IND behave in the same way.
This ties in with the poleward shifts in synoptic weather systems (Thompson and Wallace, 2000), which affects southwest Australia (Cai et al., 2011) and the southwestern coast of South Africa (Reason and Rouault, 2005), bringing negative anomalies in precipitation to these areas. It is well known that over Australia the positive phases of SAM bring anomalously wet conditions in spring and summer (Gillett et al., 2006). The pattern shown here represents quite well the wet conditions of the early austral spring (Min et al., 2013), when an enhanced uptake of moisture occurs from CORALS. The higher values for the SAM mode were also characterized by an enhanced transport of Θ over the Indian Ocean/West Pacific Warm Pool, with the area receiving a higher moisture contribution from the CORALS and SPAC sources. The higher pressures configured around Australia move the moisture northwards from CORALS, and then the trade winds advect it westwards, with more intensity during higher SAM events (intense values of divergence of the vertically integrated flux of moisture, blue colors in the 2nd column of Figure 5). The intensified trade winds bring moisture toward the region from the SPAC, which disappears for lower values of SAM Index when the trade winds are less intense.
Over the South Atlantic Ocean the intensified high pressure maintains the flow of moisture both to the Southern Atlantic Convergence Zone (SACZ) and to the ITCZ from the SATL source. It can be seen that during the early months the intensified trade winds introduce moisture to the inland parts of the continent (this signal is also recognizable in the Pacific, but only over the islands) and the SACZ receives more moisture during the later months. The results indicate that southeastern South America received more moisture from the SATL, AGU, and SPAC sources during the lower SAM Index years. These results agree with the finding that for lower values of SAMI the cyclone trajectories move northwards and South America suffers from intense frontogenetic activity associated with positive anomalies of precipitation over the southeastern part of the continent (Reboita et al., 2009). The weakness of the westerlies and trade winds for lower values of SAM Index favors the influx of moisture from SATL during the monsoon in Africa. The enhanced transport of moisture over southern Africa from AGU during August accords with the anomalous flux detected by Reason and Rouault (2005), in their analysis of the wettest winters for negative SAM phases.
Because the centers of activity of NAM lie principally over the larger basin oceans and around mid- and higher latitudes in the northern hemisphere, the REDS and ARAB sources seem relatively unaffected by the different phases of the mode. The variation of ZAN with SAM does not seem relevant, perhaps due the fact that it is positioned on the equator. These regions are more influenced by the evolution of the El Niño-Southern Oscillation as described by Castillo et al. (2014), who found that during winter El Niño events, the ZAN and ARAB sources increase their moisture contribution in the western Indian Ocean. Additionally, these sources are crossed by the Somali Jet, which is the main supply of moisture during the Indian Summer Monsoon, and is strongly modulated by the Madden-Julian Oscillation (Ordóñez et al., 2013).
An understanding of variability such as that described here provides scientists with information on the general configuration of climate around the globe. In light of our results we note that the modulation of both hemispheric annular modes is in good accordance with the expected circulation patterns and with findings made in previous studies. Analyzing the relationship between the major hemispheric modes of variability and the transport of moisture from their main oceanic sources will help to produce a map showing how precipitation could change under future climate change scenarios. The Annular Modes have shown a steady positive trend over recent decades (Miller et al., 2006), and if this trend continues the results presented here could help to identify those geographical areas most affected by climate change, and help politicians and economists plan future water resource strategies.
Conflict of Interest Statement
The authors declare that the research was conducted in the absence of any commercial or financial relationships that could be construed as a potential conflict of interest.
Acknowledgment
The authors gratefully acknowledge the support of the Spanish Government through their funding of the TRAMO (“TRAnsport of MOisture”) project, which is also cofunded by FEDER (in spanish European regional development fund- ERDF).
References
Adler, R. F., Huffman, G. J., Chang, A., Ferraro, R., Xie, P., Janowiak, J., et al. (2003). The Version 2 Global Precipitation Climatology Project (GPCP) monthly precipitation analysis (1979-Present). J. Hydrometeor. 4, 1147–1167. doi: 10.1175/1525-7541(2003)004%3C1147:TVGPCP%3E2.0.CO;2
Amador, J. A. (2008). The intra-americas sea low-level jet. Ann. N.Y. Acad. Sci. 1146, 153–188. doi: 10.1196/annals.1446.012
Baldwin, M. P., and Dunkerton, T. J. (1999). Propagation of the arctic oscillation from the stratosphere to the troposphere. J. Geophys. Res. 104, 30937–30946. doi: 10.1029/1999JD900445
Bengtsson, L., Hagemann, S., and Hodges, K. I. (2004). Can climate trends be calculated from reanalysis data? J. Geophys. Res. 109, D11111. doi: 10.1029/2004JD004536
Cai, W., van Rensch, P., Borlace, S., and Cowan, T. (2011). Does the Southern Annular Mode contribute to the persistence of the multidecade-long drought over southwest Western Australia? Geophys. Res. Lett. 38:L14712. doi: 10.1029/2011GL047943
Castillo, R., Nieto, R., Drumond, A., and Gimeno, L. (2014). The role of the ENSO cycle in the modulation of moisture transport from major oceanic moisture sources. Water Resour. Res. 50, 1046–1058. doi: 10.1002/2013WR013900
Dee, D. P., Uppala, S. M., Simmons, A. J., Berrisford, P., Poli, P., Kobayashi, S., et al. (2011). The ERA-Interim reanalysis: configuration and performance of the data assimilation system. Q. J. R. Meteorol. Soc. 137, 553–597. doi: 10.1002/qj.828
Deser, C., and Teng, H. (2008). Evolution of Arctic sea ice concentration trends and the role of atmospheric circulation forcing, 1979–2007. Geophys. Res. Lett. 35, L02504. doi: 10.1029/2007GL032023
Dickson, R. R., Osborn, T. J., Hurrell, J. W., Meincke, J., Blindheim, J., Adlandsvik, B., et al. (2000). The Arctic Ocean response to the North Atlantic Oscillation. J. Clim. 13, 2671–2696. doi: 10.1175/1520-0442(2000)013<2671:TAORTT>2.0.CO;2
Dirmeyer, P. A., and Brubaker, K. L. (2007). Characterization of the global hydrologic cycle from a back-trajectory analysis of atmospheric water vapor. J. Hydrometeorol. 8, 20–37. doi: 10.1175/JHM557.1
Drumond, A., Nieto, R., Gimeno, L., and Ambrizzi, T. (2008). A Lagrangian identification of major sources of moisture over Central Brazil and La Plata Basin. J. Geophys. Res. 113, D14128. doi: 10.1029/2007JD009547
Durán-Quesada, A. M., Gimeno, L., Amador, J. A., and Nieto, R. (2010). Moisture sources for Central America: identification of moisture sources using a Lagrangian analysis technique. J. Geophys. Res. 115, D05103. doi: 10.1029/2009JD012455
Gillett, N. P., Kell, T. D., and Jones, P. D. (2006). Regional climate impacts of the Southern Annular Mode. Geophys. Res. Lett. 33, L23704. doi: 10.1029/2006GL027721
Gimeno, L. (2013). Grand challenges in atmospheric science. Front. Earth Sci. 1:1. doi: 10.3389/feart.2013.00001
Gimeno, L., Drumond, A., Nieto, R., Trigo, R. M., and Stohl, A. (2010). On the origin of continental precipitation. Geophys. Res. Lett. 37, L13804, doi: 10.1029/2010GL043712
Gimeno, L., Stohl, A., Trigo, R. M., Dominguez, F., Yoshimura, K., Yu, L., et al. (2012). Oceanic and terrestrial sources of continental precipitation. Rev. Geophys. 50, RG4003. doi: 10.1029/2012RG000389
Gómez-Hernández, M., Drumond, A., Gimeno, L., and Garcia-Herrera, R. (2013). Variability of moisture sources in the Mediterranean region during the period 1980-2000. Water Resour. Res. 49, 6781–6794. doi: 10.1002/wrcr.20538
Gong, D., and Wang, S. (1999). Definition of Antarctic oscillation index. Geophys. Res. Lett. 26, 459–462. doi: 10.1029/1999GL900003
Gong, D., Wang, S., and Zhu, J. H. (2001). East Asian winter monsoon and Arctic Oscillation. Geophys. Res. Lett. 28, 2073–2076. doi: 10.1029/2000GL012311
Ho, M., Kiem, A. S., and Verdon-Kidd, D. C. (2012). The Southern Annular Mode: a comparison of indices. Hydrol. Earth Syst. Sci. 16, 967–982. doi: 10.5194/hess-16-967-2012
Huffman, G. J, Adler, R. F., Bolvin, D. T., and Gu, G. (2009). Improving the global precipitation record: GPCP version 2.1. Geophys. Res. Lett. 36, L17808. doi: 10.1029/2009GL040000
Hurrell, J. W. (1995). Decadal trends in the North Atlantic oscillation: regional temperatures and precipitation. Science 269, 676–679. doi: 10.1126/science.269.5224.676
Hurrell, J. W. National Center for Atmospheric Research Staff. (eds.). (2013). The Climate Data Guide: Hurrell North Atlantic Oscillation (NAO) Index (Station-Based). Available online at: https://climatedataguide.ucar.edu/climate-data/hurrell-north-atlantic-oscillation-nao-index-station-based
Hurrell, J. W., Kushnir, Y., Ottersen, G., and Visbeck, M. (2013). The North Atlantic Oscillation: Climatic Significance and Environmental Impact. Vol. 134. Washington, DC: American Geophysical Union.
Kalnay, E., Kanamitsu, M., Kistler, R., Collins, W., Deaven, D., Gandin, L., et al. (1996). The NCEP/NCAR 40-year reanalysis project. Bull. Am. Meteorol. Soc. 77, 437–470. doi: 10.1175/1520-0477(1996)077<0437:TNYRP>2.0.CO;2
Knippertz, P., Wernli, H., and Gläser, G. (2013). A global climatology of tropical moisture. J. Clim. 26, 3031–3045. doi: 10.1175/JCLI-D-12-00401.1
Li, J. P., and Wang, J. X. L. (2003). A modified zonal index and its physical sense. Geophys. Res. Lett. 30, 1632. doi: 10.1029/2003GL017441
Marshall, A. G., Hudson, D., Wheeler, M. C., Hendon, H. H., and Alves, O. (2012). Simulation and prediction of the Southern Annular Mode and its influence on Australian intra-seasonal climate in POAMA. Clim. Dyn. 38, 2483–2502. doi: 10.1007/s00382-011-1140-z
Marshall, G. J. (2003). Trends in the Southern Annular Mode from observations and reanalyses. J. Climate 16, 4134–4143. doi: 10.1175/1520-0442(2003)016<4134:TITSAM>2.0.CO;2
Marshall, G. J., Di Battista, S., Naik, S. S., and Thamban, M. (2011). Analysis of a regional change in the sign of the SAM-temperature relationship in Antarctica. Clim. Dyn. 36, 277–287. doi: 10.1007/s00382-009-0682-9
Miller, R. L., Schmidt, G. A., and Shindell, D. T. (2006). Forced annular variations in the 20th century IPCC AR4 simulations. J. Geophys. Res. 111, D18101. doi: 10.1029/2005JD0
Min, S. K., Cai, W., and Whetton, P. (2013). Influence of climate variability on seasonal extremes over Australia. J. Geophys. Res. Atmos. 118, 643–654. doi: 10.1002/jgrd.50164
Nan, S., and Li, J. (2003). The relationship between the summer precipitation in the Yangtze River valley and the boreal spring Southern Hemisphere annular mode. Geophys. Res. Lett. 30, 2266. doi: 10.1029/2003GL018381
Nieto, R., Durán-Quesada, A. M., and Gimeno, L. (2010). Major sources of moisture over Antarctic ice-core sites identified through a Lagrangian approach. Clim. Res. 41, 45–49. doi: 10.3354/cr00842
Nieto, R., Gimeno, L., and Trigo, R. M. (2006). A Lagrangian identification of major sources of Sahel moisture. Geophys. Res. Lett. 33, L18707. doi: 10.1029/2006GL027232
Numaguti, A. (1999). Origin and recycling processes of precipitating water over the Eurasian continent: experiments using an atmospheric general circulation model. J. Geophys. Res. 104, 1957–1972. doi: 10.1029/1998JD200026
Ogi, M., and Yamazaki, K. (2010). Trends in the summer Northern Annular Mode and Arctic sea ice. SOLA 6, 41–44. doi: 10.2151/sola.2010-011
Ordóñez, P., Ribera, P., Gallego, D., and Peña-Ortiz, C. (2012). Major moisture sources for Western and Southern India and their role on synoptic-scale rainfall events. Hydrol. Process. 26, 3886–3895. doi: 10.1002/hyp.8455
Ordóñez, P., Ribera, P., Gallego, D., and Peña-Ortiz, C. (2013). Influence of Madden-Julian Oscillation on water budget transported by the Somali low-level jet and the associated Indian summer monsoon rainfall. Water Resour. Res. 49, 6474–6485. doi: 10.1002/wrcr.20515
Paredes, D., Trigo, R. M., Garcia-Herrera, R., and Trigo, I. F. (2006). Understanding precipitation changes in Iberia in early Spring: weather typing and storm-tracking approaches. J. Hydrometeorol. 7, 101–113. doi: 10.1175/JHM472.1
Parkinson, C. L., and Cavalieri, D. J. (2012). Antarctic sea ice variability and trends, 1979–2010. Cryosphere 6, 871–880. doi: 10.5194/tc-6-871-2012
Reason, C. J. C., and Rouault, M. (2005). Links between the Antarctic Oscillation and winter rainfall over western South Africa. Geophys. Res. Lett. 32, L07705. doi: 10.1029/2005GL022419
Reboita, M., Ambrizzi, T., and da Rocha, R. (2009). Relationship between the southern annular mode and southern hemisphere atmospheric systems. RBMET 24, 48–55. doi: 10.1590/S0102-77862009000100005
Rogers, A. N., Bromwich, D. H., Sinclair, E. N., and Cullather, R. I. (2001). The atmospheric hydrologic cycle over the Arctic basin from reanalyses. Part II: Interannual variability. J. Clim. 14, 2414–2429. doi: 10.1175/1520-0442(2001)014<2414:TAHCOT>2.0.CO;2
Sodemann, H., Schwierz, C., and Wernli, H. (2008). Interannual variability of Greenland winter precipitation sources: lagrangian moisture diagnostic and North Atlantic Oscillation influence. J. Geophys. Res. 113, D03107. doi: 10.1029/2007JD008503
Sodemann, H., and Stohl, A. (2009). Asymmetries in the moisture origin of Antarctic precipitation. Geophys. Res. Lett. 36, L22803. doi: 10.1029/2009GL040242
Stohl, A., and James, P. (2005). A Lagrangian analysis of the atmospheric branch of the global water cycle. Part II: Earth's river catchments, ocean basins, and moisture transports between them. J. Hydrometeorol. 6, 961–984. doi: 10.1175/JHM470.1
Stohl, A., and James, P. A. (2004). Lagrangian analysis of the atmospheric branch of the global water cycle. Part I: method description, validation, and demonstration for the August 2002 flooding in Central Europe. J. Hydrometeor 5, 656–678. doi: 10.1175/1525-7541(2004)005<0656:ALAOTA>2.0.CO;2
Thompson, D. W., and Wallace, J. M. (2000). Annular modes in the extratropical circulation, Part I: month-to-month variability. J. Clim. 13, 1000–1016. doi: 10.1175/1520-0442(2000)013<1000:AMITEC>2.0.CO;2
Thompson, D. W, and Wallace, J. M. (2001). Regional climate impacts of the Northern Hemisphere annular mode. Science 293, 85–89. doi: 10.1126/science.1058958
Thompson, D. W., Wallace, J. M., and Hegerl, G. C. (2000). Annular modes in the extratropical circulation, Part II: trends. J. Clim. 13, 1018–1036. doi: 10.1175/1520-0442(2000)013<1018:AMITEC>2.0.CO;2
Trenberth, K. E., Fasullo, J. T., and Mackaro, J. (2011). Atmospheric moisture transports from ocean to land and global energy flows in reanalyses. J. Clim 24, 4907–4924. doi: 10.1175/2011JCLI4171.1
Vicente-Serrano, S. M., López-Moreno, J. I., Lorenzo-Lacruz, J., El Kenawy, A., Azorin-Molina, C., Morán-Tejeda, E., et al. (2011). The NAO impact on droughts in the mediterranean region. Hydrological, socioeconomic and ecological impacts of the North Atlantic Oscillation in the mediterranean region. Adv. Glob. Change Res. 46, 23–40. doi: 10.1007/978-94-007-1372-7_3
Visbeck, M. (2009). A station-based southern annular mode index from 1884 to 2005. J. Clim. 22, 940–950. doi: 10.1175/2008JCLI2260.1
Viste, E., and Sorteberg, A. (2013). Moisture transport into the Ethiopian highlands. Int. J. Climatol. 33, 249–263. doi: 10.1002/joc.3409
Wang, C. (2007). Variability of the Caribbean low-level jet and its relations to climate. Clim. Dyn. 29, 411–422. doi: 10.1007/s00382-007-0243-z
Wang, X. L., Wan, H., and Swail, V. R. (2006). Observed changes in cyclone activity in Canada and their relationships to major circulation regimes. J. Clim. 19, 896–915. doi: 10.1175/JCLI3664.1
Keywords: annular modes, oceanic sources of moisture, moisture sinks, moisture transport, Lagrangian analysis, FLEXPART, Northern Annular Mode (NAM), Southern Annular Mode (SAM)
Citation: Nieto R, Castillo R and Drumond A (2014) The modulation of oceanic moisture transport by the hemispheric annular modes. Front. Earth Sci. 2:11. doi: 10.3389/feart.2014.00011
Received: 13 March 2014; Accepted: 06 June 2014;
Published online: 02 July 2014.
Edited by:
Tercio Ambrizzi, University of Sao Paulo, BrazilReviewed by:
Moacyr Cunha De Araujo, Universidade Federal de Pernambuco, BrazilRosmeri Porfirio Da Rocha, University of Sao Paulo, Brazil
Juan José Taboada, MeteoGalicia, Spain
Copyright © 2014 Nieto, Castillo and Drumond. This is an open-access article distributed under the terms of the Creative Commons Attribution License (CC BY). The use, distribution or reproduction in other forums is permitted, provided the original author(s) or licensor are credited and that the original publication in this journal is cited, in accordance with accepted academic practice. No use, distribution or reproduction is permitted which does not comply with these terms.
*Correspondence: Raquel Nieto, Environmental Physics Laboratory, Departamento de Física Aplicada, Facultade de Ciencias, Universidade de Vigo, Edif. Física, Campus As Lagoas S/N, 32004 Ourense, Spain e-mail: rnieto@uvigo.es