The magnitude and impact of the Youngest Toba Tuff super-eruption
 Antonio Costa
 Victoria C. Smith
 Giovanni Macedonio
 Naomi E. Matthews
- 1Istituto Nazionale di Geofisica e Vulcanologia, Bologna, Italy
- 2Research Laboratory for Archaeology and the History of Art, University of Oxford, Oxford, UK
- 3Istituto Nazionale di Geofisica e Vulcanologia, Osservatorio Vesuviano, Napoli, Italy
- 4Department of Petroleum Engineering, University of Stavanger, Stavanger, Norway
Super-eruptions, orders of magnitude larger than biggest eruptions experienced in historic times, have devastated wide areas by pyroclastic flows, covered continent-size areas by ash fallout, and injected large quantities of aerosols into the stratosphere affecting global climate. The Youngest Toba Tuff (YTT) is the largest known super-eruption in the Quaternary. Here we reconstructed the ultra-distal volcanic ash dispersal during this super-eruption using a computational ash dispersal model, which provides insights into the eruption dynamics and the impact of the event. The method uses a 3D time-dependent tephra dispersion model, a set of wind fields, and several tens of thickness measurements of the YTT tephra deposit. Results reveal that the YTT eruption dispersed ~8600 km3 (~3800 km3 dense rock equivalent, DRE) of ash, covering ~40 million km2 with more than 5 mm of ash. These new fallout volume estimations indicate that the total volume of the material erupted (including the massive pyroclastic density current (PDC), 1500 km3 DRE, deposits on Sumatra) was ~5300 km3 DRE. Simulation results indicate that the eruption had a very large mass flow rate and that the umbrella cloud, associated with the eruption plume, spread as an enormous gravity current around the neutral buoyancy level. The YTT tephra forms a key chronostratigraphic marker in the sedimentary sequences, and is particularly useful for constraining the age of the palaeoenvironmental and archeological records, and synchronizing these archives to investigate temporal relationships. These new constraints on the extent of the YTT deposit are therefore particularly useful for cryptotephra studies that aim to find nonvisible tephra layers for these chronological purposes. This method used to constrain volcanological parameters of eruptions in the past provides insights into the dispersal processes, and allows the amount of volatiles released to be estimated which is crucial to assessing the impact of such events.
Introduction
Our knowledge of the volume and dispersal of large eruptions in the past, and therefore their impact, is based on the observations of the volcanic deposits preserved and exposed (e.g., Self, 2006). Here we use a tephra dispersal model, a range of wind fields, and all the known thickness observations to further constrain the magnitude of large super-eruptions and gain some insight into eruption processes. This method was applied to the largest known eruption in the Quaternary, the Youngest Toba Tuff (YTT). The YTT occurred 75,000 years ago (75.0 ± 0.9 ka; Mark et al., 2014) and it is the youngest and largest of four eruptions from the Toba caldera on northern Sumatra, Indonesia. The earlier large Toba eruptions are the ~1.2 Ma Haranggoal Dacite Tuff, ~840 ka Oldest Toba Tuff, and the ~500 ka Middle Toba Tuff (MTT) (Chesner and Rose, 1991). These eruptions formed the 100 × 30 km2 Toba caldera (Rose and Chesner, 1987; Chesner, 1998). The YTT eruption resulted in deposition of thick ignimbrite sequences across 30,000 km2 of Sumatra (Rose and Chesner, 1987) and widespread distribution of ash. Deposits of the YTT eruption are found northwest of the vent, over the Indian subcontinent and the Arabian Sea (Ninkovich, 1979; Pattan et al., 1999, 2001), and to the east in the South China Sea (Bühring et al., 2000; Song et al., 2000; Liang et al., 2001; Figure 2A). Rose and Chesner (1987) estimated the minimum mass of the ash fall deposit to be 800 km3 dense rock equivalent (DRE). This tephra fallout volume and the enormous volume of pyroclastic density current (PDC) deposits indicate that >2000 km3 (DRE) of rhyolitic magma was erupted during the YTT event (Rose and Chesner, 1987, 1990; Chesner and Rose, 1991). Matthews et al. (2012) used a simple tephra dispersal analytical model and estimated ~1500–1900 km3 DRE of tephra, double that estimated by Rose and Chesner (1987), was erupted from an eruption column that was ~35 km high. However, because the limitations of the approach and limited tephra thickness dataset used in Matthews et al. (2012), the ultimate distribution of the tephra deposit and therefore estimations of erupted volume and eruption parameters remained uncertain. In fact, the assumption of a uniform constant wind profile (Matthews et al., 2012) over a so widespread area for the whole duration of ash dispersal process is not very realistic even though various methods for assessing tephra dispersal use this assumption. Here we use a methodology similar to Costa et al. (2012) to quantify and reproduce the YTT tephra deposit, which combines a computational ash dispersion model, analysis of an ensemble of wind fields, and several tens of thickness measurements of the YTT tephra deposit. However, Costa et al. (2012) neglected the density-driven transport in the umbrella region although strong plumes that reach the stratosphere can form a turbulent gravity current and spread radially at the neutral buoyancy level (e.g., Sparks et al., 1997). The YTT is an example of an eruption in which the tephra dispersal is governed by spreading of the umbrella region of the plume as a gravity current (Baines et al., 2008), and this process is described by the model proposed by Costa et al. (2013).
This new computational strategy allows us to overcome some of the inadequacies of previous methods (e.g., assumptions of a homogeneous wind profile and passive ash dispersion) and therefore, provides further constraints on the volcanological parameters that are linked to the dispersal, magnitude and impact of such events.
Computational Methodology and Input Data
To determine the YTT tephra dispersal through to the ultra-distal regions (up to several thousands km from the volcano), and assess the volume of this widespread tephra deposit we use the method described in Costa et al. (2012) that was applied to the Campanian Ignimbrite. The approach uses a set of 3D time-dependent meteorological fields across the region, a range of volcanological input parameters (erupted mass, mass eruption rate (MER), column height, and total grain size distribution), and several hundreds of simulations of the FALL3D tephra dispersal model (Costa et al., 2006, 2013). The tephra dispersion model is based on the numerical solution of a set of advection-diffusion-sedimentation equations coupled with an analytical model that describes the density-driven transport responsible for the radial growth of the volcanic cloud at the neutral buoyancy level (Costa et al., 2013).
Optimal values of the input parameters are obtained by best fitting measured YTT deposit thicknesses over the entire dispersal area (57 locations, see Table S1 in the Supplementary Material). The best fitting approach is based on that originally proposed by Aida (1978) to measure the spatial variation between the recorded and computed tsunami heights. The first Aida index, K, is associated to the geometric average of the distribution, and the second, k, is related to the geometric standard deviation of the distribution:
where n is the number of measurements and Ki = Mi/Hi is the ratio of measured tephra thickness (load) at i-th location, Mi, and simulated thickness (load), Hi, at the same location. As for tsunami simulations, we consider the simulated tephra thickness results satisfactory when:
If these conditions are satisfied, the model is considered to be reliable.
Distal ash deposits form an ephemeral irregular blanket that are rapidly reworked and further remobilized by wind, rain, and marine currents, thus the errors associated with thickness measurements are undoubtedly large and also hard to assess. Furthermore, there are uncertainties associated with spatial variation in the deposit density (here assumed to be constant like in Matthews et al., 2012, i.e., 1100 kg/m3). It is likely that these errors are even larger than the mean model error. Most of these distal tephra layers have been correlated to the YTT based on the composition of the glass shards, and the thickness of the deposit. The glass chemistry of the YTT is not particularly distinctive from the older Toba eruptions (Smith et al., 2011), however, and some of the correlations may therefore be incorrect. Nevertheless, given the thickness of the layers, general chronological context, and the distance from any volcanic source, these tephra occurrences are most likely to be associated with the enormous YTT eruption. We also assume, as in Matthews et al. (2012), that these YTT deposits represent a single eruption, as has been suggested in all previous literature (e.g., Rose and Chesner, 1987). The reliability of our results are based on the assumption that the large number of measured deposits, distributed over a large area, are statistically representative, being underestimated in some locations and overestimated in others. However, with our approach we are also able to quantify the uncertainty related to our semi-quantitative results.
The ensemble of 400 synoptic meteorological fields to input into the dispersal model was generated using 10 years of European Center for Medium-Range Weather Forecasts (ECMWF), ERA-40 reanalysis obtained from the data server (available from the website: http://www.ecmwf.int/en/research/climate-reanalysis/era-interim). The ERA-40 reanalysis archive contains 6 h data at 23 pressure levels, ranging from 1000 to 1 hPa, with a 2.5° horizontal resolution. Our methodology assumes that this collection of modern winds fields can statistically represent those at the time of the YTT eruption (~75 kyrs ago). As we discuss later, however, most of the dispersal is associated with a gravity current spreading out from the umbrella region that is not controlled by the wind direction. Meteorological fields were interpolated to the FALL3D computational mesh with a 3-h interval using linear temporal and spatial interpolations. In particular a horizontal grid step of Δx = Δy = 1o and a vertical step Δz = 2 km were used to discretize the computational domain. We performed up to 400 simulations to select the best meteorological conditions and estimate the volcanological parameters and then ran 300 more simulations to further constrain the parameters. The computational domain extended from 30° S to 30° N and from 30° E to 120° E, extending to the east coast of Africa where some YTT cryptotephra was identified in Lake Malawi (Lane et al., 2013). However, it is important to stress that cryptotephra can also be dispersed at thousands of km from the source by low atmospheric winds which remobilize the ash deposit (Folch et al., 2014). In view of this and given that there is not an associated specific thickness, the data from Lake Malawi were not considered in the best-fit procedure and included in the figures for comparison.
The volcanological and meteorological parameters that best fit the observed deposits (thickness measurements in Table S1 in the Supplementary Material) are reported in Table 1. The distribution of mass within the column was calculated using an empirical parameterization based on that of Suzuki (1983) and Pfeiffer et al. (2005). The giant ash cloud generated during YTT eruption is expected to have very large horizontal dimensions, with spreading velocities exceeding those of typical stratospheric winds (Sparks et al., 1997; Baines and Sparks, 2005; Baines et al., 2008). For this reason, the model used in Costa et al. (2012) had to be modified in order to account for the gravitational spreading of the umbrella region, as was suggested by Costa et al. (2013). The MER dictates the gravitational spreading of the umbrella cloud but the relationship is nonlinear and therefore requires more computationally intensive simulations.
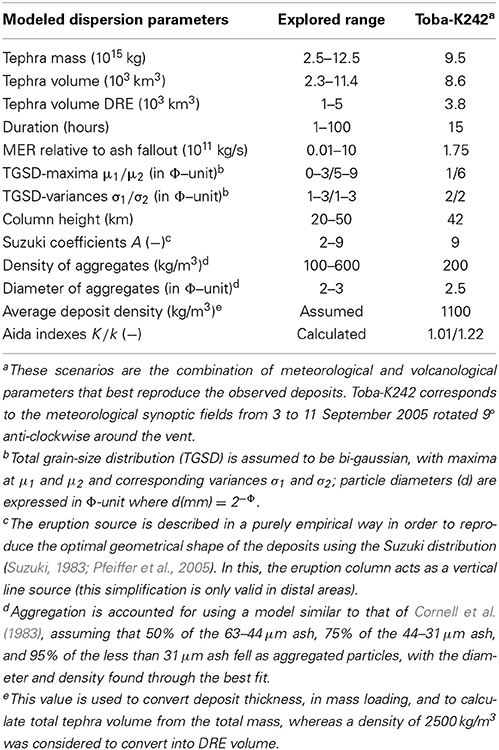
Table 1. Best fit results of tephra dispersal inversion for the YTT super-eruption.
The fine ash dispersal depends on aggregation processes so an aggregation model, similar to that of Cornell et al. (1983), was also used in the simulations like in Costa et al. (2012). The aggregation model assumed that 50% of the 63–44 μm ash, 75% of the 44–31 μm ash, and 95% of sub-31 μm ash fell as aggregated particles. The diameter and a density of these aggregates were determined via best fit in the simulations. Unfortunately, more sophisticated aggregation models (e.g., Costa et al., 2010; Folch et al., 2010) could not be employed to solve this inverse problem as they are too computationally intensive.
Results
The best-fit results from the model indicate that the column height was ~42 km, the MER associated with the ash fallout was ~1.75 × 10¹¹ kg/s, and the eruption lasted ~15 h. The effective ash-aggregate diameter and density were of 2.5 Φ-units and 200 kg/m3, respectively. The total amount of material deposited as fallout was ~9.5 × 10¹⁵ kg, which equates to ~8600 km3 of tephra or ~3800 km3 of magma (DRE) using a ratio of 2500 kg/m3 to convert bulk to DRE volume. These calculated tephra fall volumes are approximately double previous estimations of ~1500–1900 km3 DRE by Matthews et al. (2012) who used a simplified model and fewer tephra thickness measurements (excluded many of the distal points used in this study). Considering volume estimations of ~1500 km3 DRE for the proximal PDC deposits, and some of the caldera infill that would have been associated with the PDC (Chesner and Rose, 1991), the total bulk volume of the YTT eruption is ~13200 km3 (5300 km3 DRE). The mean error on the total mass associated to tephra fallout is about a factor 1.5, which implies the volume of magma eruption could have been between 2000 and 6000 km3 (DRE).
The best-fit meteorological fields correspond to those that typically prevail in current autumn periods. Of all the 400 meteorological synoptic fields considered, the conditions that prevailed from 3 to 11 September 2005 but rotated 9° anti-clockwise around the Toba vent, provided the conditions that best fit the observed tephra fall deposits.
The modeled results are in general agreement with the measured thicknesses; most of simulated thicknesses are between 1/5 and 5 times the observed thicknesses and almost all simulations are between 1/10 and 10 times the observed thicknesses (see Table 1 and Figure 2A). Reliability of the best-fit results are also shown by the Aida indices (Aida, 1978): the first Aida index, reflecting the geometric average, K = 1.01, and the second, related to the geometric standard deviation, k = 1.22.
Like in Matthews et al. (2012), the aim here was to estimate an effective source term. The mass distribution within the column was described using an empirical parameterization (Suzuki, 1983; Pfeiffer et al., 2005), which used the column shape parameter (A) and the column height (H) determined by the inversion (i.e., A = 9 and H = 42 km). As shown by Figure 1, this best fit column shape parameter is significantly different from the typical values obtained for a Plinian column (A ≈ 4) that has most of its mass distributed at ¾ of the column height (Sparks, 1986; Pfeiffer et al., 2005). Similar to Matthews et al. (2012), these simulations show that YTT ash fallout deposits cannot be reproduced using an ordinary diffusion coefficient estimated by atmospheric turbulence. The effective diffusion coefficient would be couple of orders of magnitude larger than atmospheric diffusion as the MER was so large (≈1.75 × 10¹¹ kg/s). This MER is significantly larger than that estimated (Woods and Wohletz, 1991) (7.1 × 10⁹ kg/s) but our estimated MER gives a volumetric flow rate into the umbrella region of 5 × 10¹² m3/s, which is very similar to that estimated by Baines and Sparks (2005). Such an enormous MER would generate a huge gravitational current around a neutral buoyancy level in the stratosphere, as described by the model presented in Costa et al. (2013). This would result in the formation of a giant ash cloud extending out from the vent. Since Toba is relatively close to the equator we can neglect effects due to Coriolis force, which would reduce the radial spreading (Baines and Sparks, 2005).
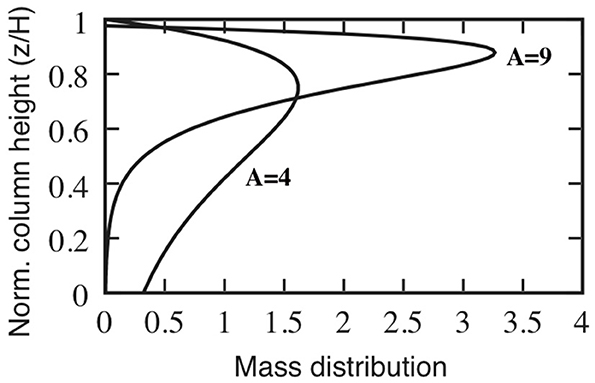
Figure 1. Mass distribution inside the eruption column in accordance with Suzuki's (1983) parameterization: s(z) = (1 − z/H) exp [A(z/H − 1)], where s(z) is the normalized mass distribution, H is the column height, A is a dimensionless shape parameter, and z is the vertical coordinate. Relative column height is reported on the y-axis and mass distribution on the x-axis.
The radius of umbrella cloud, R (m), can be written as (e.g., Woods and Kienle, 1994; Sparks et al., 1997; Costa et al., 2013):
where (m3/s) is the volumetric flow rate into the umbrella region, t (s) is time, γ is an empirical dimensionless constant, and N (s−1) is the Brunt-Vaisala (or buoyancy) frequency which is associated with ambient atmospheric stratification, and represents the frequency at which a vertically displaced parcel will oscillate in a stable environment. The value of γ was first estimated by Woods and Kienle (1994) to be ≈ 2.5. Later, Holasek et al. (1996a,b) conducted laboratory experiments and satellite observations to estimate γ and found it to be in the range of 0.1–0.6. More recently, Suzuki and Koyaguchi (2009) suggested γ ≈ 0.2 from Direct Numerical Simulations of the Pinatubo 1991 eruption. Here we used a value of γ ≈ 2 so that the MER did not need to be unrealistically large. The use of this value of γ may also reflect the fact that R could increase with time from t2/3 to t3/4 in Equation (4), as suggested by Hogg et al. (2013) and Ungarish et al. (2014). Our results of the empirical mass distribution within the column agree also with the predictions of the Hogg et al. (2013) and Ungarish et al. (2014) models, which suggest that the volcanic ash should be confined in a thin layer in the atmosphere during large eruptions (see Figure 1)
An enormous MER is required in order to create such a gigantic volumetric flow rate into the umbrella region that is able to produce thicknesses of a few centimeters at distances of thousands of kilometers from the vent (Baines and Sparks, 2005; Costa et al., 2013). However, a buoyant volcanic column cannot be sustained from such a large MER (e.g., Woods and Bower, 1995; Koyaguchi et al., 2010). In fact, even for very wide vents, if the MER increases above 1010 kg/s the associated buoyant column tends to collapse (e.g., Woods and Bower, 1995; Koyaguchi et al., 2010). However, this MER is compatible with a fissure eruption (Costa et al., 2011), with contemporaneous contributions from multiple focused vents distributed along a fissure (Costa et al., 2009), and fits with the caldera shape. If the contemporaneous eruptions from each of these vents had an MER <1010 kg/s they would be able to produce sustained Plinian columns. These contemporaneous multiple columns would have merged in the stratosphere to form a gigantic umbrella cloud. Furthermore, for vents having larger MER, co-ignimbrite columns would have formed from the buoyant elutriated mixture of ash and volatiles rising off the pyroclastic flows and spread over a wide area (Woods and Wohletz, 1991). As mentioned above, such a MER gives a volumetric flow rate into the umbrella region of 5 × 10¹² m3/s, highlighting that gravitational spreading is the dominant process for dispersion. In fact, spreading velocity of the umbrella region within a few thousand kilometers (covered in 1–2 days) of the vent is larger than the typical stratospheric wind velocities. Modeling such a process using an effective diffusion coefficient would provide a value up two orders of magnitude larger than the value associated to atmospheric turbulence, consistent with the results of Matthews et al. (2012).
The simulated, best-fit, deposit thicknesses are shown in Figure 2B, and the shape of the dispersal area and extent of the ultra-distal deposits is also shown. The temporal evolution of YTT tephra dispersal is available as an animated gif (see Supplementary Material).
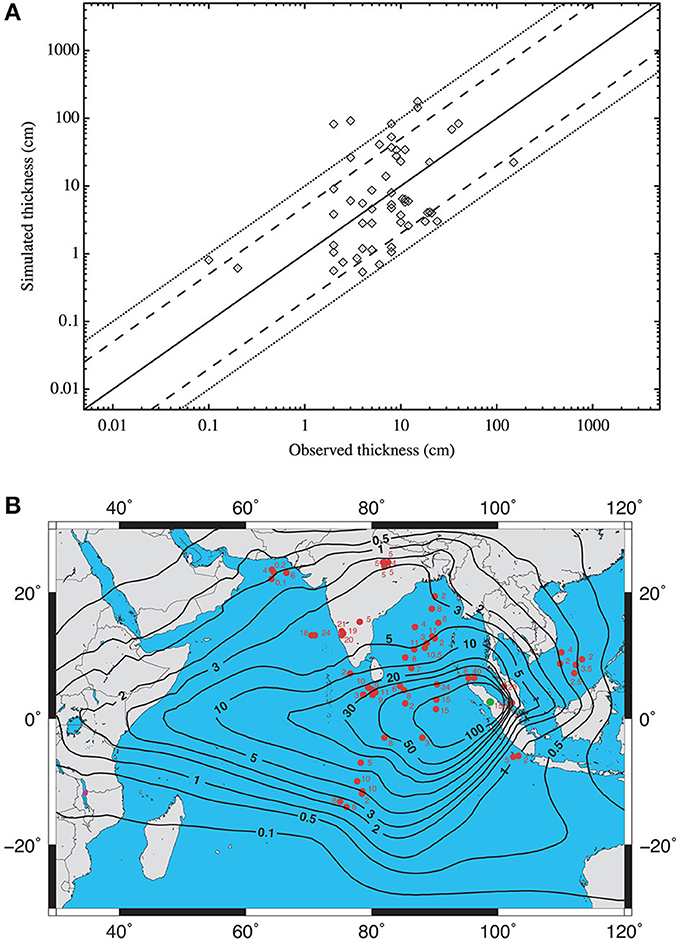
Figure 2. (A) Comparison between the thicknesses from the best-fit FALL3D simulations and the field data, at each of the 57 sampling points (see Table S1 in Supplementary Material for grid references and thicknesses). The solid line represents a perfect agreement, and the dotted and dashed black lines mark the region that is different from observed thicknesses by a factor 10 (1/10) and 5 (1/5), respectively. (B) Isopach maps showing YTT ash thickness in centimeters (intervals 0.1, 0.2, 0.5, 1, 2, 3, 5, 10, 20, 30, 50, 100 cm), as modeled using FALL3D.
Implications and Discussion
The extent of the dispersal is important for palaeoclimate and palaeoenvironmental studies as tephra units from large explosive eruptions form invaluable chronostratigraphic markers in sedimentary records. The YTT is particularly useful as it is so widespread, covering area of ~40 million km2 in more than 5 mm of ash (Figure 2B). Distal tephra layers are often not visible layers within the sequences due to the site's taphonomy (i.e., rate of sedimentation, alteration, and preservation), but small glass shards are still preserved within the sediments. Cryptotephra, identified by density separation techniques, are increasingly being used as chronostratigraphic markers (e.g., Lowe et al., 2012). Finding the YTT tephra in sequences provides absolute age tie point of 75.0 ± 0.9 ka (Mark et al., 2014). Ages of the sediments in this time period are typically hard to constrain, as they are beyond the radiocarbon limit, and usually only inferred by orbitally tuning to the polar δ18O ice core records. Finding the ash layer also allows the synchronization of palaeoenvironmental records on the continental scale and allows disparate records to be compared, which provide insight into climate dynamics.
Regional Effects
The regional effects and the damage to ecosystems of the YTT and other large super-eruptions have been discussed in various papers (e.g., Oppenheimer, 2002; Self and Blake, 2008; Matthews et al., 2012). Our new estimates indicate these effects would have been experienced over a wider area. The direct impact of the YTT eruption would have been incredibly spatially variable as the range in tephra thicknesses varies considerably over the gigantic dispersal area. The volcanic deposits would have completely altered much of the landscape in northern Sumatra, with pyroclastic flows decimating everything they passed over and the thick fallout suffocating life in the surrounding area. This new land surface would experience significant erosion for years to decades after the eruption, and recovery would be very slow, on the order of hundreds to thousands of years (cf. Arnalds, 2013), as new soil would have to develop prior to the recolonization of the vegetation and animals. The rest of the thick tephra deposits were deposited in the Indian Ocean and South China Sea, while thicknesses on most of the surrounding land were less than 5 cm. However, significant areas were covered in ash (Figure 2B), including southeastern China (<1 cm), Borneo (<1 cm), Thailand and surrounding countries (~1–3 cm), India (<1–10 cm), Arabian peninsula (<1 cm), and eastern Africa (<3 cm). These areas would experience erosion and dust emission with some species changes areas but studies of historic eruptions indicate that the impact would be temporary, on the order of 10–50 years (Arnalds, 2013).
Climate Effect of the Eruption
The global impacts of volcanic eruptions are linked to the quantities of volatile species (e.g., SO2, HCl, and HF) injected into the atmosphere during these events. The volume of volatiles has been estimated using the new volume estimates and the concentrations of the volatile species dissolved in the magma prior to eruption.
Chesner and Luhr (2010) published the volatile concentrations in the melt inclusions trapped within crystals, which typically reflect the volatile content of the magma prior to degassing and eruption. Using the equation of Self et al. (2004) we estimate the amount of SO2 released during the YTT eruption to be between 1700 and 3500 Tg (assuming that the melt inclusions had 50–100 ppm SO2—Chesner and Luhr, 2010 reported concentration to be below detection limit). This is an order of magnitude greater than that released during the Campanian Ignimbrite (CI) eruption (~450 Tg) from Campi Flegrei, Italy (Costa et al., 2012) and other super-eruptions (e.g., Bishop Tuff; Scaillet et al., 2003). The volumes of Cl and F released were also estimated using a similar method, taking into account the difference between the concentrations dissolved in the melt inclusions and those in matrix glass (reported in Chesner and Luhr, 2010). Approximately 1740 Tg of Cl (~1790 Tg HCl) and 3915 Tg F (4123 Tg HF) were released during the YTT eruption. The amount of F released is similar to that released using the CI super-eruption 3230 Tg, (Costa et al., 2012; note that both the F and Cl loads for the CI in Costa et al., 2012 are incorrectly reported and should be an order of magnitude larger) but the Cl released would have been around half that emitted during the CI eruption (4520 Tg Cl; Costa et al., 2012). These are substantial volumes of volatiles that would have had a significant impact on the climate and ecosystems. The largest historic eruption, the 1815 Tambora event, and the AD 1783–1784 Laki (Skaftár Fires) eruption both released comparatively minute amounts of SO2, ~55 Tg (Self et al., 2004) and 122 Tg (Thordarson et al., 1996; Thordarson and Self, 2003) respectively. These sulfur loads resulted in mean surface cooling of −1.0 to −1.5°C that lasted a few years (Thordarson and Self, 2003). The YTT sulfur load was an order of magnitude greater but it is not clear that the change to the radiative forcing would have been as large. Such an injection of volatiles into the atmosphere would have generated more interactions between the volatile particles, resulting in increased sizes that would readily fallout, and since they spend less time in the atmosphere the impact on the climate is less significant and also spans a shorter duration (Timmreck et al., 2010; English et al., 2013). Timmreck et al. (2010) modeled these microphysical processes that affect the volatile load within the atmosphere using an Earth system model. Using a SO2 load of 850 Tg the simulations indicate that the perturbations to the temperature may have only lasted ~5–10 years, and that the mid-latitudes could have been up to −12°C cooler, with a maximum global cooling of ~3.5°C (Timmreck et al., 2010, 2012). Given the SO2 load estimated in this paper is double that used in the Timmreck et al. (2010, 2012) simulations it is likely that the cooling was more pronounced. The injection of such large volumes of SO2, F, and Cl into the stratosphere would have also resulted in the depletion of ozone, and possibly the removal of all ozone over a wide latitude (Brasseur and Granier, 1992; Bindeman et al., 2007). Depleting the ozone would typically result in an increase in the amount of ultra-violet radiation making it to the Earth's surface but the SO2 would also absorb radiation, and therefore, the net to effect to organisms may not have been extreme. The large quantities of F and Cl released would have also resulted in acid rain. These effects coupled with the enormous amount of ash and the elements leaching from the ash particles would have drastically affected vegetation and ecosystems (see above).
Recent studies have also indicated that the input of volcanic ash into the ocean can change the ocean chemistry and therefore biogeochemical cycles and ultimately climate (e.g., Duggen et al., 2010). This is linked to input of iron from the volcanic ash and the effects on biological productivity are particularly pronounced in regions of the ocean that are high in nutrients and low in chlorophyll, which are found in the north and central Pacific and around Antarctica (Duggen et al., 2010). The 1991 eruption of Pinatubo in the Philippines input ash into iron-limited ocean and it is believed that this ash fertilization increased productivity, caused a CO2-drawdown, and resulted in the anomalous oxygen pulse that was observed in the years after the eruption (Sarmiento, 1993). Increases in productivity in lakes has also been observed after eruptions, for example, there were increased in algae and diatom populations in lakes within the ash fallout area of the Mount St Helens eruption (Smith and White, 1985). Furthermore, after the 1912 Katmai-Novarupta eruption in Alaska, although ash killed most of the salmon (due to gill damage), the salmon stock recovered rapidly a few years after the eruption, which could be associated with ash fertilization increasing productivity of the salmon's food source (Eicher and Rounsefell, 1957). It is not clear what effect the YTT ash would have had on ocean sources within the fallout area as the volume of ash deposited is orders of magnitude greater than the eruptions mentioned above. However, it is likely that most of the organisms in the ocean covered in large quantities of ash would have been killed or severely affected and it is unlikely that there would be any recovery until ash concentrations were significantly reduced. The areas of ocean distal from the vent that would have been covered with significantly less volcanic ash, i.e., near the Arabian Peninsula, may have experienced iron fertilization but the Indian Ocean typically has high iron levels, from dust off northern Africa (Duggen et al., 2010), and therefore the increased iron from the volcanic ash may not have noticeably increased productivity. The productivity in freshwater bodies on the continents could have increased due to iron fertilization and once most of the ash in the Indian Ocean settled the aquatic life would start to recover and productivity would have increased. These increases in productively could have caused a CO2-drawdown, but this would have been decoupled from the eruption as ash input would have been very high for a decade or longer as it washed off the landscape.
Past climate records should be able to shed some light on the effect of the eruption but the position of YTT in the Earth's high-resolution palaeoclimate records, the Greenland or Antarctic ice core records, is not well established. Zielinski et al. (1996) suggested that a 6-year long period of increased sulfur recorded in Greenland (GISP2 core) was associated with the YTT eruption and placed the event at the onset of a cold period, Greenland Stadial 20. However, more recent work by Svensson et al. (2012) has shown that there are actually 4 sulfate peaks, with coincident electrical conductivity peaks, present in both Antarctic (EDML) and Greenland (GISP2) ice cores between ~74 and 76 ka (early in the warm Greenland Interstadial 20 through to the onset of the cooler Greenland Stadial 20), and any of these could be associated with the YTT eruption. Unfortunately, no Toba glass shards have been observed in this interval in the Greenland ice cores (NGRIP and GISP; Abbott et al., 2012) and therefore it is not clear which of these peaks in sulfate, if any, actually correspond to the YTT eruption. The YTT ash has been found in various palaeoenvironmental records, for example, marine archives in the Arabian Sea (Schulz et al., 1998) and southwest Sumatra (van der Kaars et al., 2010) and a lake record in the ultra distal region (Lake Malawi; Lane et al., 2013), but the palaeoenvironmental data are not of sufficient temporal resolution to establish the climate conditions that prevailed in the years immediately after the eruption. However, using the eruption age (75 ± 0.9 ka; Mark et al., 2014) it is clear from the ice core chronology (GICC05 modeled age) that the eruption occurred near the start or the end of Greenland Interstadial 20 (Svensson et al., 2012)—a period during which the δ18O and thus global temperature was decreasing. A recent study on a stalagmite from Borneo noted that the largest millennial-scale δ18O anomaly in the record is found at 74.32 ± 0.30 ka and does not correspond to a Heinrich event (Carolin et al., 2013). They note that the timing of this abrupt change occurs at a similar time as the YTT and therefore suggest that it could be associated with the eruption (Carolin et al., 2013). Unfortunately, how the eruption affected the regional and the global climate cannot be resolved using current datasets as either the exact position of the YTT eruption is not established or the records are not sufficiently high resolution. Hopefully, some of the palaeoenvironmental records will be further investigated to identify the eruption and collect higher (annual) resolution palaeoenvironmental data to establish the climatic response to the YTT super-eruption.
Conclusions
In summary, the application of a detailed ash dispersal model, which accounts for all the main processes that govern ash dispersal, allowed us to constrain the key eruption parameters, such as volume, MER, duration, column height, and total grain-size distribution, and the tephra dispersal footprint of the YTT super-eruption. These simulations indicate that the YTT eruption was considerably more voluminous than previously thought, erupting 8600 km3 (~3800 km3 DRE) and covering ~40 million km2 with more than 5 mm of ash. The volcanological parameters constrained by the model also provide insight into the processes occurring in the eruption column. The model indicates that the MER was enormous during the YTT eruption, which implies that the eruption generated a huge gravitational current around the neutral buoyancy level in the stratosphere transporting ash quickly and radially around the vent into distal regions. This is likely to be a process that occurs during other super-eruptions. The magnitude of the MER of the YTT eruption also suggests that eruption occurred from multiple vents, which is consistent with the shape of the caldera. Knowing magma composition, the volume estimations from the model allowed the volatile emission associated with this gigantic event to be calculated, and the effects of the eruption to be extrapolated. The injection of such large quantities of fine ash and volatiles into the atmosphere would have caused a volcanic winter that would have persisted over large areas for years to decades. Furthermore, the thicknesses of the tephra deposits would have greatly impacted regions within a few 100 km of the vent and recovery of these regions would be on the order of hundreds to thousands of years. The model used here, even though based on some assumptions, provides further constraint on the dispersal processes and volume of past eruptions, which is crucial to our understanding of such large events.
Conflict of Interest Statement
The Review Editor Roberto Sulpizio declares that, despite having collaborated with author Victoria Smith, the review process was handled objectively. The authors declare that the research was conducted in the absence of any commercial or financial relationships that could be construed as a potential conflict of interest.
Acknowledgments
Meteorological data (ERA40) were provided by European Center for Medium-Range Weather Forecasts (ECMWF). Ilya Bindeman, Roberto Sulpizio, Helen Webster, and the editor Vera Ponomareva are thanked for constructive feedback.
Supplementary Material
The Supplementary Material for this article can be found online at: http://www.frontiersin.org/journal/10.3389/feart.2014.00016/abstract
References
Abbott, P. M., Davies, S. M., Steffensen, J. P., Pearce, N. J. G., Bigler, M., Johnsen, S. J., et al. (2012). A detailed framework of Marine Isotope Stages 4 and 5 volcanic events recorded in two Greenland ice-cores. Quat. Sci. Rev. 36, 59–77. doi: 10.1016/j.quascirev.2011.05.001
Aida, I. (1978). Reliability of a tsunami source model derived from fault parameters. J. Phys. Earth 26, 57–73.
Arnalds, O. (2013). “The influence of Volcanic Tephra (Ash) on ecosystems,” in Advance in Agronomy, ed D. Sparks (San Diego, CA: Elsevier), 331–380. doi: 10.1016/B978-0-12-407685-3.00006-2
Baines, P., and Sparks, R. (2005). Dynamics of giant volcanic ash clouds from supervolcanic eruptions. Geophys. Res. Lett. 32, L24808. doi: 10.1029/2005GL024597
Baines, P. G., Jones, M. T., and Sparks, R. S. J. (2008). The variation of large-magnitude volcanic ash cloud formation with source latitude. J. Geophys. Res. 113, D21204. doi: 10.1029/2007JD009568
Bindeman, I. N., Eiler, J. M., Wing, B. A., and Farquhar, J. (2007). Rare sulfur and triple oxygen isotope geochemistry of volcanogenic sulfate aerosols. Geochim. Cosmochim. Acta 71, 2326–2343. doi: 10.1016/j.gca.2007.01.026
Brasseur, G., and Granier, C. (1992). Mount Pinatubo aerosols, chlorofluorocarbons, and ozone depletion. Science 257, 1239–1242.
Bühring, C., Sarnthein, M., and Leg 184 Shipboard Scientific Party. (2000). Toba ash layers in the South China Sea: evidence of contrasting wind directions during eruption ca. 74 ka. Geology 28, 275–278. doi: 10.1130/0091-7613(2000)28<275:TALITS>2.0.CO;2
Carolin, S. A., Cobb, K. M., Adkins, J. F., Clark, B., Conroy, J. L., Lejau, S., et al. (2013). Varied response of western pacific hydrology to climate forcings over the last glacial period. Science 340, 1564–1566. doi: 10.1126/science.1233797
Cornell, W., Carey, S., and Sigurdsson, H. (1983). Computer simulation of transport and deposition of Campanian Y-5 ash. J. Volcanol. Geotherm. Res. 17, 89–109. doi: 10.1016/0377-0273(83)90063-X
Chesner, C. A. (1998). Petrogenesis of the toba tuffs, sumatra, indonesia. J. Petrol. 39, 397–438. doi: 10.1093/petroj/39.3.397
Chesner, C. A., and Luhr, J. F. (2010). A melt inclusion study of the Toba Tuffs, Sumatra, Indonesia. J. Volcanol. Geotherm. Res. 197, 259–278. doi: 10.1016/j.jvolgeores.2010.06.001
Chesner, C. A., and Rose, W. I. (1991). Stratigraphy of the Toba tuffs and the evolution of the Toba caldera complex, Sumatra, Indonesia. Bull. Volcanol. 53, 343–356. doi: 10.1007/BF00280226
Costa, A., Folch, A., and Macedonio, G. (2010). A model for wet aggregation of ash particles in volcanic plumes and clouds: 1. Theoretical formulation. J. Geophys. Res. 115, B09201. doi: 10.1029/2009JB007175
Costa, A., Sparks, R. S. J., Macedonio, G., and Melnik, O. (2009). Effects of wall-rock elasticity on magma flow in dykes during explosive eruptions. Earth Planet. Sci. Lett. 288, 455–462. doi: 10.1016/j.epsl.2007.05.024
Costa, A., Gottsmann, J., Melnik, O., and Sparks, R. S. J. (2011). A stress-controlled mechanism for the intensity of very large magnitude explosive eruptions. Earth Planet. Sci. Lett. 310, 161–166. doi: 10.1016/j.epsl.2011.07.024
Costa, A., Macedonio, G., and Folch, A. (2006). A three-dimensional Eulerian model for transport and deposition of volcanic ashes. Earth Planet. Sci. Lett. 241, 634–647. doi: 10.1016/j.epsl.2005.11.019
Costa, A., Folch, A., Macedonio, G., Giaccio, B., Isaia, R., and Smith, V. C. (2012). Quantifying volcanic ash dispersal and impact of the Campanian Ignimbrite super-eruption. Geophys. Res. Lett. 39, L10310. doi: 10.1029/2012GL051605
Costa, A., Folch, A., and Macedonio, G. (2013). Density-driven transport in the umbrella region of volcanic clouds: implications for tephra dispersion models. Geophys. Res. Lett. 40, 4823–4827. doi: 10.1002/grl.50942
Duggen, S., Olgun, N., Croot, P., Hoffmann, L., Dietze, H., Delmelle, P., et al. (2010). The role of airborne volcanic ash for the surface ocean biogeochemical iron-cycle: a review. Biogeosciences 7, 827–844. doi: 10.5194/bg-7-827-2010
Eicher, G. J., and Rounsefell, G. A. (1957). Effects of lake fertilization by volcanic activity on abundance of salmon. Limnol. Oceanogr. 2, 70–76.
English, J. M., Toon, O. B., and Mills, M. J. (2013). Microphysical simulations of large volcanic eruptions: Pinatubo and Toba. J. Geophys. Res. 118, 1880–1895. doi: 10.1002/jgrd.50196
Folch, A., Costa, A., Durant, A., and Macedonio, G. (2010). A model for wet aggregation of ash particles in volcanic plumes and clouds: 2. Model application. J. Geophys. Res. 115, B09202. doi: 10.1029/2009JB007176
Folch, A., Mingari, L., Osores, M. S., and Collini, E. (2014). Modeling volcanic ash resuspension. Application to the 14-18 October 2011 outbreak episode in Central Patagonia, Argentina. Nat. Hazards Earth Syst. Sci. 14, 119–133. doi: 10.5194/nhess-14-119-2014
Hogg, A., Johnson, C., Sparks, S., Huppert, H., Woodhouse, M., and Phillips, J. (2013). “Models of ash-laden intrusions in a stratified atmosphere,” in EGU 2013 General Assembly Conference Abstracts, Vol. 15 (Vienna), 9726.
Holasek, R., Self, S., and Woods, A. (1996a). Satellite observations and interpretation of the 1991 Mount Pinatubo eruption plumes. J. Geophys. Res. 101, 27635–27655.
Holasek, R., Woods, A., and Self, S. (1996b), Experiments on gas-ash separation processes in volcanic umbrella plumes, J. Volcanol. Geotherm. Res. 70, 169–181.
Koyaguchi, T., Suzuki, Y. J., and Kozono, T. (2010). Effects of the crater on eruption column dynamics. J. Geophys. Res. 115, B07205. doi: 10.1029/2009JB007146
Lane, C. S., Chorn, B. T., and Johnson, T. C. (2013). Ash from the Toba supereruption in Lake Malawi shows no volcanic winter in East Africa at 75 ka. Proc. Natl. Acad. Sci. U.S.A. 110, 8025–8029. doi: 10.1073/pnas.1301474110
Liang, X., Wei, G., Shao, L., Li, X., and Wang, R. (2001). Records of Toba eruptions in the south China seadChemical characteristics of the glass shards from ODP 1143A. Sci. China D 44, 871–878. doi: 10.1007/BF02907078
Lowe, J., Barton, N., Blockley, S., Ramsey, C. B., Cullen, V. L., Davies, W., et al. (2012). Volcanic ash layers illuminate the resilience of Neanderthals and early modern humans to natural hazards. Proc. Natl. Acad. Sci. U.S.A. 109, 13532–13537. doi: 10.1073/pnas.1204579109
Mark, D. F., Petraglia, M., Smith, V. C., Morgan, L. E., Barfod, D. N., Ellis, B. E., et al. (2014). A high-precision 40Ar/39Ar age for the Young Toba Tuff and dating of ultra-distal tephra: forcing of quaternary climate and implications for hominin occupation of India. Quat. Geochronol. 21, 90–103. doi: 10.1016/j.quageo.2012.12.004
Matthews, N. E., Smith, V. C., Costa, A., Durant, A. J., Pyle, D. M., and Pearce, N. J. G. (2012). Ultra-distal tephra deposits from super-eruptions: examples from Toba, Indonesia and Taupo Volcanic Zone, New Zealand. Quat. Int. 258, 54–79. doi: 10.1016/j.quaint.2011.07.010
Ninkovich, D. (1979). Distribution, age and chemical composition of tephra layers in deep-sea sediments off western Indonesia. J. Volcanol. Geotherm. Res. 5, 67–86. doi: 10.1016/0377-0273(79)90033-7
Oppenheimer, C. (2002). Limited global change due to largest known Quaternary eruption, Toba ≈74 kyr BP? Quat. Sci. Rev. 21, 1593–1609. doi: 10.1016/S0277-3791(01)00154-8
Pattan, J., Shane, P., and Banakar, V. (1999). New occurrence of youngest Toba Tuff in abyssal sediments of the central Indian Basin. Mar. Geol. 155, 243–248. doi: 10.1016/S0025-3227(98)00160-1
Pattan, J. N., Shane, P., Pearce, N. J. G., Banakar, V. K., and Parthiban, G. (2001). An occurrence of ~74 ka Youngest Toba tephra from the western Continental Margin of India. Curr. Sci. 80, 1322–1326.
Pfeiffer, T., Costa, A., and Macedonio, G. (2005). A model for the numerical simulation of tephra fall deposits. J. Volcanol. Geotherm. Res. 140, 273–294. doi: 10.1016/j.jvolgeores.2004.09.001
Rose, W. I., and Chesner, C. A. (1987). Dispersal of ash in the great Toba eruption, 75 ka. Geology 15, 913–917. doi: 10.1130/0091-7613(1987)15<913:DOAITG>2.0.CO;2
Rose, W. I., and Chesner, C. A. (1990). Worldwide dispersal of ash and gases from earth's largest known eruption: Toba, Sumatra, 75 ka. Palaeogeogr. Palaeoclimatol. Palaeoecol. 89, 269–275. doi: 10.1016/0921-8181(90)90023-6
Scaillet, B., Luhr, J. F., and Carroll, M. R. (2003). “Petrological and volcanological constraints on volcanic sulfur emissions to the atmosphere,” in Volcanism and the Earth's Atmosphere, Geophysical Monograph 139, eds A. Robock and C. Oppenheimer (Washington, DC:AGU), 11–40.
Schulz, H., von Rad, U., and Erlenkeuser, H. (1998). Correlation between Arabian Sea and Greenland climate oscillations of the past 110,000 years. Nature 393, 54–57. doi: 10.1038/31750
Self, S. (2006). The effects and consequences of very large explosive volcanic eruptions. Philos. Trans. R. Soc. A 364, 2073–2097. doi: 10.1098/rsta.2006.1814
Self, S., and Blake, S. (2008). Consequences of explosive supereruptions. Elements 4, 41–46. doi: 10.2113/GSELEMENTS.4.1.41
Self, S., Gertisser, R., Thordarson, T., Rampino, M. R., and Wolff, J. A. (2004). Magma volume, volatile emissions, and stratospheric aerosols from the 1815 eruption of Tambora. Geophys. Res. Lett. 31, L20608. doi: 10.1029/2004GL020925
Smith, M. A., and White, M. (1985). Observations on lakes near Mount St. Helens: Phytoplankton. J. Arch. Hydrobiol. 104, 345–363.
Smith, V. C., Pearce, N. J. G., Matthews, N. E., Westgate, J. A., Petraglia, M. D., Haslam, M., et al. (2011). Geochemical fingerprinting the widespread Toba tephra using biotite compositions. Quat. Int. 246, 97–104. doi: 10.1016/j.quaint.2011.05.012
Song, S. R., Chen, C. H., Lee, M. Y., Yang, T., Iizuka, Y., and Wei, K. Y. (2000). Newly discovered eastern dispersal of the youngest Toba Tuff. Mar. Geol. 167, 303–312. doi: 10.1016/S0025-3227(00)00034-7
Sparks, R. S. J. (1986). The dimensions and dynamics of volcanic eruption columns. Bull. Volcanol. 48, 3–15. doi: 10.1007/BF01073509
Sparks, R., Bursik, M., Carey, S., Gilbert, J., Glaze, L., Sigurdsson, H., et al. (1997). Volcanic Plumes. Chichester: John Wiley & Sons Ltd.
Suzuki, T. (1983). “A theoretical model for dispersion of tephra,” in Arc Volcanism: Physics and Tectonics, eds D. Shimozuru and I. Yokoyama (Tokyo: Terra Scientific Publishing), 95–116.
Suzuki, Y., and Koyaguchi, T. (2009). A three-dimensional numerical simulation of spreading umbrella clouds. J. Geophys. Res. 114, B03209. doi: 10.1029/2007JB005369
Svensson, A., Bigler, M., Blunier, T., Clausen, H. B., Dahl-Jensen, D., Fischer, H., et al. (2012). Direct linking of Greenland and Antarctic ice cores at the Toba eruption (74 kyr BP). Clim. Past Discuss. 8, 5389–5427. doi: 10.5194/cpd-8-5389-2012
Thordarson, T., Self, S., Oskarsson, N., and Hulsebosch, T. (1996). Sulfur, chlorine, and fluorine degassing and atmospheric loading by the 1783–1784 AD Laki (Skaftár Fires) eruption in Iceland. Bull. Volcanol. 58, 205–225. doi: 10.1007/s004450050136
Thordarson, T., and Self, S. (2003). Atmospheric and environmental effects of the 1783–1784 Laki eruption: a review and reassessment. J. Geophys. Res. 108, 4011. doi: 10.1029/2001JD002042
Timmreck, C., Graf, H. F., Lorenz, S. J., Niemeier, U., Zanchettin, D., Matei, D., et al. (2010). Aerosol size confines climate response to volcanic super-eruptions. Geophys. Res. Lett. 37, L24705. doi: 10.1029/2010GL045464
Timmreck, C., Graf, H. F., Zanchettin, D., Hagemann, S., Kleinen, T., and Krüger, K. (2012). Climate response to the Toba super-eruption: regional changes. Quat. Int. 258, 30–44. doi: 10.1016/j.quaint.2011.10.008
Ungarish, M., Johnson, C. G., and Hogg, A. J. (2014). A novel hybrid model for the motion of sustained axisymmetric gravity currents and intrusions. Euro. J. Mech. (in press).
van der Kaars, S., Bassinot, F., De Deckker, P., and Guichard, F. (2010). Changes in monsoon and ocean circulation and the vegetation cover of southwest Sumatra through the last 83,000 years: the record from marine core BAR94-42. Palaeogeogr. Palaeoclimatol. Palaeoecol. 296, 52–78. doi: 10.1016/j.palaeo.2010.06.015
Woods, A., and Kienle, J. (1994). The dynamics and thermodynamics of volcanic clouds: theory and observations from the April 15 and April 21, 1990 eruptions of Redoubt Volcano, Alaska. J. Volcanol. Geotherm. Res. 62, 273–299. doi: 10.1016/0377-0273(94)90037-X
Woods, A. W., and Bower, S. M. (1995). The decompression of volcanic jets in a crater during explosive volcanic eruptions. Earth Planet. Sci. Lett. 131, 189–205. doi: 10.1016/0012-821X(95)00012-2
Woods, A. W., and Wohletz, K. (1991). Dimension and dynamics of co-ignimbrite eruption columns. Nature 350, 225–227. doi: 10.1038/350225a0
Keywords: tephra dispersal, super-eruption, Toba, Youngest Toba Tuff, volcanic impact
Citation: Costa A, Smith VC, Macedonio G and Matthews NE (2014) The magnitude and impact of the Youngest Toba Tuff super-eruption. Front. Earth Sci. 2:16. doi: 10.3389/feart.2014.00016
Received: 26 April 2014; Accepted: 08 July 2014;
Published online: 04 August 2014.
Edited by:
Vera Ponomareva, Institute of Volcanology and Seismology, RussiaReviewed by:
Ilya Bindeman, University of Oregon, USARoberto Sulpizio, Università degli Studi di Bari, Italy
Helen Webster, Met Office, UK
Copyright © 2014 Costa, Smith, Macedonio and Matthews. This is an open-access article distributed under the terms of the Creative Commons Attribution License (CC BY). The use, distribution or reproduction in other forums is permitted, provided the original author(s) or licensor are credited and that the original publication in this journal is cited, in accordance with accepted academic practice. No use, distribution or reproduction is permitted which does not comply with these terms.
*Correspondence: Antonio Costa, Istituto Nazionale di Geofisica e Vulcanologia, Via D. Creti 12, Bologna, Italy e-mail: antonio.costa@bo.ingv.it