A new circulation type classification based upon Lagrangian air trajectories
 Alexandre M. Ramos1*
  Michael Sprenger2
  Heini Wernli2
  Ana M. Durán-Quesada3
  Maria N. Lorenzo4
  Luis Gimeno4
- 1Instituto Dom Luiz, Faculdade de Ciências, Universidade de Lisboa, Lisboa, Portugal
- 2Institute for Atmospheric and Climate Science, ETH Zurich, Zurich, Switzerland
- 3School of Physics and Center for Geophysical Research, University of Costa Rica, San Jose, Costa Rica
- 4Environmental Physics Laboratory, Universidad de Vigo, Ourense, Spain
A new classification method of the large-scale circulation characteristic for a specific target area (NW Iberian Peninsula) is presented, based on the analysis of 90-h backward trajectories arriving in this area calculated with the 3-D Lagrangian particle dispersion model FLEXPART. A cluster analysis is applied to separate the backward trajectories in up to five representative air streams for each day. Specific measures are then used to characterize the distinct air streams (e.g., curvature of the trajectories, cyclonic or anticyclonic flow, moisture evolution, origin and length of the trajectories). The robustness of the presented method is demonstrated in comparison with the Eulerian Lamb weather type classification. A case study of the 2003 heatwave is discussed in terms of the new Lagrangian circulation and the Lamb weather type classifications. It is shown that the new classification method adds valuable information about the pertinent meteorological conditions, which are missing in an Eulerian approach. The new method is climatologically evaluated for the 5-year time period from December 1999 to November 2004. The ability of the method to capture the inter-seasonal circulation variability in the target region is shown. Furthermore, the multi-dimensional character of the classification is shortly discussed, in particular with respect to inter-seasonal differences. Finally, the relationship between the new Lagrangian classification and the precipitation in the target area is studied.
Introduction
The interest in the relationship between circulation types and surface climate increased in the last decades. Circulation type classifications were recently applied in climate studies (Huth et al., 2008; Jacobeit, 2010) and to investigate how the frequency of circulation types is associated with changes in surface weather parameters like precipitation (e.g., Goodess and Palutikof, 1998; Fowler and Kilsby, 2002; Kyselý, 2008; Jones and Lister, 2009). In a certain region and at a given time, the atmospheric circulation can be described in different ways, which is reflected in the large number of different circulation-based classifications (Huth et al., 2008; Philipp et al., 2010). Traditionally, circulation types are specific to a certain region and result from the examination of gridded synoptic weather data, typically based on sea level pressure (SLP) or geopotential height at 500 hPa (H500). These types are often defined for each day or a group of consecutive days and tend to reflect the circulation in a certain region (e.g., Hess and Brezowsky, 1952; Kruizinga, 1979; Jones et al., 1993; Philipp et al., 2007). Since these types are based on fields of SLP or H500 at one time instant, they are called Eulerian classifications.
The analysis of trajectories approaching a target region provides an alternative possibility of studying circulation types (e.g., Stohl and Scheifinger, 1994; Jorba et al., 2004; Nyanganyura et al., 2008). For such applications, Lagrangian models, which divide the atmosphere into a finite number of air parcels moving according to the three-dimensional winds (Stohl, 1998; Stohl et al., 2001), are very useful. The path followed by the air parcels, i.e., the trajectory, accurately characterizes the history of the air streams arriving at a specific site. Trajectory analyses are commonly used in air quality studies and cluster analysis is often used to handle large sets of trajectories (e.g., Dorling et al., 1992; Riccio et al., 2007). These studies mainly rely on the position (latitude, longitude, and height) of the air parcels. If specific humidity along the trajectories is also considered, they can be used to study atmospheric moisture transport by tracking air parcels moving to a given area (James et al., 2004; Dirmeyer and Brubaker, 2006) or to identify moisture sources of precipitation events (Sodemann et al., 2008). Trajectory analysis has also been used to examine meteorological phenomena like warm conveyor belts and tropical moisture export (e.g., Wernli and Davies, 1997; Stohl, 2001; Eckhardt et al., 2004; Knippertz and Wernli, 2010).
In this work, a new classification method of the synoptic-scale circulation is presented. It is based on the analysis of backward trajectories and determines the representative airflow to the target region (Northwest Iberian Peninsula) for each day at 12 UTC. The new method is compared to an automated version of the Eulerian Lamb weather type classification (LWT, Lamb, 1972; Jones et al., 1993). Additionally, the relationship between each circulation type and precipitation is analyzed in order to investigate whether the new method is able to distinguish different precipitation characteristics. Section Target Region and Data Sets provides a brief description of the target region and the data sets used. In Section A New Classification Based on Lagrangian Backward Trajectories, the new circulation type classification is described in detail and applied to a case study. Section Inter-Seasonal Variability of Individual Characteristics presents an analysis of the seasonality of the distinct classes and flow characteristics, followed by the link between the Lagrangian classification and precipitation in the target region in Section Precipitation Associated with Trajectory Types. The co-occurrence of the Lagrangian characteristics is studied (Section Combined Characteristics) and the Lagrangian classification is compared with the LWT (Section Comparison of Lamb Weather Types and Lagrangian Circulation Types). Finally, Section Summary and Conclusions summarizes the main results.
Target Region and Data Sets
Region and Precipitation Data
The northwestern Iberian Peninsula (NW IP) (41°N–44.5°N and 10°W–6°W), surrounded by the Atlantic Ocean and the Cantabrian Sea, is often affected by the passage of cold fronts associated with the storm track in the North Atlantic (Trigo, 2005). Gómez-Gesteira et al. (2011) comprehensively studied the climate of the NW IP during the last 40 years. In general, the coastal and adjacent areas are characterized by a maritime climate with mild summers and rainy winters. The interior regions are characterized by a continental climate with dry summers and cold winters. The atmospheric circulation of the area, under the influence of the mid-latitude weather systems of the North Atlantic, is determined by two main centers of activity: an anticyclone south of 40°N centered near the Azores (Azores High) and a low pressure area centered around 60°N near Iceland (Iceland Low). A thermal low develops over the IP from April to September, giving rise, in combination with the Azores High, to equatorward coastal winds in the NW IP (Hoinka and de Castro, 2003). Previous studies have shown that the precipitation variability in the region is linked to the main North Atlantic modes of low frequency variability: the North Atlantic Oscillation (NAO), the Scandinavia pattern (SCA) and the East Atlantic/West Russia Pattern (EA/WR) (Lorenzo and Taboada, 2005; deCastro et al., 2006; Ramos et al., 2010). Different circulation type methodologies were applied successfully in the IP (e.g., Romero et al., 1999; Trigo and DaCamara, 2000; Esteban et al., 2005; Lorenzo et al., 2008).
The correlation between the variability in precipitation at the Lourizán weather station (42.42°N, 8.67°W) and the variability in precipitation in the North-Atlantic European sector (data from the Global Precipitation Climatology Project) was reviewed by Lorenzo et al. (2008). It was found that the precipitation data from Lourizán station is representative of the precipitation in the entire NW IP area.
Trajectory Dataset
Backward trajectories were generated using the Lagrangian dispersion model FLEXPART (Stohl et al., 2005). This model has been applied in a variety of studies on, e.g., atmospheric transport (James et al., 2008; Stohl and Sodemann, 2010), convection and pollution (Palau et al., 2009), biomass burning (Cammas et al., 2009), and source-receptor relationships (Paris et al., 2010). In this study, 6-h ECMWF meteorological analysis data was used as input for the FLEXPART model for the period from 1/11/1999 to 30/11/2004. Positions of each particle (latitude, longitude and height) as well as its physical properties (specific humidity, density, and temperature) were recorded at each time step. The atmosphere was divided into a total of 1,398,800 homogeneous air parcels (referred to as particles) homogeneously distributed over the entire globe. Three-dimensional winds and other fields from ECMWF ERA-40 Reanalysis data were used to set the meteorological conditions for the particles. A set of parameterizations describes the subgrid-scale physical processes within the FLEXPART model, for details see the FLEXPART technical note (Stohl et al., 2005). At any given time, the particles in the target region (NW IP) and the vertical layer from the surface to 14 km were selected for studying their backward trajectories in more detail (see Section A New Classification Based on Lagrangian Backward Trajectories).
Definition of the Lamb Weather Types
The daily SLP fields were retrieved from the NCEP/NCAR reanalysis (Kalnay et al., 1996) on a 2.5° grid. Eulerian circulation types computed for Galicia by Lorenzo et al. (2008) are used in this study, based on the daily SLP fields. This classification is an automated version of the LWT procedure (Jones et al., 1993). In recent years, this method has been successfully applied to other European regions (Goodess and Palutikof, 1998; Trigo and DaCamara, 2000). The circulation conditions are determined using physical or geometrical parameters, such as the direction and strength of the airflow, and the degree of cyclonicity based on 16 grid points. This method distinguishes between 26 different circulation types (including hybrid ones). In this study, 12 circulation types are analyzed, eight determined by the direction of the flow (NE, E, SE, S, SW, W, NW, N), two by the shear vorticity [cyclonic (C) or anticyclonic (A)], and two hybrid ones [hybrid cyclonic (HC) and hybrid anticyclonic (HA)].
For the sake of brevity, we do not describe in detail the LWT methodology. Additional information regarding the LWT can be found in previous publications by the authors (e.g., Lorenzo et al., 2008; Ramos et al., 2011). The frequency of each LWT is shown in Table 1. Circulation type A is the most frequent one with almost 25% of the days followed by the SW and W type. Since the HC and HA circulation types are a mixture of all the hybrid directional types, the following discussion is only focused on the pure types.
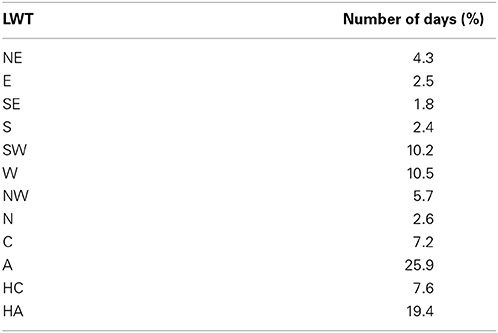
Table 1. Frequency (%) of occurrence of Lamb circulation weather types during the 1/12/1999 to 30/11/2004 period.
A New Classification Based on Lagrangian Backward Trajectories
From the global dataset, the particles that arrive to the NW IP on a particular day are selected and the classification is based on the properties of these air particles. In our case, the number of daily trajectories ranges approximately between 50 and 400. The number of air particles has a seasonal cycle with higher values in winter and lower values in summer. The main idea is to find the representative airflows that arrive in the NW IP. The applied procedure is as follows: (i) a two-step clustering is applied (Section Clustering of Trajectories) to find a maximum of five distinct air streams representing the flow on a particular day, each of them characterized by the temporal evolution of latitude, longitude, height, specify humidity and distance to the target region; (ii) the representative backward trajectories are further analyzed and characterized by four distinct Lagrangian flow properties (Section New Characteristics and Dynamical Classification). This classification enables to attribute an “index” for each of the four flow properties to each air stream.
In Section Clustering of Trajectories and New Characteristics and Dynamical Classification a detailed description of the new classification procedure is given, while a diagram summarizing the method is shown in Figure 1. The resulting classification catalog for the 5 years and a specific case study are presented in Section Final Catalog and Case Study Example.
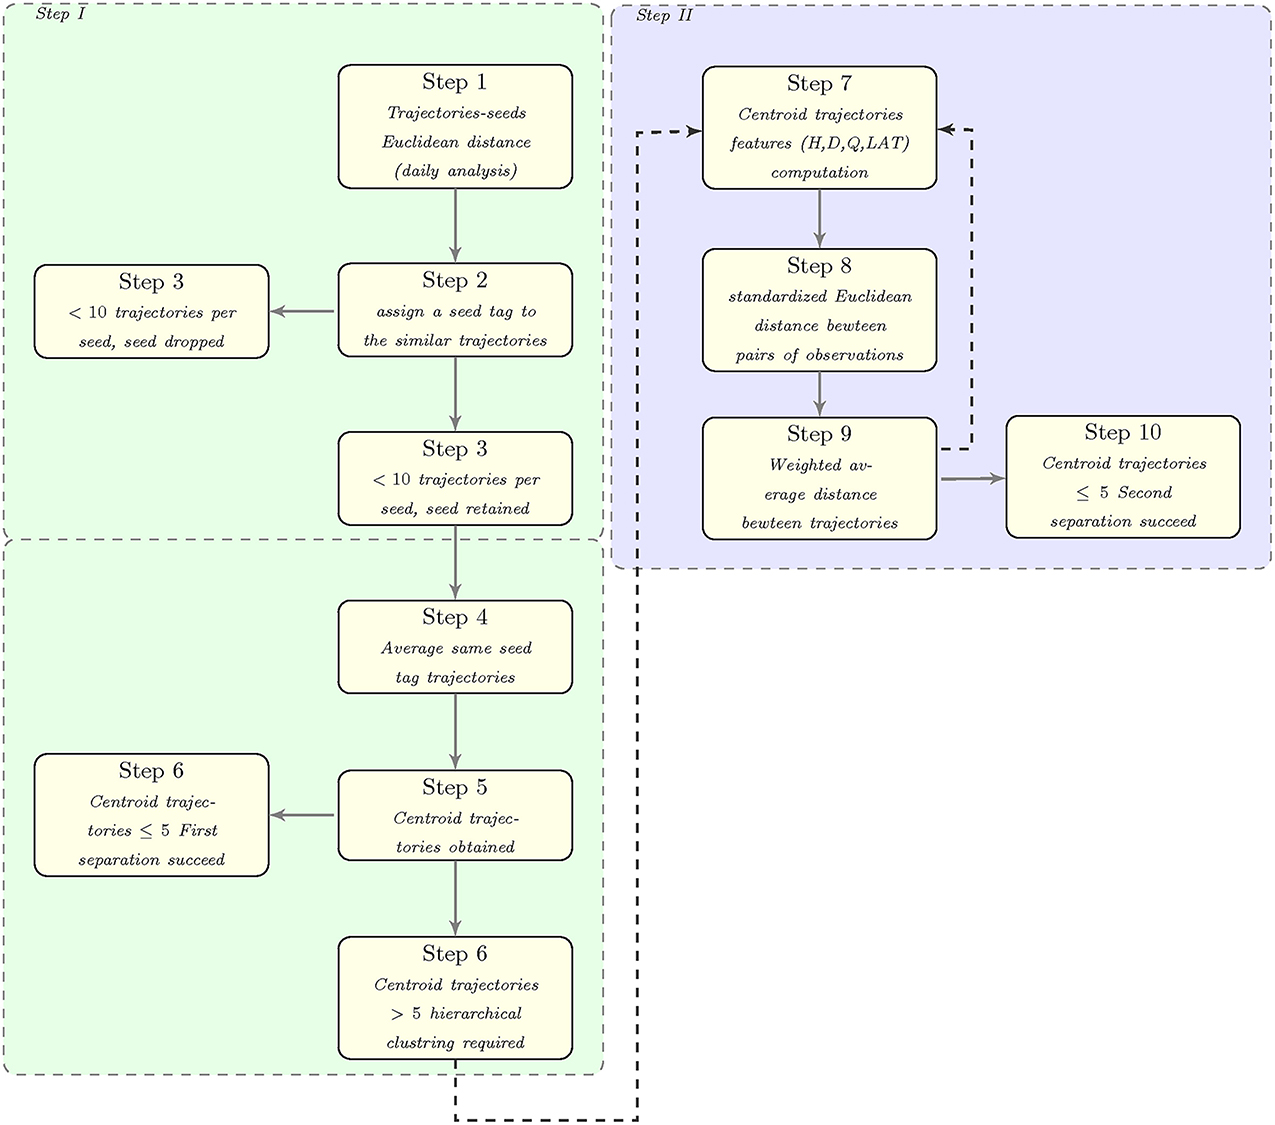
Figure 1. Diagram summarizing the synoptic-scale circulation classification method based on Lagrangian Backward Trajectories.
Clustering of Trajectories
Trajectories of air parcels that are in the target domain at the chosen time step were selected and the respective 90-h backward trajectories were retrieved from the global dataset. The circulation types, for each day at 12 UTC, were assumed to be characterized by at most five distinct air streams (trajectory clusters). A two-step clustering is used in order to obtain at most five distinct air streams. This choice of a maximum of five air streams is not arbitrary. A preliminary analysis (not shown) showed that the most frequent number of clusters per day is 5, therefore this is considered to be the optimal number of distinct air streams per day.
First clustering step
The squared Euclidean distance is used as a similarity measure between the members of a predefined set of trajectories. The aim is to horizontally separate different air streams. The approach is based on the first part of the method proposed by Dorling et al. (1992), see their sections 2a to 2c for details. The method uses the latitude-longitude coordinates to separate the different air streams. An example for a particular day (11/11/1999) is provided in Figure 2 with the color lines showing the trajectories of different clusters and the thick black lines representing the centroid trajectory of each cluster, which is defined at each time as the average of the latitude-longitude coordinates and the meteorological variables (see Section Trajectory Dataset) of the trajectories in that cluster. In the Dorling method there is no need to set an a priori number of clusters. The method is able to autonomously determine the number of clusters (based only, as mentioned before, on the latitude and longitude information) for a given day. Clusters with less than 10 trajectories are not included in the next clustering step. This is done to keep only the most representative air streams for a given day. If less than five centroid trajectories are found, the assumption is made that they are meteorologically different and no additional action is required. On the other hand, if the number of clusters from the first (horizontal) clustering exceeds five, a second (hierarchical) clustering is performed based on the centroid trajectories of the previous clustering step.
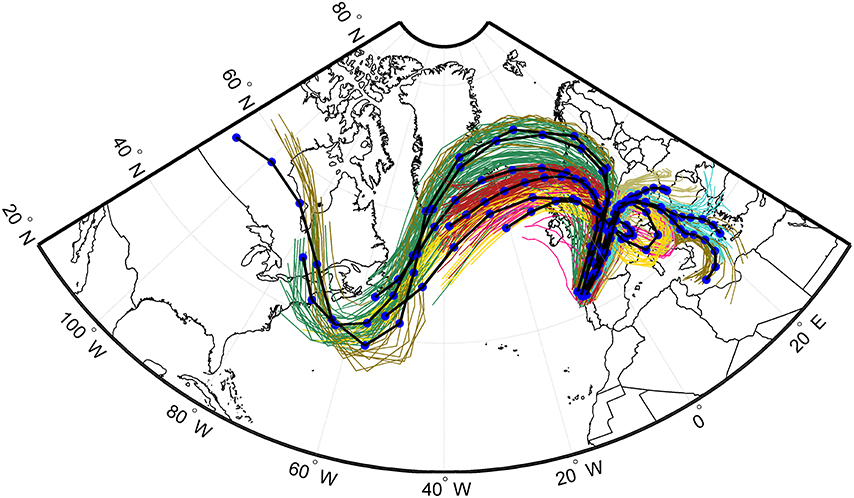
Figure 2. Backward trajectories (90 h) arriving to the northwest Iberia Peninsula (41°N–44.5°N and 10°W–6°W) on a particular day (11/11/1999—12 UTC) in color lines and the respective clusters position (blue dots) computed by the Dorling method (dark lines).
Second clustering step
Information of the height of the centroid trajectory (H), the distance to the target area (D), specific humidity (Q) and latitude (LAT) are used as main characteristics of the trajectories at each time step. Hierarchical clustering constructs a hierarchy of sets of groups, each of which is formed by merging one pair from the collection of previously defined groups. A linkage criterion, which specifies the dissimilarity of the trajectories as a function of the pairwise distances of observations, is also used (Wilks, 2006). Here, the dissimilarity of the trajectories is the weighted average distance (Hastie et al., 2009). This process is iterated until the maximum number of clusters in the hierarchical clustering converges to five. It is important to point out that the centroids of the hierarchical clustering are computed initially based on the centroid trajectories taken from the non-hierarchical clustering.
Finally, a maximum of five distinct air streams represent the flow on a particular day, each being characterized by their temporal evolution of latitude, longitude, height, specify humidity and distance to the target region. As an example, the hierarchical clustering for the day shown in Figure 2 is provided in Figure 3, where the time evolution of the back trajectory properties for each variable used in the clustering is also shown.
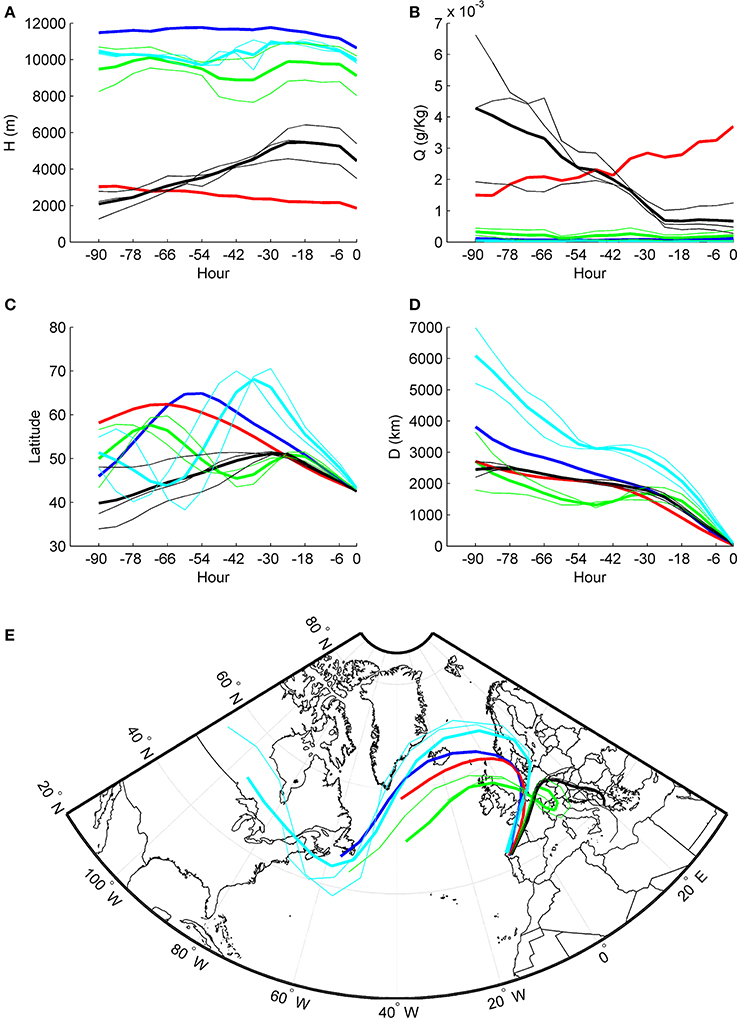
Figure 3. Time evolution of the back-trajectory properties for (A) height of trajectory (H), (B) specific humidity (Q), (C) latitude and (D) distance to the center (D) shown in Figure 1. The colored thin line corresponds to the centroid trajectories (previous computed with the Dorling method) while the colored thick lines correspond to the final five air streams characterizing the day (see text for details). In (E) the final air streams are shown. The color code is the same as in (A–D)
New Characteristics and Dynamical Classification
Once the trajectories were reduced to a maximum of five clusters, a dynamical classification was done based on four distinct Lagrangian flow properties. This classification enables the attribution of an “index” for each of the four studied parameters to each air stream. Therefore, the representative flows were classified using their temporal evolution of latitude, longitude, height, specify humidity and distance to the target region. A description of the respective characteristics and criteria is given below with a summary in Table 2. The flow properties chosen were: (a) the moisture uptake during the path of the air mass; (b) zonality of the flow; (c) cyclonicity of the flow, and (d) the traveled distance and origin of the air mass. We considered that this set of 4 characteristics allow a detailed classification of the main air masses that arrive in the NW IP. For each characteristic, a reasonable number of classes are defined.
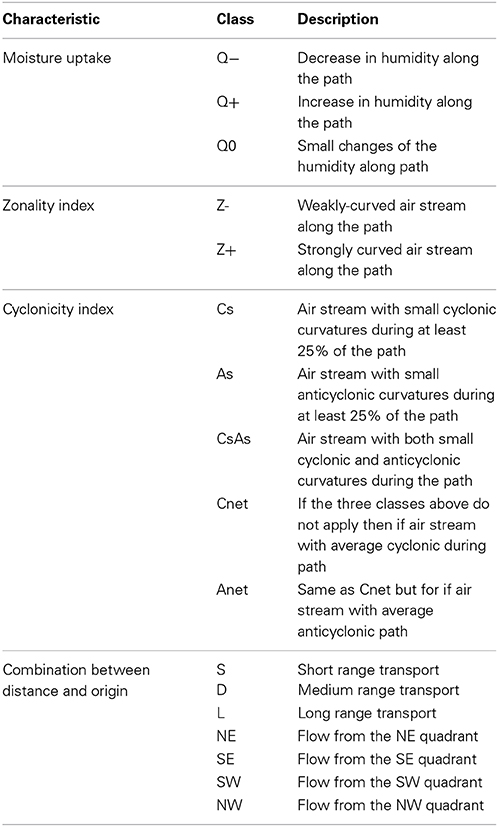
Table 2. Characteristics and respective classes used to classify the representative air masses.
Moisture uptake (MU)
MU describes the moisture uptake of the air stream. It represents the change in specific humidity (ΔQ) of an individual air stream from the initial point (i) to the arrival in the target region (f), computed as:
The histogram of ΔQ (Figure 4A) for all air streams resembles a normal distribution and the division is made into three classes: (Q−) ΔQ in the lower tercile of the distribution; it corresponds to a decrease in humidity along the path; (Q+) ΔQ in the upper tercile of the distribution; it corresponds to an increase in humidity along the path; and (Q0) if ΔQ falls between the two classes mentioned above; it corresponds to small changes (positive or negative) of the humidity along path.
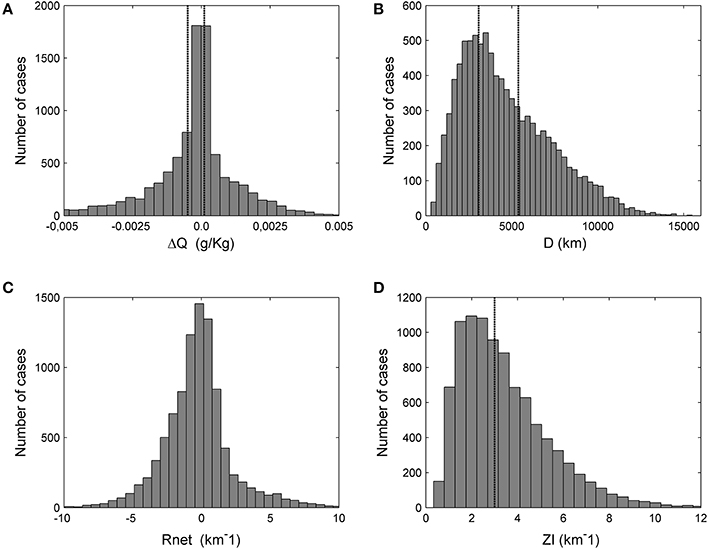
Figure 4. Histograms distribution for: (A) integrated changes in specific humidity (Q), (B) distance “traveled” by the particle (D); (C) integrated value of the curvature (Rnet) and (D) integrated absolute value of the curvature (ZI). For Q and D the tercile values are indicated with a dotted black line and for ZI the 50% percentile.
Distance and origin (DO)
This feature classifies each air stream both in terms of integrated distance D along the air stream (short, medium and long range transport) and its initial position. A four-point compass is centered in the domain allowing 90° per sector (see Figure 5 for details) and the variable O (origin quadrant) therefore can take on four discrete values (NE, SE, SW, and NW). O is determined by the position of the initial point of the air stream. The histogram of D is shown in Figure 4B for all air streams, and it is divided into three classes: (S) D in the lower tercile of the distribution (less than 3076 km), corresponding to short range transport; (M) D in the middle tercile of the distribution (greater than 3076 km and less than 5391 km), corresponding to medium range transport; and (L) D in the upper tercile of the distribution (greater than 5391 km), corresponding to long-range transport. As an example, if an air stream is classified as L-SW in terms of DO it means that it experienced long-range transport and its initial point was in the 3rd quadrant (SW).
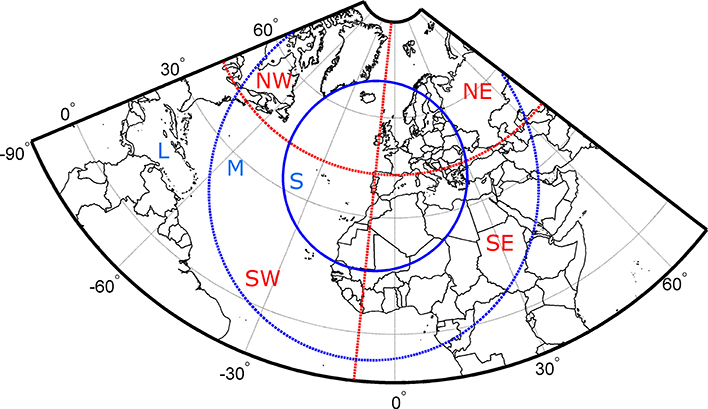
Figure 5. Definition for the Distance and Origin (DO) characteristic for the air streams. The circles separate the different distance (D) classes: short range (S), medium range (M), and long range (L).The origin of the air streams is split into the four regions SW, NW, SE, and NE. In total, 12 classes result for DO.
Cyclonicity index (CI)
This index determines whether the flow is cyclonic or anticyclonic, and to which extent this applies. It is based on the radius of curvature (R) of the air stream and combines three flow features:
(a) RC, the percentage of the air stream with a small cyclonic radius of curvature between 0 and 1000 km; as an example, if RC is 25%, 25% of the air stream has a small cyclonic radius of curvature.
(b) RA, the corresponding percentage with a small anticyclonic radius of curvature between 0 and 1000 km.
(c) Rnet, the net curvature of the flow (negative for anticyclonic and positive for cyclonic) computed by integrating the value of the curvature along the air stream (the histogram for Rnet is presented in Figure 4C):
Based on these three flow features the following five classes of the Cyclonicity Index CI are defined: (Cs) RC > 25% and RA < 25%, the air stream has small cyclonic curvatures during at least 25% of the path; it is strongly affected by meso- and synoptic-scale cyclonic systems (e.g., extra-tropical cyclones); (As) RA > 25% and RC < 25%, the air stream has small anticyclonic curvatures during at least 25% of the path; (CsAs) RC > 25%, and RA > 25%, during the path the air stream has both small cyclonic and anticyclonic curvatures; if the three classes above do not apply then Rnet, is used: (Cnet) if Rnet > 0, i.e., on average cyclonic path; and (Anet) for an average anticyclonic path, i.e., Rnet < 0.
Zonality index (ZI)
ZI describes the curvature of the path of the air streams (curved or straight). It is computed by integrating the absolute value of the radius of curvature (R) for each sub-section of the air stream:
It can be seen as a Lagrangian based zonality index—the term “zonality” is used in a generalized way and serves here to distinguish between weakly curved and strongly undulating flows. The histogram of ZI (Figure 4D) shows a positively skewed distribution. It is divided into two classes: (Z−) ZI below the median, corresponding to a weakly curved air stream; and (Z+) ZI above the median, corresponding to a strongly curved air stream.
Final Catalog and Case Study Example
The purpose of Section Clustering of Trajectories and New Characteristics and Dynamical Classification is to have a final catalog of the properties of the air streams that arrive each day which are expressed by the four parameters (MU, ZI, CI, and DO) described above and listed in Table 2. A sample of the catalog from 01/12/1999 to 18/02/2000 is provided in Figure 6. Additionally, 1 day or multiple days can be characterized by a single string of labels indicating the most frequent classes encountered for each characteristic. For example, the classification [Q−, Z+, Anet, L-SW], corresponds to the first air stream of the first day (01/12/1999) and is shown in Figure 6. In such a situation the majority of the air streams had respectively: a decrease in humidity during the path, a significantly curved trajectory, a mean anticyclonic path, and a long-distance pathway from the SW quadrant.
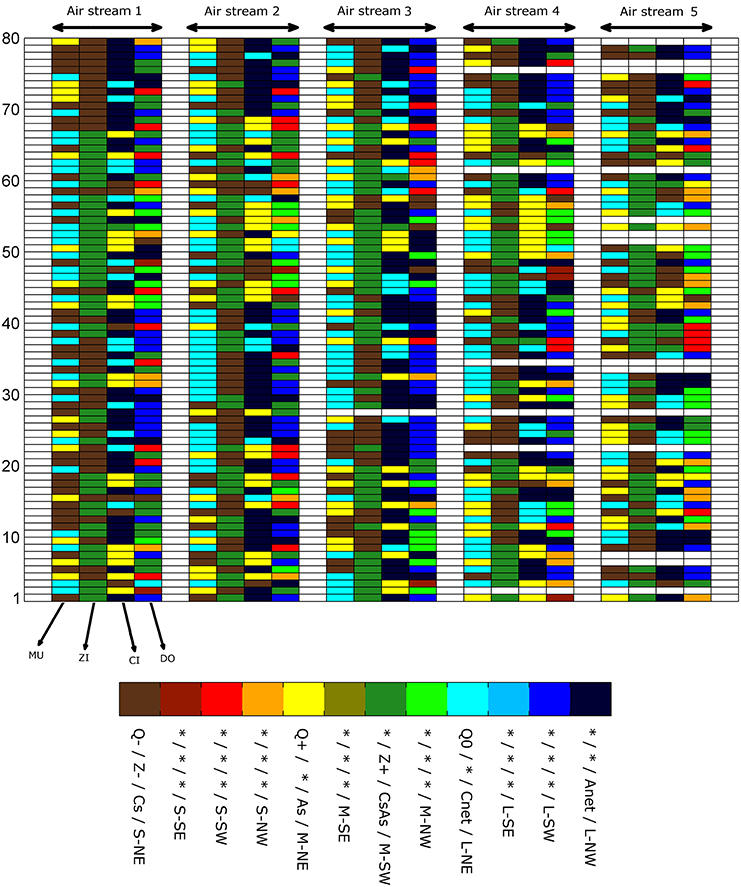
Figure 6. Representation of the final catalog for 80 first days (from 01/12/1999 to 18/02/2000). Each day is characterized by at most five air streams and each air stream can be described by four flow properties (MU, ZI, CI, and DO), as discussed in Section A New Classification Based on Lagrangian Backward Trajectories. The legend should be interpreted like this: for different categories the colors indicates a different class. For example, the first air stream of the first day (01/12/1999) is classified has [Q−, Z+, Anet, L-SW]. The * in the legend indicates that there is no correspondent class.
As a more specific example, we consider the heatwave event of 2003 (01/08/2003 to 15/08/2003), which stroke not only Central Europe (Garcia-Herrera et al., 2010) but also the NW IP (Trigo et al., 2009; deCastro et al., 2011). The northward displacement of the North Atlantic Subtropical High is recognized to be the most probable mechanism responsible for the August 2003 heatwave (e.g., Black et al., 2004; deCastro et al., 2011). The correspondent daily LWT for this period is shown in Table 3. Most of the days are A-related types followed by type C, which occurs probably due to the thermal low that frequently develops over the IP in summer (Hoinka and de Castro, 2003). Additional information can be retrieved from the statistics of the Lagrangian types during this event (Figure 7). Short-range transport dominates (almost 2/3 of the air streams). In addition, there is advection of African air to the IP. Concerning MU, Q+ (increase in specific humidity) is the most frequent class. Regarding CI, the most frequent classes are As (small anticyclonic curvatures) and Cnet (air streams with averaged cyclonic path). This is very interesting because the Lagrangian method is not only able to capture the thermal low, responsible for the re-circulations in the IP with short range transport, but also the anticyclonic circulation associated with medium and long-range transport. This heatwave event, according to the Lagrangian classification, is categorized as [Q+, Z+, As, S-SW].
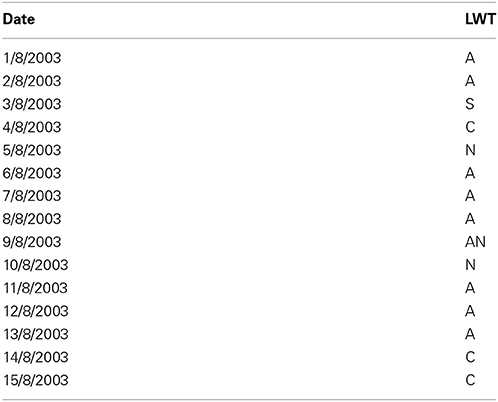
Table 3. Lamb weather types for each day of the (a) heatwave case study (1/8/2003 to 15/8/2003).
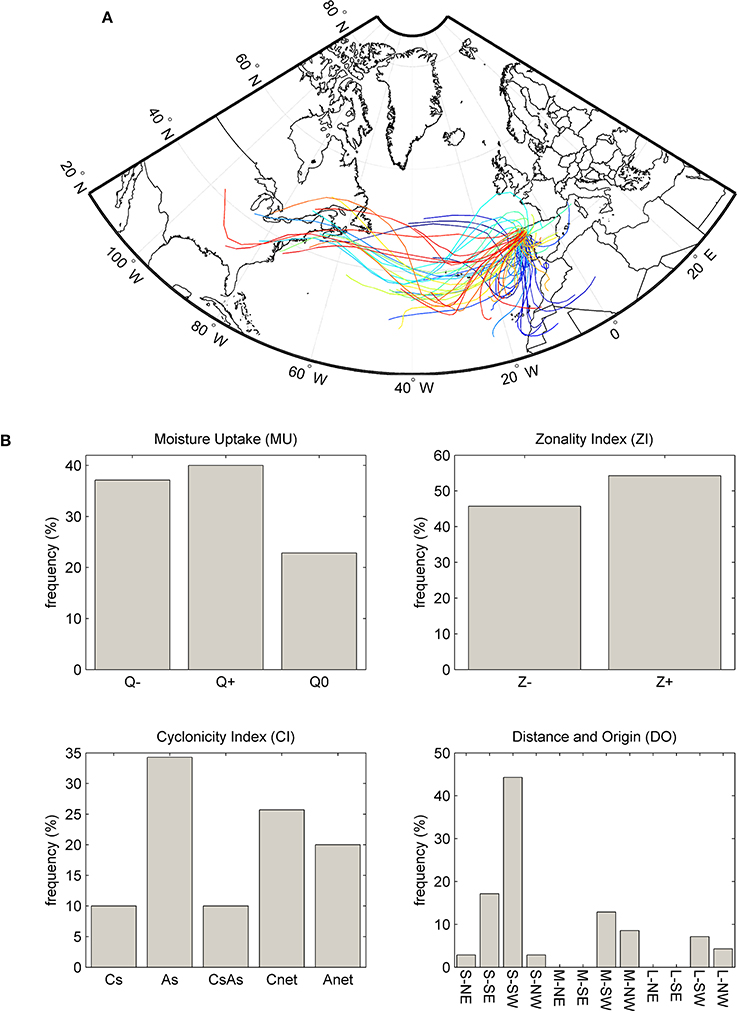
Figure 7. (A) Air streams (each color represent a different day) and (B) characteristics of the trajectory types classification for the heatwave case study (01/08/2003 to 15/08/2003).
Further case studies can be found in the Supplementary Material S1, where additional typical weather situations in the target region are discussed: a cold frontal passage, a cut-off low and a blocking high.
Climatological Assessment
Inter-Seasonal Variability of Individual Characteristics
In this section we analyze if the new method presented in Section A New Classification Based on Lagrangian Backward Trajectories is able to distinguish the inter-seasonal circulation variability in the region (Lorenzo et al., 2008; Gómez-Gesteira et al., 2011), and to this end the mean frequency of the different characteristics of air streams is examined for all seasons: winter (DJF), spring (MAM), summer (JJA), and autumn (SON). In addition, the respective seasonal standard deviation is used to have an insight of the inter-annual variability.
The analysis first focuses on the DO characteristic (Distance and Origin) (Table 4). Results show that the western quadrants (S-SW, S-NW, M-SW, M-NW, L-SW, L-NW) are found more frequently than the eastern ones (S-SE, S-NE, M-SE, M-NE, L-SE, L-NE) in all seasons, which reflects the fact that most of the time the domain is under the influence of the westerlies, in good agreement with previous weather type analyses such as Spellman (2000). A remarkable difference between winter and summer occurs for the transport distance. Short transport classes are more frequent in summer (almost 43%) while the frequency of long-range transport is larger in winter (nearly 45%). This is in line with the intensification of the Northern Hemisphere jet stream in winter compared to summer. In addition, the poleward shift by about 10° latitude of the belt of westerlies in summer (Peixoto and Oort, 1992) is captured by the method. The atmospheric circulation in summer in the IP is, most of the time, under the influence of a thermal low (Hoinka and de Castro, 2003). This thermal low is responsible for short-range transport and re-circulations in the region. Finally, differences between spring and autumn are small. The highest standard deviation is in general found in the transitions season's spring and autumn.
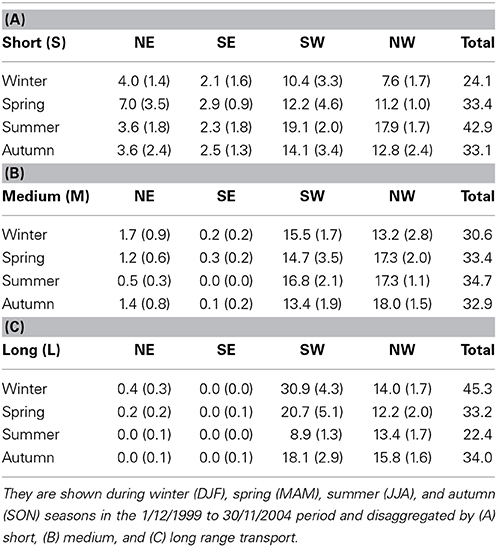
Table 4. Mean frequencies (%) of occurrence of the different classes for category Distance and Origin (DO) and the respective standard deviation (%) in brackets.
For the MU parameter (Moisture Uptake), Figure 8A shows that Q0 dominates in winter and spring, i.e., only small changes (positive or negative) of humidity are found along the air streams. In contrast, Q+ is the most frequent class in summer corresponding to an increase of humidity along the path. This fact can be associated with high values of sea surface temperature (SST) of the Atlantic Ocean and Mediterranean Sea, favoring evaporation in summer. In autumn, Q− is the most frequent class, associated with a loss of humidity due to precipitation along the air stream. The seasonal variability (standard deviation) is relatively small for the MU parameter.
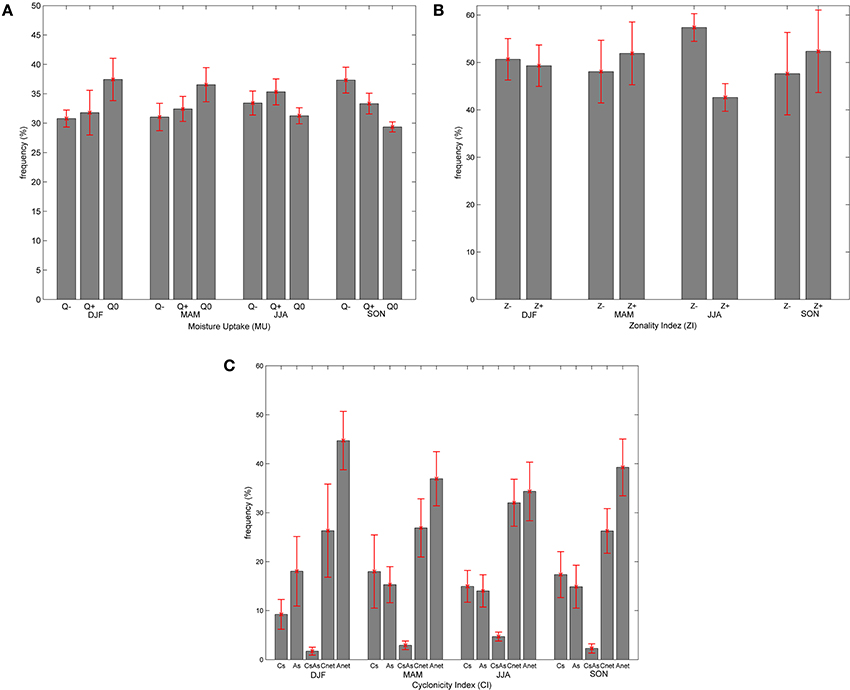
Figure 8. Frequencies (%) of occurrence of the different characteristics for (A) Moisture Uptake (MU), (B) Zonal Index (ZI), and (C) Cyclonicity Index (CI), during winter (DJF), spring (MAM), summer (JJA), and autumn (SON) seasons in the 1/12/1999 to 30/11/2004 period. The respective seasonal standard deviation is also shown (red lines).
With respect to ZI (Zonality Index) (Figure 8B), Z+, i.e., strongly curved air streams, are more frequent during the transition seasons. The frequencies of the classes differ clearly in winter and summer. In summer, Z− is more frequent than Z+, while in winter both classes have similar frequencies. Again, the highest standard deviations are found for spring and autumn.
The frequency distribution for CI (Cyclonicity Index) (Figure 8C) is again similar for the different classes during spring and autumn, with Anet being the most frequent class. In winter the most frequent class is Anet with 45% of the cases followed by the averaged cyclonic class (Cnet) with a frequency near 25%. For summer the averaged anticyclonic and cyclonic classes (Anet and Cnet) have similar frequencies (near 32%) and also the classes with small anticyclonic (As) and cyclonic curvature (Cs) exhibit similar frequencies (near 14%). In winter, as discussed above, most of the transport is long-range and from the western quadrants. In the selected domain, these quadrants correspond to the North Atlantic domain frequently associated with an anticyclonic CI. As mentioned before, in summer, it is interesting to note that most of the time the IP is under the influence of a thermal low (Hoinka and de Castro, 2003) and the method is able to identify this cyclonic feature in the region by an increase of the frequency of the cyclonic CI class. For CI the standard deviations are relativity high compared to the other characteristics (MU, ZI, and DO).
Precipitation Associated with Trajectory Types
Circulation types are often reflected in several surface climate variables (Goodess and Jones, 2002; Hope et al., 2006; Lorenzo et al., 2008). In the IP, the relationship is particularly strong with precipitation, therefore many studies have investigated the impact of circulation types on precipitation (Trigo and DaCamara, 2000; Lorenzo et al., 2008; Gómez-Gesteira et al., 2011). The most prominent differences occur between summer and winter (see Section Inter-Seasonal Variability of Individual Characteristics), and therefore results are only shown for these two seasons. For each season, the average rainfall associated with each class and its inter-annual variability has been computed. To do so, only the days with at least two air streams with the same class were chosen. This is done in order to choose only the days where a dominant class occurs. For instance, when computing the average rainfall related to the class Q− of the characteristic MU, only days with at least two air streams classified as Q− were chosen.
First of all, as expected, the average rainfall is higher in winter than in summer (Figure 9A). For MU, there is no difference in the average rainfall for the different classes during summer, while in winter a considerably higher average rainfall is found for Q+ than for the other classes. There is long-range transport mainly from the western quadrants for this season, conversely the lowest average rainfall is found for Q0 (small changes in humidity). For the ZI characteristic, there is no particular difference in precipitation during summer, while during winter higher values of average rainfall are found for the less curved trajectories (Z−). In the NW IP, most of the precipitation in winter is associated with extratropical cyclones within the storm track (Trigo, 2005), mainly via frontal systems passing over the region (Lorenzo et al., 2008). These frontal systems are typically characterized by rather straight air streams. The CI characteristic is particularly interesting in terms of the associated average rainfall. The cyclonic classes (Cs and Cnet) present the highest values of average rainfall and the anticyclonic classes (As and Anet) the lowest values. This result confirms the findings by Lorenzo et al. (2008), who showed that the cyclonic circulation types are most prominent in situations with rainfall in the NW IP. Finally the DO characteristic presents high variability of average rainfall for each class. In winter, it is found that the air streams that come mainly from the western quadrant (S-SW, S-NW, M-SW, M-NW, L-SW, L-NW) are associated with the highest values of average rainfall. For these air streams, the highest precipitation values occur for medium and long-range transport, in agreement with the results by Gimeno et al. (2010).
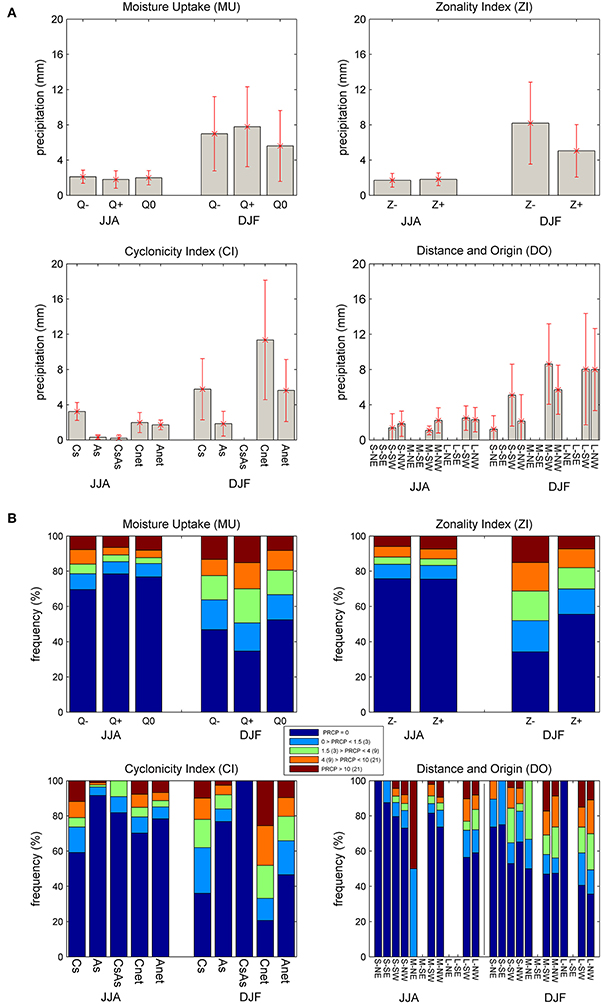
Figure 9. (A) Seasonal average precipitation (mm) and the corresponding inter-annual variability (red lines) attributed to the Lagrangian classes; (B) Contribution of each Lagrangian type (in %) to five different categories of precipitation. The definitions of each category of precipitation are shown for summer (winter) in the legend and are summarized in Supplementary Material S2.
As a final investigation, five classes of rainfall magnitude are defined: no rain, light rain, moderate, intense and very intense following the method adopted in previous studies (Osborn et al., 2000; Lorenzo et al., 2008). The definition of the rainfall magnitude classes for summer and winter can be found in Supplementary Material S2 and results are shown in Figure 9B. In general, the highest values of average rainfall (Figure 9A) correspond to the highest values of days with intense and very intense rainfall (Figure 9B). The most interesting case is perhaps related to CI where the cyclonic class (Cnet) has almost 50% of the cases considered as intense or very intense precipitation days. Conversely, for the anticyclonic class (As and Anet) most of the days (almost 80 and 70%, respectively) correspond to the no precipitation or light precipitation class.
Combined Characteristics
In this section, the combination of the different characteristics is considered, separately for summer and winter. The characteristics MU, ZI, CI, and DO span a 4-dimensional phase space, with in total 3 × 2 × 5 × 12 discrete “boxes” according to the number of classes for each characteristic—3 for MU; 2 for ZI; 3 for CI and 12 for DO (which in this section is divided into 3 (D) × 4(O) characteristics. But due to physical constraints some combinations are evidently rather unlikely. For instance, air streams that are classified as long-range transport for the east quadrants are very rare due to the typical westerlies in the target region.
In order to look to this phase space a multi panel plot is shown in Figure 10 with a total of 5 × 5 panels for each characteristic for both summer (a) and winter (b). Each panel consists of a small matrix with the frequency of occurrence between the corresponding characteristics, e.g., the panel in row 1 and column 2 (MU vs. ZI) is a 2 × 3 matrix according to the classes Z− and Z+ and Q−, Q+, and Q0. In each panel the circles of different sizes indicate the frequency with which a specific combination is found, i.e., the radius of the circles is proportional to this frequency. In addition, for each panel, the combination with the highest frequency is marked with a red dot. With this multi panel plot it is possible to see the combinations shift from summer to winter, especially for the CI, D, and O characteristics. For summer the most frequent air stream is [Q−, Z−, Anet, M-SW], while for winter it is [Q−, Z−, Anet, L-SW]. It is interesting to note that the most frequent air streams for summer and winter are almost the same; the only change is found for the DO characteristic (M-SW vs. L-SW). These air streams correspond to a decrease in humidity along the path within a mainly zonal and anticyclonically curved flow. This means that some of the humidity that is advected, e.g., from the Gulf of Mexico, across the North Atlantic is lost during transport.
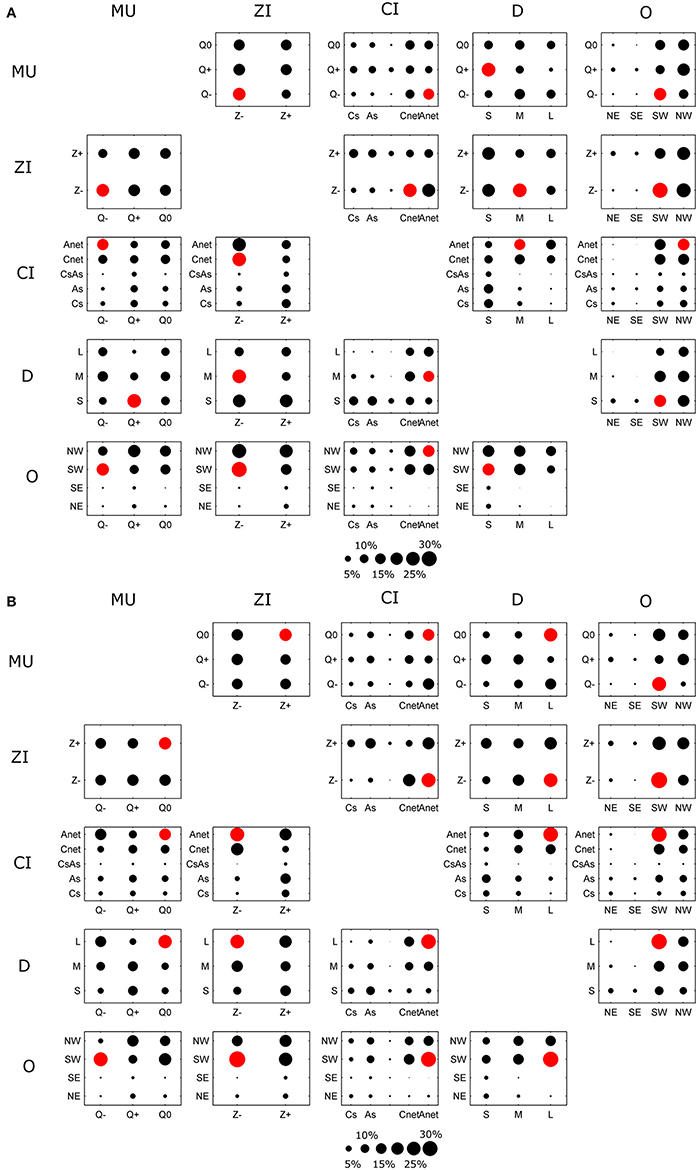
Figure 10. Multi-dimensional catalog frequencies for (A) summer and (B) winter. Each panel correspond the frequency of one characteristics compared with other. For example in the MU vs. ZI panel for summer and winter, it is shown that the most common combination for the Q− class is the Z− class. For each panel the combination with highest frequency is marked with a red dot.
Since an exhaustive description of Figure 10 is neither practical nor simple, the most common combinations are marked by red dots and will be further discussed for summer and winter. For the MU class Q-, the most frequent classes of the other characteristics are: Z-, Anet, and M-SW in summer and L-SW in winter, respectively. The latter is the most frequent combination in the entire catalog as mentioned before. For Q+ the most frequent combination is Z-, Cnet, and S-NW in summer and L-NW in winter, respectively.
Regarding the Z− category, the most frequent combination is Q−, Cnet and M-SW in summer, and Q+, Anet, and L-SW in winter. For Z+, the preferred combination is Q+, Cs, and S-SW in summer and Q0, Anet, and L-SW in winter. In summer this most frequent combination is associated with air streams that come from the SW, experience short-range transport and an increase in humidity along their path. In winter, the more meridional circulation (Z+) is often related with mean anticyclonic circulation that can be associated to blocking events.
The last characteristic discussed here is CI. There are no particular differences in the three classes that correspond to small-radius circulations (Cs, As, and CsAs), and we therefore focus on the Cnet and Anet classes. The most probable combination with Cnet in summer is Q0, Z−, and M-NW and in winter Q+, Z−, and L-SW, respectively. It is interesting to note that for summer Cnet is associated with Q0 while in winter it is more frequently associated with Q+. Regarding Anet, results for ZI, D, and O are very similar to the ones found for Cnet. The main difference occurs for MU with the most frequent class being Q− in summer and Q0 in winter.
Comparison of Lamb Weather Types and Lagrangian Circulation Types
For each day with a certain LWT, the frequency of the Lagrangian classes is analyzed. For MU (Figure 11A), there is a clear difference when comparing the easterly with the westerly types. In general, easterly types are characterized by small changes in humidity along the path, while the westerlies are characterized by a decrease in the humidity. The difference between the C and A type is also prominent; higher frequencies are found for Q+ in the case of C type and Q0 in the case of the A type. For the zonal index (ZI) (Figure 11B), a marked difference between easterly and westerly types is observed. The easterlies are characterized by more frequently curved trajectories (Z+) while the opposite occurs for the westerlies (less curved trajectories). The difference between the C type and the A types is also noticeable with the trajectories being frequently more curved in the C type than in the A type. Results for the cyclonicity index (CI) (Figure 11C) show a good differentiation between the frequencies of the five classes when comparing different circulation types. For example, in the C types the frequency of the air streams which have Cs (small cyclonic curvatures) and Cnet (averaged cyclonic trajectory) is very high, 40 and 37.5%, respectively. On the contrary, the A type presents higher frequencies for class As (small anticyclonic curvatures) and Anet (averaged anticyclonic curvatures). For the NW and W types also the Anet class is more frequent while for the SW types the Cnet class is more frequent. Regarding the distance characteristic (D) (Figure 11D), the frequencies of the different classes are expected to differ between the LWT. For the NE, E, SE, and S types nearly 45% of the air streams show short-range transport, while the SW, W, and NW types are typically characterized by medium and long-range transport.
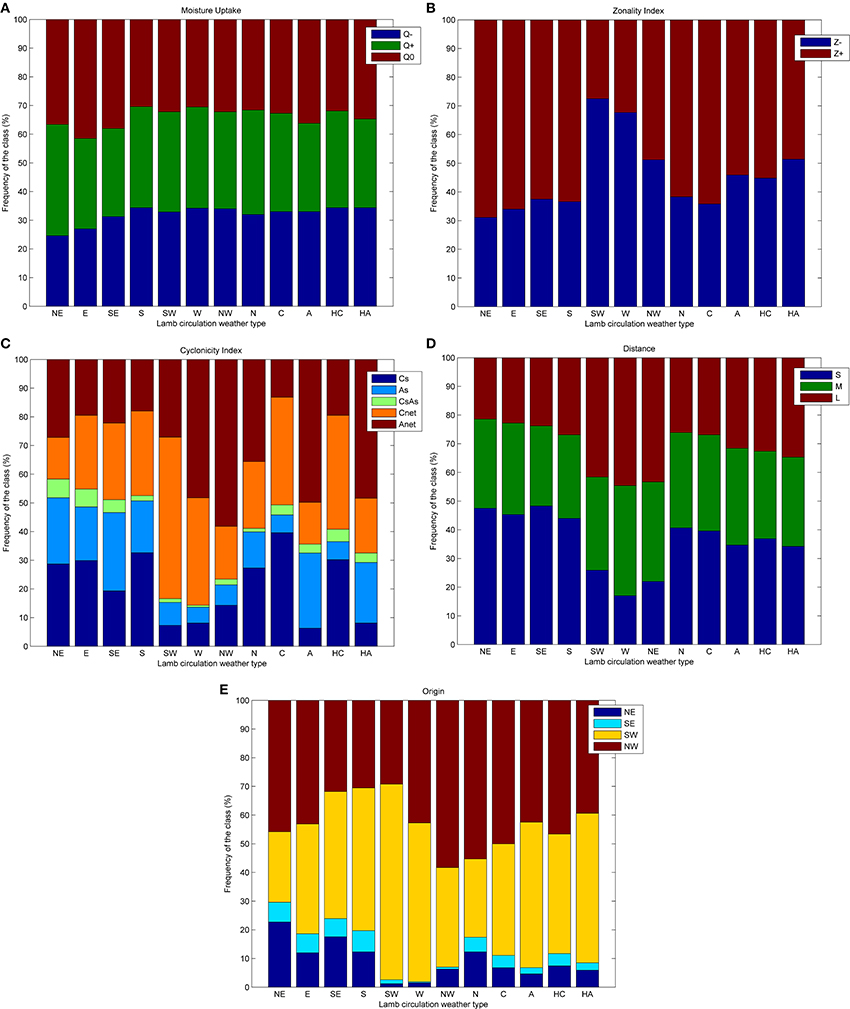
Figure 11. Relationship between Lamb circulation weather type and the Lagrangian flow properties (A) MU, (B) ZI, (C) CI, (D) D, and (E) O. Each column correspond to the frequency (%) of each class when a certain Lamb circulation weather type occur.
To conclude this section, the origin characteristic (O) (Figure 11E) are analyzed. As expected, when an S/SW/W/NW circulation type occurs, the air streams for these days have their origin points mainly in the SW/NW quadrants. Concerning the NE/E/SE circulation type days, results show that despite an increase in the air streams coming from the NE and SE quadrants (regarding the O characteristic) the majority of the air streams are classified as coming from the SW and NW. This can be explained because the LWT are based on the surface level, while the trajectory types are taking into account the 3-D structure of the atmospheric motion. For this reason the signature of the jet stream (air streams where its initial point is in the NW and SW quadrant) is present in the majority of the analyzed days.
Summary and Conclusions
A new classification method of circulation types, based on the analysis of backward trajectories, is presented in this work. A representative air stream was determined for each day (at 12 UTC) for the target region in the NW IP. Air parcels that are in the NW IP at the chosen time steps were selected and the corresponding 90-h backward trajectories were then retrieved. The inherent time scale of 90 h was chosen in order to focus the study not only on the local circulation but also to include the main synoptic-scale features that often affect the target area. In a first step, a clustering algorithm was applied allowing a horizontally separation of the different air streams. Secondly, if the number of clusters from the first (horizontal) clustering exceeded five, a further reduction was accomplished with a secondary clustering based on the height of the trajectory (H), the distance to the target area (D), specific humidity (Q), and latitude (LAT). When the main representative air streams are finally found, each air stream is characterized by four distinct flow properties: (1) Moisture Uptake (MU) represents the integrated change in specific humidity; (2) Zonality Index (ZI) represents the curvature of the path; (3) Cyclonicity Index (CI) represents the cyclonicity of the flow; and (4) Distance and Origin (DO) classifies the air stream in terms of distance and initial position. The final catalog has for each time step a maximum of five air streams, each being characterized by the four characteristics described above. This method is able to reduce a large amount of information from a comprehensive trajectory data set into a small number of distinct air streams, which capture the essential characteristics of the mesoscale and synoptic-scale flow situation. Note that the method describes the three-dimensional complexity of the atmospheric circulation. Moreover it provides time-integrated physical information on the development of the systems (Lagrangian perspective), which goes beyond the traditional description of the instantaneous synoptic situation (Eulerian perspective). For example, the Lagrangian classification allows capturing changes in moisture along the flow due to evaporation and precipitation.
The climatological assessment of this new classification shows that the method is able to capture with good accuracy the main features of the seasonality of regional climate. It allows a proper distinction of processes between seasons and helps determining aspects of the inter-seasonal variability. For example, the short-range transport classes are most frequent in summer (43%) while the frequency of long-range transport is largest in winter (45%).
Besides characterizing aspects of the annual cycle, the method is able to identify distinct dynamical structures. Case studies illustrate the Lagrangian categorization of intense precipitation events, heatwaves, cold fronts, blocking systems, cut off lows and extra-tropical cyclones. For example, for the 2003 heatwave in the IP, the method captures the short-range transport associated with the thermal low, advection of African air streams, and the medium and long-range transport associated with the anticyclonic circulation. As a further example, the cut-off low systems with its high-altitude depression is picked up by the new method, whereas the Eulerian LWT is only able to pick up surface characteristics of the flow (see Supplementary Material S1). In this sense, the method goes a step further in adding valuable information to the classification of a particular atmospheric flow situation. Indeed, a comparison between this method and an automated version of the LWT for the IP is shown in Section Comparison of Lamb Weather Types and Lagrangian Circulation Types and illustrates the general agreement while providing important additional information.
In summary, the key advantages of the new method are:
(1) It is able to summarize the complexity of the atmospheric circulation by a string of five labels denoting, for each of the considered flow characteristics, the class populated by the largest number of air streams.
(2) In contrast to the Eulerian circulation type classification it takes into account the origin and the proprieties of the flow reaching a certain area. It captures both local and large-scale characteristics of the meteorological situation and incorporates important information about the dynamic and thermodynamic processes associated with the flow state.
(3) It captures aspects of the three-dimensional structure of the atmosphere since the backward trajectories entering the flow classification scheme are calculated on several tropospheric levels.
(4) It is able to pinpoint synoptic situations, like cut-off low pressure systems, that may not have a clear signature at lower atmospheric levels and would be missed by classifications based upon the SLP field only.
Some disadvantages of using the new trajectory-based method can also be found. First, the novel classification method is computationally more demanding than traditional Eulerian ones. In addition, if the target domain is increased, the number of trajectories also increases and therefore the computations take longer. Furthermore, the novel method characterizes the complexity of the atmospheric circulation by a set of five parameters. Clearly, this multi-dimensional approach results in a more challenging daily catalog compared to the classical circulation type classifications. The novel approach, developed here for the region of the Iberian Peninsula, should be general enough to be suitable for the classification of air streams over other regions on the globe.
Conflict of Interest Statement
The authors declare that the research was conducted in the absence of any commercial or financial relationships that could be construed as a potential conflict of interest.
Acknowledgments
We thank Andreas Stohl for providing the FLEXPART trajectories. Alexandre M. Ramos was supported by the Portuguese Science Foundation (FCT) through a postdoctoral grant (FCT/DFRH/SFRH/BPD/84328/2012). Ana M. Durán-Quesada acknowledges support from the University of Costa Rica.
Supplementary Material
The Supplementary Material for this article can be found online at: http://www.frontiersin.org/journal/10.3389/feart.2014.00029/abstract
References
Black, E., Blackburn, M., Harrison, G., Hoskins, B., and Methven, J. (2004). Factors contributing to the summer 2003 European heat wave. Weather 59, 217–223. doi: 10.1256/wea.74.04
Cammas, J. P., Brioude, J., Chaboureau, J. P., Duron, J., Mari, C., Mascart, P., et al. (2009). Injection in the lower stratosphere of biomass fire emissions followed by long-range transport: a MOZAIC case study. Atmos. Chem. Phys. 9, 5829–5846. doi: 10.5194/acp-9-5829-2009
deCastro, M., Gomez-Gesteira, M., Ramos, A. M., Álvarez, I., and deCastro, P. (2011). Identification of heat waves in Galicia over the period 1987-2006: effects on mortality. Clim. Res. 48, 333–341. doi: 10.3354/cr00988
deCastro, M., Lorenzo, M. N., Taboada, J. J., Sarmiento, M., Álvarez, I., and Gomez-Gesteira, M. (2006). Teleconnection patterns influence on precipitation variability and on river flow regimes in the Miño River basin (NW Iberian Peninsula). Clim. Res. 32, 63–73. doi: 10.3354/cr032063
Dirmeyer, P. A., and Brubaker, L. (2006). Evidence for trends in the Northern Hemisphere water cycle. Geophys. Res. Lett. 33:L14712. doi: 10.1029/2006GL026359
Pubmed Abstract | Pubmed Full Text | CrossRef Full Text | Google Scholar
Dorling, S. R., Davies, T. D., and Pierce, C. E. (1992). Cluster analysis: a technique for estimating the synoptic meteorological controls on air and precipitation chemistry method and applications. Atmos. Environ. 26A, 2575–2581. doi: 10.1016/0960-1686(92)90110-7
Eckhardt, S., Stohl, A., Wernli, H., James, P., Forster, C., and Spichtinger, N. (2004). A 15-year climatology of warm conveyor belts. J. Clim. 17, 218–237. doi: 10.1175/1520-0442(2004)017<0218:AYCOWC>2.0.CO;2
Esteban, P., Jones, P. D., Martín-Vide, J., and Mases, M. (2005). Atmospheric circulation patterns related to heavy snowfall days in Andorra, Pyrenees. Int. J. Climatol. 25, 319–329. doi: 10.1002/joc.1103
Fowler, H. J., and Kilsby, C. G. (2002). A weather-type approach to analyzing water resource drought in the Yorkshire region from 1881 to 1998. J. Hydrol. 262, 177–192. doi: 10.1016/S0022-1694(02)00034-3
Garcia-Herrera, R., Diaz, J., Trigo, R. M., Luterbacher, J., and Fischer, E. M. (2010). A review of the European Summer Heat Wave of 2003. Crit. Rev. Environ. Sci. Technol. 40, 267–306. doi: 10.1080/10643380802238137
Pubmed Abstract | Pubmed Full Text | CrossRef Full Text | Google Scholar
Gimeno, L., Nieto, R., Trigo, R., Vicente, S., and Lopez-Moreno, J. I. (2010). Where does the Iberian Peninsula moisture come from? An answer based on a Largrangian approach. J. Hydrometeorol. 11, 421–436. doi: 10.1175/2009JHM1182.1
Gómez-Gesteira, M., Gimeno, L., deCastro, M., Lorenzo, M. N., Alvarez, I., Nieto, N., et al. (2011). The state of climate in NW Iberia. Clim. Res. 48, 109–144. doi: 10.3354/cr00967
Goodess, C. M., and Jones, P. D. (2002). Links between circulation and changes in the characteristics of Iberian rainfall. Int. J. Climatol. 22, 1593–1615. doi: 10.1002/joc.810
Goodess, C. M., and Palutikof, J. P. (1998). Development of daily rainfall scenarios for southeast Spain using a circulation-type approach to downscaling. Int. J. Climatol. 18, 1051–1083.
Hastie, T., Tibshirani, R., and Friedman, J. (2009). The Elements of Statistical Learning: Data Mining, Inference, and Prediction, 2nd Edn. New York, NY: Springer Series in Statistics, 763. doi: 10.1007/978-0-387-84858-7
Hess, P., and Brezowsky, H. (1952). “Katalog der Großwetterlagen Europas (Catalog of the European Large Scale Weather Types),” in Berichte des Deutschen Wetterdienstes in der US-Zone 33 (Bad Kissingen: Meteorological Office in Germany).
Hoinka, K. P., and de Castro, M. (2003). The Iberian Peninsula thermal low. Q. J. R. Meteorol. Soc. 129, 1491–1511. doi: 10.1256/qj.01.189
Hope, P. K., Drosdowsky, W., and Nicholls, N. (2006). Shifts in the synoptic systems influencing southwest Western Australia. Clim. Dyn. 26, 751–764. doi: 10.1007/s00382-006-0115-y
Huth, R., Beck, C., Philipp, A., Demuzere, M., Ustrnul, Z., Cahynova, M., et al. (2008). Classifications of atmospheric circulation patterns: recent advances and applications. Trends and directions in climate research. Ann. N.Y. Acad. Sci. 1146, 105–152. doi: 10.1196/annals.1446.019
Pubmed Abstract | Pubmed Full Text | CrossRef Full Text | Google Scholar
Jacobeit, J. (2010). Classifications in climate research. Phys. Chem. Earth 35, 411–421. doi: 10.1016/j.pce.2009.11.010
James, P., Stohl, A., Spichtinger, N., Eckhardt, S., and Forster, C. (2004). Climatological aspects of the extreme European rainfall of August 2002 and a trajectory method for estimating the associated evaporative source regions. Nat. Hazards Earth Syst. Sci. 4, 733–746. doi: 10.5194/nhess-4-733-2004
James, R., Bonazzola, M., Legras, B., Surbled, K., and Fueglistaler, S. (2008). Water vapor transport and dehydration above convective outflow during Asian monsoon. Geophys. Res. Lett. 35:L20810. doi: 10.1029/2008GL035441
Jones, P. D., Hulme, M., and Briffa, K. R. (1993). A comparison of Lamb circulation types with an objective classification scheme. Int. J. Climatol. 13, 655–663. doi: 10.1002/joc.3370130606
Jones, P. D., and Lister, D. H. (2009). The influence of the circulation on surface temperature and precipitation patterns over Europe. Clim. Past 5, 259–267. doi: 10.5194/cp-5-259-2009
Jorba, O., Pérez, C., Rocadenbosch, F., and Baldasano, J. M. (2004). Cluster analysis of 4-day back trajectories arriving in the Barcelona area, Spain, from 1997 to 2002. J. Appl. Meteorol. 43, 887–901. doi: 10.1175/1520-0450(2004)043<0887:CAODBT>2.0.CO;2
Kalnay, E., Kanamitsu, M., Collins, W., Deaven, D., Gandin, L., Iredell, M., et al. (1996). The NCEP/NCAR 40-year reanalysis project. Bull. Am. Meteorol. Soc. 77, 437–470.
Knippertz, P., and Wernli, H. (2010). A Lagrangian climatology of tropical moisture exports to the Northern Hemispheric extratropics. J. Clim. 23, 987–1003. doi: 10.1175/2009JCLI3333.1
Kruizinga, S. (1979). “Objective classification of daily 500 mbar patterns,” in Preprints Sixth Conference on Probability and Statistics in Atmospheric Sciences, Banff, Alberta (Boston, MA: American Meteorological Society), 126–129.
Kyselý, J. (2008). Influence of the persistence of circulation patterns on warm and cold temperature anomalies in Europe: analysis over the 20th century. Glob. Planet. Change 62, 147–163. doi: 10.1016/j.gloplacha.2008.01.003
Lamb, H. H. (1972). “British Isles weather types and a register of daily sequence of circulation patterns, 1861–1971,” in Geophysical Memoir 116 (London: HMSO).
Lorenzo, M. N., and Taboada, J. J. (2005). Influences of atmospheric variability on freshwater input in Galician Rías in winter. J. Atmos. Ocean. Sci. 10, 377–387. doi: 10.1080/17417530601127472
Lorenzo, M. N., Taboada, J. J., and Gimeno, L. (2008). Links between circulation weather types and teleconnection patterns and their influence on precipitation patterns in Galicia (NW Spain). Int. J. Climatol. 28, 1493–1505. doi: 10.1002/joc.1646
Nyanganyura, D., Makarau, A., Mathuthu, M., and Meixner, F. X. (2008). A five-day back trajectory climatology for Rukomechi research station (northern Zimbabwe) and the impact of large-scale atmospheric flows on concentrations of airborne coarse and fine particulate mass. S. Afr. J. Sci. 104, 43–52.
Osborn, T. J., Hulme, M., Jones, P. D., and Basnett, T. A. (2000). Observed trends in the daily intensity of United Kingdom precipitation. Int. J. Climatol. 20, 34–364. doi: 10.1002/(SICI)1097-0088(20000330)20:4<347::AID-JOC475>3.0.CO;2-C
Palau, J. L., Pérez-Landa, G., and Millán, M. M. (2009). Transitional dispersive scenarios driven by mesoscale flows on complex terrain under strong dry convective conditions. Atmos. Chem. Phys. 9, 119–130. doi: 10.5194/acp-9-119-2009
Pubmed Abstract | Pubmed Full Text | CrossRef Full Text | Google Scholar
Paris, J. D., Stohl, A., Ciais, P., Nédélec, P., Belan, B. D., Arshinov, M. Y., et al. (2010). Source-receptor relationships for airborne measurements of CO2, CO and O3 above Siberia: a cluster-based approach. Atmos. Chem. Phys. 10, 1671–1687. doi: 10.5194/acp-10-1671-2010
Peixoto, J. P., and Oort, A. (1992). Physics of Climate. New York, NY: American Institute of Physics, 520.
Philipp, A., Bartholy, J., Beck, C., Erpicum, M., Esteban, P., Fettweis, X., et al. (2010). COST733CAT—a database of weather and circulation type classifications. Phys. Chem. Earth 35, 360–373. doi: 10.1016/j.pce.2009.12.010
Philipp, A., Della-Marta, P. M., Jacobeit, J., Fereday, D. R., Jones, P. D., Moberg, A., et al. (2007). Long term variability of daily North Atlantic–European pressure patterns since 1850 classified by simulated annealing clustering. J. Clim. 20, 4065–4095. doi: 10.1175/JCLI4175.1
Ramos, A. M., Lorenzo, M. N., and Gimeno, L. (2010). Compatibility between modes of low frequency variability and Circulation Types: a case study of the North West Iberian Peninsula. J. Geophys. Res. 115:D02113. doi: 10.1029/2009JD012194
Ramos, A. M., Ramos, R., Sousa, P., Trigo, R. M., Janeira, M., and Prior, V. (2011). Cloud to ground lightning activity over Portugal and its association with Circulation Weather Types. Atmos. Res. 101, 84–101. doi: 10.1016/j.atmosres.2011.01.014
Riccio, A., Giunta, G., and Chianese, E. (2007). The application of a trajectory classification procedure to interpret air pollution measurements in the urban area of Naples (Southern Italy). Sci. Total Environ. 376, 198–214. doi: 10.1016/j.scitotenv.2007.01.068
Pubmed Abstract | Pubmed Full Text | CrossRef Full Text | Google Scholar
Romero, R., Sumner, G., Ramis, C., and Genovés, A. (1999). A classification of the atmospheric circulation patterns producing significant daily rainfall in the Spanish Mediterranean area. Int. J. Climatol. 19, 765–785.
Sodemann, H., Schwierz, C., and Wernli, H. (2008). Inter-annual variability of Greenland winter precipitation sources. Lagrangian moisture diagnostic and North Atlantic Oscillation influence. J. Geophys. Res. 113:D03107. doi: 10.1029/2007JD008503
Spellman, G. (2000). The application of an objective weather-typing system to the Iberian peninsula. Weather 55, 375–385. doi: 10.1002/j.1477-8696.2000.tb04023.x
Stohl, A. (1998). Computation, accuracy and applications of trajectories a review and bibliography. Atmos. Environ. 32, 947–966. doi: 10.1016/S1352-2310(97)00457-3
Stohl, A. (2001). A one-year Lagrangian “climatology” of airstreams in the Northern Hemisphere troposphere and lowermost stratosphere. J. Geophys. Res. 106, 7263–7279. doi: 10.1029/2000JD900570
Stohl, A., Forster, C., Frank, A., Seibert, P., and Wotawa, G. (2005). Technical note: the Lagrangian particle dispersion model FLEXPART version 6.2. Atmos. Chem. Phys. 5, 2461–2474. doi: 10.5194/acp-5-2461-2005
Stohl, A., Haimberger, L., Scheele, M. P., and Wernli, H. (2001). An intercomparison of three trajectory models. Meteorol. Appl. 8, 127–135. doi: 10.1017/S1350482701002018
Stohl, A., and Scheifinger, H. (1994). A weather pattern classification by trajectory clustering. Meteorol. Z. 6, 333–336.
Stohl, A., and Sodemann, H. (2010). Characteristics of atmospheric transport into the Antarctic troposphere, J. Geophys. Res. 115:D02305. doi: 10.1029/2009JD012536
Trigo, I. F. (2005). Climatology and interannual variability of storm-tracks in the Euro-Atlantic sector: a comparison between ERA-40 and NCEP/NCAR reanalyses. Clim. Dyn. 26, 127–143. doi: 10.1007/s00382-005-0065-9
Trigo, R. M., and DaCamara, C. C. (2000). Circulation weather types and their influence on the precipitation regime in Portugal. Int. J. Climatol. 20, 1559–1581. doi: 10.1002/1097-0088(20001115)20:13<1559::AID-JOC555>3.0.CO;2-5
Trigo, R. M., Ramos, A. M., Nogueira, P., Santos, F. D., Garcia-Herrera, R., Gouveia, C., et al. (2009). Evaluating the impact of extreme temperature based indices in the 2003 heatwave excessive mortality in Portugal. Environ. Sci. Policy 12, 844–854. doi: 10.1016/j.envsci.2009.07.007
Keywords: circulation types, backward trajectories, cluster analysis, Northwest Iberian Peninsula, precipitation
Citation: Ramos AM, Sprenger M, Wernli H, Durán-Quesada AM, Lorenzo MN and Gimeno L (2014) A new circulation type classification based upon Lagrangian air trajectories. Front. Earth Sci. 2:29. doi: 10.3389/feart.2014.00029
Received: 27 August 2014; Paper pending published: 22 September 2014;
Accepted: 06 October 2014; Published online: 24 October 2014.
Edited by:
Eugene V. Rozanov, Physikalisch-Meteorologisches Observatorium Davos and World Radiation Center, SwitzerlandReviewed by:
Ashok Kumar Jaswal, India Meteorological Department, IndiaLin Wang, Institute of Atmospheric Physics, China
Copyright © 2014 Ramos, Sprenger, Wernli, Durán-Quesada, Lorenzo and Gimeno. This is an open-access article distributed under the terms of the Creative Commons Attribution License (CC BY). The use, distribution or reproduction in other forums is permitted, provided the original author(s) or licensor are credited and that the original publication in this journal is cited, in accordance with accepted academic practice. No use, distribution or reproduction is permitted which does not comply with these terms.
*Correspondence: Alexandre M. Ramos, Instituto Dom Luiz, Faculdade de Ciências, Universidade de Lisboa, Campo Grande, Edf. C8, Piso 3, Sala 8.3.1, 1749-016 Lisboa, Portugal e-mail: amramos@fc.ul.pt