Thin-skinned mass-wasting responsible for widespread deformation at Arenal volcano
 Susanna K. Ebmeier
 Juliet Biggs
 Cyril Muller
 Geoffroy Avard
- 1COMET, School of Earth Sciences, University of Bristol, Bristol, UK
- 2Observatorio Vulcanológico y Sismológico de Costa Rica, Universidad Nacional, Heredia, Costa Rica
The shape and stability of a volcano's edifice depends on the relationship between eruption rate and the loss or redistribution of material due to erosion, mass-wasting or deformation. This work provides measurements of deformation and shallow mass-wasting at a stratovolcano immediately after an extended period of growth, and demonstrates that high rates of deformation can be associated with shallow edifice processes. We measure displacements and surface property changes on the upper flanks of Arenal, Costa Rica, after a ~40 year period of edifice growth. We present high-resolution satellite radar imagery of the 2011–2013 period that provides evidence of frequent rockfalls and of at least 16 slow-moving, shallow landslides (estimated to be 5–11 m thick, total volume = 2.4 × 10⁷ m3 DRE). The 2012 Nicoya Earthquake (Mw 7.4) had no measurable impact on the velocities of sliding units at Arenal, but did result in an increase in the area affected by rockfall.
Introduction
The stability of a volcanic edifice depends on the ratio of its exogenous growth to mass loss due to erosion or mass wasting (e.g., Baldi et al., 2008) and mass redistribution due to deformation or compaction (e.g., Borgia et al., 2000; Ebmeier et al., 2012). In tectonic mountain ranges the movement of mass downslope depends on elevation, weathering rate, and the frequency of slope failure (e.g., Hovius et al., 1997; Montgomery and Brandon, 2002). The term mass-wasting refers to processes with a range of timescales and depths, from sudden sector collapse or debris avalanches to the slow creep of slopes. At volcanoes, the potential for slope failure may be enhanced by the intrusion of magma into the edifice, the movement of faults (e.g., Simkin, 2002) or the gradual alteration of rocks by exposure to magmatic and hydrothermal heat and fluids (Reid et al., 2001; Ball et al., 2013). Sporadic, high growth rates during eruptions lead to over-steepening (e.g., Sparks et al., 1998; Wadge et al., 2006), which, along with the presence of poorly consolidated deposits such as tephras and pyroclastic flows, also make mass wasting processes at volcanoes distinct from tectonic mountains.
The highest rates of shallow mass wasting, erosion, and edifice deformation take place immediately after edifice growth, as young deposits contract and consolidate, loose material is eroded and the edifice and substrate respond to the increased load. Making in situ measurements after an eruption is challenging, due to uncertain levels of hazard and unstable slopes. So far, there have been few observations of these post-eruptive processes. The subsidence of recent lava flows has been measured using satellite radar (e.g., Stevens et al., 1999; Lu et al., 2005), but the rapidly changing surfaces of the fresh lavas mean that measurements were only possible months to years after emplacement. Whelley et al. (2011) describe the development of a network of fractures in unconsolidated pyroclastic flow deposits at Lascar, Chile, subsiding at ~1 cm/year. Observations of the rate of flow deposit deformation, and the response of a volcanic edifice to new loads are important for understanding hazard from rockfalls and landslides following an eruption. The sensitivity of volcanic slopes to external triggers, such as hydrological loading or seismic shaking is also a consideration for hazard assessment. In the longer term, mass may be redistributed during spreading processes (e.g., Piton de la Réunion, Froger et al., 2004 and Kilauea, Cervelli et al., 2002), which reduce the likelihood of sudden slope failure.
This study presents high-resolution observations of deformation and surface change at Volcán Arenal, Costa Rica, using TerraSAR-X (TSX) images between 2011 and 2013. TSX has a high spatial resolution (2 × 3 meters, Stripmap) and short repeat interval (11 days). It therefore provides an opportunity to measure localized, rapid volcanic processes that were previously unobservable in SAR data (e.g., ENVISAT ASAR, resolution 30 × 100 meters & repeat interval 35 days). For example, Salzer et al. (2014) measured pre-explosive inflation of the lava dome at Colima 7 h before an eruption in January 2013, a transient process that would almost certainly have been missed without TSX data. A set of 25 TSX images have allowed us to make the first displacement measurements as far up as Arenal's summit, and to identify subtle variations in deformation pattern over different time periods. In addition to long-wavelength subsidence and the lava flow-wide compaction processes identified by earlier studies (Ebmeier et al., 2010; Mora et al., 2013), we show here that there is a heterogeneous deformation process taking place at elevations of ~900–1600 m on Arenal's upper slopes. Material is transported downslope in multiple shallow units, which we interpret as slow-moving landslides, with time-averaged displacement rates of up to 7–10 cm/year. We examine the impact of the 2012 Nicoya Earthquake on landsliding and rockfalls at Arenal using both deformation and surface change data derived from satellite radar. This work provides rare measurements of deformation and gradual mass wasting at a stratovolcano following an extended period of growth and demonstrates that shallow movements within young deposits can contribute to high rates of deformation.
Background
Volcán Arenal, Costa Rica, stopped erupting in 2010 after almost 42 years of activity. Its most recent phase of activity began with a lateral blast eruption to the West, followed by several decades of lava effusion, mostly on the volcano's western side (Alvarado et al., 2006). Its edifice grew by a dense rock equivalent volume of 551 × 106m3 (Figures 1A,C, Wadge et al., 2006) between 1968 and 2004, a time averaged rate of ~15 × 106 m3/year. The rate of effusion decreased after 1988 (Figure 1C), and there were no lava flows, significant explosions or major seismic events after 2010.
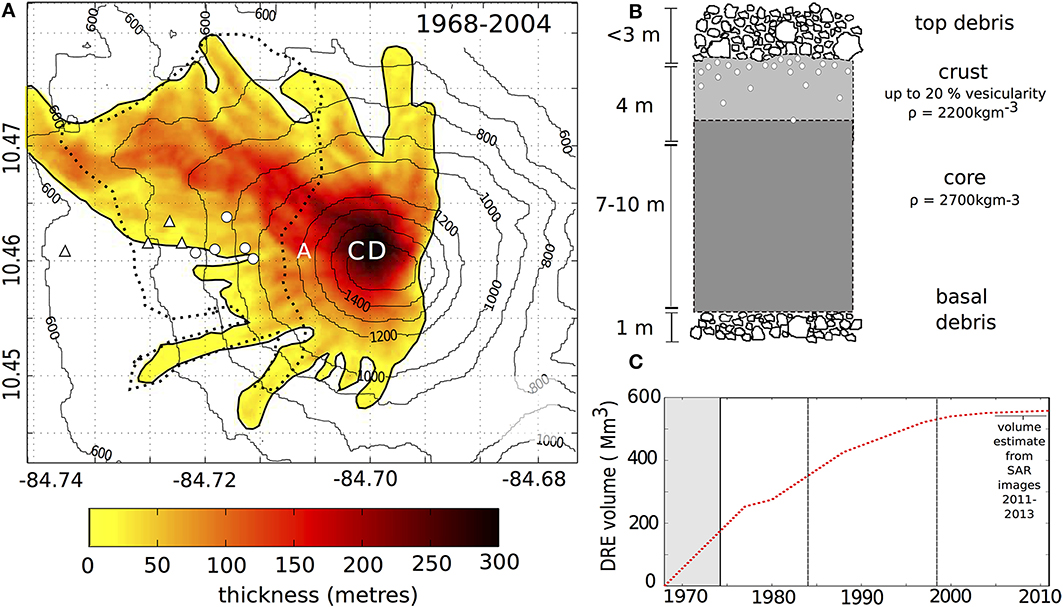
Figure 1. (A) Lava thickness map of Arenal, after Wadge et al. (2006), showing change in topography since 1968. Contours show SRTM topography (2000). Letters A, B, and C mark the location of craters than opened during the 1968 blast eruption. Since 1973, only Crater C has been active. The dotted line indicates the previous spatial limits of InSAR measurement (Ebmeier et al., 2010), circles show the positions of reflectors used in Electronic Distance Meter measurements and triangles indicate the positions of campaign GPS points (Muller et al., in press). (B) Sketch of the internal structure of Arenal's post-1973 lava active flows after Borgia et al. (1983) and Cigolini et al. (1984) (C) Cumulative Dense Rock Equivalent volume erupted at Arenal Volcano as estimated by Wadge et al. (2006) between 1968 and 2004 and from analyzing the topographic component of TSX interferograms (e.g., Ebmeier et al., 2012).
Arenal is a young, small stratovolcano (volume ~10 km3), with a layered internal structure of lavas and fragmental deposits. The post-1968 deposits on Arenal's western flanks consist primarily of block lavas, though a'a flows were produced early in the eruption and were still present close to the summit in the early 1980s. Active lava flows were typically 10–15 m thick near the vent, and about 15–30 m thick at the base of the volcano where channels were mature (Cigolini et al., 1984). The hot core of advancing block lavas were surrounded by a layer of debris and topped by cooled, lower density, vesicular crust (Figure 1B, Borgia et al., 1983). Deposits on the volcano's upper flanks are the remains of flows that collapsed when lava supplies ceased and the hot, low viscosity cores continued to flow downslope, leaving layers of brittle crust and debris (Cigolini et al., 1984). Today lavas are stratified, intensely fractured and well drained, with interbedded layers of tephras. Pyroclastic flow deposits from 1992 to 2001 also left blocks of 5–10 m diameter on Arenal's upper slopes (Cole et al., 2005). The thickness of post-1968 material is almost 300 m at Arenal's summit.
On 05.09.2012 a Mw 7.4 earthquake ruptured a 70 km length of the plate boundary beneath Costa Rica's Nicoya Peninsula (Yue et al., 2013). This earthquake produced “strong” shaking (peak acceleration between 0.05 and 0.15 ms−2) at Arenal (Laboratorio de Ingeniería Sísmica, Universidad de Costa Rica; USGS Shakemap, Wald et al., 2005), modeled peak dynamic stress with a radial component of the order of 0.4 MPa (Gratton, 2014) and elevated numbers of microearthquakes in the area around the volcano. Changes on the volcano's surface are visible in photographs taken before and after the earthquake (Figures 2A,B).
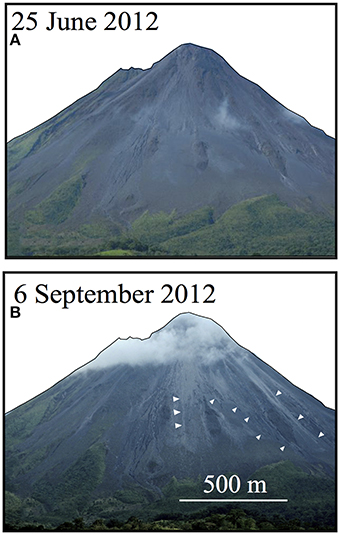
Figure 2. (A) Photograph of Arenal taken on 25.06.2012 from the northwest, viewing direction indicated by the arrow on Figure 7. (B) Photograph taken from the same location the day after the Nicoya Earthquake (06.09.2012). Changes to surface textures are indicated by white triangles.
Measurements of subsidence at Arenal have been made for several decades, including dry tilt meter (1986–2000, Mora et al., 2013), Electronic Distance Meter (EDM, Avard et al., 2012) campaign GPS (Feng et al., 2012; Muller et al., in press) and InSAR (2005–2010, Ebmeier et al., 2010). Ground based instruments (locations shown on Figure 1A) are located at elevations below 1000 m and indicate an apparently smooth deformation field with subsidence centered on the volcano. From 1986 to 2000, tiltmeters registered tilt toward the volcano's edifice (Mora et al., 2013), and from 1991 to 2012 EDM measurements show a contraction of between 1 and 7 cm/year (Avard et al., 2012). On a broader scale, GPS stations surrounding Arenal at distances >5 km detect subsidence of the order of a few millimeters. These long spatial wavelength subsidence signals have been attributed to an elastic response to loading by the post-68 lava fields (Mora et al., 2013), consolidation of erupted material (Alvarado et al., 2010) and subsidence of basement below Arenal's edifice over the past 7000 years (Alvarado et al., 2010). Our earlier InSAR study (Ebmeier et al., 2010) measured deformation further up the volcano at heights <1200 m, where deformation rates were as high as 12 cm/year. These InSAR measurements showed close to vertical subsidence at the base of the volcano, similar in magnitude to the ground-based measurements, but a much larger component of faster westward motion at elevations > ~900 m. This higher magnitude, westward motion was attributed to gravity-driven slip, though the depth to sliding plane was unconstrained. Radar imagery from 2005 to 2009 (RadarSat and ALOS) was not of sufficient spatial resolution to tell whether displacements were limited to a single sliding unit of lavas emplaced since 1968, or comprised of discontinuous movements of many smaller constituent slides. Discriminating between these two scenarios has implications for hazard at Arenal: the potential magnitude of debris volume or decompression after a sudden failure is much greater for a single, large unit than multiple smaller ones.
Materials and Methods
Satellite Data
We use 25 images acquired by the Deutsches Zentrum für Luft- und Raumfahrt (DLR) satellite, TerraSAR-X (TSX, Stripmap mode), between June 2011 and September 2013 (Supplementary Table 1). Radar images are composed of amplitude and phase components, both of which depend on satellite position and the scattering and reflecting properties of the Earth's surface. Deformation can be retrieved from maps of phase change (interferograms) if contributions from backscatter are similar enough between two images to cancel each other out. The short wavelength (λ = 0.03 m) of TSX data coupled with the high spatial and temporal resolution (~3 m, 11 day repeat interval) result in significantly better phase coherence than was previously achievable (Ebmeier et al., 2010, 2013), making measurements close to Arenal's summit possible for the first time (Figures 1A, 3).
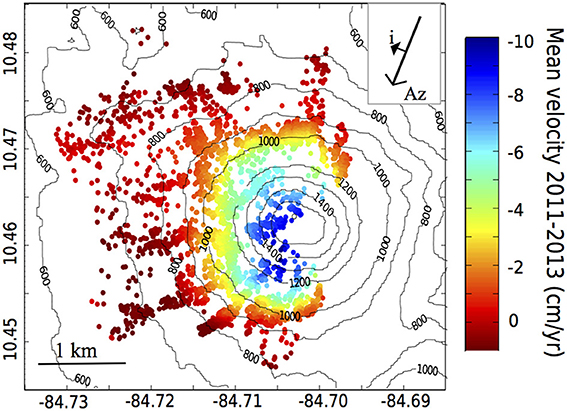
Figure 3. Mean line-of-sight velocities found from persistent scatterer analysis between 24.06.2011 and 15.09.2013. Azimuth (Az) direction = −167°, incidence angle (i) = 37°.
Interferograms for all Single Look Slant range Complex (SSC) images are constructed using both the Repeat Orbit Processing software (ROIPAC, developed at Caltech/JPL, Rosen et al., 2004) and the Delft Object-oriented Radar Interferometric Software (DORIS, Kampes and Usai, 1999). Topographic contributions to phase are corrected using NASA's Shuttle Radar Topography Mission (SRTM) Digital Elevation model (acquired in 2000, Rosen et al., 2001). We estimate elevation changes for 2000–2011 by finding the relationship between perpendicular baseline and phase for our set of TSX images. This can be used to estimate the change in topography since the DEM was acquired (e.g., Sigmundsson et al., 1997), and an approach for measuring change in lava flow heights is described in detail by Ebmeier et al. (2012). We subtract the topographic change between 2000 and 2004 (11 Mm3 DRE, measured by Wadge et al., 2006) to estimate change in height between 2004 and 2010, and find a change in topography of ~7 ± 3 Mm3 (Supplementary Figure 1). We use our estimations of elevation changes to correct the SRTM DEM used for topographic corrections. As the orbital tube of TSX is narrow and baselines are small, the uncertainties in our estimations of topographic change are high (10–20 m). Although there have been several lava and pyroclastic flows at Arenal since 2000, the only significant changes in topography are over the 2000–2004 lava flows (20–45 m increase in topography, see Supplementary Figure 1). The average height of ambiguity (ha)—the altitude difference needed to produce 2π phase change —is 35 m in our interferograms1. Therefore, the only places where topographic errors are likely to be introduced are over the very thickest parts of the most recent flows in interferograms with perpendicular baselines that exceed 106 m. We exclude observations over the area of topographic change (marked on Figure 5B) from high baseline interferograms from our interpretation.
Mean velocities are retrieved using a persistent scatterer method (STAMPS, Figure 3, Hooper et al., 2004), which limits analysis to particularly stable pixels that remain coherent through time, and in this case improves the spatial coverage of InSAR measurements (Figure 3).
Identification of Landslides and Rockfalls
Individual TSX interferograms show distinct deformation patterns, with different sections of Arenal's slopes sliding at slightly different rates. We analyse the patterns of deformation in a subset of coherent, wrapped interferograms that span ~3 to 12 months, to map the boundaries between units with differences in deformation rate. Three independent, wrapped interferograms are shown in Figure 4, so that each full cycle of the color scale (fringes) represents 2.8 cm displacement. Landslide boundaries (Figures 4B,E,H) were identified as abrupt offsets in fringes or changes in fringe orientation, sometimes accompanied by thin, linear incoherence (Synthesis of unit outlines on Figure 5A).
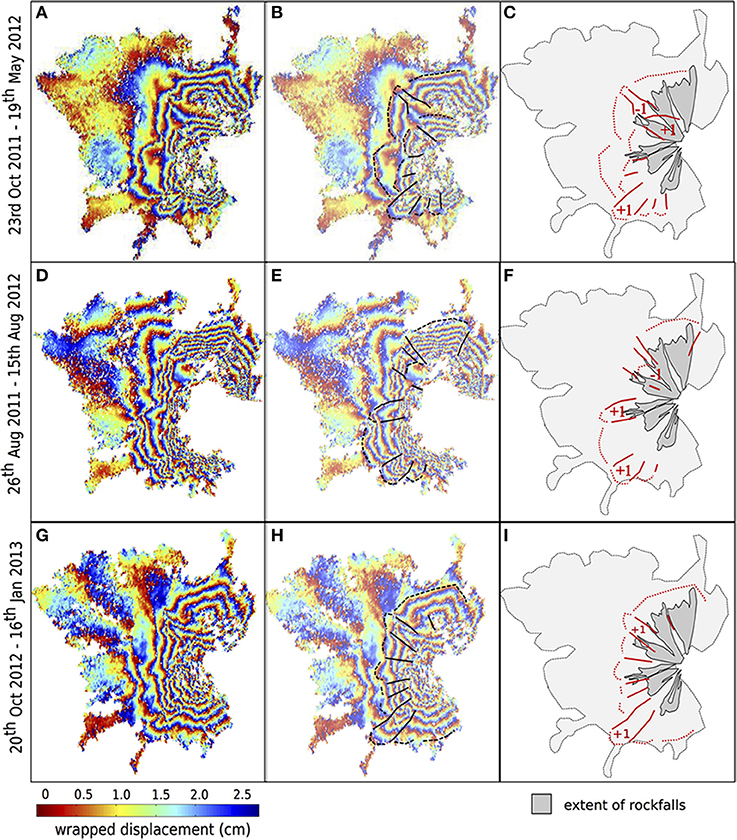
Figure 4. Examples of independent, coherent >3 months interferograms (A,D,G) used to identify distinct sliding units. Discontinuities and offset in fringes are outlined in solid black on (B,E,H). The estimated extent of the sliding units (end of tight fringe pattern) are indicated by black dotted lines. The same boundaries are shown in red on the schematic figure (C,F,I). The numbers (+1 and −1) indicate, where clear, whether a unit appears to have moved further or less far than its neighbors in terms of number of fringes. The post-1968 deposits are shown on (C,F,I) in pale gray and the zones of frequent rockfall identified in intensity change images are marked in dark gray. More examples are provided in Supplementary Figure 3.
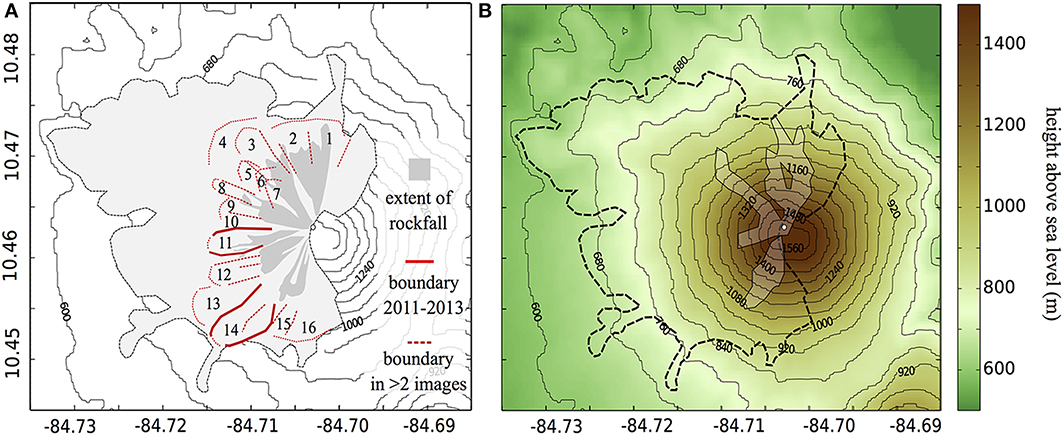
Figure 5. (A) An interpretative map constructed from examination of 10 interferograms with a high signal to noise ratio is shown in (A). The pale gray outline shows the region of SAR coherence, while the darker gray shows the area of persistent rockfalls. Solid red lines indicate the position of units identifiable in all interferograms, dashed lines show boundaries identified from at least two images. (B) Topographic map of Arenal, showing elevation above sea level and areas of topographic change since the SRTM DEM was acquired in 2000 (pale outlines).
In addition to the movement of the ground, phase in interferograms may contain contributions from orbital ramps, errors in the DEM used to remove topographically correlated phase, and changes in atmospheric composition. Uncertainties in our topographic corrections were high, so it is possible that this has introduced artifacts to our high baseline (>106 m) interferograms, but, with the exception of units 5–7 (indicated on Figure 5A), which are located on lava flows emplaced between 2000 and 2004, the units we have identified do not coincide with the zones where topography has changed since 2000. Units 5–7 also appear in interferograms with lower perpendicular baselines (e.g., Figures 4A,D), where they are unlikely to be topographic artifacts. Coherence is limited to young deposits at Arenal, so that we have insufficient data to remove residual orbital ramps empirically from the far-field. Atmospheric phase delay, which typically varies on the kilometer scale (e.g., Hannsen, 2001) is also difficult to identify without a priori knowledge of tropospheric water vapor and hydrostatic pressure. We therefore expect individual interferograms to contain uncertainties from both orbital ramps and atmosphere (e.g., Ebmeier et al., 2013). Although this means that rates estimated from individual interferograms may be unreliable, the shape and location of the fringe offsets and changes in orientation used to identify unit boundaries are not likely to be affected by the much longer wavelength orbital and atmospheric phase contributions. We therefore use individual interferograms to assess the shape of moving units, but estimate displacement rates using multi-interferogram methods that mitigate atmospheric and orbital contributions.
To examine changes to surface scattering properties, we use geocoded backscatter amplitude maps that have been corrected for both Earth ellipsoid and SRTM topography (TSX Enhanced Ellipsoid Corrected product, EEC). This reduces differences in intensity caused by changing viewing geometries, so that the differences between such images are dominated by changes in the scattering and reflecting properties of the Earth's surface. We represent intensity change using a scaled RGB image where the first image is red, second image is green and the scaled difference between them is blue (after Wadge et al., 2011; see Figure 6). In the resulting image, yellow indicates no change in amplitude, magenta indicates a decrease, and cyan an increase. Change detection images of this type can be interpreted in terms of changes to local slope and/or surface roughness at a scale similar to the radar wavelength (in this case 3 cm). Regions that are rough on this scale appear dark (e.g., drainage channels on Figures 6A–E), while smoother surfaces appear brighter (ridges of lava on Figures 6A–E).
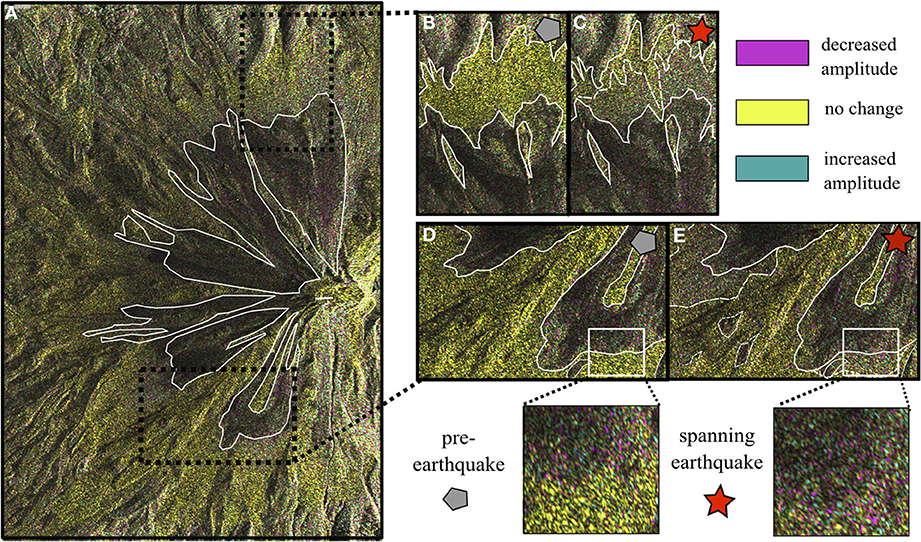
Figure 6. RGB images representing intensity change, using the convention that the first image is red, second image is green and the scaled difference between them is blue (after Wadge et al., 2011). In the resulting image, yellow indicates no change in amplitude, magenta indicates a decrease, and cyan an increase. Bright yellow areas indicate smooth (on the 3 cm scale) surfaces that have not changed. The darker regions are rougher and contain a complicated mixture of cyan and magenta pixels, indicating changes to scattering properties (see insets to D,E). Solid white lines mark the boundary between changed and unchanged (yellow) areas (A–E) and dashed white lines show extent of changed areas in images that span the earthquake (C,E, marked with red stars). (B,D) show intensity changes before the earthquake (02.07.2012–24.07.2012), (C,E) show changes caused by the earthquake (15.08.2012–06.09.2012).
Results
Time-averaged velocities measured using persistent scatterer analysis for 2010–2013 (Figure 3) show the subsidence of the entire western flank of Arenal. The velocities have a similar spatial pattern and magnitude to earlier measurements (Ebmeier et al., 2010; Mora et al., 2013). Although displacement rates in the upper edifice may have decreased slightly, differences in displacement rate between 2005–2009 and 2011–2013 are within expected uncertainties. For example, at Crater A (Figure 1A) line-of-sight displacement rate was −11 ± 2 cm/year in 2005–2010 (Ebmeier et al., 2010) and −7.3 ± 0.8 cm/year in 2011–2013. Peak displacement rate (−10 cm/year) is close to Arenal's summit. The viewing geometry of the images (heading = −167°; incidence angle = 37°) is sensitive to East-West and vertical, but not North-South movements, so although line-of-sight displacement appears to be slightly higher to the West of the summit than to the North or South, this may be an artifact of viewing geometry. Although consolidation of recent deposits at Arenal is expected to contribute to the net deformation rate, and may be responsible for the similarity in deformation rate around the edifice, it is unlikely to be the primary mechanism for the large horizontal component of motion on the volcano's upper flanks (Ebmeier et al., 2010).
The TSX data allow us to examine deformation patterns on the upper slopes of Arenal in detail for the first time. Between elevations of ~800 and 1200 m, deformation rate increases rapidly. There is a slight increase in the gradient of the edifice's slopes in this area (see Figure 5B), above which phase patterns are heterogeneous, with abrupt offsets and changes in the orientation of fringes. These phase patterns are best explained by localized variations in deformation rates. They are present equally in interferograms with short and long perpendicular baseline, and are therefore unlikely to be generated by inaccurate topographic corrections. Furthermore, they do not have the characteristics of atmospheric artifacts, being (1) short wavelength (0.1–1 km), (2) consistent in shape in multiple independent interferograms and (3) consistent in sign in interferograms with a date held in common.
Interpretation of Deformation Field
We find evidence of up to sixteen distinct units. Time-averaged deformation rates over the upper parts of Arenal's edifice are similar, so it seems likely that the heterogeneities in fringe pattern are the consequence of slight variations in the rate of motion of different units over time. These variations are of the order of one fringe or less, or <1 cm/year. If these disparities in displacement rate were the consequence purely of consolidation, we would expect the highest displacement rates to be limited consistently to the youngest (marked on Figure 5B) and thickest (Figure 1) deposits, rather than to be similar over the upper parts of the edifice.
The small sliding units identified on Arenal's upper flanks are consistent with translational landslides or block slides: (1) displacements are planar with no evidence of rotation or backward tilting and (2) the moving masses appear to consist of a few closely related units (e.g., Varnes, 1978). Landslides have faster moving depletion zones at their heads and lower displacement rate accumulation zones at their toes. The heads of the units identified at Arenal are moving at apparent time-averaged rates of −6 to −10 cm/year, with displacement rates decreasing smoothly to the toes, where slopes become slightly shallower, and which move at only −3 to −5 cm/year. Although this trend would be consistent with active landslides, our measurements at Arenal are expected to include the sum of several deformation processes, including loading (Mora et al., 2013) and the contraction and consolidation of young lavas. Our measurement of the deformation at the toe of the landslides may include a component of uplift, but it is not possible to isolate this from the combined displacement signal, which shows subsidence.
Two moving units (11 and 14, Figure 5A) were present in all of the interferograms examined. One of these units (14) persistently appears to move very slightly faster than the surrounding units and is perhaps responsible for the surprisingly square time averaged deformation signal noted in some lower resolution interferograms (Ebmeier et al., 2010, Figure 2). Most units appear in just a few interferograms, but one narrow unit of ~150 m across (5, 6, 7, Figure 5A) can be tracked in sequential interferograms: it moved more slowly than its neighboring units in October 2011 to May 2012 and then faster in October 2012 to January 2013, either during a single slip event or due to an increase in rate. These units are coincident with some of the most recent lava flow and pyroclastic deposits at Arenal (outlined on Figure 5B) and may be in an earlier stage of stabilization than other parts of the edifice. There may be some error from the topographic corrections over these young flows, but as this unit is present in some very short baseline interferograms (e.g., Figure 4A), this effect is thought to be minor.
The heterogeneous shape of the secondary characteristics of the deformation field may follow the internal structure of the post-1968 lava fields, with variations in the rate of motion due to stick-slip motion on different sliding planes. The small areas of these units (average width = 600 m) suggest that they are relatively shallow, independently moving slides.
Spatial Extent of Rockfalls
Intensity change images show continual surface alteration associated with reworking by semi-continuous rockfalls and rainwater erosion within drainage channels on Arenal's upper slopes. These rockfall zones (dark magenta-cyan on Figure 6, outlined in white) extend from elevations of ~1200–1600 m, and are separated by stable ridges of lava (brighter yellow on Figure 6).
In change detection images that span the 2012 Nicoya earthquake, the extent of the reworked drainage channels is slightly greater: the end of the dark channels extend further downslope by 20–100 m (Figure 6). The same increases in extent of rockfalls are identified by analysing interferometric phase correlation (e.g., Seymour and Cumming, 1994). Correlation values take their maximum value (1) where neighboring pixels have identical phase values, and minimum value (0) if pixel phase is entirely independent of its neighbors. Pixels will be decorrelated in an interferogram if objects within them either alter their physical properties or move between the acquisition of master and slave radar images. We compare the mean correlation of all of the 22-day interferograms in our dataset to the correlation of the 22-day image that spans the Nicoya Earthquake (Supplementary Figure 2). Correlation values at the base of drainage channels were ~0.2 lower in the interferogram that spanned the earthquake than on average (standard deviation = ~ 0.1), suggesting greater changes in scattering properties over this area.
Discussion
Response to External Triggers
Landslides are initiated when the frictional forces on a failure surface are exceeded. This can be caused by ground shaking if accelerations are sufficient to overcome cohesion and internal friction, or by an increase in pore fluid pressure on a failure surface that decreases shear strength. The upper slopes of Arenal are highly fractured and therefore well-drained, so hydrological loading is unlikely to be important in this case. We test this by making a coarse comparison of apparent displacement rate using interferograms within the Costa Rican “dry” (December-January, n = 5) and “wet” (May-November, n = 12) seasons. As expected, these show no difference in rate exceeding our expected errors, or in the spatial extent of displacements.
Shaking during an earthquake, however, is considered a potential landslide triggers at Arenal (Alvarado et al., 2010). A comparison of mean velocities derived from persistent scatterers for periods before, spanning and after the Nicoya earthquake also finds no significant difference in the rate or extent of deformation near Arenal's summit. There is a consistent offset of −1 cm on the lowest parts of the lava fields in interferograms spanning the earthquake and we speculate that this may relate to the withdrawal of groundwater facilitated by shaking (e.g., Wang et al., 2001).
We use a set of four change detection images with the first date (02.07.2012) in common to map the extent of the changing area covered by rockfalls between July and October 2012. The difference in rockfall area for pairs before (gray in Figure 7) and spanning (red in Figure 7) the earthquake is markedly greater than the changes over other time periods. Where both images were acquired after the earthquake, the extent of the rockfall zone is similar to that in the pre-earthquake maps. The 2012 Nicoya Earthquake was therefore associated with elevated volume and area of rockfalls at 1100–1250 m elevation that took place either during the earthquake or within 24 h after it, when the first post-earthquake TSX image was acquired.
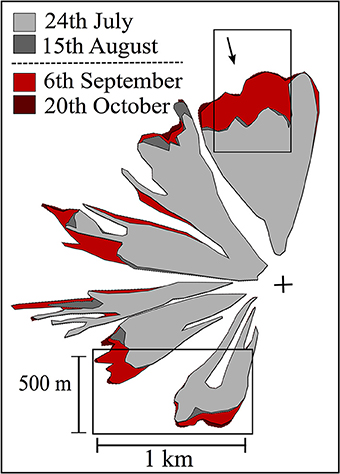
Figure 7. Outlines of areas of intensity change attributed to rock fall between 02.07.2012 and 4 later images. Pre-earthquake extent of rockfall is outlined in gray, rockfall extents from images that spanned the earthquake are red.
Landslide Thickness
To test our conjecture that the landslides are shallow, we use scaling relationships to estimate average landslide depths from their areas. Estimates of landslide volume (V) and erosion are commonly made from landslide area (A) using scaling relationships of the form V = αAγ, where the exponent (γ) and intercept (α) are derived from field measurements (e.g., Hovius et al., 1997; Larsen et al., 2010). These studies of shallow landslides are based on the analysis of landslide scars and clearly disturbed material after rapid mass wasting in soils and weathered bedrock. The processes at Arenal, in contrast, are “slow” landslides (<10 cm/year), taking place in well-drained, intensely fractured material. Alvarado et al. (2010) made geotechnical measurements of rocks at Arenal and observe that the alternating highly fractured lavas and tephras “behave as a unique unit of soil with large blocks” and that failure is most likely to occur along stratification surfaces. Tephra and pyroclastic deposits have the potential to weather to produce low shear strength layers (e.g., Wada, 1987).
If the process at Arenal is comparable to the non-volcanic landslides studied by Larsen et al. (2010), the average landslide depth as a ratio of volume to area would range from 5 to 11 m (± ~1% uncertainty in scaling relationship plus an estimated 20% uncertainty in estimation of landslide area). The two units that persist from 2010 to 2013 (11 and 14, Figure 5) may be as thick as 9–11 m, while short-lived, smaller units appear to be shallower (Table 1, Supplementary Table 2). The repeat time of TSX images may limit our ability to identify units where movements are similar to neighboring blocks, so that some landslide areas and therefore depths, may be overestimates. It is also possible that some of the moving units are coherent layers, such as individual lava flows, sliding on layers of low shear strength, such as altered tephras. In this case the scaling relationship described above would not capture the processes taking place at Arenal.
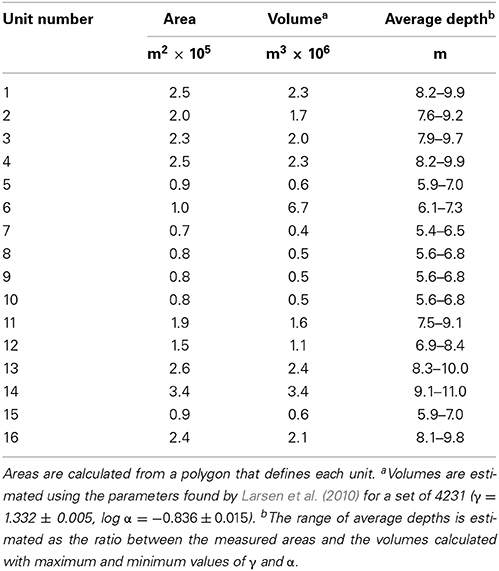
Table 1. Area, inferred volume and average depth of the units shown in Figure 5A.
Deposit Stability
About 7% of Arenal's surface area (2.7 × 10⁶ of ~3.8 × 10⁷ m2) is covered by active landslides. If these landslide may be considered analogous to non-volcanic shallow landslides, the total volume of sliding material between 2011 and 2013 is 2.8 × 10⁷m3, or 2.4 × 10⁷m3 Dense Rock Equivalent (DRE) volume (after Wadge et al., 2006). This is ~4% of the 5.6 × 10⁸m3 DRE added to the volcano between 1968 and 2011 (1968–2004 = 5.5 × 10⁸m3 DRE, Wadge et al., 2006; 2004–2011 = 7 × 10⁶m3 DRE, this work, after Ebmeier et al., 2012).
Ground shaking during the 2012 Nicoya earthquake was sufficient at Arenal to cause an increase in the extent of superficial rockfalls. However, there is no evidence of sudden failure or increased slip rate of any of the sliding units during the earthquake, suggesting that their movement is effective in stabilizing the most recent deposits on the volcano's upper slopes. There may be evidence of the long-term impact of such a process on Arenal's older, eastern flanks. Cecchi et al. (2004) observe three step-like features on the eastern flank (identified from DEM and aerial photographs) and attribute them to folds in the lava surface where layers are sliding downslope.
In the absence of a resurgence of eruptive activity, Arenal's young deposits are likely to continue both to slide downslope and consolidate, resulting in combined subsidence with a rate that decreases over time over much of Arenal's upper slopes. There have not been observations of widespread rock alteration at Arenal, despite the presence of an active hydrothermal system (Cecchi et al., 2004). Measurements of surface processes are important for the assessment of hazard at both active and quiescent volcanoes and allow us to distinguish between developing instabilities (increasing rate, deep rupture surface) and mass-spreading or stabilization (decreasing rate, many shallow units).
Conclusions
We provide evidence of thin-skinned mass wasting processes superimposed on longer wavelength subsidence at a continental stratovolcano following an extended period of eruption. We map 16 shallow landslides (5–11 m depth, 4% of post-1968 deposits) and expect failure planes to be associated with layers of blocky debris and lava crust. Rockfalls and shallow translational landsliding have a stabilizing effect on fresh deposits at Arenal that may reduce their susceptibility to external triggering of slope failure. The 2012 Nicoya Earthquake caused an unusually large extent of rockfalls, but no significant changes to the displacement rate of landsliding. Our measurements at Arenal demonstrate that high rates of deformation can be caused by shallow edifice processes, and should therefore be considered in the interpretation of geodetic measurements of post-eruptive subsidence.
Conflict of Interest Statement
The authors declare that the research was conducted in the absence of any commercial or financial relationships that could be construed as a potential conflict of interest.
Acknowledgments
Susanna K. Ebmeier and Juliet Biggs are supported by the NERC projects COMET (GA/13/M/031) and STREVA (NE/J019984/1). DLR's TanDEM-X data (GEO1069) were acquired with support from NERC small grant (NE/I015760/1). We thank Geoff Wadge, Tamsin Mather and Liz Holcombe for useful discussions.
Supplementary Material
The Supplementary Material for this article can be found online at: http://www.frontiersin.org/journal/10.3389/feart.2014.00035/abstract
Footnotes
1. ^ha = R sin θλ / 2Bp, where R = satellite height, λ = radar wavelength, θ = incidence angle and Bp is perpendicular baseline.
References
Alvarado, G. E., Carboni, S., Cordero, M., Avilés, E., and Valverde, M. (2010). “Stability of the cone and the foundation of Arenal volcano, Costa Rica,” in Volcanic Rock Mechanics. Rock Mechanics and Geo-engineering in Volcanic Environments, eds C. Olalla, L. E. Hernández, J. A. Rodríguez-Losada, Á. Perucho, and J. González-Gallego (London: CRC Press, Taylor & Francis Group, A. Balkema book), 135–150. doi: 10.1201/b10549-21
Alvarado, G. E., Soto, G. J., Schmincke, H. U., Bolge, L. L., and Sumita, M. (2006). The 1968 andesitic lateral blast eruption at Arenal volcano, Costa Rica. J. Volcanol. Geotherm. Res. 157, 9–33. doi: 10.1016/j.jvolgeores.2006.03.035
Avard, G., Pacheco, J., Martinez, M., van der Laat, R., Menjivar, E., Hernendez, H., et al. (2012). “Volcanic activity in Costa Rica in 2012,” in OVSICORI Official Annual Summary (Heredia: Universidad Nacional).
Baldi, P., Coltelli, M., Fabris, M., Marsella, M., and Tommasi, P. (2008). High precision photogrammetry for monitoring the evolution of the NW flank of Stromboli volcano during and after the 2002–2003 eruption. Bull. Volcanol. 70, 703–715. doi: 10.1007/s00445-007-0162-1
Ball, J. L., Calder, E. S., Hubbard, B. E., and Bernstein, M. L. (2013). An assessment of hydrothermal alteration in the Santiaguito lava dome complex, Guatemala: implications for dome collapse hazards. Bull. Volcanol. 75, 1–18. doi: 10.1007/s00445-012-0676-z
Borgia, A., Delaney, P. T., and Denlinger, R. P. (2000). Spreading volcanoes. Annu. Rev. Earth Planet. Sci. 28.1, 539–570. doi: 10.1146/annurev.earth.28.1.539
Borgia, A., Linneman, S., Spencer, D., Morales, L. D., and Andre, J. B. (1983). Dynamics of lava flow fronts, Arenal volcano, Costa Rica. J. Volcanol. Geotherm. Res. 19, 303–329. doi: 10.1016/0377-0273(83)90116-6
Cecchi, E., van Wyk de Vries, B., and Lavest, J. M. (2004). Flank spreading and collapse of weak-cored volcanoes. Bull. Volcanol. 67, 72–91. doi: 10.1007/s00445-004-0369-3
Cervelli, P., Segall, P., Johnsson, K., Lisowski, M., and Miklius, A. (2002). Sudden aseismic fault slip on the south flank of Kilauea volcano. Nature 415, 1014–1018. doi: 10.1038/4151014a
Pubmed Abstract | Pubmed Full Text | CrossRef Full Text | Google Scholar
Cigolini, C., Borgia, A., and Casertano, L. (1984). Intra-crater activity, a'a-block lava, viscosity and ow dynamics: Arenal volcano, Costa Rica. J. Volcanol. Geotherm. Res. 20, 155–176. doi: 10.1016/0377-0273(84)90072-6
Cole, P. D., Fernandez, E., Duarte, E., and Duncan, A. M. (2005). Explosive activity and generation mechanisms of pyroclastic flows at Arenal volcano, Costa Rica between 1987 and 2001. Bull. Volcanol. 67, 695–716. doi: 10.1007/s00445-004-0402-6
Ebmeier, S., Biggs, J., Mather, T., Elliott, J. R., Wadge, G., and Amelung, F. (2012). Measuring large topographic change with InSAR: lava thicknesses, extrusion rate and subsidence rate at Santiaguito volcano, Guatemala. Earth Planet. Sci. Lett. 335, 216–225. doi: 10.1016/j.epsl.2012.04.027
Ebmeier, S., Biggs, J., Mather, T., Wadge, G., and Amelung, F. (2010). Steady downslope movement on the western flank of Arenal volcano, Costa Rica. Geochem. Geophys. Geosyst. 11. doi: 10.1029/2010GC003263
Ebmeier, S., Biggs, J., Mather, T. A., and Amelung, F. (2013). Applicability of InSAR to tropical volcanoes: insights from Central America. Geol. Soc. Lond. Spec. Publ. 380, 15–37. doi: 10.1144/SP380.2
Feng, L., Newman, A. V., Protti, M., Gonzalez, V., Jiang, Y., and Dixon, T. H. (2012). Active deformation near the Nicoya peninsula, northwestern Costa Rica, between 1996 and 2010: interseismic megathrust coupling. J. Geophys. Res. Solid Earth (1978–2012) 117. doi: 10.1029/2012JB009230
Froger, J.-L., Fukushima, Y., Briole, P., Staudacher, T., Souriot, T., and Villeneuve, N. (2004). The deformation field of the August 2003 eruption at Piton de al Fournaise, Réunion Island, mapped by ASAR interferometry. Geophys. Res. Lett. 31. doi: 10.1029/2004GL020479
Gratton, L. (2014). Static and Dynamic Stress Change at 27 Volcanoes of the Central American Volcanic Arc After the Mw 7.6 Costa Rica Earthquake of 5 September 2012. Master's Thesis, Michigan Technological University.
Hannsen, R. (2001). Radar Interferometry: Data Interpretation and Error Analysis. Dordrecht: Kluwer Academic Publishers. doi: 10.1007/0-306-47633-9
Hooper, A., Zebker, H., Segall, P., and Kampes, B. (2004). A new method for measuring deformation on volcanoes and other natural terrains using InSAR persistent scatterers. Geophys. Res. Lett. 31. doi: 10.1029/2004GL021737
Hovius, N., Stark, C. P., and Allen, P. A. (1997). Sediment flux from a mountain belt derived by landslide mapping. Geology 25, 231–234.
Kampes, B., and Usai, S. (1999). “DORIS: the delft object-oriented radar interferometric software,” in 2nd International Symposium on Operationalization of Remote Sensing, Vol. 16 (Enschede: Citeseer), 20.
Larsen, I. J., Montgomery, D. R., and Korup, O. (2010). Landslide erosion controlled by hillslope material. Nat. Geosci. 3, 247–251. doi: 10.1038/ngeo776
Lu, Z., Masterlark, T., and Dzurisin, D. (2005). Interferometric synthetic aperture radar study of Okmok volcano, Alaska, 1992–2003: magma supply dynamics and postemplacement lava flow deformation. J. Geophys. Res. Solid Earth (1978–2012) 110. doi: 10.1029/2004JB003148
Montgomery, D. R., and Brandon, M. T. (2002). Topographic controls on erosion rates in tectonically active mountain ranges. Earth Planet. Sci. Lett. 201, 481–489. doi: 10.1016/S0012-821X(02)00725-2
Pubmed Abstract | Pubmed Full Text | CrossRef Full Text | Google Scholar
Mora, M. M., Lesage, P., Albino, F., Soto, G. J., and Alvarado, G. E. (2013). Continuous subsidence associated with the long-lasting eruption of Arenal volcano (Costa Rica) observed by dry-tilt stations. Geol. Soc. Am. Spec. Pap. 498, 45–56. doi: 10.1130/2013.2498(03)
Muller, C., del Potro, R., Biggs, J., Gottsman, J., Ebmeier, S. K., Guillame, S., et al. (in press). Integrated velocity field from ground and satellite geodetic techniques: insights from Arenal volcano. Geophys. J. Int. doi: 10.1093/gji/ggu444
Reid, M. E., Sisson, T. W., and Brien, D. L. (2001). Volcano collapse promoted by hydrothermal alteration and edifice shape, Mount Rainier, Washington. Geology 29, 779–782. doi: 10.1130/0091-7613(2001)029<0779:VCPBHA>2.0.CO;2
Rosen, P., Hensley, S., Gurrola, E., Rogez, F., Chan, S., Martin, J., et al. (2001). “SRTM C-band topographic data: quality assessments and calibration activities,” in Geoscience and Remote Sensing Symposium, 2001. IGARSS ‘01.IEEE 2001 International, Vol. 2 (Sydney, NSW: IEEE), 739–741. doi: 10.1109/IGARSS.2001.976620
Rosen, P. A., Hensley, S., Peltzer, G., and Simons, M. (2004). Updated repeat orbit interferometry package released. Eos Trans. Am. Geophys. Union 85, 47. doi: 10.1029/2004EO050004
Salzer, J. T., Nikkhoo, M., Walter, T. R., Sudhaus, H., Reyes-Dávila, G., Bretón, M., et al. (2014). Satellite radar data reveal short-term pre-explosive displacements and a complex conduit system at Volcán de Colima, Mexico. Front. Earth Sci. 2:12. doi: 10.3389/feart.2014.00012
Seymour, M., and Cumming, I. (1994). “Maximum likelihood estimation for SAR interferometry,” in Geoscience and Remote Sensing Symposium, 1994. IGARSS'94. Surface and Atmospheric Remote Sensing: Technologies, Data Analysis and Interpretation., International, Vol. 4 (Pasadena, CA: IEEE), 2272–2275. doi: 10.1109/IGARSS.1994.399711
Sigmundsson, F., Vadon, H., and Massonnet, D. (1997). Readjustment of the Krafla spreading segment to crustal rifting measured by satellite radar interferometry. Geophys. Res. Lett. 24, 1843–1846. doi: 10.1029/97GL01934
Simkin. (2002). Landslides resulting from structural failure of volcanoes. Rev. Eng. Geol. 15, 209–235. doi: 10.1130/REG15-p209c
Sparks, R. S. J., Young, S. R., Barclay, J., Calder, E. S., Cole, P., Darroux, B., et al. (1998). Magma production and growth of the lava dome of the Soufriere Hills Volcano, Montserrat, West Indies: November 1995 to December 1997. Geophys. Res. Lett. 25, 3421–3424. doi: 10.1029/98GL00639
Stevens, N. F., Wadge, G., Williams, C. A., Morley, J. G., Muller, J.-P., Murray, J. B., et al. (1999). Surface movements of emplaced lava flows measured by synthetic aperture radar interferometry. J. Geophys. Res. Solid Earth (1978–2012) 106, 11293–11313.
Varnes, D. J. (1978). “Slope movement types and processes,” in Slope Movement Types and Processes, Vol. 176, eds R. L. Schuster and R. J. Krizek (Washington, DC: Transportation Research Board), 11–13.
Wada, K. (1987). Minerals formed and mineral formation from volcanic ash by weathering. Chem. Geol. 60, 17–28. doi: 10.1016/0009-2541(87)90106-9
Pubmed Abstract | Pubmed Full Text | CrossRef Full Text | Google Scholar
Wadge, G., Cole, P., Stinton, A., Komorowski, J. C., Stewart, R., Toombs, A., et al. (2011). Rapid topographic change measured by high-resolution satellite radar at Soufriere Hills Volcano, Montserrat, 20082010. J. Volcanol. Geotherm. Res. 199, 142–152. doi: 10.1016/j.jvolgeores.2010.10.011
Wadge, G., Oramas Dorta, D., and Cole, P. (2006). The magma budget of Volcan Arenal, Costa Rica from 1980 to 2004. J. Volcanol. Geotherm. Res. 157, 60–74. doi: 10.1016/j.jvolgeores.2006.03.037
Wald, D. J., Worder, B. C., Quitoriano, V., and Pankow, K. L. (2005). ShakeMap Manual: Users Guide, Technical Manual and Software Guide, USGS Techniques and Methods 12-A1. Golden, CO: United States Geological Survey.
Wang, C. Y., Cheng, L. H., Chin, C. V., and Yu, S. B. (2001). Coseismic hydrologic response of an alluvial fan to the 1999 Chi-chi earthquake, Taiwan. Geology 29, 831–834. doi: 10.1130/0091-7613(2001)029<0831:CHROAA>2.0.CO;2
Whelley, P. L., Jay, J., Calder, E. S., Pritchard, M. E., Cassidy, N. J., Alcaraz, S., et al. (2011). Post-depositional fracturing and subsidence of pumice flow deposits: Lascar Volcano, Chile. Bull. Volcanol. 74, 511–531. doi: 10.1007/s00445-011-0545-1
Yue, H., Lay, T., Schwartz, S. Y., Rivera, L., Protti, M., Dixon, T. H., et al. (2013). The 5 September 2012 Nicoya, Costa Rica Mw 7.6 earthquake rupture process from joint inversion of high-rate GPS, strong-motion, and teleseismic P-wave data and its relationship to adjacent plate boundary interface properties. J. Geophys. Res. Solid Earth 118, 5453–5466. doi: 10.1002/jgrb.50379
Keywords: volcano, InSAR, stability, landslide, rockfall
Citation: Ebmeier SK, Biggs J, Muller C and Avard G (2014) Thin-skinned mass-wasting responsible for widespread deformation at Arenal volcano. Front. Earth Sci. 2:35. doi: 10.3389/feart.2014.00035
Received: 21 August 2014; Accepted: 11 November 2014;
Published online: 03 December 2014.
Edited by:
Zhong Lu, Southern Methodist University, USAReviewed by:
Matthieu Kervyn, Vrije Universiteit Brussel, BelgiumFeifei Qu, Chang'an University, China
Copyright © 2014 Ebmeier, Biggs, Muller and Avard. This is an open-access article distributed under the terms of the Creative Commons Attribution License (CC BY). The use, distribution or reproduction in other forums is permitted, provided the original author(s) or licensor are credited and that the original publication in this journal is cited, in accordance with accepted academic practice. No use, distribution or reproduction is permitted which does not comply with these terms.
*Correspondence: Susanna K. Ebmeier and Juliet Biggs, COMET, School of Earth Sciences, University of Bristol, Will's Memorial Building, Queen's Road, BS8 1RJ, Bristol, UK e-mail: sk.ebmeier@bristol.ac.uk; juliet.biggs@bristol.ac.uk