Quantification of water in hydrous ringwoodite
 Sylvia-Monique Thomas1*
  Steven D. Jacobsen2
  Craig R. Bina2 Patrick Reichart3
  Marcus Moser3 Erik H. Hauri4
  Monika Koch-Müller5
  Joseph R. Smyth6
  Günther Dollinger3
- 1Department of Geoscience, University of Nevada Las Vegas, Las Vegas, NV, USA
- 2Department of Earth and Planetary Sciences, Northwestern University, Evanston, IL, USA
- 3Department für Luft- und Raumfahrttechnik LRT2, Universität der Bundeswehr München, Neubiberg, Germany
- 4Department of Terrestrial Magnetism, Carnegie Institution of Washington, Washington, DC, USA
- 5Helmholtz-Zentrum Potsdam, Deutsches GeoForschungsZentrum (GFZ), Potsdam, Germany
- 6Department of Geological Sciences, University of Colorado Boulder, Boulder, CO, USA
Ringwoodite, γ-(Mg,Fe)2SiO4, in the lower 150 km of Earth's mantle transition zone (410–660 km depth) can incorporate up to 1.5–2 wt% H2O as hydroxyl defects. We present a mineral-specific IR calibration for the absolute water content in hydrous ringwoodite by combining results from Raman spectroscopy, secondary ion mass spectrometry (SIMS) and proton-proton (pp)-scattering on a suite of synthetic Mg- and Fe-bearing hydrous ringwoodites. H2O concentrations in the crystals studied here range from 0.46 to 1.7 wt% H2O (absolute methods), with the maximum H2O in the same sample giving 2.5 wt% by SIMS calibration. Anchoring our spectroscopic results to absolute H-atom concentrations from pp-scattering measurements, we report frequency-dependent integrated IR-absorption coefficients for water in ringwoodite ranging from 78,180 to 158,880 Lmol−1cm−2, depending upon frequency of the OH absorption. We further report a linear wavenumber IR calibration for H2O quantification in hydrous ringwoodite across the Mg2SiO4-Fe2SiO4 solid solution, which will lead to more accurate estimations of the water content in both laboratory-grown and naturally occurring ringwoodites. Re-evaluation of the IR spectrum for a natural hydrous ringwoodite inclusion in diamond from the study of Pearson et al. (2014) indicates the crystal contains 1.43 ± 0.27 wt% H2O, thus confirming near-maximum amounts of H2O for this sample from the transition zone.
Introduction
Ringwoodite was first described in the Tenham meteorite found in Queensland, Australia, by Binns et al. (1969) and named after the Australian mineral physicist Ted Ringwood. The first terrestrial occurrence of ringwoodite was recently reported by Pearson et al. (2014), who discovered a hydrous ringwoodite inclusion in ultra-deep diamonds from Juina, Brazil. Ringwoodite is one of the major components of the Earth's mantle transition zone (e.g., Bernal, 1936; Akaogi and Akimoto, 1977; Anderson and Bass, 1986; Bina and Wood, 1986; Irifune, 1987; Ringwood and Major, 1967) and although nominally anhydrous, ringwoodite is well-known to incorporate up to 1.5–2 wt% of water as (OH)− point defects in both laboratory-grown and naturally occurring samples (e.g., Kohlstedt et al., 1996; Bolfan-Casanova et al., 2000; Smyth et al., 2003; Pearson et al., 2014).
Water in nominally anhydrous minerals (NAMs) influences phase relations (e.g., Hirschmann, 2006), melting temperature (e.g., Hirth and Kohlstedt, 1996; Hirschmann et al., 2009; Tenner et al., 2012), and physical properties including electrical conductivity (e.g., Yoshino et al., 2009), thermal conductivity (Thomas et al., 2012), elasticity (e.g., Jacobsen, 2006), and rheology (e.g., Kavner, 2003). Several OH defect mechanisms have been studied in ringwoodite, mainly involving charge-compensating vacancies at the octahedral Mg-Fe sites, the tetrahedral Si site, and normally vacant interstitial sites (e.g., Kudoh et al., 2000; Smyth et al., 2003, 2004; Chamorro Pérez et al., 2006; Blanchard et al., 2009; Mrosko et al., 2013; Panero et al., 2013; Purevjav et al., 2014; Yang et al., 2014).
Because of its likely abundance (>50% of a pyrolite model) in the lower 150 km of the Earth's mantle transition zone (410–660 km depth) and for its ability to incorporate significant amounts of H2O, we have undertaken this study on determining the absolute water content in ringwoodite. Infrared (IR) spectroscopy is one of the most common tools for analysis of water in minerals, for which mineral-specific absorption coefficients are required. The absolute water content in minerals was conventionally determined by quantitative dehydration weight analyses (e.g., Aines and Rossman, 1984), but more suitable for the typically very small amounts (μg) of material from high-pressure and high-temperature syntheses, two additional methods have been developed: elastic recoil detection analysis (e.g., Aubaud et al., 2009; Bureau et al., 2009; Withers et al., 2012) and proton-proton (pp) scattering (e.g., Gose et al., 2008; Thomas et al., 2008; Reichart and Dollinger, 2009).
In addition to theoretically based IR calibrations for water in ringwoodite (Balan et al., 2008; Blanchard et al., 2009), experimentally determined IR absorption coefficients have been estimated for ringwoodite either by using general calibrations (Paterson, 1982; Libowitzky and Rossman, 1997) or from secondary ion mass spectrometry (SIMS) measurements of water contents, which we note are usually calibrated against the water content in silicate glasses or minerals measured by IR. Absorption coefficients for water quantification have been determined for ringwoodites with fayalite component (Fa100, Fe2SiO4) through Fa40 and for pure forsterite (Fo100, Mg2SiO4) composition (Koch-Müller and Rhede, 2010) but not for compositions spanning the likely Fe-content of the mantle transition zone from Fo75 to Fo95.
In this study we calibrate the water concentrations in synthetic hydrous ringwoodite from IR spectroscopy against independently determined values from Raman spectroscopy, SIMS and the absolute H-concentration measured by pp-scattering microscopy. Broad-beam pp-scattering has previously been applied to mm-sized samples (Thomas et al., 2008). However, until recently this quantification technique was not feasible for smaller samples synthesized under very high pressure-temperature conditions in the multi-anvil press. Here, we employ pp-scattering experiments on synthetic ringwoodite crystals less than 200 μm in largest dimension and quantify 3D distributions of atomic hydrogen at μm spatial resolution. We also present hydrogen depth-profiles and 2D hydrogen maps and H2O concentrations in samples used for the spectroscopic calibration. We calculate absorption coefficients for a suite of hydrous ringwoodite with varying Fe- and water concentrations, test their wavenumber-dependence, and compare results with literature data. The IR calibration can thus be used to determine the absolute water content in hydrous ringwoodite, which we also apply to the natural hydrous ringwoodite inclusion in diamond reported by Pearson et al. (2014).
Materials and Methods
Samples
Samples used in this study were synthesized at high P-T conditions in multi-anvil presses and cover a range of H2O contents and compositions (Table 1). Chemical analyses and other characterizations of the single crystals used in this study have been published elsewhere: for samples MA120, MA62, MA56, and MA75, see Koch-Müller and Rhede (2010), Taran et al. (2009), and Koch-Müller et al. (2009); Koch-Müller et al. (2011); for sample SZ0820, see Ye et al. (2012); for samples SZ9901 and SZ0104, see Smyth et al. (2003); Smyth et al. (2004), Thomas et al. (2012), and Jacobsen et al. (2004); for sample SZ0570, see Mao et al. (2011). High-quality, crack- and inclusion-free isotropic single crystals ranging in longest dimension from 50 to 500 μm were selected for analyses. The color of the ringwoodites used here varies from colorless to dark blue to almost opaque depending on Fe concentration.
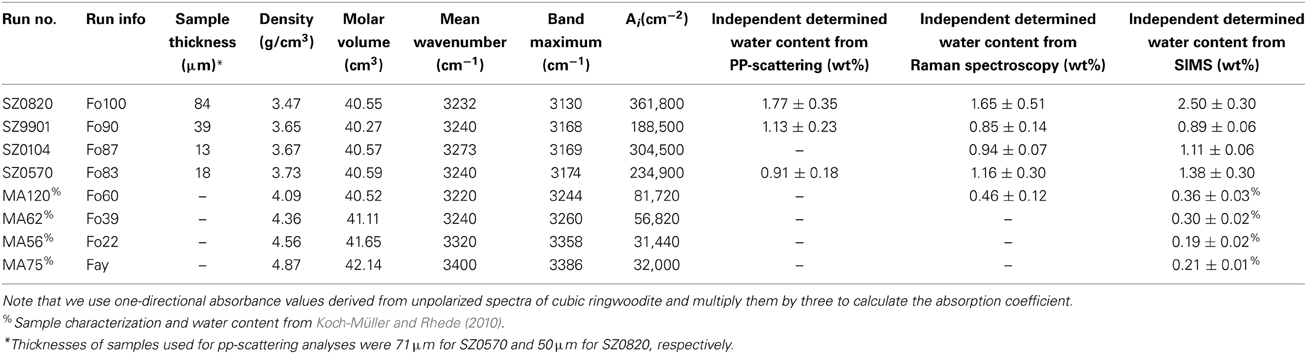
Table 1. Sample information and IR spectroscopic data for H2O analyses.
3D Hydrogen Microscopy by Proton-Proton Scattering
Proton-proton scattering at proton energies up to 25 MeV has been used in a broad-beam configuration to perform hydrogen depth microscopy in mm-sized mineral platelets, as described in Thomas et al. (2008) or Gose et al. (2008). A new detector setup has been installed at the nuclear microprobe SNAKE at the Munich tandem accelerator lab that enables 3D hydrogen microscopy of μm-sized objects by scanning a μm-focused beam. A detailed description can be found in Reichart and Dollinger (2009). The protons scattered from an elastic scattering reaction of an incident proton and a hydrogen atom are detected in coincidence by two pairs of Si-detectors with 16 strips on the front and back side each. The strips and a narrow timing window allow filtering of hydrogen events from all other scattering events with a detection limit below 1 at-ppm (1 atom out of 106 other atoms). The energy information of both protons is used to gain depth information with about μm depth resolution. As both coincident protons from the pp-scattering reaction have to be detected at the back of the sample, the scattering geometry requires unsupported samples. With a proton energy of 22 MeV as used in our analyses, thin but stable samples can be prepared. Our samples were ground and polished until they had a final thickness <100 μm (SZ9901 39 μm, SZ0570 71 μm, SZ0820 50 μm). Crystal edges were glued to copper grids with mesh sizes ranging from 150 to 400 μm. From the scattering probability and the proton beam current, the number of coincident events from a certain thickness gives the atomic hydrogen in H-atoms/cm2. We convert this to H atoms per total atoms using the atomic density of the samples determined by other methods such as X-ray crystallography.
IR Spectroscopy
In preparation for IR measurements single crystals were doubly polished using diamond spray. Unpolarized IR spectra of randomly oriented synthetic ringwoodite were recorded from 1850 to 4000 cm−1 at ambient conditions using a Bruker Tensor 37 FTIR spectrometer with a KBr beamsplitter, globar source, and Hyperion microscope with MCT detector. Up to 1024 scans were taken with a resolution of 2 cm−1 through a 100 × 100 μm aperture. The sample thickness was determined using the eyepiece reticule and stage micrometer scale of the optical microscope. The final thicknesses varied from 13 to 84 μm depending on the specimen (Table 1). A linear baseline correction in the integration limits between 2000 and 3900 cm−1 was applied for all our spectra. Peak positions, integrated absorbances, band maxima, and area-weighted average (Libowitzky and Rossman, 1996, 1997) of band positions were determined using PeakFit (Systat Software, Inc.). We applied a Gaussian/Lorentzian distribution function to all component bands. Polarized measurements are not needed for isotropic minerals, where the absorbance is linearly dependent on the species concentration and thickness of the sample. Here we use one-directional absorbance values derived from unpolarized spectra of cubic ringwoodite and multiply them by three for subsequent calculations.
Raman Spectroscopy
The same single crystals used in the IR study were characterized with confocal microRaman spectroscopy with no additional sample preparation required. All analyses were performed in backscattering geometry using an Andor Shamrock 0.3 m spectrograph (1800 grooves/mm grating) coupled to an Andor Newton DU970 EM-CCD camera, an Olympus optical microscope and a long working distance Mitutoyo 100× objective (LWD VIS, NA = 0.70, WD = 6.0 mm). The 458-nm line of a solid-state Melles Griot laser source with ~250 mW output power was used for sample excitation. Laser intensity at the sample was ~18 mW. For all measurements a confocal aperture of 100 × 100 μm was used and spectra were acquired from 50 to 1300 cm−1. Counting times ranged from 10 to 100 s with 3 accumulations. Counting times for spectra in the frequency range from 2800 to 4000 cm−1 were 100 s at 5 accumulations. After a linear baseline correction was performed, spectra were integrated between 2000 and 3900 cm−1. The KOG glass (Thomas et al., 2008) was used as reference material. A molar volume correction factor of 0.79 for differences between sample and reference material was used for quantification (see Mrosko et al., 2011).
Secondary-ion Mass Spectrometry
SIMS measurements of hydrogen in ringwoodite were carried out on the Cameca NanoSIMS 50L scanning ion microprobe at the Carnegie Institution of Washington. Polished single crystals were mounted in indium. To flatten the surface and fill cavities around the crystals, the whole assembly was pressed carefully with 4.9 t in a hydraulic hand press. The 16OH− signal was standardized using natural and synthetic minerals described in Koga et al. (2003) and Hauri et al. (2006): olivines SynFo100, SynFo68, GRR1012, KLV-23; orthopyroxenes KBH-1, India, Kenya, A288; garnets MON-9, ROM263-9, ROM263-25, ROM263-52; clinopyroxene PMR-53. We also used additional olivines and pyroxenes from the Monastery kimberlite that were studied by Bell et al. (2004): olivines ROM177, ROM250-13, ROM250-2; clinopyroxenes ROM271-10, ROM271-16, ROM271-21; orthopyroxene ROM273. Detailed analytical setup and methodology information is described in Hauri et al. (2006) and Koga et al. (2003).
Results
IR Spectroscopy
Unpolarized IR spectra of ringwoodite with forsterite numbers Fo100-Fo83 are illustrated in Figure 1. Spectra are offset for clarity. The IR spectra show broad absorption bands of OH stretching vibrations with maxima of the main band ranging from ~3130 to 3174 cm−1 and additional bands at ~3656 to 3675 cm−1, 3531 to 3568 cm−1, and ~2500 cm−1 (see Table 1 and Figure 1). Band intensities vary and band maxima of the main band shift to higher wavenumbers with increasing iron content.
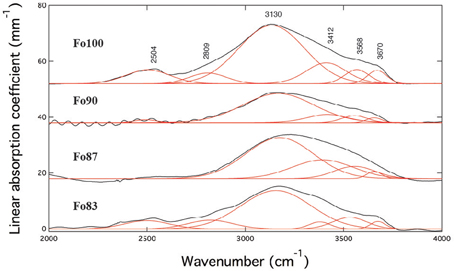
Figure 1. Unpolarized IR spectra (black) including band deconvolution (red) of Fe-free (Fo100) and Fe-bearing hydrous ringwoodites at room pressure. Spectra show broad absorption features with band maxima ranging from ~3130 to 3174 cm−1, from ~3531 to 3568 cm−1, and from ~3656 to 3675 cm−1. The feature at ~2500 cm−1 has been assigned to overtones by e.g., Hofmeister and Mao (2001) and was excluded from further quantification calculations. Spectra are offset for clarity.
Raman Spectroscopy
Unpolarized Raman spectra for ringwoodites used in this study are shown in Figure 2. The spectrum of pure Mg-ringwoodite (Figure 2A) displays expected Raman modes at ~322, 444, 665, 794, and 829 cm−1, which are due to antisymmetric (T2g) and symmetric (A1g) stretching vibrations of the isolated SiO4 tetrahedra (Chopelas et al., 1994), whereas an association of the Raman bands at ~300 cm−1 and 400 cm−1 with octahedral cation vibrations is under discussion (McMillan and Akaogi, 1987; Chopelas et al., 1994). Representative spectra for more iron-rich samples show similar patterns (Figure 2B), with the strongest Raman peaks at ~794 and 835 cm−1 dominating. In addition, low-frequency bands with slightly varying intensities and positions at ~200 cm−1 are present in the Fe-bearing samples (Figure 2B). These signals might be associated with localized modes generated by Fe substitution (Fe2+, Fe3+) (Kleppe et al., 2002; Kleppe and Jephcoat, 2006), which explains their absence in pure Mg-ringwoodite (Figures 2A,B). Additional weak modes at >700 cm−1 might be associated with vibrations due to Si2O7 (Kleppe and Jephcoat, 2006). The high-frequency range (Figures 2A,D) of all samples studied here shows broad OH band features due to OH stretching vibrations in accordance with observations from IR spectroscopy, which allow water quantification by Raman spectroscopy. Figure 2C shows the Raman spectrum of the reference silica glass used in this study containing 332 wt ppm H2O (Thomas et al., 2008). Note, that Figure 2B is meant for illustrative purposes only; spectra have not been normalized and intensities are given in arbitrary units representing measurements taken on different days with different count rates, laser intensities and accumulations, allowing only qualitative comparison.
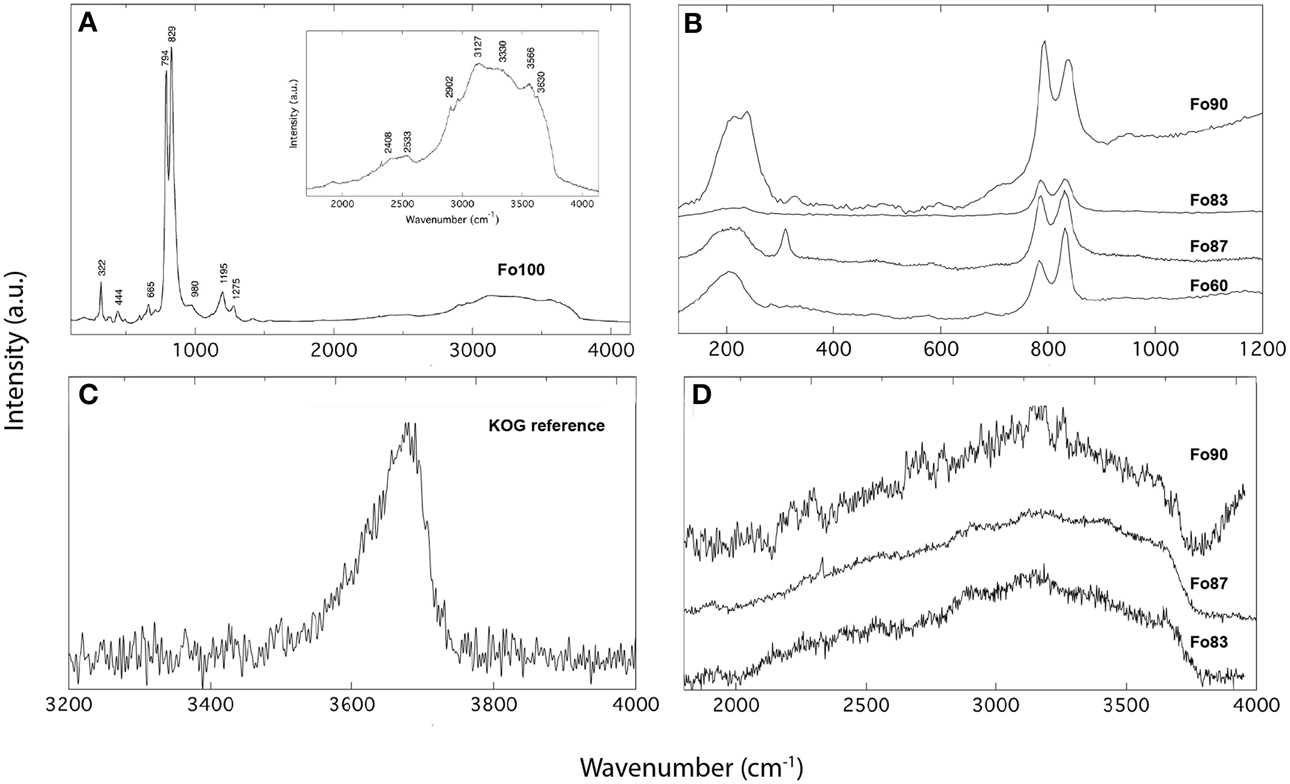
Figure 2. Raman spectra of Mg-ringwoodite (A) and Fe-bearing ringwoodite (B) showing characteristic lattice vibrations in the low-frequency range and OH bands in the high-frequency range (D). The spectrum of the reference glass KOG with 332 wt ppm is shown in (C). Intensities are given in arbitrary units.
Water Contents and Mineral-Specific Absorption Coefficients
Ringwoodite water contents determined by confocal micro-Raman spectroscopy, SIMS, and pp-scattering (Table 1) are in good agreement. Based on SIMS analysis, the H2O concentration of the five samples studied here ranges from 0.36 wt% H2O to 2.5 wt% H2O (see Table 1). Figure 3 shows hydrogen maps and depth profiles from selected areas derived from pp-scattering analyses for μm-sized crystals of Fo100, 90, and 83 super-glued on copper grids. Depth profiles allow separation of surface water and internal bulk hydrogen (or glue contamination, see Figure 3A), measured as H atoms per square cm. Assuming density and composition, the depth scale and thickness is calculated from energy loss of the protons, giving H atoms per total atoms in the selected areas. Background-corrected values for Fo100, 90, and 83 were calculated as 1.77 ± 0.35 wt% H2O, 1.13 ± 0.23 wt% H2O, and 0.91± 0.18 wt% H2O, respectively, assuming all detected H is incorporated as hydroxyl groups.
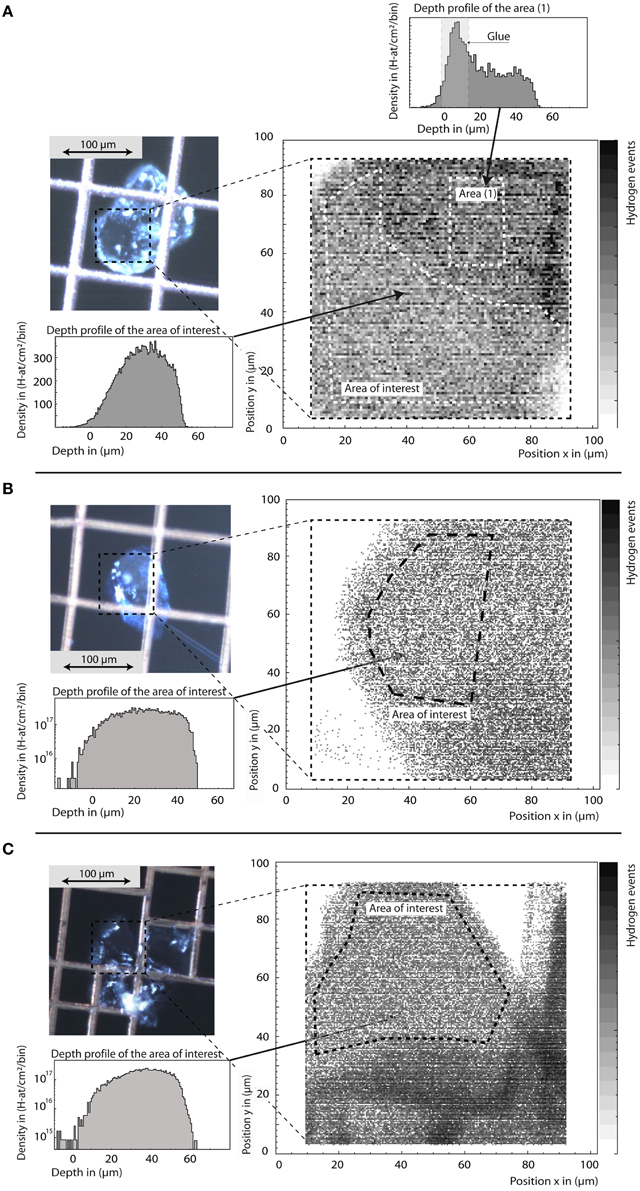
Figure 3. Sample images, hydrogen maps, and depth profiles of ringwoodites SZ0820 (Fo100, A), SZ0570 (Fo83, B), and SZ9901 (Fo90, C) from pp-scattering. The total scan area is marked in the sample images. From the hydrogen maps we are able to select areas of interest for quantitative depth profiles (B,C in log scale for better background visibility). Outside areas may be covered by the supporting mesh grid or contaminated by glue residue, as clearly observed in the depth profile from this area (A). Note that the tail at depth from 0 to 20 μm in the depth profiles reveals that the crystals do not have the same thickness over the total area of interest. Hence, scattered protons may have an energy loss shift so that the events are redistributed toward apparently larger depth values. The integral content in H-atoms/cm2 is not changed, but uncertainty in total depth has to be taken into account for concentration calculation as stated in the text.
From independently determined water concentrations (cH2O), peak-fitted integrated areas (Ai) from IR spectroscopy, sample thickness (d) and sample density (ρ), mineral-specific IR absorption coefficients (Table 2) were calculated for Fo60, 83, 87, 90, and 100 compositions using the Beer-Lambert law, ε = (Ai × 1.8)/(d × ρ × cH2O), where d is the sample thickness in cm, ρ is the sample density in g/cm3, and cH2O is the H2O content in wt%. Note that we use the integrated absorbance from one crystallographic direction multiplied by three for our calculations. Based on Raman spectroscopy, absorption coefficients for ringwoodite of Fo60 to Fo100 composition range from 78,180 ± 23,460 Lmol−1cm−2 to 158,880 ± 47,660 Lmol−1cm−2 (Table 2). The relative error of absorption coefficients is mainly determined by the error of the water concentration from all analyses (7–22% relative uncertainty from SIMS, 20% relative uncertainty from pp-scattering and 30% relative uncertainty from Raman spectroscopy), the surface quality of the samples, and spectral fits.
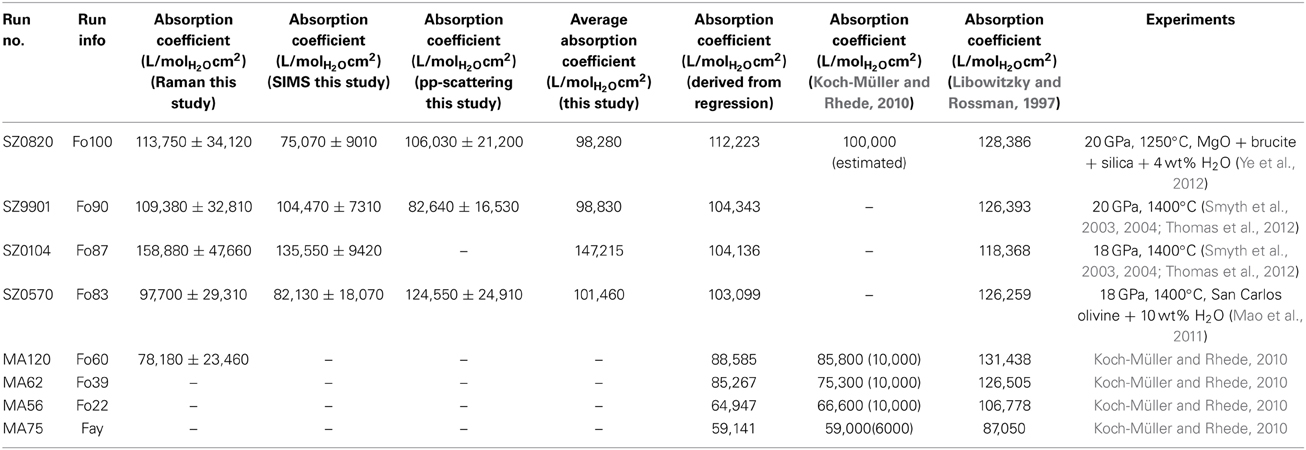
Table 2. Comparison of absorption coefficients for ringwoodite from this study and literature.
Discussion
IR spectroscopy allows investigation of water incorporation mechanisms in NAMs (e.g., Libowitzky and Beran, 2006). For ringwoodite, mechanisms include protonation of oxygen sites (hydroxyl, OH−) associated with the vacant and partially vacant 16c and 16d octahedral sites, [VMg(OH)2]x, Mg2+ substitution for Si4+ on the tetrahedral site, [MgSi(OH)2]x, tetrahedral silicon vacancies with a hydrogarnet type defect, [VSi(OH)4]x, and defects on tetrahedral edges, [Mg/Fe2+/Fe3+Si(OH)2]x (e.g., Kudoh et al., 2000; Smyth et al., 2003; Blanchard et al., 2009; Mrosko et al., 2013; Panero et al., 2013; Purevjav et al., 2014; Yang et al., 2014). IR spectra of synthetic ringwoodite reported are similar to previous studies (e.g., Bolfan-Casanova et al., 2000; Kudoh et al., 2000; Smyth et al., 2003; Chamorro Pérez et al., 2006; Mrosko et al., 2013).
Following the band assignments of Mrosko et al. (2013), based on heating experiments, and Hofmeister and Mao (2001), the main OH band at ~3130 cm−1 is most likely composed of various bands and associated with protonation of octahedral vacancies; the bands at 3656 to 3675 cm−1 and 3531 to 3568 cm−1 are associated with tetrahedral defects of either the hydrogarnet substitution or Mg replacing Si atoms, and the features at ~2500 cm−1, present in anhydrous and hydrous ringwoodite are due to overtones of Si-O vibrations. Contingent upon the increasing Fe-concentration in our samples we observe the expected shift of the main OH band to higher wavenumbers (e.g., Libowitzky, 1999; Mrosko et al., 2013), from ~3130 cm−1 in Fo100 to 3174 cm−1 in Fo83. Mrosko et al. (2013) report that an increasing iron concentration also affects the high-frequency band at ~3675 cm−1, which in this case causes a shift to lower wavenumbers. Here, we do not observe a significant negative shift of this band. This might be due to the relatively low iron content and the low Fe-contrast between our samples (from Fo100 to Fo83), hence such a shift might be resolvable only when comparing samples with more extreme differences in total Fe-concentration. We also do not observe a direct correlation between sample Fe-content and water concentrations for our synthetic ringwoodites. The latter are consistent with prior reported values, which typically range up to 2.5 wt% H2O and 1.48 wt% in synthetic and natural samples, respectively (Kohlstedt et al., 1996; Smyth et al., 2003; Pearson et al., 2014; Yang et al., 2014). In agreement with Koch-Müller and Rhede (2010), we observe a general increase in the integrated molar absorption coefficient with decreasing OH-stretching frequency of the band maximum (Table 2 and Figure 5).
A comparison of ringwoodite-specific IR absorption coefficients derived from water quantification using a variety of analytical techniques is shown in Figure 5. The two solid lines give the general trends of absorption coefficients for water in hydrous minerals and glasses vs. wavenumber of the corresponding OH bands (Paterson, 1982; Libowitzky and Rossman, 1997). Since more than one peakfit solution exists for the broad OH band pattern in ringwoodite, we chose to plot band maxima vs. absorption coefficient instead of weighted mean wavenumbers, as suggested in Libowitzky and Rossman (1997). The good correlation between absorption coefficient and band maxima reflects the dominance of the main OH feature in the IR spectra, i.e., the prevalence of the associated incorporation mechanism. For ringwoodite we observe a frequency-dependence of the absorption coefficient, which shows an increase with decreasing wavenumber due to interrelations of OH dipole strength, O-H… O geometry and OH band intensity (for details see Koch-Müller and Rhede, 2010), similar to what has been communicated by Paterson (1982) and Libowitzky and Rossman (1997) (Figure 5).
Our observations support conclusions of Koch-Müller and Rhede (2010) that the use of a single absorption coefficient for water quantification in ringwoodite is not recommended. Instead, a frequency-dependent calibration specific to ringwoodite is needed, which reflects a range of OH-O distances connected to variance in sample composition, i.e., element concentrations, densities, and molar volumes. From Raman spectroscopy, we determine absorption coefficients ranging from 78,180 ± 23,460 Lmol−1cm−2 to 158,880 ± 447,660 Lmol−1cm−2 for ringwoodite samples of Fo60 to Fo100 composition (see Table 2 and Figure 4). All values (except the Raman value for Fo87) for our ringwoodites plot below the calibration curves of Paterson (1982) and Libowitzky and Rossman (1997), which is in good agreement with findings by Balan et al. (2008), Blanchard et al. (2009), and Koch-Müller and Rhede (2010). Koch-Müller and Rhede (2010) report wavenumber-dependent absorption coefficients for synthetic Fe-Mg-ringwoodites with Fa100 to Fo60 compositions. Based on their experimentally determined wavenumber dependence and density/molar volume dependence of the calibration constant they estimate absorption coefficients of 101,613 Lmol−1cm−2 and 105,877 Lmol−1cm−2 for Mg-ringwoodite, respectively, with an OH band maximum of 3120 cm−1. These values are in good agreement with our experimentally determined average absorption coefficient for Mg-ringwoodite from SIMS, Raman, and pp-scattering of 98,280 Lmol−1cm−2 (Table 2) with a slightly increased band maximum of 3130 cm−1.
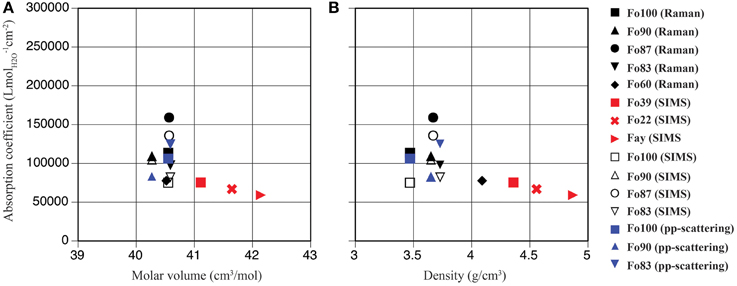
Figure 4. Mineral-specific IR absorption coefficients in ringwoodite plotted vs. molar volume (A) and density (B); pp-scattering (blue symbols), SIMS (open black symbols), Raman spectroscopy (filled black symbols), and Koch-Müller and Rhede (2010) (red symbols).
From our absorption coefficients based on OH band maxima (Figure 5) and data points obtained by Koch-Müller and Rhede (2010) we calculate a regression line, which can be used to determine IR absorption coefficients for ringwoodites: y = –207.35x + 761,228, where y is the absorption coefficient in Lmol−1cm−2 and x is the band maximum of the strongest OH band in cm−1. Based on this linear regression the value for Mg-ringwoodite with a band maximum of 3130 cm−1 calculates as 112,223 Lmol−1cm−2 (Table 2) and for a band maximum of 3120 cm−1 as 114,296 Lmol−1cm−2. Koch-Müller and Rhede (2010) conclude that wavenumber-independent absorption coefficients, such as those for olivine and quartz (Thomas et al., 2009), are valid for minerals of the same composition with comparable atomic distances. Absorption coefficients, however, strongly depend on structure changes. This has been shown for SiO2 polymorphs, where coefficients increase from quartz to coesite and stishovite, as the densities of the structures and thus the mean O-O distances decrease (Thomas et al., 2009; Koch-Müller and Rhede, 2010). Koch-Müller and Rhede (2010) explain the frequency dependence of the absorption coefficient in ringwoodite by strongly differing mineral compositions (Fe/Mg substitution), which may result in a continuous decrease of the O-H—O distances with increasing Mg. They find that within the polymorphic series of γ-(Mg,Fe)2SiO4 the absorption coefficient increases with decreasing density and molar volume, which we do not observe for the synthetic ringwoodites of Fo100 to Fo83 composition (Figure 4).
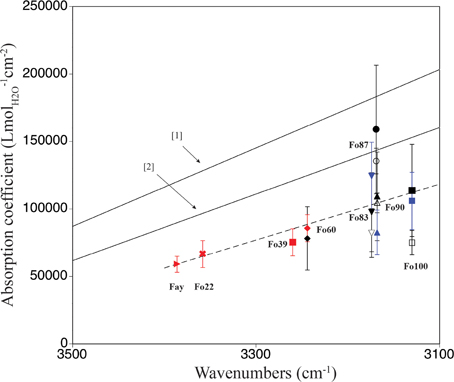
Figure 5. Comparison of mineral-specific IR absorption coefficients for ringwoodite calculated in this study [pp-scattering (blue), SIMS (open black symbols), Raman spectroscopy (filled black symbols)] and data from [1] Paterson (1982), [2] Libowitzky and Rossman (1997), and 2010, SIMS, red). The x-axis gives the band maxima of the strongest OH band determined by peak fitting. Note that this figure contains values derived from one absorbance direction multiplied by three to allow comparison between published absorption coefficient values. The linear regression (dashed line), y = –207.35x + 761228, allows calculation of IR absorption coefficients for water quantification in ringwoodite.
Our work illustrates that using general IR calibration trends reported by Paterson (Koch-Müller and Rhede (1982) and Libowitzky and Rossman (1997) would underestimate water concentrations in ringwoodite as previously discussed by Koch-Müller and Rhede (2010). Our absorption coefficients give up to 34% higher H2O contents than the general calibration trends would estimate. We have produced a linear wavenumber-dependent IR calibration for water quantification in a ringwoodite series representing Fa to Fo compositions, which will result in more accurate estimations of the water content in natural and synthetic ringwoodites.
Finally, using this new calibration for water in ringwoodite we re-evaluated the OH-absorption spectrum of the natural hydrous ringwoodite diamond inclusion from Pearson et al. (2014). Note that Pearson et al. (2014) utilized absorption coefficient and density estimates for pure Mg-ringwoodite (3.9 g/cm3). This leads to a large uncertainty, which was estimated to be ±50% by Pearson et al. (2014). The combination of IR spectra (OH band maxima) and density data from a suite of synthetic ringwoodite samples studied here (Table 1) allows a better density estimate of ~3.65 g/cm3 for their ringwoodite inclusion and indicates a forsterite number of ~90. Usage of the new density and a more suitable absorption coefficient (106,002 Lmol−1cm−2) for the OH band maximum at 3160 cm−1 results in a water content of 1.36–1.50 wt% H2O in their natural sample. While the new wavenumber-dependent calibration confirms originally projected H2O concentrations (1.35–1.49 wt% H2O), it reduces the uncertainty by more than half, to ~20%. Our new estimate for the uncertainty in the water content of the natural hydrous ringwoodite (Pearson et al., 2014) includes a Gaussian error propagation of relative errors from peak-fitted integrated areas (5%), sample density (5%), sample thickness (15%), and absorption coefficient (10%). With an absolute H2O content of 1.43(±0.27) wt%, we thus confirm that the natural inclusion from the transition zone contains near-maximum amounts of H2O.
Author Contributions
Sylvia-Monique Thomas, Steven D. Jacobsen, and Craig R. Bina are responsible for project design, funding, and wrote the manuscript. Sylvia-Monique Thomas is responsible for sample preparation and FTIR and Raman analyses. Monika Koch-Müller provided sample MA120 and associated FTIR analysis. Joseph R. Smyth synthesized samples SZ9901, SZ0820, and SZ0104. Erik H. Hauri and Steven D. Jacobsen carried out SIMS analyses. Patrick Reichart, Günther Dollinger, and Marcus Moser performed pp-scattering experiments and analyses. All authors contributed to the discussion and final manuscript.
Conflict of Interest Statement
The authors declare that the research was conducted in the absence of any commercial or financial relationships that could be construed as a potential conflict of interest.
Acknowledgments
This research was supported by NSF grant EAR-1215957 awarded to Sylvia-Monique Thomas, by grants from the NSF (EAR-0748707), the David and Lucile Packard Foundation, the Alexander von Humboldt Foundation, and the Carnegie/DOE Alliance Center (CDAC) to Steven D. Jacobsen and by NSF grant EAR-11-13369 to Joseph R. Smyth. Additional support is provided by the DFG via DFG Pu 131/7-2, Pu 131/9-1, and Do 438/10-1 and the Maier-Leibnitz-Laboratorium für Kernß und Teilchenphysik der LMU und TU München. We thank Neal Blair for use of the FTIR microscope at Northwestern University.
References
Akaogi, M., and Akimoto, S. (1977). Pyroxene-garnet solid solution equilibria in the system Mg4Si4O12-Mg3Al2Si3O12 and Fe4Si4O12-Fe3Al2Si3O12 at high pressures and temperatures. Phys. Earth Planet. Inter. 15, 90–106. doi: 10.1016/0031-9201(77)90013-9
Anderson, D. L., and Bass, J. D. (1986). Transition region of the Earth's upper mantle. Nature 320, 321–328.
Pubmed Abstract | Pubmed Full Text | CrossRef Full Text | Google Scholar
Aubaud, C., Bureau, H., Raepsaet, C., Khodja, H., Withers, A. C., Hirschmann, M. M., et al. (2009). Calibration of the infrared molar absorption coefficients for H in olivine, clinopyroxene and rhyolitic glass by elastic recoil detection analysis. Chem. Geol. 262, 78–86. doi: 10.1016/j.chemgeo.2009.01.001
Balan, E., Refson, K., Blanchard, M., Delattre, S., Lazzeri, M., Ingrin, J., et al. (2008). Theoretical infrared absorption coefficients of OH groups in minerals. Am. Mineral. 93, 950–953. doi: 10.2138/am.2008.2889
Bell, D. R., Rossman, G. R., and Moore, R. O. (2004). Abundance and partitioning of OH in a high-pressure magmatic system: megacrysts from the Monastery Kimberlite, South Africa. J. Petrol. 45, 1539–1564. doi: 10.1093/petrology/egh015
Bina, C. R., and Wood, B. J. (1986). The 400-km seismic discontinuity and the proportion of olivine in the Earth's upper mantle. Nature 324, 449–451. doi: 10.1038/324449a0
Binns, R. A., Davis, R. J., and Reed, S. J. B. (1969). Ringwoodite, natural (Mg,Fe)2SiO4 spinel in the Tenham meteorite. Nature 221, 943–944. doi: 10.1038/221943a0
Blanchard, M., Balan, E., and Wright, K. (2009). Incorporation of water in iron-free ringwoodite: a first principle study. Am. Mineral. 94, 83–89. doi: 10.2138/am.2009.3020
Bolfan-Casanova, N., Keppler, H., and Rubie, D. C. (2000). Water partitioning between nominally anhydrous minerals in the MgO-SiO2-H2O system up to 24 GPa: implications for the distribution of water in the Earth's mantle. Earth Planet. Sci. Lett. 182, 209–221. doi: 10.1016/S0012-821X(00)00244-2
Bureau, H., Raepsaet, C., Khodja, H., Carraro, A., and Aubaud, C. (2009). Determination of hydrogen content in geological samples using elastic recoil detection analysis (ERDA). Geochim. Cosmochim. Acta 73, 3311–3322. doi: 10.1016/j.gca.2009.03.009
Chamorro Pérez, E. M., Daniel, I., Chervin, J. C., Dumas, P., Bass, J. D., and Inoue, T. (2006). Synchrotron IR study of hydrous ringwoodite γ-Mg2SiO4 up to 30 GPa. Phys. Chem. Miner. 33, 502–510. doi: 10.1007/s00269-006-0096-8
Chopelas, A., Boehler, R., and Ko, T. (1994). Thermodynamics and behavior of γ-Mg2SiO4 at high pressure: implications for Mg2SiO4 phase equilibrium. Phys. Chem. Miner. 21, 351–359. doi: 10.1007/BF00203293
Gose, J., Reichart, P., Dollinger, G., and Schmädicke, E. (2008). Water in natural olivine-determined by proton-proton scattering analysis. Am. Mineral. 93, 1613–1619. doi: 10.2138/am.2008.2835
Hauri, E. H., Gaetani, G. A., and Green, T. H. (2006). Partitioning of water during melting of the Earth's upper mantle at H2O-undersaturated conditions. Earth Planet. Sci. Lett. 248, 715–734. doi: 10.1016/j.epsl.2006.06.014
Hirschmann, M. M. (2006). Water, melting, and the deep Earth H2O cycle. Annu. Rev. Earth Planet. Sci. 34, 629–653. doi: 10.1146/annurev.earth.34.031405.125211
Hirschmann, M. M., Tenner, T. J., Aubaud, C., and Withers, A. C. (2009). Dehydration melting of nominally anhydrous mantle: the primacy of paritioning. Phys. Earth Planet. Inter. 176, 54–68. doi: 10.1016/j.pepi.2009.04.001
Hirth, G., and Kohlstedt, D. L. (1996). Water in the oceanic upper mantle: implications for rheology, melt extraction and the evolution of the lithosphere. Earth Planet. Sci. Lett. 199, 93–108. doi: 10.1016/0012-821X(96)00154-9
Hofmeister, A. M., and Mao, H. K. (2001). Evaluation of shear moduli and other properties of silicates with the spinel structure from IR spectroscopy. Am. Mineral. 86, 622–639.
Irifune, T. (1987). An experimental investigation of the pyroxene-garnet transformation in a pyrolite composition and its bearing on the constitution of the mantle. Phys. Earth Planet. Inter. 45, 324–336. doi: 10.1016/0031-9201(87)90040-9
Jacobsen, S. D. (2006). “Effect of water on the equation of state of nominally anhydrous minerals,” in Water in Nominally Anhydrous Minerals, Vol. 62, eds H. Keppler and J. R. Smyth (Chantilly, VA: Reviews in Mineralogy and Geochemistry, Mineralogical Society of America), 321–342.
Jacobsen, S. D., Smyth, J. R., Spetzler, H., Holl, C. J., and Frost, D. J. (2004). Sound velocities and elasticity of Fe-bearing hydrous ringwoodite. Phys. Earth Planet. Inter. 143–144, 47–56. doi: 10.1016/j.pepi.2003.07.019
Kavner, A. (2003). Elasticity and strength of hydrous ringwoodite at high pressure. Earth Planet. Sci. Lett. 214, 645–654. doi: 10.1016/S0012-821X(03)00402-3
Kleppe, A. K., and Jephcoat, A. P. (2006). “Raman spectroscopic studies of hydrous and nominally anhydrous deep mantle phases,” in Earth's Deep Water Cycle. Geophysical Monograph Series, Vol. 168, eds S. D. Jacobsen and S. van der Lee (Washington, DC: American Geophysical Union), 69–93.
Kleppe, A. K., Jephcoat, A. P., Smyth, J. R., and Frost, D. J. (2002). On protons, iron and the high-pressure behavior of ringwoodite. Geophys. Res. Lett. 29, 17-1–17-4. doi: 10.1029/2002GL015276
Koch-Müller, M., and Rhede, D. (2010). IR absorption coefficients for water in nominally anhydrous high-pressure minerals. Am. Mineral. 95, 770–775. doi: 10.2138/am.2010.3358
Koch-Müller, M., Rhede, D., Schulz, R., and Wirth, R. (2009). Breakdown of hydrous ringwoodite to pyroxene and spinelloid at high P and T and oxidizing conditions. Phys. Chem. Miner. 36, 329–341. doi: 10.1007/s00269-008-0281-z
Koch-Müller, M., Speziale, S., Deon, F., Mrosko, M., and Schade, U. (2011). Stress-induced proton disorder in hydrous ringwoodite. Phys. Chem. Miner. 38, 65–73. doi: 10.1007/s00269-010-0383-2
Koga, K., Hauri, E., Hirschmann, M., and Bell, D. (2003). Hydrogen concentration analyses using SIMS and FTIR: comparison and calibration for nominally anhydrous minerals. Geochem. Geophys. Geosyst. 4, 1019–1039. doi: 10.1029/2002GC000378
Kohlstedt, D. L., Keppler, H., and Rubie, D. C. (1996). Solubility of water in the α, β and γ phases of (Mg,Fe)2SiO4. Contrib. Mineral. Petrol. 123, 345–357. doi: 10.1007/s004100050161
Kudoh, Y., Kuribayashi, T., Mizobata, H., and Ohtani, E. (2000). Structure and cation disorder of hydrous ringwoodite, γ-Mg1.89Si0.98H0.30 O4. Phys. Chem. Miner. 27, 474–479. doi: 10.1007/s002690000091
Libowitzky, E. (1999). Correlation of O-H stretching frequencies and O-H...O hydrogen bond lengths in minerals. Monatsh. Chem. 130, 1047–1059. doi: 10.1007/978-3-7091-6419-8_7
Libowitzky, E., and Beran, A. (2006). “The structure of hydrous species in nominally anhydrous minerals: information from polarized IR spectroscopy,” in Water in Nominally Anhydrous Minerals, Vol. 62, eds H. Keppler and J. R. Smyth (Chantilly, VA: Reviews in Mineralogy and Geochemistry, Mineralogical Society of America), 29–52.
Libowitzky, E., and Rossman, G. R. (1996). Principles of quantitative absorbance measurements in anisotropic crystals. Phys. Chem. Miner. 23, 319–327. doi: 10.1007/BF00199497
Libowitzky, E., and Rossman, G. R. (1997). An IR absorption calibration for water in minerals. Am. Mineral. 82, 1111–1115.
Mao, Z., Jacobsen, S. D., Frost, D. J., McCammon, C. A., Hauri, E. H., Duffy, T. S., et al. (2011). Effect of hydration on the single-crystal elasticity of Fe-bearing wadsleyite to 12 GPa. Am. Mineral. 96, 1606–1612. doi: 10.2138/am.2011.3807
McMillan, P., and Akaogi, M. (1987). Raman spectra of b-Mg2SiO4 (modifieds spinel) and γ-Mg2SiO4 (spinel). Am. Mineral. 72, 361–364.
Mrosko, M., Koch-Müller, M., and Schade, U. (2011). In-situ mid/far micro-FTIR spectroscopy to trace pressure-induced phase transitions in strontium feldspar and wadsleyite. Am. Mineral. 96, 1748–1759. doi: 10.2138/am.2011.3731
Mrosko, M., Lenz, S., McCammon, C. A., Taran, M., Wirth, R., and Koch-Müller, M. (2013). Hydrogen incorporation and the oxidation state of iron in ringwoodite: a spectroscopic study. Am. Mineral. 98, 629–636. doi: 10.2138/am.2013.4245
Panero, W., Smyth, J. R., Pigott, J. S., Liu, Z., and Frost, D. J. (2013). Hydrous ringwoodite to 5 K and 35 GPa: multiple hydrogen bonding sites resolved with FTIR spectroscopy. Am. Mineral. 98, 637–642. doi: 10.2138/am.2013.3978
Paterson, M. S. (1982). The determination of hydroxyl by infrared absorption in quartz, silicate glass and similar materials. Bull. Mineral. 105, 20–29.
Pearson, D. G., Brenker, F. E., Nestola, F., McNeill, J., Nasdala, L., Hutchison, M. T., et al. (2014). Hydrous mantle transition zone indicated by ringwoodite included within diamond. Nature 507, 221–224. doi: 10.1038/nature13080
Pubmed Abstract | Pubmed Full Text | CrossRef Full Text | Google Scholar
Purevjav, N., Okuchi, T., Tomioka, N., Abe, J., and Harjo, S. (2014). Hydrogen site analysis of hydrous ringwoodite in mantle transition zone by pulsed neutron diffraction. Geophys. Res. Lett. 41, 6718–6724. doi: 10.1002/2014GL061448
Reichart, P., and Dollinger, G. (2009). “Hydrogen analysis by proton-proton scattering,” in Handbook of Modern Ion Beam Materials Analysis, 2nd Edn., eds Y. Wang and M. Nastasi (Pennsylvania, PA: Materials Research Society), 187–205.
Ringwood, A. E., and Major, A. (1967). High-pressure reconnaissance investigations in the system Mg2SiO4-MgO-H2O. Earth Planet. Sci. Lett. 2, 130–133. doi: 10.1016/0012-821X(67)90114-8
Smyth, J. R., Holl, C. M., Frost, D. J., and Jacobsen, S. D. (2004). High pressure crystal chemistry of hydrous ringwoodite and water in the Earth's interior. Phys. Earth Planet. Inter. 143–144, 271–278. doi: 10.1016/j.pepi.2003.08.011
Smyth, J. R., Holl, C. M., Frost, D. J., Jacobsen, S. D., Langenhorst, F., and McCammon, C. A. (2003). Structural systematics of hydrous ringwoodite and water in Earth's interior. Am. Mineral. 88, 1402–1407.
Taran, M. N., Koch-Müller, M., Wirth, R., Abs-Wurmbach, I., Rhede, D., and Greshake, A. (2009). Spectroscopic studies of synthetic and natural ringwoodite, γ-(Mg,Fe)2SiO4. Phys. Chem. Miner. 36, 217–232. doi: 10.1007/s00269-008-0271-1
Tenner, T. J., Hirschmann, M. M., and Humayun, M. (2012). The effect of H2O on partial melting of garnet peridotite at 3.5 GPa. Geochem. Geophys. Geosyst. 13: Q03016. doi: 10.1029/2011GC003942
Thomas, S.-M., Bina, C. R., Jacobsen, S. D., and Goncharov, A. F. (2012). Radiative heat transfer in a hydrous mantle transition zone. Earth Planet. Sci. Lett. 357–358, 130–136. doi: 10.1016/j.epsl.2012.09.035
Thomas, S.-M., Koch-Müller, M., Reichart, P., Rhede, D., Thomas, R., Wirth, R., et al. (2009). IR calibrations for water determination in olivine, r-GeO2 and SiO2-polymorphs. Phys. Chem. Miner. 36, 489–509. doi: 10.1007/s00269-009-0295-1
Thomas, S.-M., Thomas, R., Davidson, P., Reichart, P., Koch-Müller, M., and Dollinger, G. (2008). Application of Raman spectroscopy to quantify trace water concentrations in glasses and garnets. Am. Mineral. 93, 1550–1557. doi: 10.2138/am.2008.2834
Withers, A. C., Bureau, H., Raepsaet, C., and Hirschmann, M. M. (2012). Calibration of infrared spectroscopy by elastic recoil detection analysis of H in synthetic olivine. Chem. Geol. 334, 92–98. doi: 10.1016/j.chemgeo.2012.10.002
Yang, X., Keppler, H., Dubrovinsky, L., and Kurnosov, A. (2014). In-situ infrared spectra of hydroxyl in wadsleyite and ringwoodite at high pressure and high temperature. Am. Mineral. 99, 724–729. doi: 10.2138/am.2014.4634
Ye, Y., Brown, D. A., Smyth, J. R., Panero, W. R., Jacobsen, S. D., Chang, Y., et al. (2012). Compressibility and thermal expansion of hydrous ringwoodite with 2.5(3) wt% H2O. Am. Mineral. 97, 573–582. doi: 10.2138/am.2012.4010
Yoshino, T., Matsuzaki, T., Shatskiy, A., and Katsura, T. (2009). The effect of water on the electrical conductivity of olivine aggregates and ist implications for the electrical structure of the upper mantle. Earth Planet. Sci. Lett. 288, 291–300. doi: 10.1016/j.epsl.2009.09.032
Pubmed Abstract | Pubmed Full Text | CrossRef Full Text | Google Scholar
Keywords: IR spectroscopy, water in nominally anhydrous minerals, transition zone, mineral-specific absorption coefficient, SIMS, Raman spectroscopy, proton-proton scattering, ringwoodite
Citation: Thomas S-M, Jacobsen SD, Bina CR, Reichart P, Moser M, Hauri EH, Koch-Müller M, Smyth JR and Dollinger G (2015) Quantification of water in hydrous ringwoodite. Front. Earth Sci. 2:38. doi: 10.3389/feart.2014.00038
Received: 13 October 2014; Accepted: 19 December 2014;
Published online: 28 January 2015.
Edited by:
Mainak Mookherjee, Cornell University, USAReviewed by:
Geoffrey David Bromiley, University of Edinburgh, UKMarc Blanchard, CNRS - Université Pierre et Marie Curie, France
Copyright © 2015 Thomas, Jacobsen, Bina, Reichart, Moser, Hauri, Koch-Müller, Smyth and Dollinger. This is an open-access article distributed under the terms of the Creative Commons Attribution License (CC BY). The use, distribution or reproduction in other forums is permitted, provided the original author(s) or licensor are credited and that the original publication in this journal is cited, in accordance with accepted academic practice. No use, distribution or reproduction is permitted which does not comply with these terms.
*Correspondence: Sylvia-Monique Thomas, Department of Geoscience, University of Nevada Las Vegas, 4505 S. Maryland Parkway, LFG 114, Las Vegas NV 89154-4010, USA e-mail: sylvia-monique.thomas@unlv.edu