An impending geomagnetic transition? Hints from the past
 Carlo Laj
 Catherine Kissel
- 1Département de Géosciences, Ecole Normale Supérieure, PSL Research University, Paris, France
- 2Laboratoire des Sciences du Climat et de l'Environnement, CEA-Centre National de la Recherche Scientifique-Université de Versailles Saint-Quentin-en-Yvelines, Gif-sur-Yvette, France
The rapid decrease of the geomagnetic field intensity in the last centuries has led to speculations that an attempt to a reversal or an excursion might be under way. Here we investigate this hypothesis by examining past records of geomagnetic field intensity obtained from sedimentary cores and from the study of cosmogenic nuclides. The selected records describe geomagnetic changes with an unprecedented temporal resolution between 20 and 75 kyr B.P. We find that some aspects of the present-day geomagnetic field have some similarities with those documented for the Laschamp excursion 41 kyr ago. Under the assumption that the dynamo processes for an eventual future reversal or excursion would be similar to those of the Laschamp excursion, we tentatively suggest that, whilst irreversible processes that will drive the geodynamo into a polarity change may have already started, a reversal or an excursion should not be expected before 500–1000 years.
Introduction
Since the first measurements made by the observatories, the Earth's magnetic field intensity has been diminishing at an average rate of 5% per century, about an order of magnitude faster than the rate expected for simple decay by diffusion. This has led to speculations that the geomagnetic field might be in the early stages of a polarity reversal or an excursion.
Gubbins (1987) noted that a patch of flux occurring below the southern tip of Africa had opposite sign to that expected for a dipole field in the Southern Hemisphere, when extrapolated at the core mantle boundary (the South Atlantic Anomaly or SAA). He suggested that “the present fall of the dipole field is directly related to the intensification and southward migration of this and other similar patches and that the fall may occasionally leads to polarity reversal.”
More recently, Hulot et al. (2002) have compared the 2002 data from the Danish Oersted Satellite with those obtained from the US satellite Magsat that operated in 1979/1980 and interpreted variations of the magnetic field over this 20 years period down to previously inaccessible length scales. Hulot et al. (2002) showed that growth and poleward migration of these reversed flux patches account almost entirely for the decrease in the dipole field in the last two centuries. They postulate “that the present magnetic state of the Earth may be one in which the geodynamo operates before reversing,” consistent with, but with a much better spatial resolution than Gubbins' (1987) suggestion.
This last point was also addressed by Olson (2002) in a News and Views comment associated with the Hulot et al. (2002) article. Although stating that it is premature to conclude that the present day downward directed field in the Southern Hemisphere will continue to grow until the present field is entirely canceled, this author also concluded that “the rapidly evolving reverse flux pattern suggests that an attempt to reversal may be under way.”
Very recently, De Santis and Qamili (2015 and references therein) have considered the evolution of the South Atlantic Anomaly (SAA) and its progressive extension over the last 400 years. They find that there has been an acceleration in the rate at which the SAA expands. Also, fitting the surface extension of the SAA with power laws or logarithmic functions, in analogy with critical phenomena, they define a critical time tc when the SAA area will reach almost an hemisphere in the very near future (tc = 2034 ± 3 yr AD). They interpret tc not as the exact moment of a geomagnetic reversal or excursion, but rather as the time when irreversible processes that will drive the geodynamo into a polarity change will start. Even more recently, it has been suggested that low field values of the SAA might be a recurrent phenomena related to the unusual CMB of the region (Tarduno et al., 2015).
Different factors, that certainly must be considered when trying to assess whether or not the field is entering a reversal, have been carefully scrutinized by different authors. Olson and Amit (2006) and Constable and Korte (2006) have independently examined past records of geomagnetic field intensity and concluded that the variations of the field strength over the past few hundred years are not anomalous compared to values observed over a 7500 years interval of the CALS7.K2 model of Korte and Constable (2005). These authors also note that, although decreasing fast, the intensity of the present dipole is higher than its average over the entire Brunhes chron, while it is known that polarity reversals and excursions coincide with significant lows in intensity that last longer than the directional changes.
The present reversal rate is 3.7/Myr and the last reversal (M-B) occurred at 0.78 Ma, so that it may appear that the next reversal is overdue. However, Constable and Korte (2006) have shown that the probability of observing a chron as long as the present Brunhes one is not improbably low [using the Cande and Kent (1995) time scale for reversal and assuming that the irregular times for reversals are described by a Poisson model].
The question of the rate of decrease of the geomagnetic field strength has also been considered by Gubbins et al. (2006). Intensity data are available since 1840 and while in the GUFM1 model, Jackson et al. (2000) linearly extrapolated the post-1840 axial dipole component back in time to 1590, Gubbins et al. (2006) have suggested that the rate of decrease of has not been regular in the last centuries: it has been of the order of 2 (±1) nT/yr prior to 1840 when it suddenly changed to 15 nT/yr. Extrapolating to the core surface, they have proposed that this rapid decrease originates from patches and poleward motion of reverse magnetic flux in the Southern Hemisphere, in agreement with previous results. They found little or no evidence of field strength changes prior to 1840 supporting the idea of a stable dipole up to 1840 (Gubbins et al., 2006). Finlay (2008) gave a similar interpretation, but Suttie et al. (2011) did a more rigorous assessment of data errors than Gubbins et al. (2006) and found that the recent dipole decay most likely extends back to ~1590 AD. Their work suggest a decay rate of ~11 to 15 nT/yr in the period since 1590.
Is this very high rate of decrease of the field strength (one order of magnitude larger than expected from simple decay by diffusion) a sign for an impending geomagnetic instability (reversal or excursion)? Here we examine this hypothesis by comparing the present rate to what can be observed from the past, similarly to Olson and Amit (2006) and Constable and Korte (2006). Different from these authors, however, instead of using a model, we base our observation on a paleomagnetic stacked record of geomagnetic field intensity that extends over the past 75 kyr (GLOPIS-75; Laj et al., 2004) combined with records of the 10Be (Muscheler et al., 2004) and 36Cl (Wagner et al., 2000a) concentrations in the Greenland ice cores. The GLOPIS-75 record is characterized by a very precise evaluation of past intensity changes with sedimentary and volcanic data combined, coupled with an age model of unprecedented resolution. The time interval of 75 kyr comprises two episodes of low intensity coinciding with the Laschamp and the Mono Lake excursions, and a period of low intensity that did not lead to a directional reversal. It is thus possible to investigate whether the rate of change could be a specific characteristic in these two different states of the geodynamo.
The Data
Because the purpose of this paper is to evaluate as precisely as possible the rate of the changes in geomagnetic field intensity, it is critical to base this study on the most precise and accurate available data. The accuracy has to be fulfilled in the two dimensions: age model and absolute paleointensity changes. We therefore first describe our selection among different existing datasets from sediments collected over a large enough geographical area and stacked to represent the dipolar intensity behavior and from ice cores.
Magnetic Sedimentary Data
After the construction of the low resolution stacks SINT-200 (Guyodo and Valet, 1996) and SINT-800 (Guyodo and Valet, 1999), a new stack, NAPIS-75 (Laj et al., 2000) has been proposed. It is based on six individual records characterized by high sedimentation rates (from 11 to 40 cm/kyr) yielding a time resolution of the magnetic records varying between 100 and 300 years. The sites are located at very different water depths (from 777 to 4461 m) and distributed from the northern part of the sub-polar North Atlantic to the Bermuda Rise, therefore separated by as much as 5000 km. In addition to their time resolution, these paleomagnetic records were selected on the basis of the extremely uniform magnetic properties of the sediments, a pre-requisite for robust relative paleointensity (RPI) recording. These sedimentary sequences were placed on the Greenland GISP2 ice core age model assuming that the melting peaks clearly recognized in the glacial planktonic oxygen isotopic record of the core closest to Greenland (PS2644-5) illustrate major iceberg discharges and therefore coincide with the coldest periods over Greenland (Voelker et al., 1998; Laj et al., 2000). Magnetic-concentration parameters and ash layer NAAZII were also used for correlation. The remarkable similarity and phasing of the RPI records, when reported on this common time scale, indicate that these cores, characterized by different environmental settings, did not suffer from significant lock-in depth phenomena. All these characteristics made NAPIS-75 a reference curve for the variations of the intensity of the geomagnetic field over the last 75 kyr.
However, NAPIS-75, although obtained from a large area in the North Atlantic, could eventually suffer from its too restricted geographical coverage. To overcome this problem, another stack (GLOPIS-75) based on 24 different RPI records obtained from northern and southern hemispheres (longitudes from 73°W to 50°E, latitudes from 47°S to 67°N) has been constructed (Laj et al., 2004). Each record has been selected on the basis of its high time resolution with sedimentation rates of 15.5 cm/kyr on the average (from 7 cm/kyr for one core up to 40 cm/kyr) associated to a sampling interval corresponding to a resolution of 110 years at best. All the records were first correlated to the NAPIS-75 stack, then interpolated every 200 years and stacked. A method has been specifically developed to progressively remove outliers at each horizon (Laj et al., 2004).
This GLOPIS-75 stack has been scaled to absolute intensity values using the volcanic and archeomagnetic data available at the time (Laj et al., 2004; and references therein) matching the lowest intensity around 40–41 kyr and the continuously documented slope between 10 and 20 kyr. A recent compilation of paleointensity results obtained from new K-Ar and 40Ar/39Ar dated lava flows has entirely confirmed the accuracy of this initial calibration to absolute intensity values of the GLOPIS-75 record (Laj et al., 2014).
The Greenland ice age model has evolved with time and the GLOPIS-75 stack has been recently reported on the GICC05 age model of the NorthGRIP ice core (Laj et al., 2014). This age model is based down to 60 kyr (in the unit b2k, i.e., before 2000) on multi-elemental annual layer counting (Andersen et al., 2006; Svensson et al., 2006, 2008) and extended beyond that age by splicing this age scale with the previous GRIP SS09 sea time scale (Johnsen et al., 2001) shifted by 705 years (Wolff et al., 2010). The main difference with the GISP2 age model, at the scale where time evolution of paleointensity is examined here, is mainly for periods older than 42 kyr, finally aging the sequence by about 3.5 at 75 kyr.
In Figure 1A, the GLOPIS-75 record is reported as variations in the virtual axial dipole moment (VADM) vs. the GICC05 age model which is the most accurate age model existing so far for this time interval. The long term pattern starts with a plateau around the present-day value between 80 and 72 kyr, followed by a decrease toward an intensity minimum (4 × 10²² Am2 between 69 and 65 kyr) and a broad maximum reached (11–12 × 1022 Am2) between 56 and 48 kyr. Significant fluctuations are superimposed to this maximum that is some 20% above the present day field intensity. These appear to be less marked after the field intensity has decreased to present field value at around 47 kyr. The following period up to ~33 kyr is punctuated by two pronounced and distinct intensity lows corresponding to the Laschamp and the Mono Lake excursions occurring during the climatic interstadial 10 and stadial 7 (Dansgaard et al., 1993), respectively. After a new short increase to ~9 × 10²² Am2 at 32–31 kyr and a plateau at ~6 × 10²² Am2 between 29 and 21 kyr, the intensity increases continuously to about 11 × 1022 Am2 in the last millennia (the most recent period is described by volcanic data).
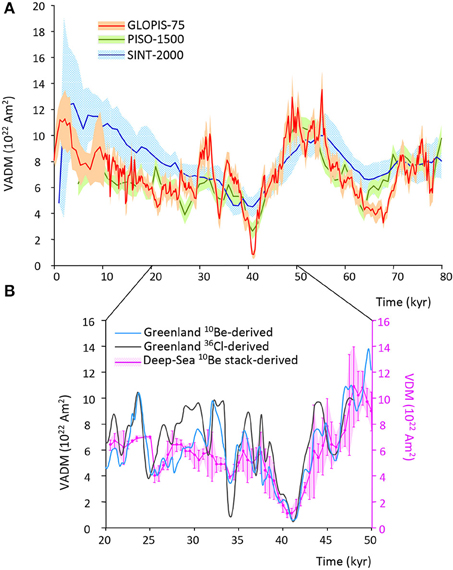
Figure 1. Sedimentary (A) and cosmonuclides-derived (B) records of the earth magnetic field intensity discussed in the text, all reported in their own age models. In (A) GLOPIS-75 (in red) is from Laj et al. (2004); Sint-2000 (in blue) from Valet et al. (2005); and PISO-1500 (in green) from Channell et al. (2009). In (B) the turquoise and gray curves are for intensity curves derived from 10Be (Muscheler et al., 2004) and 36Cl (Wagner et al., 2000a), respectively. Both records are filtered at 1/800 years. The pink curve is derived from the deep-sea 10Be stack from Ménabréaz et al. (2012).
Other paleointensity stacks have then been produced from magnetic analyses in sediments [SINT 2000; Valet et al. (2005) and PISO-1500; Channell et al. (2009)]. These stacks are very valuable when long periods of time are considered, as they extend to 2.0 and 1.5 Myr respectively but they are far from reaching the same time resolution and dynamical range of GLOPIS-75 on the short time interval of 0–75 kyr (Figure 1A).
Recently, Nowaczyk et al. (2012) have reported on a sedimentary stack from the Black Sea covering the 39.4–50 kyr time interval. This stack is based on five cores, all very close to one another. The age model, based on the long-distance correlation between changes in sedimentary parameters observed at that site and changes in the Greenland oxygen isotope record, gives sedimentation rates of 25 cm kyr−1 in the vicinity of the Laschamp excursion. This is based on the assumption that the environmental magnetic and climatic records did not suffer from any climatic lead or lag despite differences with U/Th dating obtained from nearby speleothems (Fleitmann et al., 2009). In addition to this hypothesis of simultaneity, the interpretation of the results of the Black Sea cores is complicated by the magnetic mineralogy of the sediments. Sulfides which carry diagenetic magnetizations that may postdate deposition appear to coexist with magnetite. Nowaczyk et al. (2012) used an arbitrary cut off value of various magnetic parameters to exclude samples containing sulfides but it appears from the other laboratory experiments (Figure 4 in Nowaczyk et al., 2012) that sulfides are ubiquitous in these cores. Therefore, their post-depositional magnetizations may bias the recording of fast directional/paleointensity changes all along the cores and in particular those occurring during the Laschamp excursion itself (see Laj and Channell, 2015).
Nowaczyk et al. (2012) report on a total duration of the directional variations for the Laschamp excursion, of about 1.2 kyr (including about 440 years of negative polarity), exceeding the estimations based on other sedimentary records (e.g., Channell et al., 2012; Laj et al., 2014). In their stack, Nowaczyk et al. (2012) do not report on the Mono Lake excursion because it is observed in only two of the cores, the other ones suffering from a hiatus of sedimentation.
Despite the high-resolution sampling and detailed laboratory analyses, given the very narrow geographical distribution of the cores from the Black Sea, the assumptions on which their age model is based and their magnetic mineralogy, we believe that the overall reliability, time resolution and geographical extension of GLOPIS-75 make it a better choice for discussing of the dynamical aspects of the Laschamp excursion.
Cosmonuclides Records
Records of the abundance of cosmogenic nuclides 10Be and 36Cl in natural archives provide another proxy of the geomagnetic intensity. These nuclides are produced by the interaction of galactic cosmic-ray particles with atmospheric constituents at altitudes where the geomagnetic field is dominated by its dipole component. The lower the dipolar field intensity, the higher is the cosmonuclides production rate. With a value of 550 MeV for the solar modulation, a fifth-order polynomial relates the geomagnetic dipolar intensity and the cosmonuclides production rate (Masarik and Beer, 1999; Wagner et al., 2000b). The latitudinal dependence of the dipolar shielding effect (larger at low latitudes than at the poles) is canceled by the mid-latitude stratospheric and tropospheric mixing which are efficient over a few years (Beer et al., 1990, 2002; Baroni et al., 2011). This implies that the concentration of atmospheric cosmonuclides deposited at the surface of the earth, wherever the site, is representative of their production. In particular, 10Be attached to aerosols and 36Cl mainly present in gaseous HCl form are removed from the atmosphere on a yearly time scale by wet precipitations and deposited in polar ice and in deep-sea sediments where they can be measured.
In ice, 10Be is directly incorporated with negligible intra-ice migration effect (e.g., Beer et al., 2002). 36Cl is also reliably incorporated in high accumulation rate (~1 to 2 m/kyr) Greenland Summit ice (Baumgartner et al., 1998; Wagner et al., 2000b; Delmas et al., 2004) contrarily to Antarctic ice, characterized by slow accumulation (a few cm/kyr) and low dust content (Wagnon et al., 1999; Delmas et al., 2004). Consequently, 10Be and 36Cl fluxes in Greenland ice yield robust profiles of absolute dipolar field intensity changes vs. the very accurate Greenland ice age model. They can therefore be compared to the sedimentary GLOPIS-75 record not only in time but also in amplitude.
The Greenland 10Be record has been obtained from different ice cores and by different laboratories and a spliced record has been constructed (Muscheler et al., 2004). In order to remove the non-geomagnetic effects on the 10Be production, we filtered the frequencies higher than 1/800 years. This filtered record is reported in Figure 1B as changes in Earth magnetic field intensity (VADM) with a calculated point every 50 years. A first low resolution 36Cl record, also obtained from GRIP ice core (Wagner et al., 2000b), has been later better defined with a closer sampling around the Mono Lake and the Laschamp excursions. These high-resolution data (Wagner et al., 2000a) superseded the low-resolution record reported in Wagner et al. (2000b) although, due to differences in the publication agenda of the different journals, they were published earlier. In Figure 1B, this detailed 36Cl record is also filtered at 800 years with one point every 50 years.
Both 10Be and 36Cl records clearly show the two excursions with a full recovery of the intensity in between. The 36Cl record better describes the Mono Lake with a dipole intensity low as marked as that of the Laschamp excursion. This dipole low is confirmed by volcanic data from different geographical areas (e.g., Laj et al., 2014).
In deep-sea sediments, cosmonuclide measurements only concern 10Be which does not exchange with the atmosphere once introduced into the ocean. The residence time of 10Be in the ocean is still not precisely evaluated but it seems to be of the order of 500 years with respect to the scavenging in case of high accumulation sites (e.g., Ménabréaz et al., 2012). Similarly to the magnetic sedimentary signal, 10Be concentration in sediments can only be interpreted in terms of relative paleointensity variations provided that the raw signal is corrected for environmental factors. Two methods have prevailed over the last 20 years for this correction: (i) normalization by 230Th-excess which quantifies rates of particle rain to the seafloor and corrects for syndepositional sediment redistribution by bottom currents or (ii) normalization by authigenic 9Be controlled by terrigenous inputs. These two methods have been compared on the same sequence and yielded similar results (Ménabréaz et al., 2011). Pioneer studies conducted in marine sediments evidenced 10Be peaks coinciding with the Laschamp (Cini-Castagnoli et al., 1995; Robinson et al., 1995) and with both the Laschamp and Mono Lake dipole lows (McHargue et al., 1995). These studies were conducted at rather low resolution as was the 10Be stack proposed by Frank et al. (1997) and more recently by Christl et al. (2010).
Over the last 10 years, other authigenic 10Be/9Be ratios profiles have been published from a mid-latitude site (off Portugal: Carcaillet et al., 2004; Ménabréaz et al., 2011) and another site from low latitude (Western Pacific margin: Ménabréaz et al., 2012). These records are at higher resolution than the previous ones, in particular around the excursions without, however, reaching resolution better than 500 years. Based on these sites, Ménabréaz et al. (2012) proposed the very first stack produced at relatively high resolution for this time interval from deep-sea sediments. The authors transferred their deep-sea normalized 10Be production record on absolute virtual dipole moment (VDM) scale using a first order correlation between low, medium, high RPI values and low, medium and high absolute intensity values obtained from volcanic rocks, mainly originating from Hawaii (Ménabréaz et al., 2012). As shown in Figure 1, there is an overall agreement with the other records, along with some differences in the 30–34 ka interval. The sedimentary 10Be production record evidences only a very small increase at the age of the Mono Lake excursion (Ménabréaz et al., 2012). The VDM value (4 × 10²² Am2) corresponding to this maximum 10Be production as deduced from sediments is higher than in the 36Cl record from the Greenland ice but similar to the values calculated from the 10Be and documented in GLOPIS-75.
The age models of these cores are based on radiocarbon dating and/or orbital tuning with linear interpolation between isotopic-related tie-points (Ménabréaz et al., 2012). The occurrence of the 10Be peak of the Laschamp excursion is at the right age with respect to the GICC05 time scale and the rate of collapse of the field strength given by these authors in the first half of the Laschamp excursion (1.4 × 10²² Am2) represents a first order evaluation of the dipolar component. However, the cores are sampled with a time resolution of 500 years at best and the stack is calculated with a 1000 years sliding window offset by 500 years steps. This resolution is not high enough, in our opinion, to provide an accurate quantification of the rate of collapse.
In conclusion, among the cosmonuclide records, the 10Be and 36Cl curves from Greenland ice are so far those yielding the most robust and highest-resolution continuous description of the earth magnetic field dipolar intensity over the period covered by GLOPIS-75. Coupling the three records is therefore particularly powerful to decipher the dynamical aspects of the field during the Laschamp excursion, its duration and rate of change of the field strength.
Results and Discussion
Main Trends
We observe an overall impressive agreement (Figure 2) between the long-term features of the three records, the two derived from the cosmogenic isotopes in Greenland ice and GLOPIS-75. These common features therefore obviously and robustly reflect variations in the dipolar field intensity. After a decrease from the maximum (20% above present-day field value) centered around 50 kyr and described by both GLOPIS-75 and by the Greenland ice 10Be record, to the present-day value around 47 kyr, the three records clearly show the two excursions. The intensity low corresponding to the Laschamp excursion, centered at 41.2 ± 1.6 kyr in GICC05 time scale (Svensson et al., 2008) consistently with the radiometric dating (41.3 ± 0.6 ka; Laj et al., 2014), has the same value in all three records (~1 × 10²² Am2). This is a clear indication that the GLOPIS-75 record has precisely recorded the field, even during a period of very low dipole field intensity.
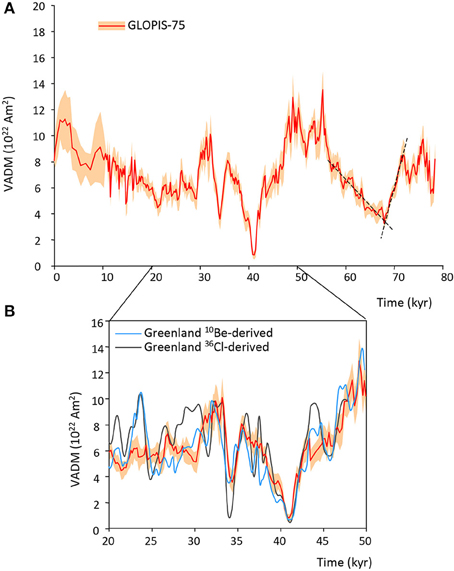
Figure 2. (A) GLOPIS-75 record for the 0–80 kyr time interval reported vs. the Greenland ice GICC05 age model. A slight time adjustment has been made around the Mono Lake excursion, following Laj et al. (2014). The dashed lines are for the decay and growth rates before and after the geomagnetic dipole low around 68 ka. (B) Comparison for the 20–50 kyr time interval of GLOPIS-75 record (in red) with the two curves derived from 10Be (turquoise; Muscheler et al., 2004) and 36Cl (gray; Wagner et al., 2000a) from Greenland.
For the Mono Lake excursion, GLOPIS-75 yields about the same intensity value as 10Be from Greenland ice, while the 36Cl records displays a much more pronounced low, reaching about the same value as for the Laschamp excursion as confirmed by volcanic data from different geographical areas (e.g., Laj et al., 2014).
Most remarkably, all the records document a very significant reestablishment of the field intensity in the 7 kyr time interval between the two excursions (41.2–34.2 kyr) when the field recovers to about 80% of the non-transitional value (Laj et al., 2014). As mentioned above, the lower resolution of the deep-sea cosmonuclide stack results in a smoother record. However, within the uncertainties (rather large in that time interval), the recovery between the two excursions is also significant in this record. These data, therefore, do not support the hypothesis of a very long (6000 years) duration of the Laschamp excursion suggested by Plenier et al. (2007) and of continuously very low values of the field between 42 and 32 kyr B.P. proposed by Valet and Valladas (2010). The Laschamp and the Mono Lake excursions are clearly two well distinct geomagnetic events separated by ~7 ka.
Besides the two excursions which are very similarly recorded, differences in the three records appear when short-term fluctuations are considered. Some of these have different amplitudes and also different timing in the three records. Possibly, these fluctuations, which are not common to the three proxies, arise from very local differences in accumulation rates or noise associated with the recording by geological archives. In any case, they make the determination of the geomagnetic field intensity changes imprecise for these periods.
Duration of the Excursions
The Greenland ice stratigraphy has evolved with time and its last version, GICC05, based on multi-elemental annual layer counting, is by far the most precise to evaluate durations. Indeed each horizon has a maximum layer counting error associated with its age and for example within the 40–42 kyr interval which corresponds to the dipole intensity low of the Laschamp excursion, only a maximum of 95 layers could have been missed (Svensson et al., 2006, 2008). This is an estimation of the maximum error associated with the evaluation of duration based on this age model. This evaluation can be made using two different criteria, either as the duration of the intensity low, or the duration of the directional changes that can only be determined from the magnetic measurements of sediments.
Figure 3 gives the records of the inclination changes relative to the Laschamp excursion for some of the individual cores of the GLOPIS-75 stack. A duration of 640 years is observed for directional changes corresponding to the entire cycle N-R-N. Because there is no stop at the opposite polarity (R), this represents 320 years for each 180° transition. This figure is similar to the value of 500 years reported by Channell et al. (2012), where it must however be noted that the Laschamp excursion may have been affected by a hiatus (see Figure 7 in Channell et al., 2012).
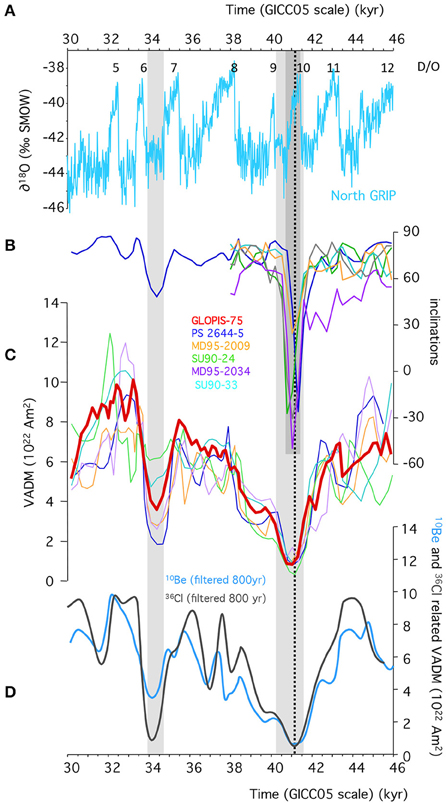
Figure 3. (A) Oxygen isotope record from NorthGRIP ice core (North Greenland Ice Core Project Members, 2004) used as a reference for the time scale. Inclination (B) and paleointensity (C) records of cores from north Atlantic used for NAPIS-75 and also included in GLOPIS-75 stack. Only one of the core (PS2644-5) shows a slight shift in inclination around the Mono Lake excursion. The Laschamp excursion is clearly coeval with the interstadial of Dansgaard-Oeschger (D/O) cycle 10 (Dansgaard et al., 1993) and the Mono Lake excursion is coeval with stadial 7. The light gray bars indicate the time interval characterized by geomagnetic dipole lows and the dark gray bar is for the time interval with negative inclinations during the Laschamp excursion (centered at the vertical dashed line). 10Be (in turquoise) and 36Cl (in gray)—derived paleointensity curves from Greenland ice, both filtered at 800 years, are also shown for comparison (D).
In Figure 4 we have highlighted similarities and differences among the three records of the field strength in the immediate vicinity of the Laschamp (Figure 4A) and Mono Lake (Figure 4B) excursions (in this figure the zero of the time scale is centered on the position of the excursion itself, negative values correspond to times prior to the excursion, positive values are post-excursion times). Figure 4A clearly shows that the field intensity behavior during the intensity low preceding the Laschamp excursion is rather similar in the three records, but that there are discrepancies in the recovery phase immediately after the excursion. However, in the three records the growth rate is significantly slower than the decrease. This results into a very significantly asymmetric form of the intensity low (Figure 4A) which makes it difficult to precisely define its duration, as this depends on a somewhat arbitrary choice: estimates of the duration of the intensity low corresponding to the Laschamp excursion defined as the time interval during which the dipole intensity is lower than half the average non-excursional value may vary between 1500 and 3000 years depending on whether the GLOPIS-75 record or whether either one of the two cosmogenic isotopes records are considered. In all cases the decrease occurs about twice as fast as the recovery.
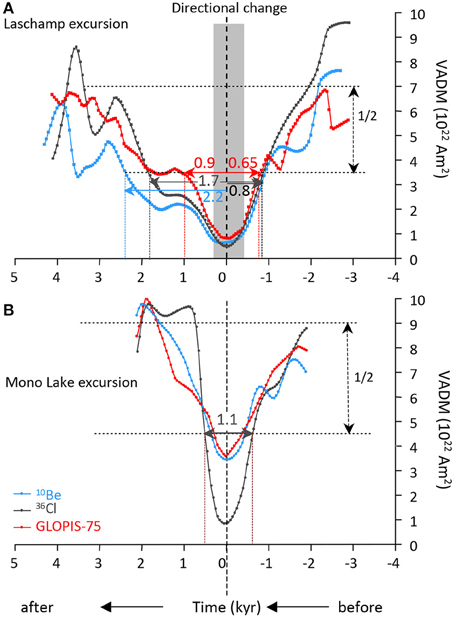
Figure 4. Laschamp (A) and Mono Lake excursions (B) recorded in GLOPIS-75 (Laj et al., 2004) and in ice via the 10Be (Muscheler et al., 2004) and 36Cl (Wagner et al., 2000a) concentrations in Greenland ice reported vs. a time scale where 0 is the occurrence of the geomagnetic dipole minimum. Negative (positive) numbers are for the time before (after) the excursions. The gray bar indicates, accordingly to Figure 3, the duration of the inclination change during the Laschamp excursion. The duration of the geomagnetic dipole lows are evaluated as the width at mid-height (indicated by the two dashed lines and “1/2”). This duration during the Laschamp excursion (in A) is reported for each record (with the same color as the records themselves) before and after the intensity minimum value. For the Mono Lake excursion (B), it is reported for the 36Cl record because it is the most detailed one.
The Mono Lake excursion (Figure 4B) appears to be shorter than the Laschamp excursion and that may explain the difficulty to identify it in geological archives. Its intensity profile is more symmetric than that of the Laschamp excursion. The 36Cl record, consistent with the volcanic data, appears to illustrate the full dynamical range of the changes in dipole field intensity and it yields a duration of about 1100 years as shown in Figure 4B.
Asymmetry in the Decay and Growth of the Field Intensity Around the Laschamp Excursion
The question of asymmetry in growth and decay of the geomagnetic dipole has been addressed by several authors but on different time scales (Valet and Meynadier, 1993; Kok and Tauxe, 1996; Tauxe and Yamazaki, 2007). Using the time derivative of the PADM2M (Ziegler et al., 2011), Ziegler and Constable (2011) have documented the rate of change of the field over the last 2My. In a general way they find stronger average dipole growth rates than decay rates, suggesting that intervals of decay are longer than comparable interval of growth. They note, however, that the model derivatives are evaluated “instantaneously.” Also, they note that the Brunhes chron alone, which has no reversal but a series of excursions or dipole lows, shows the same asymmetry in derivative distribution, suggesting that the asymmetry is not limited to times when the field is reversing, but that could reflect fundamental processes of the oscillating geodynamo. Ziegler and Constable (2011) noted that this asymmetry is also observed in SINT-2000 (Valet et al., 2005) but not in PISO-1500 (Channell et al., 2009).
Although it should be noted that changes over hundreds of years cannot be resolved by the PADM2M model, it is interesting to note that the asymmetry we observe for the Laschamp excursion is exactly opposite to what these authors find for the entire Bruhnes chron, i.e., the decay rate is much faster than the recovery.
Rate of Change of the Field Intensity
The combination of the 10Be and 36Cl records from the Greenland ice cores with GLOPIS-75, all placed on the accurate GICC05 age model, allows to precisely document the rates of change of the field intensity during a period of directional changes (Laschamp and Mono Lake excursions) and periods during which a significant low of the dipolar field intensity has taken place without being associated with a directional change.
To calculate the rates of dipolar intensity change, we used a simple direct way as shown in Figure 5. Before the Laschamp excursion, the GLOPIS-75 and the 10Be records document a phase of decrease from high intensities, starting at about 50 kyr at a rate translated into the dipolar component of the field of about 4–5 nT/kyr until 44 ka. After it reaches again the present value, the excursional process starts and the decrease progresses at a faster rate for the three records (7.7, 8.8, and 14.2 nT/yr for GLOPIS-75, the 10Be and the 36Cl records respectively) until about 42 kyr, where the dipole field intensity has reached a value of about 15,000 nT. The final phase of the decrease occurs at a rate of 16.4, 14.1, and 16.5 nT/yr in the three records, respectively. The minimum value (~2500 nT) is reached at 41.2 ka. The incertitude on the rates is estimated around 1.5 nT on the basis of the uncertainty of the GLOPIS-75 stack itself (Figure 5A).
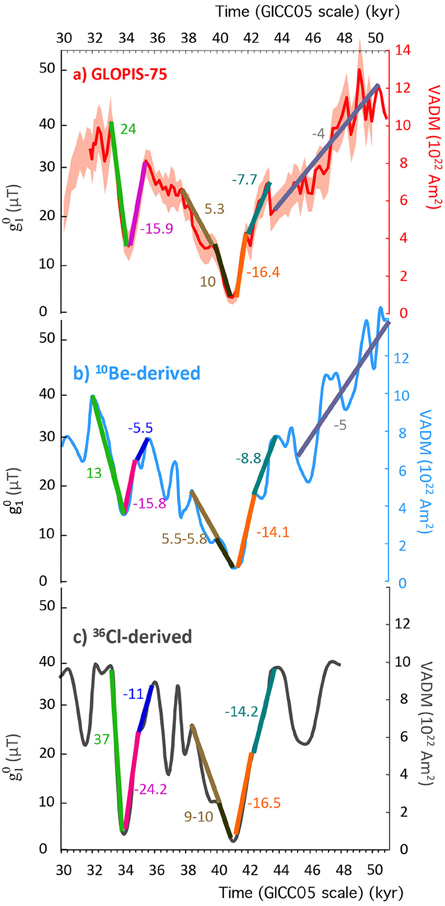
Figure 5. GLOPIS-75 (A), Greenland 10Be (B), and 36Cl (C) derived curves on which the decay and growth rates of the geomagnetic dipole intensity are illustrated as colored lines. The numbers reported with the same colors as the lines are for the corresponding rates of change (in nT/yr) of the dipole field intensity (negative for decay and positive for growth). The intensity profiles are reported with two vertical scales: one in VADM (1022 Am2) and the other one in (μT).
As mentioned above, the recovery phase after the Laschamp excursion is significantly slower, in all three records, than the collapse before the excursion, yielding the overall asymmetrical shape of the intensity low associated with this excursion. Intensity growth rates are around 5.5–10 nT/yr depending on the record (Figure 5).
During the Mono Lake excursion we observe a decay rate of the field intensity of 15.9, 15.8, and 24.2 nT/yr for the three records respectively during the final collapse of the field, and a recovery rate of 24, 13, and 37 nT/yr, respectively. Clearly the 36Cl derived record yields significantly faster rates than the two others, and also reaches much lower values of the field (1 × 10²² Am2) identical to that observed for the Laschamp excursion (the GLOPIS-75 and 10Be derived records yield both a value of 4 × 10²² Am2).
Finally we have evaluated the rate of change of the field intensity during the period 71.6 and 68 ka, when the field intensity undergoes a ~60–65% drop (from 8–9 × 10²² Am2 to about 3.2 × 10²² Am2, i.e., between 33,000 and 12,400 nT for ) that is not accompanied by a directional change. The rate of decrease of the dipolar field which, at that time, can only be deduced from GLOPIS-75, is 5.6 nT/yr and the following growth between 68 and 58 kyr occurs at a rate of only about 1.6 nT/yr (Figure 2A).
Therefore, although limited to two excursions and one intensity low, analysis of the GLOPIS-75 record indicates that the rate of decrease of the geomagnetic field strength is larger during an intensity low associated with an excursion than during an intensity low not linked to a geomagnetic instability.
Conclusions
The very high resolution GLOPIS-75 record of past geomagnetic field intensity over the last 75 kyr does not provide any undisputable information on future evolution of the field. But it clearly shows that the rate of decay of the field intensity during the Laschamp excursion is very high compared to that observed for the period 71.6–68 ka during which no directional change occured. The decay rates in these two periods can be directly compared because they have similar durations.
The high decay rate of the Laschamp excursion is virtually identical to that discussed by Gubbins et al. (2006) since 1840 and Suttie et al. (2011) since 1590 (documented by the IGRF since 1900). They both start from about the same dipole intensity value but it is delicate to directly compare them because their respective timescales are different: historically only a period of about 400 years has been documented, whilst the Laschamp excursion decays over a period roughly three times as long. To compare the two decay rates, one has to admit that the present-day decreasing trend of the dipole field will continue until it reduces to very small values, as already hypothesized by Olson (2002).
However, some characteristics may suggest that the hypothesis that some similarities exist between the Laschamp excursion and the present field is not entirely speculative. The rate of decrease of the field intensity during the first part of the Laschamp excursion shows a significant acceleration. This is reminiscent of the acceleration of the increase in the geographical extent of the SAA observed by De Santis et al. (2013) and which, according to these authors, would ultimately leads to the SAA extending over almost one hemisphere, setting the grounds for a geomagnetic reversal or excursion.
Also, Leonhardt et al. (2009) have reconstructed the evolution of the global morphology of the geomagnetic field during the Laschamp excursion by using a Bayesian inversion of several high-resolution paleomagnetic records used in the GLOPIS-75 stack. They have obtained a scenario in which reverse magnetic field patches at the core-mantle boundary formed near the equator and moving poleward. This scenario is thus similar to that described by Gubbins (1987) and by Hulot et al. (2002) for the present field. It is, therefore, tempting to interpret the very high rate of decrease since 1590 AD as an indication that at least an attempt to a geomagnetic transition may have started.
Under the assumption that the dynamo processes for an eventual future reversal or excursion would be similar to those of the Laschamp excursion, we may then tentatively draw the scenario of a future geomagnetic transition.
For the Laschamp excursion, the directional changes, virtually centered on the minimum of intensity only last 640 years and start when the VADM is about 4 × 10²² Am2, i.e., about one half of its non-transitional value, at the moment when the rate of decrease attains its maximum value. When extrapolated to the present field, at the present rate of decrease it would take some 1000 years to reach half of its value, less if an acceleration takes place, as suggested by the acceleration of the rate of the increase of the geographical extent of the SAA (De Santis et al., 2013). But, in this case, even assuming an increase of a factor of 2, which seems to be an extreme upper limit to us, some 500 years would be needed for the directional changes to start to be significant. The directional changes would then last about 600 years.
While several lines of evidence point toward an imminent change of polarity, using a different approach we reach the same conclusions as several authors that nothing has to be expected before a period of a few hundreds years, maybe as short as 500 years.
To have an immediate grasp of how fast this is, had such a phenomenon occurred in 1492, i.e., about 600 years ago, Cristoforo Colombo, who is credited for discovering on his first trip to America that the magnetic declination could change, would have been in the middle of a much stronger and fast changes of his compass: would he have discovered America?
Conflict of Interest Statement
The authors declare that the research was conducted in the absence of any commercial or financial relationships that could be construed as a potential conflict of interest.
Acknowledgments
We wish to warmly thank G. Paterson and J. Tarduno whose comments greatly improved this manuscript. We also thank Angelo de Santis for his careful and efficient handling of this article. This is LSCE contribution 5586.
References
Andersen, K. K., Svensson, A., Johnsen, S. J., Rasmussen, S. O., Bigler, M., Röthlisberger, R., et al. (2006). The Greenland ice core chronology 2005, 15-42 ka. Part 1: constructing the time scale. Quat. Sci. Rev. 25, 3246–3257. doi: 10.1016/j.quascirev.2006.08.002
Baroni, M., Bard, E., Petit, J. R., Magnan, O., and Bourlès, D. L. (2011). Volcanic and solar activity, and atmospheric circulation influences on cosmogenic 10Be fall out at Vostok and Concordia (Antarctica) over the last 60 years. Geochim. Cosmochim. Acta 75, 7132–7145. doi: 10.1016/j.gca.2011.09.002
Baumgartner, S., Beer, J., Masarik, J., Wagner, G., Meynadier, L., and Synal, H.-A. (1998). Geomagnetic modulation of the 36Cl flux in the GRIP ice core, Greenland. Science 279, 1330–1332. doi: 10.1126/science.279.5355.1330
Beer, J., Blinov, A., Bonani, G., Finkel, R. C., Hofmann, H. J., Lehmann, B., et al. (1990). Use of 10Be in polar ice to trace the 11-year cycle of solar activity. Nature 347, 164–166.
Beer, J., Muscheler, R., Wagner, G., Laj, C., Kissel, C., Kubik, P., et al. (2002). Cosmogenic Nuclides during Isotope Stages 2 and 3. Quat. Sci. Rev. 21, 1129–1139. doi: 10.1016/S0277-3791(01)00135-4
Cande, S. C., and Kent, D. V. K. (1995). A new geomagnetic polarity timescale for the Late Cretaceous and Cenozoic. J. Geophys. Res. 97, 13917–13951. doi: 10.1029/92JB01202
Carcaillet, J., Bourlès, D. L., Thouveny, N., and Arnold, M. (2004). A high resolution authigenic 10Be/9Be record of geomagnetic moment variations over the last 300 ka from sedimentary cores of the Portuguese margin. Earth Planet. Sci. Lett. 219, 397–412. doi: 10.1016/S0012-821X(03)00702-7
Channell, J. E. T., Hodell, D. A., and Curtis, J. H. (2012). ODPSite 1063 (Bermuda Rise) revisited: oxygen isotopes, excursions and paleointensity in the Brunhes Chron. Geochem. Geophys. Geosyst. 13, 1525–2027. doi: 10.1029/2011GC003897
Channell, J. E. T., Xuan, C., and Hodell, D. A. (2009). Stacking paleointensity and oxygen isotope data for the last 1.5 Myr (PISO-1500). Earth Planet. Sci. Lett. 283, 14–23. doi: 10.1016/j.epsl.2009.03.012
Christl, M., Lippold, J., Steinhilber, F., Bernsdorff, F., and Mangini, A. (2010). Reconstruction of global 10Be production over the past 250 ka from highly accumulating Atlantic drift sediments. Quat. Sci. Rev. 29, 2663–2672. doi: 10.1016/j.quascirev.2010.06.017
Cini-Castagnoli, G., Albrecht, A., Beer, J., Bonino, G., Shen, C. H., Callegari, E., et al. (1995). Evidence for enhanced 10Be deposition in Mediterranean sediments 35 Kyr BP. Geophys. Res. Lett. 22, 707–710. doi: 10.1029/95GL00298
Constable, C. G., and Korte, M. (2006). Is Earth's magnetic field reversing? Earth and Planet. Sci. Lett. 246, 1–16. doi: 10.1016/j.epsl.2006.03.038
Dansgaard, W., Johnson, S. J., Clausen, H. B., Dahl-Jensen, D., Gundestrup, N., Hammer, C. U., et al. (1993). Evidence for general instability of past climate from a 250 kyrs ice core record. Nature 364, 218–220. doi: 10.1038/364218a0
Delmas, R. J., Beer, J., Synal, H.-A., Muscheler, R., Petit, J.-R., and Pourchet, M. (2004). Bomb-test 36Cl measurements in Vostok snow (Antarctica) and the use of 36Cl as a dating tool for deep ice cores. Tellus 56B, 492–498. doi: 10.1111/j.1600-0889.2004.00109.x
De Santis, A., and Qamili, E. (2015). Geosystemics: a systemic view of the Earth's magnetic field and the possibilities for an imminent geomagnetic transition. Pure Appl. Geophys. 172, 75–89. doi: 10.1007/s00024-014-0912-x
De Santis, A., Qamili, E., and Wu, L. X. (2013). Toward a possible next geomagnetic transition? Nat. Haz. Earth Syst. Sc. 13, 3395–3403. doi: 10.5194/nhess-13-3395-2013
Finlay, C. C. (2008). Historical variation of the geomagnetic axial dipole. Phys. Earth Planet. Int. 170, 1–14. doi: 10.1016/j.pepi.2008.06.029
Fleitmann, D., Cheng, H., Badertscher, S., Edwards, R. L., Mudelsee, M., Göktürk, O. M., et al. (2009). Timing and climatic impact of Greenland interstadials recorded in stalagmites from northern Turkey. Geophys. Res. Lett. 36, L19707. doi: 10.1029/2009gl040050
Frank, M., Schwarz, B., Baumann, S., Kubik, P. W., Suter, M., and Mangini, A. (1997). A 200 kyr record of cosmogenic radionuclide production rate and geomagnetic field intensity from 10Be in globally stacked deep-sea sediments. Earth Planet. Sci. Lett. 149, 121–129. doi: 10.1016/S0012-821X(97)00070-8
Gubbins, D., Jones, A. L., and Finlay, C. C. (2006). Fall in Earth's magnetic field is erratic. Science 312, 900–902. doi: 10.1126/science.1124855
Guyodo, Y., and Valet, J. P. (1996). Relative variations in geomagnetic intensity from sedimentary records: the past 200.000 years. Earth Planet. Sci. Lett. 143, 23–36. doi: 10.1016/0012-821x(96)00121-5
Guyodo, Y., and Valet, J. P. (1999). Global changes in intensity of the Earth's magnetic field during the past 800 kyr. Nature 399, 249–252.
Hulot, G., Eymin, C., Langlais, B., Mandea, M., and Olsen, N. (2002). Small-scale structure of the geodynamo inferred from Oersted and Magsat satellite data. Nature 416, 620–623. doi: 10.1038/416620a
Jackson, A., Jonkers, A. R. T., and Walker, M. R. (2000). Four centuries of geomagnetic secular variation from historical records. Phil. Trans. R Soc. Lond. A 358, 957–990. doi: 10.1098/rsta.2000.0569
Johnsen, S. J., Dahl-Jensen, D., Gundestrup, N., Steffensen, J. P., Clausen, H. B., Miller, H., et al. (2001). Oxygen isotope and palaeotemperature records from six Greenland ice-core stations: camp Century, Dye-3, GRIP, GISP2, Renland and NorthGRIP. J. Quat. Sci. 16, 299–307. doi: 10.1002/jqs.622
Kok, Y., and Tauxe, L. (1996). Saw-toothed pattern of relative paleointensity records and cumulative viscous remanence. Earth Planet. Sci. Lett. 137, 95–99. doi: 10.1016/0012-821X(95)00210-4
Korte, M., and Constable, C. G. (2005). Continuous geomagnetic models for the past 7 millennia II: CALS7K. Geochem. Geophys. Geosyst. 6, Q02H16. doi: 10.1029/2004GC000801
Laj, C., and Channell, J. E. T. (2015). “Geomagnetic excursions,” Treatise in Geophysics, 2nd Edition, Vol. 5: Geomagnetism, eds G. Schubert and M. Kono (Amsterdam: Elsevier), 343–386.
Laj, C., Guillou, H., and Kissel, C. (2014). Dynamics of the earth magnetic field in the 10-75 kyr period comprising the Laschamp and Mono Lake excursions: new results from the French Chaîne des Puys in a global perspective. Earth Planet. Sci. Lett. 387, 184–197. doi: 10.1016/j.epsl.2013.11.031
Laj, C., Kissel, C., and Beer, J. (2004). “High Resolution Global Paleointensity Stack since 75 kyrs (GLOPIS-75) calibrated to absolute values,” in Timescales of the Geomagnetic Field, eds J. E. T. Channell, D. V. K. Kent, W. Lowrie, and J. G. Meert (AGU Monogr. Ser. vol. 145) (Washington, DC: American Geophysical Union), 255–265. doi: 10.1029/145gm19
Laj, C., Kissel, C., Mazaud, A., Channell, J. E. T., and Beer, J. (2000). North Atlantic palaeointensity stack since 75 ka (NAPIS-75) and the duration of the Laschamp event. Philos. Trans. Royal. Soc. A 358, 1009–1025. doi: 10.1098/rsta.2000.0571
Leonhardt, R., Fabian, K., Winklhofer, M., Ferk, A., Laj, C., and Kissel, C. (2009). Geomagnetic field evolution during the Laschamp Excursion. Earth Planet. Sci. Lett. 278, 87–95. doi: 10.1016/j.epsl.2008.11.028
Masarik, J., and Beer, J. (1999). Simulation of particle fluxes and cosmogenic nuclide production in the Earth's atmosphere. J. Geophys. Res. 104, 12099–12111. doi: 10.1029/1998JD200091
McHargue, L., Damon, P., and Donahue, D. (1995). Enhanced cosmic ray production of 10Be coincident with the Mono Lake and Laschamps geomagnetic excursions. Geophys. Res. Lett. 22, 659–662. doi: 10.1029/95GL00169
Ménabréaz, L., Bourlès, D. L., and Thouveny, N. (2012). Amplitude and timing of the Laschamp geomagnetic dipole low from the global atmospheric 10Be overproduction: contribution of authigenic 10Be/9Be ratios in west equatorial Pacific sediments. J. Geophys. Res. 117, B11101. doi: 10.1029/2012JB009256
Ménabréaz, L., Thouveny, N., Bourlès, D. L., Deschamps, P., Hamelin, B., and Demory, F. (2011). The Laschamp geomagnetic dipole low expressed as a cosmogenic 10Be atmospheric overproduction at ~41 ka. Earth Planet. Sci. Lett. 312, 305–317. doi: 10.1016/j.epsl.2011.10.037
Muscheler, R., Beer, J., Wagner, G., Laj, C., Kissel, C., Raisbeck, G. M., et al. (2004). Changes in the carbon cycle during the last deglaciation as indicated by the comparison of 10Be and 14C records. Earth Planet. Sci. Lett. 219, 325–340. doi: 10.1016/S0012-821X(03)00722-2
North Greenland Ice Core Project Members. (2004). High-resolution record of Northern Hemisphere climate extending into the last interglacial period. Nature 431, 147–151. doi: 10.1038/nature02805
Nowaczyk, N. R., Arz, H. W., Frank, U., Kind, J., and Plessen, B. (2012). Dynamics of the Laschamp geomagnetic excursion from Black Sea sediments. Earth Planet. Sci. Lett. 351–352, 54–69. doi: 10.1016/j.epsl.2012.06.050
Olson, P., and Amit, H. (2006). Changes in earth's dipole. Naturwissenschaften 93, 519–542. doi: 10.1007/s00114-006-0138-6
Plenier, G., Valet, J.-P., Guérin, G., Lefèvre, J.-C., LeGoff, M., and Carter-Stiglitz, B. (2007). Origin and age of the directions recorded during the Laschamp event in the Chaîne des Puys (France). Earth Planet. Sci. Lett. 259, 414–431. doi: 10.1016/j.epsl.2007.04.039
Robinson, C., Raisbeck, G. M., Yiou, F., Lehman, B., and Laj, C. (1995). The relationship between 10Be and geomagnetic field strength records in central North Atlantic sediments during the last 80 ka. Earth Planet. Sci. Lett. 136, 551–557. doi: 10.1016/0012-821X(95)00202-N
Suttie, N., Holme, R., Hill, M. J., and Shaw, J. (2011). Consistent treatment of errors in archaeointensity implies rapid decay of the dipole prior to 1840. Earth Planet. Sci. Lett. 304, 13–21. doi: 10.1016/j.epsl.2011.02.010
Svensson, A., Anderson, K. K., Bigler, M., Clausen, H. B., Dahl-Jensen, D., Davies, S. M., et al. (2006). The Greenland Ice core chronology 2005, 15-42 ka. Part 2: comparison to other records. Quat. Sci. Rev. 25, 3258–3267. doi: 10.1016/j.quascirev.2006.08.003
Svensson, A., Anderson, K. K., Bigler, M., Clausen, H. B., Dahl-Jensen, D., Davies, S. M., et al. (2008). A 60,000 year Greenland stratigraphic ice core chronolology. Clim. Past 4, 47–57. doi: 10.5194/cp-4-47-2008
Tarduno, J. A., Watkeys, M. K., Huffman, T. N., Cottrell, R. D., Blackman, E. G., Wendt, A., et al. (2015). Antiquity of the South Atlantic Anomaly and evidence for top-down control on the geodynamo. Nat. Commun. 6, 7865. doi: 10.1038/ncomms8865
Tauxe, L., and Yamazaki, T. (2007). “Paleointensities,” in Geomagnetism.: Volume 5 of Treatise on Geophysics, eds M. Kono and G. Schubert (Amsterdam: Elsevier), 509–563. doi: 10.1016/B978-044452748-6.00098-5
Valet, J. P., and Meynadier, L. (1993). Geomagnetic-field intensity and reversals during the past 4 million years. Nature 366, 234–238. doi: 10.1038/366234a0
Valet, J. P., Meynadier, L., and Guyodo, Y. (2005). Geomagnetic dipole strength and reversal rate over the past two million years. Nature 435, 802–805. doi: 10.1038/nature03674
Valet, J. P., and Valladas, H. (2010). The Laschamp-Mono lake geomagnetic events and the extinction of Neanderthal: a causal link or a coincidence? Quat. Sci. Rev. 29, 3887–3893. doi: 10.1016/j.quascirev.2010.09.010
Voelker, A., Sarnthein, M., Grootes, P. M., Erlenkeuser, H., Laj, C., Mazaud, A., et al. (1998). Correlation of marine 14C ages from the Nordic sea with GISP2 isotope record: implication for 14C calibration beyond 25ka BP. Radiocarbon 40, 517–534.
Wagner, G., Beer, J., Laj, C., Kissel, C., Mazarik, J., Muscheler, R., et al. (2000a). Chlorine-36 evidence for the Mono Lake event in the Summit GRIP ice core. Earth Planet. Sci. Lett. 181, 1–6. doi: 10.1016/j.epsl.2011.10.019
Wagner, G., Masarik, J., Beer, J., Baumgartner, S., Imboden, D., Kubik, P. W., et al. (2000b). Reconstruction of the geomagnetic field between 20 and 60 kyr BP from cosmogenic radionuclides in the GRIP ice core. Nucl. Instrum. Methods Phys. Res. Sect. B 172, 597–604. doi: 10.1016/S0168-583X(00)00285-8
Wagnon, P., Delmas, R. J., and Legrand, M. (1999). Loss of volatile acid species from upper firn layers at Vostok. Antarctica. J. Geophys. Res. 104, 3423–3431. doi: 10.1029/98JD02855
Wolff, E. W., Chappellaz, J., Blunier, T., Rasmussen, S. O., and Svensson, A. (2010). Millennial-scale variability during the last glacial: the ice core record. Quat. Sci. Rev. 29, 2828–2838. doi: 10.1016/j.quascirev.2009.10.013
Ziegler, L. B., and Constable, C. G. (2011). Asymmetry in growth and decay of the geomagnetic dipole. Earth Planet. Sci. Lett. 312, 300–304. doi: 10.1016/S0012-821X(00)00196-5
Keywords: geomagnetic field intensity, Laschamp and Mono Lake excursion, cosmogenic nuclides, rate of field changes, imminent geomagnetic transition
Citation: Laj C and Kissel C (2015) An impending geomagnetic transition? Hints from the past. Front. Earth Sci. 3:61. doi: 10.3389/feart.2015.00061
Received: 20 July 2015; Accepted: 22 September 2015;
Published: 07 October 2015.
Edited by:
Angelo De Santis, Istituto Nazionale di Geofisica e Vulcanologia, ItalyReviewed by:
Greig A. Paterson, Institute of Geology and Geophysics, Chinese Academy of Sciences, ChinaJohn Tarduno, University of Rochester, USA
Copyright © 2015 Laj and Kissel. This is an open-access article distributed under the terms of the Creative Commons Attribution License (CC BY). The use, distribution or reproduction in other forums is permitted, provided the original author(s) or licensor are credited and that the original publication in this journal is cited, in accordance with accepted academic practice. No use, distribution or reproduction is permitted which does not comply with these terms.
*Correspondence: Carlo Laj, Département de Géosciences, Ecole Normale Supérieure, PSL Research University, 24 Rue Lhomond, 75231 Paris Cédex 5, France, carlo.laj@ens.fr