The Effect of Impurities on the Surface Melt of a Glacier in the Suntar-Khayata Mountain Range, Russian Siberia
 Nozomu Takeuchi1*
  Yuta Fujisawa1 Tsutomu Kadota2 Sota Tanaka1 Masaya Miyairi1 Tatsuo Shirakawa3 Ryo Kusaka3 Alexander N. Fedorov4 Pavel Konstantinov4 Tetsuo Ohata5
- 1Department of Earth Sciences, Graduate School of Science, Chiba University, Chiba, Japan
- 2Japan Agency for Marine-Earth Science and Technology, Yokosuka, Japan
- 3Department of Civil and Environmental Engineering, Kitami Institute of Technology, Kitami, Japan
- 4Laboratory of Permafrost Landscapes, Melnikov Permafrost Institute, Siberian Branch-Russian Academy of Sciences, Yakutsk, Russia
- 5Arctic Environment Research Center, National Institute of Polar Research, Tachikawa, Japan
We investigated characteristics of impurities and their impact on the ablation of Glacier No.31 in the Suntar-Khayata Mountain Range in Russian Siberia during summer 2014. Positive degree-day factors (PDDFs) obtained from 20 stake measurements distributed across the glacier's ablation area varied from 3.00 to 8.55 mm w.e. K−1 day−1. The surface reflectivity measured with a spectrometer as a proxy for albedo, ranged from 0.09 to 0.62, and was negatively correlated with the PDDF, suggesting that glacier ablation is controlled by surface albedo on the studied glacier. Mass of total insoluble impurities on the ice surface varied from 0.1 to 45.2 g m−2 and was not correlated with surface reflectivity, suggesting that albedo is not directly conditioned by the mass of the impurities. Microscopy of impurities revealed that they comprised mineral particles, cryoconite granules, and ice algal cells filled with dark-reddish pigments (Ancylonema nordenskioldii). There was a significant negative correlation between surface reflectivity and algal biomass or organic matter, suggesting that the ice algae and their products are the most effective constituents in defining glacier surface albedo. Our results suggest that the melting of ice surface was enhanced by the growth of ice algae, which increased the melting rate 1.6–2.6 times greater than that of the impurity free bare-ice.
Introduction
Negative mass balance and recession have characterized the majority of glaciers worldwide over the last century, and are generally believed to result from global warming. Regional air temperature rise in summer can increase the extent and duration of melting of snow and ice, enhancing glacier mass losses. However, ablation can also be enhanced by a reduction of surface albedo, which increases the proportion of shortwave radiation made available for melting and amplifies ice mass loss. Therefore, spatial and temporal variations in surface albedo of glaciers are particularly important parameters for improving our understanding of recent and future glacier change.
The quantity and distribution of insoluble impurities are one of the most significant factors determining surface albedo and have been reported to cause melting of glacier ice and snow (e.g., Bøggild et al., 2010). Supraglacial impurities usually consist of both inorganic and organic materials accreted on the ice surface by wet precipitation or aeolian deposition. Windblown mineral dust and black carbon are well-known impurities on the glacier surface and their physical properties and atmospheric transportation processes have been well-studied (e.g., Qian et al., 2015). Microbes and organic matter are also dominant biotic constituents of supraglacial impurities. Microbes observed on a glacier include cold-tolerant snow and ice algae, cyanobacteria, and heterotrophic bacteria, and they can grow and proliferate on the melting snow or ice surfaces (e.g., Edwards et al., 2014). These microbes and their derivative organic matter often aggregate with mineral particles and form spherical granules called cryoconite (e.g., Takeuchi et al., 2001a; Langford et al., 2014). Cryoconite usually displays a higher light absorbance (i.e., dark colored) compared with pure snow and ice, thus it can efficiently reduce the surface albedo of glacier surface (e.g., Takeuchi et al., 2001a).
The effect of impurities on glacier melting varies among glaciers depending on the abundance and composition of the impurities as well as their distribution. For example, the effect has been reported to be significant on Asian glaciers: abundant and dark colored cryoconite covering the ablation area of Yala Glacier accelerated its melt rate by a factor of 3 above that of a clean surface without impurities (Kohshima et al., 1993). The large abundance of crycoconite on Asian glaciers is probably due to frequent supplies of windblown mineral dust from surrounding deserts and to the greater abundance and productivity of photosynthetic microbes on these glaciers (e.g., Takeuchi and Li, 2008). Although the effect of impurities on melting appeared to be smaller on polar glaciers, studies have suggested that a dark colored ice surface appeared recently in the bare ice area and it is likely to contribute to the mass loss of glaciers in the Arctic region (Hodson et al., 2007; Mernild et al., 2014) and on the Greenland Ice Sheet (e.g., Bøggild et al., 2010; Wientjes and Oerlemans, 2010). Impurities collected from the dark ice surface of the Greenland Ice Sheet have been revealed to be dark colored cryoconite, containing abundant filamentous cyanobacteria and mineral dust (Wientjes et al., 2011; Takeuchi et al., 2014). Furthermore, pigmented ice algae growing on the ice surface also contribute to albedo reduction on the bare ice area of the Greenland Ice Sheet and on an Alaskan glacier (Yallop et al., 2012; Takeuchi, 2013; Lutz et al., 2014). These algal populations are usually dominated by Ancylonema nordenskioldii and Mesotaenium bergrenii, which are both commonly found on glaciers, in particular in the Arctic region (Remias et al., 2009, 2011). The algal cells are typically filled with dark colored pigments, which can effectively reduce the albedo of the ice surface (Remias et al., 2009, 2011; Takeuchi, 2013). Since their abundance changes seasonally and spatially on glaciers (Hodson et al., 2007; Takeuchi, 2009, 2013; Langford et al., 2014), as well as variations in their distribution coupled to ice surface hydrology (Hodson et al., 2007; Irvine-Fynn et al., 2011), the surface albedo and its effect on melting may vary temporally and spatially with microbial population growth on glaciers. Furthermore, changes in the Arctic environment due to global climate change potentially affect the physical and chemical conditions on the glacier surface, influencing the abundance and distribution of cryoconite and ice algae. Consequently, such changes on glaciers may yield progressive or contrasting variability in ice surface characteristics from year to year. However, these changes are currently unconstrained because we still have only limited information of supraglacial impurities, in particular relating to biological impurities and their effect on albedo and glacier melting.
Of the glacierised regions in the Arctic latitudes, those within Russia are some of the least studied. There are a number of glaciers in the mountain ranges in Arctic and sub-Arctic regions in eastern Siberia, Russia (the Suntar-Khayata, Cherskiy, and Kodar Mountain Ranges). Mass balance surveys of glaciers in the Suntar-Khayata Range have been conducted intermittently since the International Geophysical Year (IGY, 1957–1958) by Russian glaciologists (e.g., Koreisha, 1963; Grave, 1964; Ananicheva and Koreisha, 2005). Koreisha (1963) reported the first detailed 3-year study of Glacier No. 31 mass balance including monthly average values of albedo measured over the surface of this glacier during ablation period. Ananicheva and Koreisha (2005) estimated retreat and thinning of the glaciers from the 1940s' aerophotography and the expeditions of 1957–1958, 1970s, and 2001. The glaciers were resurveyed in 2004 and 2005 by Russian-Japanese collaboration projects (Takahashi et al., 2011). These recent studies revealed that most of the glaciers in this range have receded and thinned significantly in the last 60 years, as has been observed in other Arctic regions likely reflecting the region's recent atmospheric warming trends (Takahashi et al., 2011). However, since impurities may also contribute to glacier ablation, information detailing the relationship between impurities and ice melting in Siberia is important to help evaluate geographical variations in the response of Arctic glaciers under the scenario of a changing climate. In fact, Koreisha (1963) noted that material properties on the ice surface of Glacier No. 31 were highly variable, and that simple temperature index models did not give any reliable estimates of the surface melting on this glacier.
In this study, we investigated characteristics of impurities and their impact on glacier ablation in the Suntar-Khayata Mountain Range in Russian Siberia in the summer of 2014. Using ablation stakes distributed across the surface of Glacier No. 31, positive-degree day factors were compared to observations of surface reflectivity to evaluate the influence of surface impurities on glacier ice melt rates. Analysis of sampled impurities included quantification of the abundance of organic and inorganic fractions which were related to corresponding observations of glacier surface reflectivity.
Study Site and Methods
Glacier No.31
The field investigation was conducted on Glacier No. 31 (62°36′ N, 141°52′ E) in the Suntar-Khayata Mountains in Russia in August 2014. This mountain range is located in eastern Siberia, and extends westwards for approximately 500 km from the coast of the Sea of Okhotsk (Figure 1). The highest peak in the mountain range is Mt. Mus-Khaya (2959 m a.s.l., Figure 1). The climate in the region is characterized by a strong temperature inversion during winter due to the Siberian High, and limited precipitation in the beginning and end of winter (Takahashi et al., 2011). Oymyakon valley, the coldest permanently inhabited place in the Northern Hemisphere, is located in this region. A number of glaciers exists in the mountain range at the elevations above 2000 m (with a total glacier coverage: 162.2 km2; see Takahashi et al., 2011). Glacier No. 31 is relatively accessible and has been a focus for mass balance monitoring since 1957 (Koreisha, 1963; Grave, 1964). The glacier flows northward from an elevation of 2728 m down to 2050 m, and covers an area of 3.2 km2 (Figures 1B, 2A, Koreisha, 1963). The equilibrium line altitude of the glacier has been estimated at 2350 m in 2008 (Takahashi et al., 2011), which is similar to the 3 year mean derived from the surveys during IGY (2320 ± 65 m, Koreisha, 1963), while the glacier has been retreated by more than 120 m since 1957 (Ananicheva and Koreisha, 2005). The glacier is characterized by relatively low flow velocities (4–6 m year−1) in the middle part, and by low mass exchange rates (low accumulation and low ablation; Koreisha, 1963). The thickness of the glacier derived seismically exceeded 100 m over its longitudinal profile (Koreisha, 1963).
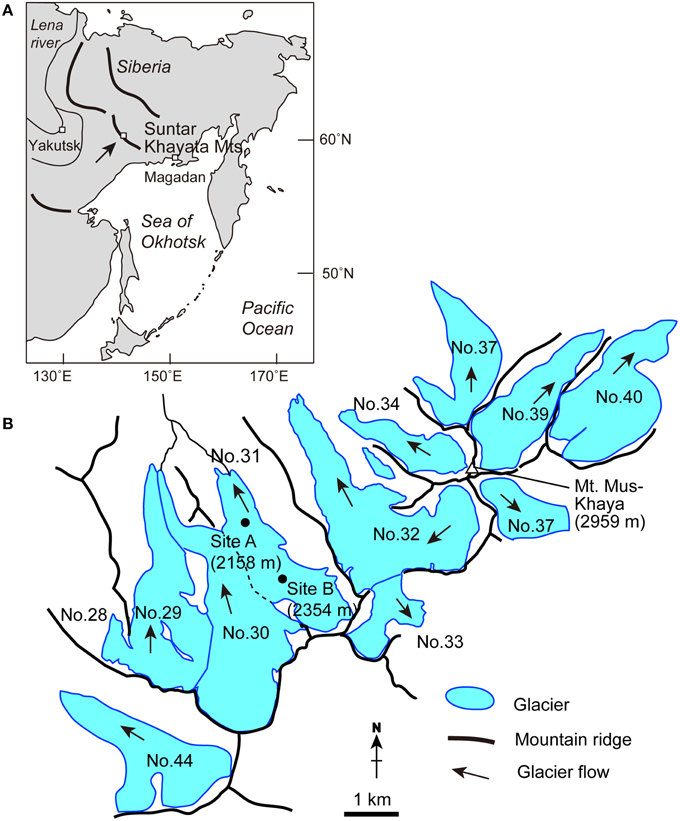
Figure 1. Maps detailing (A) the location of Suntar-Khayata Range in Eastern Siberia, and (B) the locality and study sites on Glacier No. 31 and surrounding glaciers in the range.
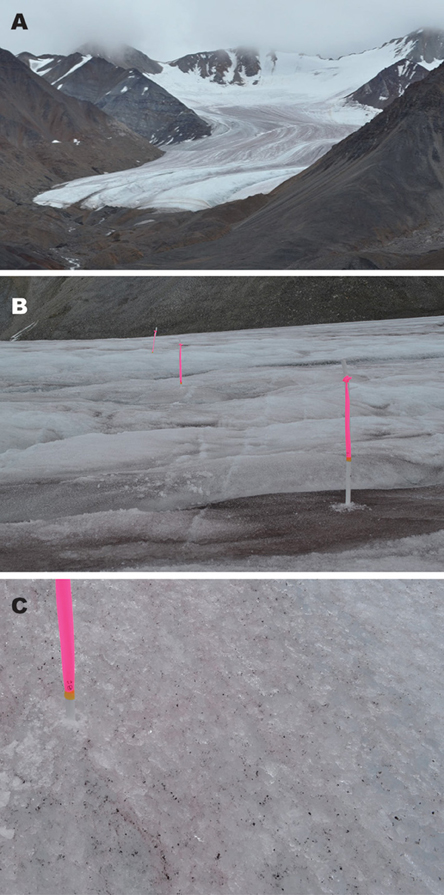
Figure 2. Photographs illustrating (A) Glacier No. 31 in the Suntar-Khayata Range, (B) stakes (No. 15, 16, and 17) installed on ablation surface for measurements of melt, reflectivity, and sampling of impurities, and (C) ice surface of stake No. 7, showing slightly reddish in color due to algal pigment. Diameter of a stake in (C) is approximately 3 cm. The photographs were taken on 4 August, 2014.
Evaluation of Surface Albedo and Melting
In order to quantify the effect of albedo reduction due to surface impurities on the melting of glacier ice, we used a positive degree day factor (PDDF, mm w.e. K−1 day−1) as an index of melting sensitivity of the ice surface to air temperature. The PDDF involves a simplification of complex processes of the energy balance at the glacier surface by directly associating ablation to the sum of positive air temperatures over a defined time period. This relationship is based on the statistically significant correlation between the two variables (Braithwaite, 1995) and has been widely used in modeling runoff from glaciers and changes in glacier mass (e.g., Braithwaite, 1995; Hock, 2003). Most of the variation in PDDF can be attributed to the difference in relative importance of individual energy components providing energy for melt (Hock, 2003). Here, because meteorological conditions are expected to be virtually uniform over a relatively small glacier, we attribute variations in PDDF to difference of surface albedo. This approach, using PDDF as a proxy for albedo, has been previously applied in a study of a glacier in northwest Greenland by Sugiyama et al. (2014). Although this technique could fail to account for the turbulent heat fluxes, these processes are likely to be negligible for the purposes of this study because of the stable meteorological conditions over the study period without any rain or snowfall event.
PDDFs were obtained based on the measurements of 20 stakes distributed across the glacier's ablation area at two sites (Sites A and B) of Glacier No. 31 (Figures 2B,C). At Site A, at an elevation of 2158 m, seven stake locations were selected, while 13 stakes were installed at Site B (at 2354 m). The surfaces studied were debris-free bare ice (i.e., without rock clasts), but covered a range of different reflectivity due to various amounts of fine abiotic and biotic impurities on the ice. The surfaces selected had slope angles < 10°. We assume that nothing affected the PDDF between the two sites other than the albedo. At the stakes, ablation was monitored daily from 4 to 10, August, 2014 (except Aug. 5 and 9). Weather conditions during the study period were sunny or cloudy without any rain or snowfall. Surface melt at each stake during the period was obtained as water equivalent (mm w.e.) based on the change of exposed stake length and assumed density of ice (910 kg m−3). Air temperature was logged every hour instantaneously with automatic air temperature loggers (TU-43, T&D Co., Japan) at approximately 1 m above the ice surface at both sites. The air temperature sensors were shielded from direct sunlight. Positive degree-day sum (PDD; °C day) was obtained as a cumulative hourly sum of the air temperature excluding the temperature below 0°C, divided by 24 h at each site during the observational period. PDDF at each stake was calculated from the total surface melt divided by the PDD obtained at each site.
Measurements of Ice Surface Reflectivity
As a proxy of ice surface albedo, a hemispherical-directional reflectance factor (HDRF), which is referred to as a reflectivity in this study, was measured. The HDRF is given by the ratio of the reflected radiance from a target surface area in a single direction to the irradiance from the entire hemisphere to the area (e.g., Schaepman et al., 2006). The reflected radiance in the visible to near-infrared wavelength range (0.350–1.050 μm) in the nadir direction was measured at a height of approximately 20 cm above the target surface with a spectrometer (MS-720, Eiko Seiki Co., Japan). Then, the radiance reflected by a Lambertian white reference plate (Spectralon 12.7 × 12.7 cm, Labsphere, USA) was measured in the nadir direction with the spectrometer. The measurements were carried out within 3 h of local solar noon (solar zenith: ~58–47°). Measurements made at this height provided a field-of-view spot of 8.9 cm in diameter on the ice surface. The reflectivities were calculated by dividing the integrated surface radiance by the integrated radiance acquired from the white reference panel. The variance due to sub-unity and anisotropic reflectance of the white panel was not corrected in this calculation although the error expected in the variance possibly varies by up to 10% depending on the viewing and illumination geometry (Painter et al., 2003). However, we assume that the error is small enough to evaluate the effect of impurities among the target surfaces. Spectral reflectivity was measured at three to five surfaces randomly selected around each stake. The mean of the measurements constituted the reflectivity at that stake.
Sample Collection of Surface Ice
At each stake site, the local abundance of total impurities was quantified by sampling surface ice from approximately 10 × 10 cm areas and 1–3 cm depth using a stainless-steel scoop. Because most of inorganic impurities concentrate on the ice surface as melting proceeds and microbes photosynthetically grow only on the ice surface, this depth is sufficient to quantify the amounts of all impurities affecting albedo of the ice surface. The cryoconite holes, where the substantial amounts of impurities were deposited, were excluded in the collection. The precise dimensions of each sample area were recorded to calculate the abundance of impurities per unit area. The collected samples were melted and preserved with a 3% formalin solution in 30 mL clean polyethylene bottles to fix biological activity. All samples were transported to Chiba University, Japan for analysis.
Laboratory Analysis
In the laboratory, the composition of impurities was examined with optical microscopes (Leica MZ-12, Germany, and Olympus BX51, Japan). Samples were then dried (60°C, 24 h) in pre-weighed crucibles. The amount of impurities per unit area of the glacier was obtained from the dry weight and the sampling area. Then, organic matter in the impurities was measured by the method based on Dean (1974). The dried samples were combusted for 1 h at 500°C in an electric furnace, and weighed again. The amount of organic matter was obtained from the difference in the weight between the dried and combusted samples. After combustion, only mineral particles remained.
From the samples that were preserved with 3% of formalin, cell counts, and estimations of cell volume were conducted with an optical microscope (Olympus BX51). Between 50 and 1000 μL of sample water was filtered through a hydrophilized membrane filter (pore size 0.45 μm, Millipore JHWP01300), and the number of algal cells on the filter was counted. The counting was conducted 3–6 times on each sample. From these counts, a mean cell concentration (cells mL−1) of the sample was obtained. Mean cell volume was estimated by measuring the geometrical size of 50 cells for each taxa. The total algal biomass was estimated by summing values obtained by multiplying algal concentrations by the mean cell volume. This calculation was done for each taxon at each stake. The total biomass was represented as cell volume per unit area of glacier surface (μL m−2) at each stake. Community structure was represented by the mean proportion of each taxa in three samples to the total algal volume at each sampling point.
Satellite Image Analysis
To evaluate the spatial distribution and mean values of reflectivity on the glacier, a Landsat satellite image [The Operational Land Imager (OLI) sensor of Landsat 8 with spatial resolution of 30 m] acquired on 11 August, 2014 was analyzed. Band 2 image (wavelength range: 0.452–0.512 μm), which is sensitive to impurity abundance on snow and ice (e.g., Hall et al., 1988), was used in this study. Surface reflectivity at top of atmosphere was obtained from the Level 1 data product (L1T, Roy et al., 2014). No atmospheric correction was applied in this process since no cirrus cloud was recognized in the image. The reflectivity was shown only in the ice surface area. The ice area of glaciers was extracted with band 5 image (0.845–0.885 μm), which can be used to distinguish between snow and ice surfaces (e.g., Hall et al., 1988). The threshold of the digital number (DN) value between snow and ice used in this analysis was 38,550, which was determined by the location of the snow line during the field work and the DN value at the point.
Statistical Correlation Analysis
In order to test the correlations statistically among the PDDF, surface reflectivity, and abundance of total and each fraction of the impurities, Pearson's linear correlation coefficients (r) were obtained from the data of all study stakes. However, since some of the relationships are possibly non-linear (e.g., exponential or quadratic), Spearman's rank-order correlation coefficients (rs) were also obtained when the relationship did not appear to be linear.
Results
The air temperature measured at the study sites on Glacier No. 31 during the observational period (6 days from 4 to 10 August, 2014) showed diurnal fluctuations from 1.0 to 10.0°C (mean: 4.6°C) and from −0.6 to 8.2°C (mean: 3.0°C) at sites A and B, respectively (Figure 3A). The temperature record shows that it was relatively cool on 6 and 7 August, but warmer on 8 and 9 August. The cumulative hourly sum of positive air temperature (PDD) from the start time to the end of observation reached 28.4 and 18.2°C day at sites A and B, respectively (Figure 3B). Stake measurements show total surface ablation in a range from 95 to 176 mm w.e. (mean: 132 mm w.e.) at site A, and from 55 to 156 mm w.e. (mean: 120 mm w.e.) at site B (Table 1, Figure 3C) during the study period. The mean melt rates for the study period can be obtained from the total melt, ranging from 16 to 30 mm w.e. day−1 (mean: 22 mm w.e. day−1) at site A, and from 9.1 to 26 mm w.e. day−1 (mean: 20 mm w.e. day−1) at site B. The results indicate that the melt rate varied greatly from surface to surface on the glacier.
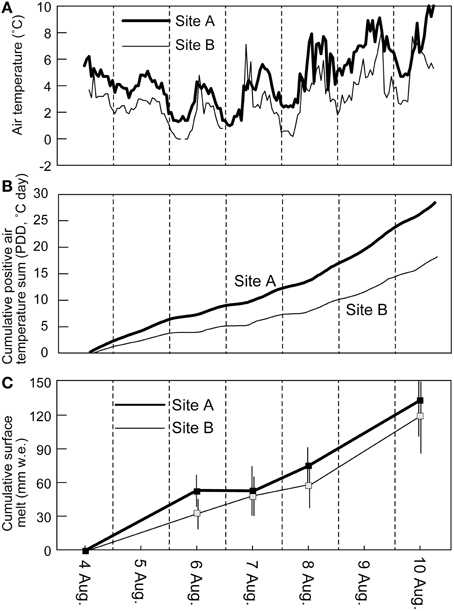
Figure 3. Hourly air temperature (A), cumulative hourly sum of positive air temperature divided by 24 h (PDD) (B), and surface melt in water equivalent (C) of Glacier No. 31 recorded at the two sites during the study period (4–10, August) in 2014. Surface melt indicates average values of 7 and 13 stakes at sites A and B, respectively. Error bar indicates standard deviation of stake measurements at each site.
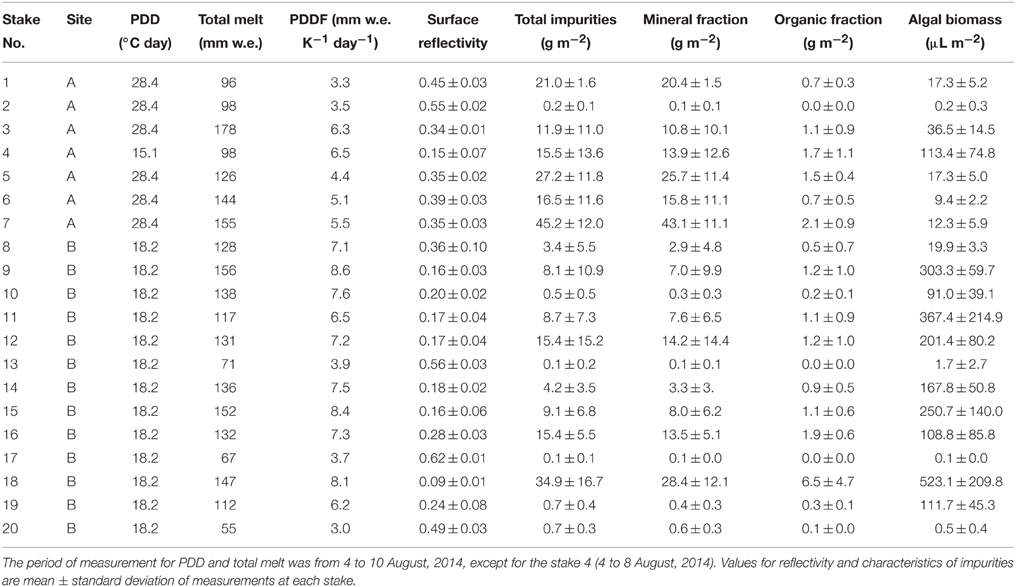
Table 1. Results of measurements of PDDF, reflectivity, mass abundances of total and each fraction of impurities, and algal biomass at 20 stakes of sites A (2158 m) and B (2354 m) on the Glacier No. 31.
There was a large spatial variability in PDDF among the surfaces of the stakes. PDDF at each stake obtained from the observation during the study period ranged from 3.0 to 8.6 mm w.e. K−1 day−1 (mean: 6.0 mm w.e. K−1 day−1, Table 1). The smallest and greatest values of PDDF occurred at the stake No.20 and No. 9 at site B, respectively.
Surface reflectivity measured at each stake ranged from 0.09 to 0.62 (mean: 0.31, Table 1). The abundance of impurities on the ice surfaces at each stake ranged from 0.11 to 45 g m−2 (mean: 12 g m−2) in dry weight (Table 1). The organic matter content in the impurities varied from 3.4 to 18.3% (mean 10.3%). Thus, mineral and organic fractions in the impurities on the ice surface ranged from 0.10 to 43 g m−2 (mean: 11 g m−2) and from 0.01 to 6.5 g m−2 (mean: 1.2 g m−2), respectively.
Microscopy of impurities revealed that they consisted of mineral particles, dark-colored aggregates (cryoconite granules), and algal cells (Figure 4). These three components were contained in the samples from all of the stakes. Mineral particles appeared transparent, white, or black, and their size ranged approximately from 0.01 up to 2 mm in diameter. Cryoconite granules appeared to be spherical in shape and colored black. Their size ranged from 0.2 to 2.2 mm in diameter.
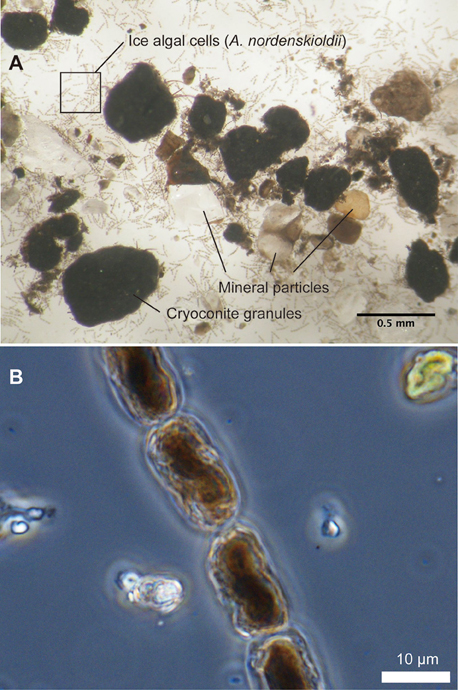
Figure 4. Microscopic photographs of impurities (A) and pigmented ice algae, Ancylonema nordenskioldii (B), collected at site B on Glacier No. 31. Inner structure of the cells is damaged due to preservation in frozen state.
Algae observed in the impurities consisted of several taxa, including Ancylonema (A.) nordenskioldii, Chloromonas sp., 4 taxa of filamentous cyanobacteria including Calothrix parietina, and 2 taxa of Chroococcaceae cyanobacteria. However, A. nordenskioldii was most dominant in all of the samples in terms of cell numbers. Forms of A. nordenskioldii were typically straight or slightly curved filaments, consisting of 1–20 individual cells (Figure 4B). The cell size was 18.0 ± 3.9 μm in length, 9.8 ± 0.87 μm in width. These algal cells were filled with dark-reddish pigments. Chloromonas sp. was observed mostly as a red-pigmented spherical cell, which appeared to be a resting zygote. Cell size was 11.1 ± 2.8 μm in diameter. C. parietina was filamentous cyanobacterium with thick and brownish sheath. Cell size was 9.0 ± 1.1 μm in width. Other 3 taxa of filamentous cyanobacteria showed distinct cell size, which was 1.9 ± 1.1, 3.7 ± 0.56, and 5.0 ± 0.51 μm in width, respectively. Two taxa of Chroococcaceae cyanobacteria showed 2.6 ± 0.51 and 5.5 ± 1.2 μm in diameter, respectively. The total algal biomass (bio-volume) varied among the stakes from 0.06 to 523 μL m−2 (mean 118 μL m−2, Table 1). A. nordenskioldii accounted for more than 95% of the total biomass in all of the samples.
The Landsat 8 satellite image showed that surface reflectivity varied across the ice surface of the glacier (Figure 5). On Glacier No. 31, the areal mean of the band 2 reflectivity in the bare ice area of the glacier was 0.29. Figure 5B shows that the middle part of the glacier between Sites A and B appeared light- to deep-blue corresponding to the reflectivity from 0.16 to 0.26, while the area below Site A appeared green to light-blue corresponding to the reflectivity from 0.30 to 0.40, which is higher than that in the middle part. The area above Site B appeared light-blue, green, or yellow corresponding to the reflectivity from 0.30 to 0.50, which is also higher than that in the middle part. This altitudinal variation in the reflectivity was also apparent in the ice surface of the other glaciers surrounding Glacier No. 31 (Figure 5B).
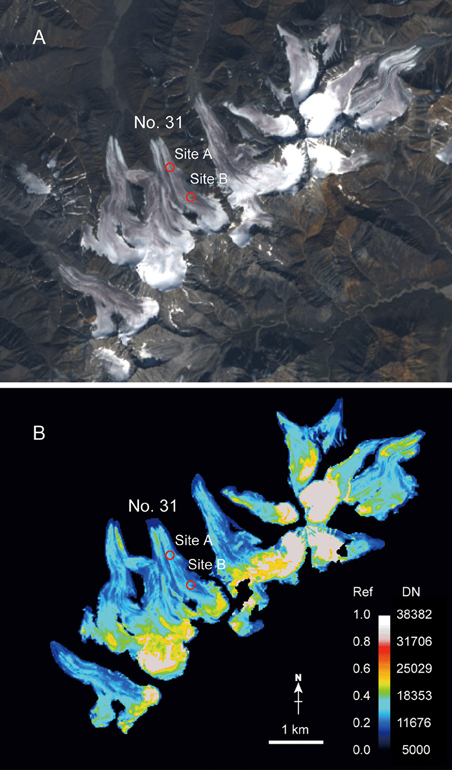
Figure 5. Landsat-8 satellite image (OLI) acquired on 11 August, 2014 over Glacier No. 31 and surrounding glaciers in the Suntar-Khayata Range in Russian Siberia. (A) RGB natural color composite image of band 2, 3, and 4, (B) band 2 reflectivity image of the glacier ice area highlighted with a color look-up-table. Black and white areas denote non-glacier area and snow area derived from band 5 image, reflectively. The color scale is assigned to digital number (DN) and reflectivity (Ref) as shown by the color bar.
Discussion
There was a significant negative correlation between PDDF and surface reflectivity (r = −0.882, P < 0.001; Figure 6). Since the variation in PDDF can be attributed to difference in relative importance of individual energy components providing energy for melt (Hock, 2003), this significant correlation suggest that the absorbed shortwave radiation determined by surface albedo is the main energy source for melting on the glacier. This is consistent with the previous heat-balance studies on the glacier, which reported that radiation was the key factor in melting and contributed about 60–80% of energy used for melting (Koreisha, 1963; Grave, 1964). The negative correlation between PDDF and surface reflectivity is consistent with the relationship detailed by Hock (2003). The clean surfaces with higher reflectivity (>0.45) corresponded to a range of PDDF from 3.0 to 3.9 mm w.e. K−1 day−1 (mean: 3.5 mm w.e. K−1 day−1). In contrast, the dark surfaces with lower reflectivity (<0.20) corresponded to a range of PDDF from 6.5 to 8.6 mm w.e. K−1 day−1. This indicates that the melt rate of each surface is largely affected by the albedo of the surface, and that surface melting is enhanced ~1.6–2.6 times by the albedo reduction.
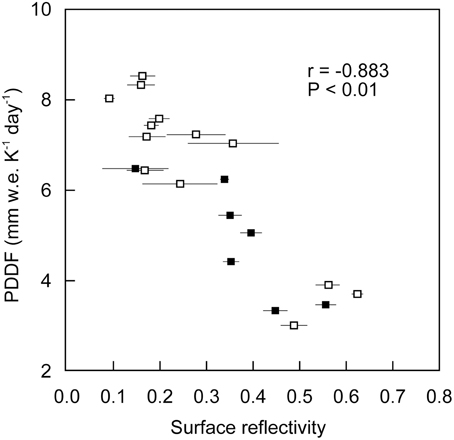
Figure 6. Relationship between positive degree-day factor and surface reflectivity on the ice surfaces of Glacier No. 31. Open and solid markers indicate data from Sites A and B, respectively. Error bars indicate standard deviation of measurements of surface reflectivity at each stake.
Although the ground instantaneous field-of-view (GIFOV) of the Landsat satellite image (1 pixel: 30 × 30 m) is considerably larger than our in-situ observations (a field-of-view spot 8.9 cm in diameter), each pixel of the satellite image indicates the spatial mean of surface reflectivity, thus, we used the relationship between the in-situ surface reflectivity and PDDF to compute PDDF over the entire glacier from the satellite image. The PDDF can be calculated using the reflectance obtained from surface reflectance at the band-2 wavelength range (α2) with a regression as
From the areal mean reflectance (0.290) of the band 2-Landsat image, the areal mean PDDF of Glacier No. 31 can be obtained as 6.3 mm w.e. K−1 day−1, which is approximately 1.8 times greater than that of the clean surfaces with reflectivity higher than 0.45. It should be noted that this is approximate estimation without any atmospheric or geographical calibrations or correction, such as atmospheric transmittance or satellite sensor orientation relative to glacier surface slope and aspect.
Both at the study sites and glacier scales there is large spatial variability in ice surface reflectivity, but neither Pearson's linear correlation (r) nor Spearman's rank-order correlation coefficient (rs) was statistically significant between surface reflectivity and abundance of total impurities on the ice surfaces (Table 2, Figure 7A). Although impurities are major factors in reducing surface albedo on glaciers, this indicates that the albedo is not simply determined by total amount of impurities on the ice surface.
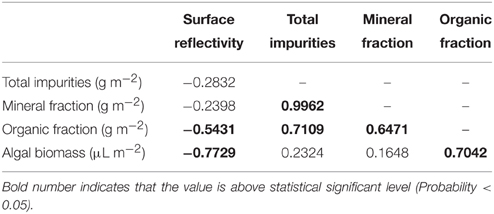
Table 2. Pearson's correlation coefficients (r) among surface reflectivity, mass abundances of total and each fraction of impurities, and algal biomass on the ice surface of Glacier No. 31.

Figure 7. Relationships between surface reflectivity and total impurities (A) and algal biomass (B) on the ice surfaces of Glacier No. 31. The correlation (Spearman's rank-order correlation, rs) was not statistically significant between surface reflectivity and total impurities (A), but significant between surface reflectivity and algal biomass (B). Open and solid marks indicate Sites A and B, respectively. Error bars indicate standard deviation of measurements of surface reflectivity and impurities at each stake.
Comparison between surface reflectivity and abundance of each fraction of impurities revealed that the surface reflectivity is not correlated with the mineral fraction of the impurities, but significantly correlated with the organic fraction and algal biomass on the surface (Table 2). Although the scatter plot of the algal biomass against reflectivity does not show a clear linear relationship (Figure 7B), Spearman's rank-order correlation test also showed their significant correlation (rs = −0.944, P < 0.001). This correlation between algal biomass and surface reflectivity suggests that the ice algae and their derived organic matter are the most effective constituents in the impurities on albedo reduction. The lack of correlation between surface reflectivity and total mass of impurities is probably due to a smaller density of the organic matter including algal cells compared with that of inorganic impurities. In fact, correlations among mass of the fractions showed that there is a significant positive correlation between total impurities and mineral fraction, but no correlation between total impurities and organic fraction or algal biomass (Table 2). Furthermore, some of the data showing higher reflectivity and greater impurities in Figure 7A can also be explained by greater contents of white or transparent mineral particles, such as quartz and feldspar, in the impurities. Such mineral particles have a greater mass but lower light absorbency compared with other colored minerals or organic matter and were observed to be contained in the impurities by microscopy.
The dominance of A. nordenskioldii at all of the stakes suggests that the cells of this taxon substantially affect ice surface albedo. The cells of A. nordenskioldii were filamentous with 1–20 cells containing dark-reddish pigments, which appear to affect the surface reflectivity as dark-reddish ice surface was visibly observed in the field (Figure 2C). Furthermore, as microscopy revealed, other dark-colored organic matter in the impurities is probably composed of humic substances, residues remaining after bacterial decomposition of algal cells (Takeuchi et al., 2001a). These properties of algal cells and organic matter appeared to be optically effective on surface albedo reduction of bare ice compared with those of inorganic constituents.
A. nordenskioldii is an ice environment specialist alga, commonly observed on the bare ice surface of glaciers in Alaska, Greenland, Svalbard, Altai, and Himalayas (e.g., Kol, 1942; Yoshimura et al., 1997; Takeuchi, 2001; Takeuchi et al., 2001b, 2006a; Remias et al., 2009, 2011; Yallop et al., 2012). In particular, it is often dominant in algal communities on the ice surface of glaciers in the Arctic regions (Takeuchi, 2001; Uetake et al., 2010; Remias et al., 2011). The algae have also been reported to affect surface albedo on the bare ice area of Greenland Ice Sheet (Yallop et al., 2012; Lutz et al., 2014). On the other hand, the total impurities (cryoconite) are more effective on albedo reduction rather than algae on glaciers in northwest Greenland and a glacier in Alaska (Takeuchi, 2002; Takeuchi et al., 2014). Thus, the ice algae do not always determine the surface albedo of the glaciers. This is probably due to relative importance of each constituent in the impurities for albedo reduction, which probably results from the different conditions for algal growth and of mineral supply on the surface. For example, the cryoconite can be the main constituent for albedo reduction on the glaciers where there are abundant mineral particles and favorable conditions for filamentous cyanobacteria on the surface.
The ice algae possibly cause large variations in surface melting because they can grow rapidly when the conditions are favorable. The algal biomass on the surface can increase seasonally, and vary spatially depending on surface conditions (Takeuchi, 2013). In contrast, cryoconite (abundance of total impurities) usually do not show seasonal increase on the glacier surface although it shows spatial variations caused by physical redistribution with running melt water or formation of surface ice structure (e.g., Takeuchi, 2009). This is probably due to the longer residence time of cryoconite granules on the surface compared with that of algae, since they are aggregations of different components and require a longer time for formation. Furthermore, there are a number of physical, chemical, and biological conditions affecting cryoconite formation, for example, availability of mineral particles, growth of filamentous bacteria, and production of extracellular polymeric substance (EPS) by other microbes (Langford et al., 2014). Therefore, the surface albedo on the studied glacier in Siberia may drastically change with time and space by algal growth.
The spatial variation in reflectivity on the glaciers in Suntar-Khayata Range revealed by the satellite image (Figure 5B) is probably due to the heterogeneous distribution of the algae on the glacial surface. It showed lower reflectivity in the middle part compared with in the lower and upper areas of the ice surface of Glacier No. 31 and surrounding glaciers. Such a variation in reflectivity was also visibly obvious in the photograph of the glacier (Figure 2A). Ice algae probably tended to be abundant in the middle part of the glaciers and their effect on surface albedo is likely to be more significant in the area. Although factors affecting the growth of A. nordenskioldii are not exactly clear, such algal distribution has been observed on other polar and sub-polar glaciers, such as an Alaskan glacier (Takeuchi, 2013) and a Greenland glacier (Uetake et al., 2010). According to the reports, the less abundance of algae near the terminus has been explained by running meltwater. Since the amount of meltwater is greater at lower altitudes, the algal cells on the surface would be washed out and their biomass decrease as altitude decreases. In the upper parts of glaciers, frequent snow falls can inhibit algal growth since the algae require solar radiation for photosynthesis.
Although our results showed a significant correlation among algal biomass, surface reflectivity, and PDDF, the actual dynamics of each surface impurity and melt rate on the bare ice could be more complicated. Ice structures on a surface layer, such as the development of weathering crust and sub-surface melt water flow, may also affect redistribution of impurities, algal growth, and surface albedo (Müller and Keeler, 1969; Irvine-Fynn and Edwards, 2014). Melt water hydrology affected by the temperature distribution in glacial ice can also affect the microbial community and its activity on the surface (Edwards et al., 2011). Furthermore, there are interactions among physical, chemical, and biological components on the ice surfaces and these surface processes can result in spatial and temporal variabilities in melt rate on the bare ice (Irvine-Fynn et al., 2014). In fact, inter-annual variability of the ice surface conditions of Glacier No. 31 was recognized in the earlier work (Koreisha, 1963). In order to evaluate the effect of impurities on surface melting across spatial, regional, and geographical scales, it is important to conduct further studies focusing on the growth of algae on the ice surface, and transportation and redistribution processes of each constituent of impurities. Furthermore, multispectral remote sensing and imaging spectroscopy of algae distribution have a potential to evaluate these processes since these techniques can determine unambiguously the biological absorption features in snow (Painter et al., 2001; Takeuchi et al., 2006b).
Conclusions
Impurities on the bare ice surfaces of a glacier in the Sutar-Khayata Range of Russian Siberia were revealed to consist of minerals, cryoconite granules, and ice algae. We found a significant correlation between PDDF and surface reflectivity, indicating that, as would be expected, the albedo reduction enhanced ablation. Impurities enhanced the ice melting by 1.6–2.6 times greater than that of clean ice surface on the glacier during the short period of the melt season studied here. However, the surface reflectivity was not correlated with the total or mineral abundance of the impurities, but was significantly correlated with the organic fraction or algal biomass in the impurities. This suggests that the albedo of the ice surfaces on this glacier is mainly determined by the abundance of algae and their derived organic matter on the ice surface. The algae were mostly dominated by A. nordenskioldii, which is common ice alga observed on glaciers in Arctic regions. The growth of the ice algae is likely to be responsible for spatial variations in surface albedo on the glacier although the factor affecting the algal growth is uncertain.
Author Contributions
NT, YF wrote the manuscript, NT, YF, TK, TO designed research, YF, MM, ST conducted laboratory analyses, YF, TK, ST, MM, TS, RK, AF, PK conducted field investigations.
Conflict of Interest Statement
The authors declare that the research was conducted in the absence of any commercial or financial relationships that could be construed as a potential conflict of interest.
Acknowledgments
We would thank to Drs. Hironori Yabuki, Shuhei Takahashi, Hiroyuki Enomoto, and other members of the Green Network of Excellence, Arctic Climate Change Research Project (GRENE-Arctic) for supporting the field investigations and constructive discussion on the results. Tris Irvine-Fynn and Hannah Clarke are thanked for proof reading the manuscript. We also thank three reviewers and the editor, Shin Sugiyama for valuable suggestions, which substantially improved this manuscript. This study was financially supported by the GRENE-Arctic, and partly supported by a Grant-in-Aid (No. 23221004, 26247078, and 26241020).
References
Ananicheva, M. D., and Koreisha, M. M. (2005). Glacial recession in northern and southern parts of Suntar-Khayata Mts. and Chersky Range. Data Glaciol. Stud. 99, 18–25.
Bøggild, C. E., Brandt, R. E., Brown, K. J., and Warren, S. G. (2010). The ablation zone in northeast Greenland: ice types, albedos and impurities. J. Glaciol. 56, 101–113. doi: 10.3189/002214310791190776
Braithwaite, R. J. (1995). Positive degree-day factors for ablation on the Greenland ice sheet studied by energy-balance modelling. J. Glaciol. 41, 153–160.
Dean, W. E. (1974). Determination of carbonate and organic matter in calcareous sediments and sedimentary rocks by loss on ignition; comparison with other methods. J. Sediment. Res. 44, 242–248.
Edwards, A., Anesio, A. M., Rassner, S. M., Sattler, B., Hubbard, B., Perkins, W. T., et al. (2011). Possible interactions between bacterial diversity, microbial activity and supraglacial hydrology of cryoconite holes in Svalbard. ISME J. 5, 150–160. doi: 10.1038/ismej.2010.100
Edwards, A., Mur, L. A., Girdwood, S. E., Anesio, A. M., Stibal, M., Rassner, S. M. E., et al. (2014). Coupled cryoconite ecosystem structure–function relationships are revealed by comparing bacterial communities in alpine and Arctic glaciers. FEMS Microbiol. Ecol. 89, 222–237. doi: 10.1111/1574-6941.12283
Grave, N. A. (1964). Freezing of Earth Surface and Glaciation of Suntar-Khayata range: Eastern Yakutia, Glaciology (IX Section of IGY Program), No. 14. Moscow: Publ. House of the Academy of Sciences of the USSR. 140.
Hall, D. K., Chang, A. T., and Siddalingaiah, H. (1988). Reflectances of glaciers as calculated using Landsat-5 Thematic Mapper data. Remote Sens. Environ. 25, 311–321. doi: 10.1016/0034-4257(88)90107-1
Hock, R. (2003). Temperature index melt modeling in mountain areas. J. Hydrol. 282, 104–115. doi: 10.1016/S0022-1694(03)00257-9
Hodson, A., Anesio, A. M., Ng, F., Watson, R., Quirk, J., Irvine-Fynn, T. D. L., et al. (2007). A glacier respires: quantifying the distribution and respiration CO2 flux of cryoconite across an entire Arctic supraglacial ecosystem. J. Geophys. Res. 112, G04S36. doi: 10.1029/2007jg000452
Irvine-Fynn, T. D. L., Bridge, J. W., and Hodson, A. J. (2011). In situ quantification of supraglacial cryoconite morphodynamics using time lapse imaging: an example from Svalbard. J. Glaciol. 57, 651–657. doi: 10.3189/002214311797409695
Irvine-Fynn, T. D. L., and Edwards, A. (2014). A frozen asset: the potential of flow cytometry in constraining the glacial biome. Cytometry Part A 85, 3–7. doi: 10.1002/cyto.a.22411
Irvine-Fynn, T. D. L., Hanna, E., Barrand, N. E., Porter, P. R., Kohler, J., and Hodson, A. J. (2014). Examination of a physically based, high−resolution, distributed Arctic temperature−index melt model, on Midtre Lovénbreen, Svalbard. Hydrol. Processes 28, 134–149. doi: 10.1002/hyp.9526
Kohshima, S., Seko, K., and Yoshimura, Y. (1993). “Biotic acceleration of glacier melting in Yala Glacier, Langtang Region, Nepal Himalaya,” in Symposium at Kathumandu 1992 - Snow and Glacier Hydrology (Kathmandu: International Associatin of Hydrological Sciences Publication 218), 309–316.
Koreisha, M. M. (1963). Modern Glaciation of the Suntar-Khayata ridge, Glaciology (IX Section of IGY Program), No. 11. Moscow: Publ. House of the Academy of Sciences of the USSR. 170.
Langford, H. J., Irvine-Fynn, T. D. L., Edwards, A., Banwart, S. A., and Hodson, A. J. (2014). A spatial investigation of the environmental controls over cryoconite aggregation on Longyearbreen glacier, Svalbard. Biogeosciences 11, 3423–3463. doi: 10.5194/bgd-11-3423-2014
Lutz, S., Anesio, A. M., Jorge Villar, S. E., and Benning, L. G. (2014). Variations of algal communities cause darkening of a Greenland glacier. FEMS Microbial. Ecol. 89, 402–414. doi: 10.1111/1574-6941.12351
Mernild, S. H., Hanna, E., Yde, J. C., Seidenkrantz, M. S., Wilson, R., and Knudsen, N. T. (2014). Atmospheric and oceanic influence on mass balance of northern North Atlantic region land−terminating glaciers. Geogr. Ann. 96, 561–577. doi: 10.1111/geoa.12053
Müller, F., and Keeler, C. M. (1969). Errors in short-term ablation measurements on melting ice surfaces. J. Glaciol. 8, 91–105.
Painter, T. H., Duval, B., Thomas, W. H., Mendez, M., Heintzelman, S., and Dozier, J. (2001). Detection and quantification of snow algae with an airborne imaging spectrometer. Appl. Env. Microbiol. 67, 5267–5272. doi: 10.1128/AEM.67.11.5267-5272.2001
Painter, T. H., Paden, B., and Dozier, J. (2003). Automated spectro-goniometer: a spherical robot for the field measurement of the directional reflectance of snow. Rev. Sci. Instrum. 74, 5179–5188. doi: 10.1063/1.1626011
Qian, Y., Yasunari, T. J., Doherty, S. J., Flanner, M. G., Lau, W. K., Ming, J., et al. (2015). Light-absorbing particles in snow and ice: measurement and modeling of climatic and hydrological impact. Advances Atmos. Sci. 32, 64–91. doi: 10.1007/s00376-014-0010-0
Remias, D., Holzinger, A., Aigner, S., and Lütz, C. (2011). Ecophysiology and ultrastructure of Ancylonema nordenskiöldii (Zygnematales, Streptophyta), causing brown ice on glaciers in Svalbard (high arctic). Polar Biol. 35, 899–908. doi: 10.1007/s00300-011-1135-6
Remias, D., Holzinger, A., and Lütz, C. (2009). Physiology, ultrastructure and habitat of the ice alga Mesotaenium berggrenii (Zygnemaphyceae, Chlorophyta) from glaciers in the European Alps. Phycologia 48, 302–312. doi: 10.2216/08-13.1
Roy, D. P., Wulder, M. A., Loveland, T. R., Woodcock, C. E., Allen, R. G., Anderson, M. C., et al. (2014). Landsat-8: science and product vision for terrestrial global change research. Remote Sens. Environ. 145, 154–172. doi: 10.1016/j.rse.2014.02.001
Schaepman, G., Schaepman, M., Painter, T. H., Martonchik, J., and Dangel, S. (2006). Reflectance quantities in optical remote sensing—definitions and case studies. Remote Sens. Environ. 103, 27–42. doi: 10.1016/j.rse.2006.03.002
Sugiyama, S., Sakakibara, D., Matsuno, S., Yamaguchi, S., Matoba, S., and Aoki, T. (2014). Initial field observations on Qaanaaq ice cap, northwestern Greenland. Ann. Glaciol. 55, 25. doi: 10.3189/2014AoG66A102
Takahashi, S., Sugiura, K., Kameda, T., Enomoto, H., Kononov, Y., Ananicheva, M. D., et al. (2011). Response of glaciers in the Suntar-Khayata range, eastern Siberia, to climate change. Ann. Glaciol. 52, 185–192. doi: 10.3189/172756411797252086
Takeuchi, N. (2001). The altitudinal distribution of snow algae on an Alaska glacier (Gulkana Glacier in the Alaska Range). Hydrol. Processes 15, 3447–3459. doi: 10.1002/hyp.1040
Takeuchi, N. (2002). Surface albedo and characteristics of cryoconite (biogenic surface dust) on an Alaska glacier, Gulkana Glacier in the Alaska Range. Bull. Glaciol. Res. 19, 63–70.
Takeuchi, N. (2009). Temporal and spatial variations in spectral reflectance and characteristics of surface dust on Gulkana Glacier, Alaska Range. J. Glaciol. 55, 701–709. doi: 10.3189/002214309789470914
Takeuchi, N. (2013). Seasonal and altitudinal variations in snow algal communities on an Alaskan glacier (Gulkana glacier in the Alaska range). Environ. Res. Let. 8, 035002. doi: 10.1088/1748-9326/8/3/035002
Takeuchi, N., Dial, R., Kohshima, S., Segawa, T., and Uetake, J. (2006b). Spatial distribution and abundance of red snow algae on the Harding Icefield, Alaska derived from a satellite image. Geophys. Res. Lett. 33, L21502. doi: 10.1029/2006GL027819
Takeuchi, N., Kohshima, S., Goto-Azuma, K., and Korner, R. M. (2001b). Biological characteristics of dark colored material (cryoconite) on Canadian Arctic glaciers (Devon and Penny ice cap). Proc. Mem. Nat. Inst. Pol. Res. 54, 495–505.
Takeuchi, N., Kohshima, S., and Seko, K. (2001a). Structure, formation, darkening process of albedo reducing material (cryoconite) on a Himalayan glacier: a granular algal mat growing on the glacier. Arc. Antarc. Alp. Res. 33, 115–122. doi: 10.2307/1552211
Takeuchi, N., and Li, Z. (2008). Characteristics of surface dust on Ürümqi glacier No. 1 in the Tien Shan mountains, China. Arct. Antarct. Alp. Res. 40, 744–750. doi: 10.1657/1523-0430(07-094)[TAKEUCHI]2.0.CO;2
Takeuchi, N., Nagatsuka, N., Uetake, J., and Shimada, R. (2014). Spatial variations in impurities (cryoconite) on glaciers in northwest Greenland. Bull. Glaciol. Res. 32, 94. doi: 10.5331/bgr.32.85
Takeuchi, N., Uetake, J., Fujita, K., Aizen, V., and Nikitin, S. (2006a). A snow algal community on Akkem Glacier in the Russian Altai Mountains. Ann. Glaciol. 43, 378–384. doi: 10.3189/172756406781812113
Uetake, J., Naganuma, T., Hebsgaard, M. B., and Kanda, H. (2010). Communities of algae and cyanobacteria on glaciers in west Greenland. Polar Sci. 4, 71–80. doi: 10.1016/j.polar.2010.03.002
Wientjes, I. G. M., and Oerlemans, J. (2010). An explanation for the dark region in the western melt zone of the Greenland ice sheet. Cryosphere 4, 261–268. doi: 10.5194/tc-4-261-2010
Wientjes, I. G. M., Van de Wal, R. S. W., Reichart, G. J., Sluijs, A., and Oerlemans, J. (2011). Dust from the dark region in the western ablation zone of the Greenland ice sheet. Cryosphere 5, 589–601. doi: 10.5194/tc-5-589-2011
Yallop, M. L., Anesio, A. M., Perkins, R. G., Cook, J., Telling, J., Fagan, D., et al. (2012). Photophysiology and albedo-changing potential of the ice algal community on the surface of the Greenland ice sheet. ISME J. 6, 2302–2313. doi: 10.1038/ismej.2012.107
Keywords: glaciers, light absorbing impurity, snow algae, positive degree-day factor, Siberia, Suntar Khayata
Citation: Takeuchi N, Fujisawa Y, Kadota T, Tanaka S, Miyairi M, Shirakawa T, Kusaka R, Fedorov AN, Konstantinov P and Ohata T (2015) The Effect of Impurities on the Surface Melt of a Glacier in the Suntar-Khayata Mountain Range, Russian Siberia. Front. Earth Sci. 3:82. doi: 10.3389/feart.2015.00082
Received: 18 September 2015; Accepted: 25 November 2015;
Published: 18 December 2015.
Edited by:
Shin Sugiyama, Hokkaido University, JapanReviewed by:
Arwyn Edwards, Aberystwyth University, UKEvgeny Andreevich Podolskiy, Hokkaido University, Japan
Samuel Huckerby Doyle, Aberystwyth University, UK
Copyright © 2015 Takeuchi, Fujisawa, Kadota, Tanaka, Miyairi, Shirakawa, Kusaka, Fedorov, Konstantinov and Ohata. This is an open-access article distributed under the terms of the Creative Commons Attribution License (CC BY). The use, distribution or reproduction in other forums is permitted, provided the original author(s) or licensor are credited and that the original publication in this journal is cited, in accordance with accepted academic practice. No use, distribution or reproduction is permitted which does not comply with these terms.
*Correspondence: Nozomu Takeuchi, ntakeuch@faculty.chiba-u.jp