Thermomagnetic Behavior of Magnetic Susceptibility—Heating Rate and Sample Size Effects
 Diana Jordanova*
  Neli Jordanova
- National Institute of Geophysics, Geodesy and Geography, Bulgarian Academy of Sciences, Sofia, Bulgaria
Thermomagnetic analysis of magnetic susceptibility k(T) was carried out for a number of natural powder materials from soils, baked clay and anthropogenic dust samples using fast (11°C/min) and slow (6.5°C/min) heating rates available in the furnace of Kappabridge KLY2 (Agico). Based on the additional data for mineralogy, grain size and magnetic properties of the studied samples, behavior of k(T) cycles and the observed differences in the curves for fast and slow heating rate are interpreted in terms of mineralogical transformations and Curie temperatures. The effect of different sample size is also explored, using large volume and small volume of powder material. It is found that soil samples show enhanced information on mineralogical transformations and appearance of new strongly magnetic phases when using fast heating rate and large sample size. This approach moves the transformation at higher temperature, but enhances the amplitude of the signal of newly created phase. Large sample size gives prevalence of the local micro-environment, created by evolving gases, released during transformations. The example from archeological brick reveals the effect of different sample sizes on the observed Curie temperatures on heating and cooling curves, when the magnetic carrier is substituted magnetite (Mn0.2Fe2.70O4). Large sample size leads to bigger differences in Tcs on heating and cooling, while small sample size results in similar Tcs for both heating rates.
Introduction
Analysis of the behavior of magnetic susceptibility during continuous heating up to 700°C and the following cooling is a standard method for identification of magnetic mineralogy in natural samples through the observed Curie temperatures (Sanford, 1928; O'Reilly, 1984; Hrouda, 1994). Cooling curve is indicative for the occurrence of mineralogical changes caused by laboratory heating. Considerable effort has been put on theoretical and experimental studies, defining physical basis of the observed susceptibility changes (Egli, 2009; Fabian et al., 2013; Dunlop, 2014) and methodologies for estimation of the Curie temperature (Gromme et al., 1969; Petrovsky and Kapicka, 2006). The shape and the observed peaks on the heating and cooling curves of k-T cycles are interpreted as a reflection of different environmental processes [e.g., degree of soil formation and synthesis of pedogenic strongly magnetic fraction; presence of substitutions; reactions of Fe minerals with organic matter; destruction of thermally unstable minerals such as carbonates, organic matter, clay minerals (Liu et al., 2005; Hanesch et al., 2006; Jiang et al., 2015)]. Thermomagnetic analysis of magnetic susceptibility is a powerful tool in studies of time- and temperature dependent cation ordering in titanomagnetites, magnesioferrites, and magnetite-spinel solid solutions (Harrison and Putnis, 1999; Lattard et al., 2006; Bowles et al., 2013).
However, frequently observed structural and mineralogical phase transformations during heating and cooling runs of the k-T analysis are also linked to the kinetics and chemical thermodynamic of the processes involved. This implies that factors such as heating rate and sample size, which are critical for the performance and results of classical thermal analyses [thermogravimetry (TG), differential thermal analysis (DTA), effluent gas analysis (EGA), differential scanning calorimetry (DSC); Kissinger, 1956; Gallaghar, 1997; Brown, 1998; Fernandez et al., 2011; Kousksou et al., 2011], play a role in the recorded variations of magnetic susceptibility with increasing/decreasing temperature as well. The aim of the present study is to show through several experimental case studies of different natural samples how the two parameters—heating rate and sample size—influence the shape of the curves and behavior of low-field magnetic susceptibility with increasing temperature.
Samples, Equipment and Methods
The choice of samples is dictated by the requirement to have well characterized initial mineralogy by complementary methods (magnetic and non-magnetic). Two typical examples of environmental materials are chosen—a soil sample from recent Luvic Phaeozem, developed on loess (sample GF 58) with characteristic pedogenic enhancement (Jordanova et al., 2010) and a soil sample with strong contribution of antiferromagnetic iron oxides (goethite and hematite) together with maghemite from a red soil (Rhodic Luvisol)—sample RED52 (Jordanova et al., 2013). Another example is given for an anthropogenic settled dust sample (SZ2b) as an illustration of magnetic mineralogy of urban dust. Archaeological brick sample from India (sample PAV) is included as representing mineralogy of fired clay material. A natural coarse grained magnetite from an intrusive body (Plana pluton, NW Bulgaria) is included as a reference for the characteristic Curie temperature of the most common rock-forming magnetic mineral—magnetite. All samples are powder materials. In order to ensure homogeneity of the material, utilized in different k-T runs and exclude the possibility that different behavior is caused by non-homogeneous mineralogy, large enough quantity of the initial powder (about 10 g) from each sample is mixed, homogenized and passed through 1 mm sieve. Subsequently, all runs using fast or slow heating/cooling rates are carried out on sub-samples from this initial homogenized material.
The laboratory equipment used for thermomagnetic analysis is Kappabridge KLY2 with high temperature furnace CS-23 (Agico, Brno). Heating rates of 6.5°C/min (slow heating) and 11°C/min (fast heating) were used for heating in air. Accuracy of the temperature control of the thermocouple is ±3°C according to manufacturer. Sample size was varied between 0.01 and 0.2 g for different samples. Thermomagnetic curves were corrected for the free furnace and normalized to initial magnetic susceptibility at room temperature.
Additional analyses for characterizing mineralogy and grain size of the magnetic phases in the samples under study consist of the following:
– XRD on bulk powder material using D500 Siemens system with automatic control, Cu-K radiation at 40 kV and 30 mA settings. Qualitative phase identification is carried out by using “Difrac 11” package. Semi-quantification of the mineral phases is done using the method of Peter and Kalman (1964).
– Moessbauer spectroscopy: Mossbauer spectra at different temperatures between 5 and 295 K have been obtained by inserting the sample in a Mossbauer close cycle cryostat (Janis) and by using a SEECo spectrometer with constant acceleration and within a transmission geometry configuration designed also by SEECo. A 57Co(Rh) source has been used. The NORMOS package was used for fitting the spectra.
– TG-DTA /DTA/. The measurements were performed on a Pyris Diamond (Perkin-Elmer instruments) in a TG-DTA thermal analyzer mode, from room temperature up to 1300°C. The samples have been analyzed using an open cylindrical alumina crucible, in synthetic air (80% N2 / 20% O2) with a 30 ml/min. gas flow rate at a standard heating rate of 10°C/min., using as reference an empty alumina crucible. The accuracy of heat flow measurements was ±0.001 μV, and the temperature precision of ±0.1 K.
– SEM on single particles from samples PAV and SZ2b: Scanning electron microscope (SEM) observations were done using a JEOL JSM-6390 instrument. Carbon coating of samples and observations in backscattered electrons mode were used to recognize grains containing high atomic number elements.
– Rock magnetic parameters. Frequency dependent magnetic susceptibility (χfd) was measured using Bartington MS2B sensor with two measuring frequencies (0.47 and 4.7 kHz; Bartington Instruments Ltd., UK). Magnetic remanences were measured with JR-6A automatic spinner magnetometer (Agico, Czech Republic) with sensitivity 2 × 10⁻⁶ A/m. Anhysteretic remanent magnetization (ARM) was induced in Minispin AF demagnetizer (Molspin Ltd., UK) with ARM attachment, applying alternating magnetic field with maximum amplitude of 100 mT and a steady field of 0.1 mT. Isothermal remanent magnetizations (IRM) were imparted by ASC pulse magnetizer (ASC Scientific, USA) with maximum field of 5T. Hysteresis measurements were done on vibrating sample magnetometer Micromag 3900 (Princeton Measurements Corporation, USA) with maximum applied field of 1T. Hysteresis parameters saturation magnetization (Ms), saturation remanence (Mrs), and coercive force (Bc) were calculated after correction for paramagnetic contribution. Back-field remanent magnetization curves were measured for determination of coercivity of remanence (Bcr). Step-wise thermal demagnetizations of magnetic remanences were performed in a shielded oven MMTD20 (Magnetic Measurements Ltd., UK).
Results
Soil Samples
Soil sample GF58 is representative for wide range of Chernozem-like soils, developed under environmental settings in the temperate climatic area. They are characterized by well-expressed pedogenic magnetic enhancement (Maher, 1986). The sample originates from depth of 58 cm of a soil profile from loess area in NE Bulgaria. Figure 1 shows heating (A, C) and cooling curves (B, D) normalized to the initial magnetic susceptibility value measured for two sample sizes—small amount (m = 0.04 g) and more than three times bigger amount (m = 0.14 g). Normalization of each heating/cooling curve to the initial susceptibility allows for direct comparison of the shape of the curves during slow and fast heating experiments. Using different sample sizes, diverse thermomagnetic curves of magnetic susceptibility are obtained. In case of small sample size (m = 0.04 g), the shapes of the heating and cooling curves for both fast and slow heating rates, are identical (Figures 1A,B). Small change in the initial magnetic susceptibility (an increase of about 20%) occurred after completion of the cycle (Figure 1B). In contrast to this case, entirely different behavior is obtained using ~3 times bigger sample size (m = 0.14 g). Here, significant dissimilarities exist in the shapes of the heating/cooling curves and the degree of enhancement after cooling between fast and slow heating rates. Slow heating results in a decrease of susceptibility after 300°C, followed by sharp peak at 500°C and subsequent drop of the signal to zero at 600°C. On cooling down from 700°C, after a maximum at 360°C, five-fold increase of the signal is observed at room temperature (Figures 1C,D). Using fast heating rate, the sharp peak at 500°C on the heating curve is missing. On the other hand, higher susceptibility enhancement after cooling (6.5 fold) is obtained (Figure 1D). Thus, using small sample size, simple reversible thermomagntic curves are obtained with heating rate playing no role. However, using bigger sample size, different shapes of the heating/cooling curves appear, indicating the occurrence of significant and diverse mineralogical transformations.
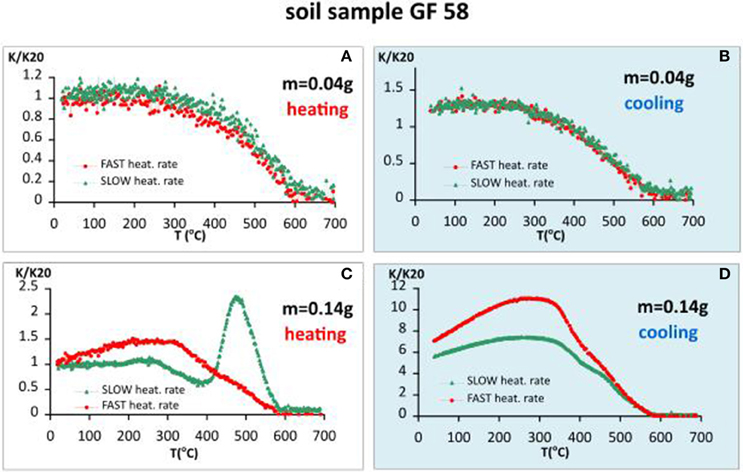
Figure 1. Thermomagnetic analysis of magnetic susceptibility for soil sample GF58, heating in air. (A) Heating curves using fast and slow heating rates for small sample size (m = 0.04 g); (B) cooling curves using fast and slow heating rates for small sample size; (C) heating curves using fast and slow heating rates for large sample size (m = 0.14 g); (D) cooling curves using fast and slow heating rates for large sample size.
To better understand the underlying reasons for the observed differences, detailed information about sample's mineralogy is needed. The data available are briefly presented in Figure 2. Thermogravimetry (TG) and (DTA), illustrated in Figure 2A show two exothermic peaks at 307 and 813°C, and one endothermic—at 1197°C. The position of the first exothermic peak corresponds well to the onset of the significant susceptibility decrease on heating, using 11°C/min heating rate and larger sample size (Figure 1C). These parameters are close to those, used in thermal analysis, which allows their comparison. The first peak, identifiable on both DTA and k-T heating curves could be assigned to burning of organic matter, which is expressed as exothermic peak on DTA curve, while the onset of the significant decrease of susceptibility could be related to the effect of maghemite—hematite transformation. The observed six-fold increase of susceptibility on cooling is explained by the formation of magnetite phase, probably resulting from the reduction of initially present hematite (see Figures 2B,C). Reducing atmosphere is maintained due to the large enough size of the sample, which allows for prevalence of liberated CO/CO2 evolving gases from decomposition of carbonates (typically present in loessic soils). Large paramagnetic phase (53% relative area), identified by Moessbauer analysis at 5K (Figure 2C) suggests that most of Fe3+ ions are in amorphous phases or more dispersed. Taking into account that maghemite is not identified by XRD and Moessbauer analyses, it is supposed to be mainly in a superparamagnetic state. This is confirmed by the obtained high percent frequency-dependent magnetic susceptibility and high proportion (more than 50%) of the pedogenic magnetic susceptibility in the total signal (Figures 2D,E).
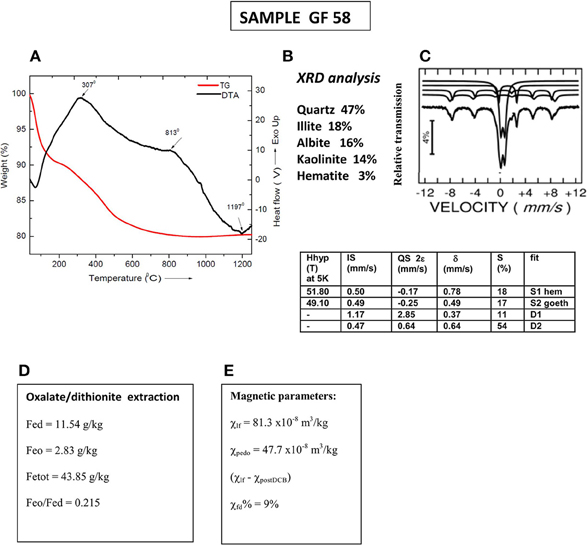
Figure 2. Mineralogical and mineral magnetic characterization of sample GF58. (A) thermogravimetry (TG) and differential thermal analysis (DTA); (B) qualitative XRD analysis; (C) Moessbauer analysis at 5K with parameters listed in the Table: Hhyp, hyperfine field; IS, isomer shift; QS, quadrupole splitting; δ, hyperfine splitting; S%, relative area; (D) magnetic susceptibility data—bulk low-field susceptibility (χ), pedogenic susceptibility (χpedo) obtained as a difference between initial and post-CBD signal and percent frequency dependent magnetic susceptibility χfd%; (E) extractable Fe: Fed–dithionite extractable Fe; Feo–oxalate extractable Fe; Fetot–total iron content.
The second soil sample RED52 originates from the Bt horizon (52 cm depth) of a Rhodic Luvisol from south-east Bulgaria (Jordanova et al., 2013). The obtained thermomagnetic curves for small and large sample size with fast and slow heating rates are presented on Figure 3. The results are similar to those, previously reported for the soil sample GF58. Again, the small sample size leads to reversible and simple convex shape of the curves with final drop at 600°C (Figure 3A) and a 20% increase in susceptibility after heating (Figure 3B). The difference in relative degree of mineralogical changes during heating is visible for the larger sample size (Figures 3C,D). In contrast to the previous example, here we observe a large increase in susceptibility during heating at 500°C for fast heating followed by sharp drop (Figure 3C). Accordingly, newly formed strongly magnetic fraction at fast heating is bigger than that formed during slow heating rate.
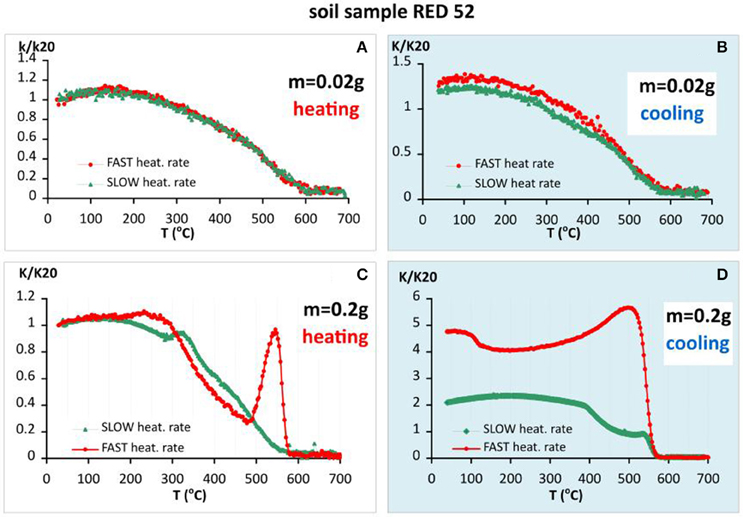
Figure 3. Thermomagnetic analysis of magnetic susceptibility for soil sample RED 52 (Rhodic Luvisol), heating in air. (A) Heating curves using fast and slow heating rates for small sample size (m = 0.02 g); (B) cooling curves using fast and slow heating rates for small sample size; (C) heating curves using fast and slow heating rates for large sample size (m = 0.2 g); (D) cooling curves using fast and slow heating rates for large sample size.
Mineralogy and grain size of the studied sample are deduced from the data, presented in Figure 4. In line with the results from the first example of a soil sample, the exothermic peak identified on DTA curve at 296°C (Figure 4A), representing the effect of burning organic matter, corresponds well with the onset of susceptibility decrease on the heating curve for fast heating rate experiment (Figure 3C). The first significant weight loss (4%) occurred up to 150°C, while the second one is observed in the temperature range 450–550°C (Figure 4A). Magnetic mineralogy is represented by large amounts of fine grained goethite, hematite and some maghemite. Moessbauer spectra at different temperatures (Figure 4C) have been fitted by two external sextets and two central doublets (one of low isomer shift of about 0.48 mm/s, assigned to a paramagnetic Fe3+ phase and another more split one, of isomer shift of 1.16 and large quadrupole splitting, assigned to Fe2+ paramagnetic ions). Whereas the spectral component of the Fe2+ ions remains at about 5(2)% at all the considered temperatures, the first central doublet increases with the temperature from 26(1)% at 10 K to 31(1)% at 295 K, on the account of starting decreasing contribution of the external sextets. The external sextets can be assigned by their hyperfine parameters to Fe3+ based Fe hydroxides nanosized goethite and hematite. The temperature evolution of the Mossbauer spectra suggests that the magnetic nanoparticles are of low average size and wide size distribution. The existence of goethite and hematite particles with stable single domain (and larger) sizes is clearly expressed by the typical thermal behavior of low- and high-coercivity IRM component (Figure 4D), demagnetized at 120 and 700°C. The low coercivity component includes also a maghemite phase with low relative concentration but giving high magnetic enhancement and frequency dependent magnetic susceptibility (Figure 4E). The significant proportion of dithionite extractable iron (Fed) as compared to the total Fe content (Figure 4F) is another evidence for the important role of goethite and hematite as Fe-containing phases.
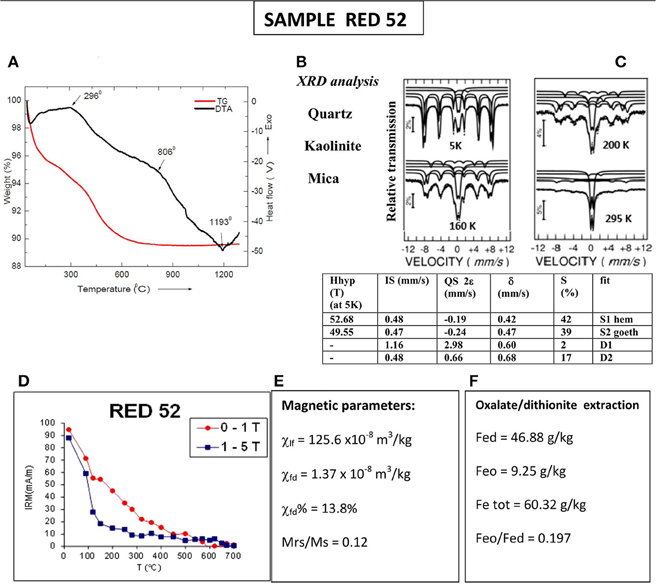
Figure 4. Mineralogical and mineral magnetic characterization of sample RED52. (A) thermogravimetry and differential thermal analysis; (B) quantitative XRD analysis; (C) Moessbauer analysis at 5K with parameters listed in the Table: Hhyp, hyperfine field; IS, isomer shift; QS, quadrupole splitting; δ, hyperfine splitting; S%, relative area; (D) stepwise thermal demagnetization of 2-component IRM (soft and hard), acquired at room temperature; (E) magnetic susceptibility data—bulk low-field susceptibility (χ), frequency dependent susceptibility (χfd), and percent frequency dependent magnetic susceptibility χfd%; (F) extractable Fe: Fed–dithionite extractable Fe; Feo–oxalate extractable Fe; Fetot–total iron content.
Archaeological Brick Sample PAV
The studied brick sample originates from the Buddhist settlement Pavuralakonda (1st century BC to 2nd century AD), located in Andhra Pradesh (India). Typical signs of extensive vitrification of the material are present, according to the criteria of Maniatis and Tite (1981). The sample is chosen because of its specific magnetic mineralogy, represented by a combination of low- and high-coercivity fractions. Observing the behavior of baked clay material during laboratory thermomagnetic analysis helps to elucidate the origin of the noticed differences (see Section Soil Samples)—instability and composition of natural unheated clays (soils) with respect to heating, or other thermally induced effects. The obtained thermomagnetic curves analogous to previous cases, are presented in Figure 5. In contrast with the former examples from soil samples, here we have stable mineralogy and similar heating-cooling curves for the two different heating rates and the two different sample sizes. It can be noticed that small sample size results in bigger differences in the calculated Curie temperatures on the cooling curves, using the method of first derivative (Petrovsky and Kapicka, 2006). Considering only heating curves, it appears that Tc (small sample size) < Tc (large sample size), while for the cooling curves there is no such a tendency. Systematic decrease of Tc on cooling is typical for this material. Sample size dependent feature is also the temperature at which susceptibility reaches maximum—about 20°C shift to higher temperatures is observed for the thermomagnetic analysis of small sample size (Figure 5). An important question in the present study is whether Curie temperatures determined from k-T curves, obtained by using different heating rates, differ significantly. Having in mind the absence of mineralogical transformations and reversibility of susceptibility during heat treatment (Figure 5), this example is suitable for such examination. Figure 6 presents the calculated Tc (as the temperature at which minimum on the first derivative of susceptibility occurs) for both heating and cooling curves and the two sample sizes. It is observed that larger differences in the Tc are characteristic for the runs with slow heating rates (6.5°C/min), and Tcs on heating using different sample sizes (Figure 6).
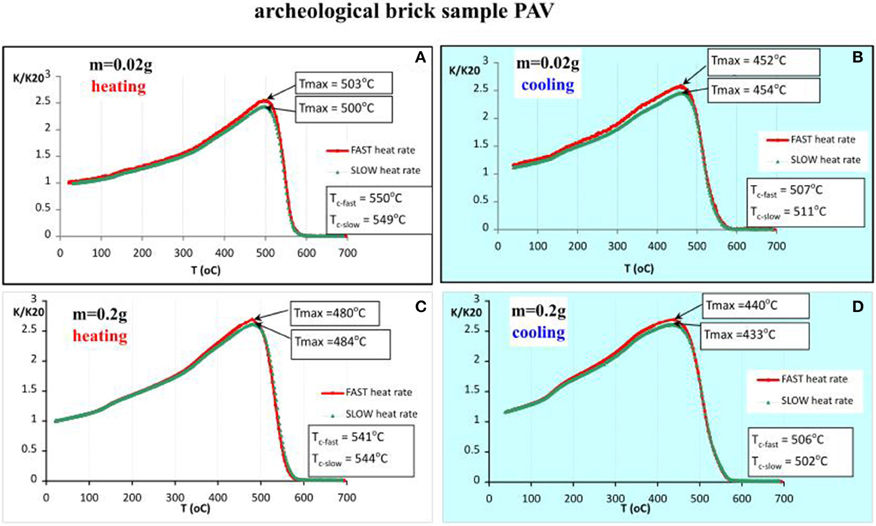
Figure 5. Thermomagnetic analysis of magnetic susceptibility for archeological brick sample PAV, heating in air. (A) Heating curves using fast and slow heating rates for small sample size (m = 0.02 g); (B) cooling curves using fast and slow heating rates for small sample size; (C) heating curves using fast and slow heating rates for large sample size (m = 0.2 g); (D) cooling curves using fast and slow heating rates for large sample size.
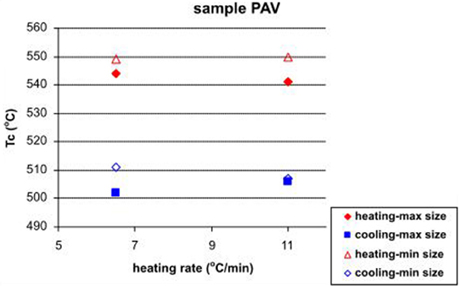
Figure 6. Calculated Curie temperatures (Tc) from heating and cooling curves with large and small sample sizes as a function of the heating rate for sample PAV.
Mineralogical data and specific information about the magnetic phases present in sample PAV are depicted in Figure 7. Thermally stable mineralogy of the brick sample is expressed by the absence of peaks (endo- or exothermic) on TG-DTA data up to temperatures of 1130°C and higher (Figure 7A). Despite the very simple thermomagnetic curves, identifying only one strongly magnetic phase, mineralogy of sample PAV is more complex. Moessbauer analysis detects the presence of two sextets and two central doublets (Figure 7C). The doublet with low isomer shift of about 0.35 mm/s is assigned to paramagnetic Fe3+ phase and another more split one of isomer shift of 1.16 mm/s—to paramagnetic Fe2+ ions. The first central doublet increases with rising temperature from 26% at 10K to 31% at 295K on the account of decreasing contribution of the external sextets. The sextet with the highest hyperfine field Bhf is assigned to hematite, supported also by the obtained negative values of the quadrupole shift. The other sextet could be assigned to a defect magnetite. Both magnetic phases are also identified by the XRD analysis, in conjunction with quartz, jadeite, and albite (Figure 7B). SEM/EDX analysis on single magnetic inclusions in the matrix of the brick reveals the presence of numerous ~1.2 μm Fe-Mn spherules within glassy material and needle-shaped Ba-particles (Figure 7F). It suggests that strongly magnetic phase is represented by Mn-substituted magnetite. The presence of two magnetic phases with contrasting coercivities is further revealed by highly wasp-wasted shape of the hysteresis loop at room temperature (Figure 7D). The high-coercivity phase is hematite, which however do not appear on thermomagnetic curves.
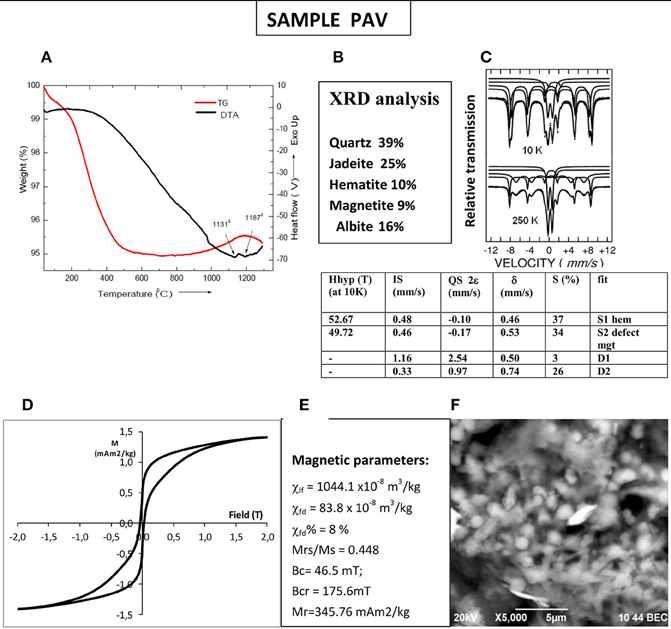
Figure 7. Mineralogical and mineral magnetic characterization of sample PAV. (A) thermogravimetry and differential thermal analysis; (B) qualitative XRD analysis; (C) Moessbauer spectra at 10 and 250K and fitted parameters for 10K spectrum listed in the Table: Hhyp, hyperfine field; IS, isomer shift; QS, quadrupole splitting; δ, hyperfine splitting; S%, relative area; (D) hysteresis loop at room temperature; (E) magnetic parameters—bulk low-field susceptibility (χ), frequency dependent susceptibility (χfd), and percent frequency dependent magnetic susceptibility χfd%, hysteresis parameters and ratios; (F) SEM microphotograph of spherules, trapped within the glassy matrix, found in the black concretions in the brick sample.
Urban Pollution—Sample from Anthropogenic Dust (Sample SZ 2b)
The next example included in our study is an urban settled dust sample gathered from a flat surface at 1.5 m height from the road near major crossing in the town of Stara Zagora (population of 319,000 inhabitants in 2012). According to a previous study (Jordanova et al., 2012), the main source of pollution in the city is traffic, including both combustion and non-exhaust traffic emissions. Thermomagnetic analysis of susceptibility with different heating rates and sample sizes (Figure 8) shows similar behavior as the baked clay sample (Section Archaeological Brick Sample PAV.). Small sample size is linked to larger differences in the shape and peaks' position on heating and cooling curves as compared to larger sample size. It should be emphasized that the exact size of the sample referred as “small” depends on the grain size and mineralogical composition of the material under study. In this particular case “small size” refers to the lowest amount of material used—0.01 g, while larger sizes result in thermomagnetic curves, typical for “large sample sizes” for the other natural samples. Position of susceptibility maximum on the heating curves (Figure 8A) is strongly dependent on the heating rate—at 317°and 448°C for slow and fast heating rates, respectively. Sharp drop in the signal occurs at about 580°C. The remaining small portion is left up to 700°C. Cooling curves for the small sample size are systematically lower than the heating (k/k20 < 1), which suggests an oxidation process during the experiment, being larger for the slow cooling. On the other hand, using larger sample size in the analysis, completely different results are obtained (Figures 8C,D). Small maximum on the heating curves appear at 270°C, followed by large increase with maximum at 500°C and subsequent drop at 580°C, followed by a “hematitic” tail up to 700°C. The two heating runs with fast and slow rate coincide exactly. Magnetic susceptibility increases twice on cooling, suggesting the formation of new strongly magnetic mineral during the heating-cooling cycle. Hematite phase is not identified on the cooling curves (Figure 8D). The largest drop in susceptibility on heating is ascribed to magnetite, as far as the minimum on the second derivative of K is found at 581–578°C on all heating curves (Figure 8). No systematic dependence of the obtained Tc from the heating rate or sample size is observed.
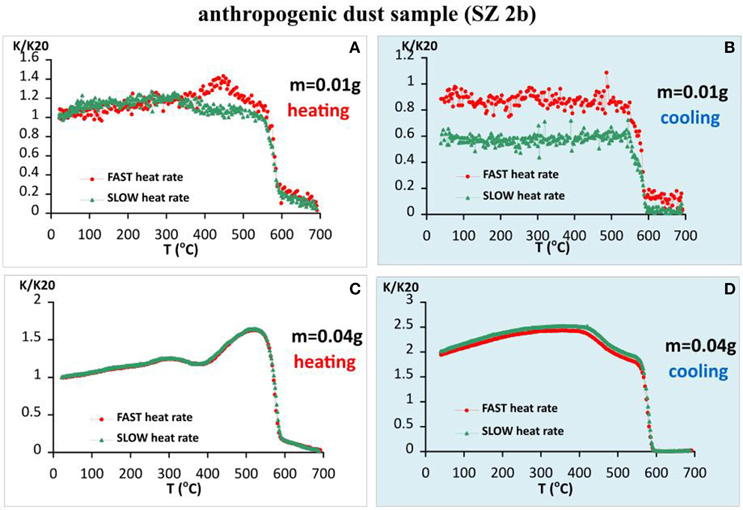
Figure 8. Thermomagnetic analysis of magnetic susceptibility for anthropogenic dust sample SZ 2b, heating in air. (A) Heating curves using fast and slow heating rates for small sample size (m = 0.01 g); (B) cooling curves using fast and slow heating rates for small sample size; (C) heating curves using fast and slow heating rates for large sample size (m = 0.04 g); (D) cooling curves using fast and slow heating rates for large sample size.
Complementary data on magnetic mineralogy, grain size and concentration for sample SZ2b is presented on Figure 9. The observed exothermic peaks on DTA curve at 338 and 468°C most probably represent two stages (surface shell and core) of magnetite oxidation process. The same phenomenon is probably responsible for the obtained maximum susceptibility at about 448°C followed by a gradual decrease on the fast heating curve in Figure 8A for the small sample size. The endothermic peak at 768°C, accompanying the second significant loss weight could be interpreted as thermal decomposition of calcite and/or clay minerals, present in the dust sample. Larger sample sizes lead to different reaction rates and transformations, resulting in thermomagnetic curves, whose peculiarities do not match the peaks of TG-DTA curves (see Figures 8A, 9A). The magnetic fraction in the studied dust sample is represented by coarse-grained anthropogenic particles with specific morphology, typical for high-temperature combustion products (Myung and Park, 2014; Figure 9D). Hematite, visible on the thermomagnetic runs does not contribute to the total remanence. Thermal demagnetization of the ARM (Figure 9C) shows progressive unblocking of the remanence up to 670°C of partially oxidized magnetic fraction. Predominance of the coarse grained magnetite in the settled dust sample is also evidenced by the obtained low χfd% and Mr/Ms ratio (Figure 9C).
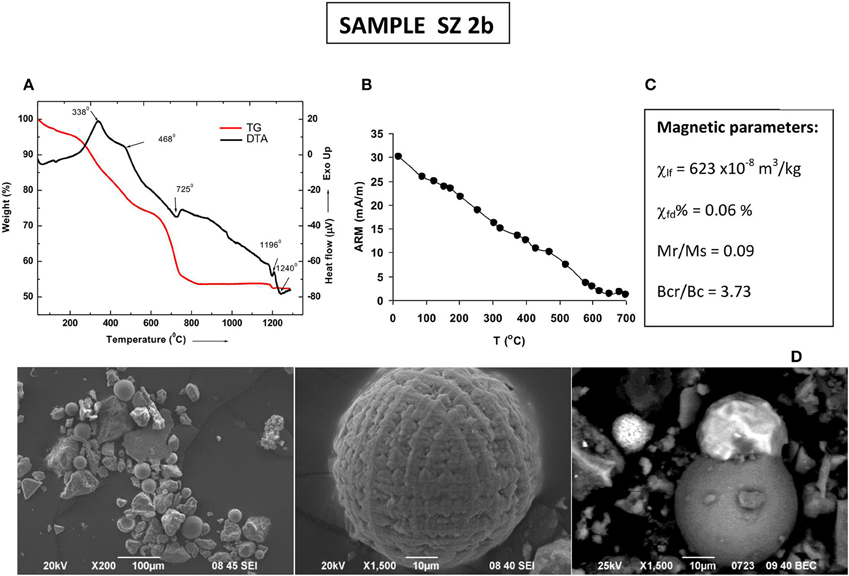
Figure 9. Mineralogical and mineral magnetic characterization of sample SZ 2b. (A) thermogravimetry and differential thermal analysis; (B) stepwise thermal demagnetization of Anhysteretic remanence (ARM); (C) magnetic parameters—bulk low-field susceptibility (χ), percent frequency dependent magnetic susceptibility χfd%, hysteresis ratios; (D) SEM microphotographs of anthropogenic Fe-rich spherules observed in the road dust sample.
The effect of sample size on thermomagnetic runs using fast heating rate is examined by using three different sample weights (Figure 10). Increasing the amount of material in the experimental tube, larger portions of new strongly minerals are created as a result of laboratory heating- cooling cycles, along with different shape of the curves. As far as the signal for each cycle is normalized to the room temperature mass specific susceptibility of the sample, the observed effect is caused by differences in the micro-environment which is created by different amounts of material (e.g., grain size and the corresponding between-particle pore system, gas release and availability of oxygen, etc.).
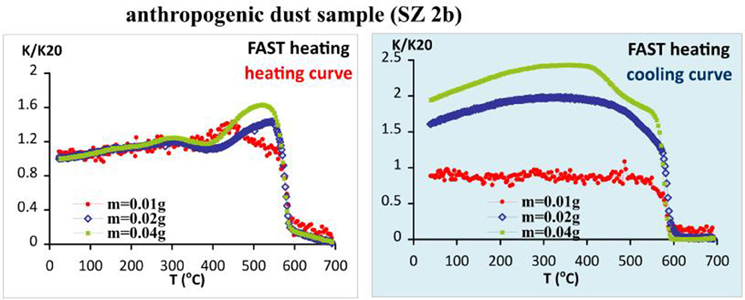
Figure 10. Differences in the shape and observed transformations on thermomagnetic curves for sample SZ 2b, caused by different sample size.
The observed phenomena of heating rate dependent features on thermomagnetic curves are valid for wide range of concentrations of strongly magnetic fractions in the natural materials. The absolute values of measured initial volume susceptibility (k) at room temperature are summarized in Table 1. It is observed that susceptibilities span the interval (2.5–4700) × 10−6 SI and mass-specific values between 80 and 1090 × 10−8 m3/kg, depending on sample type. Natural samples with lower magnetic susceptibilities are more difficult to examine because of the small volume of material used in thermomagnetic runs and correspondingly low volume susceptibilities.
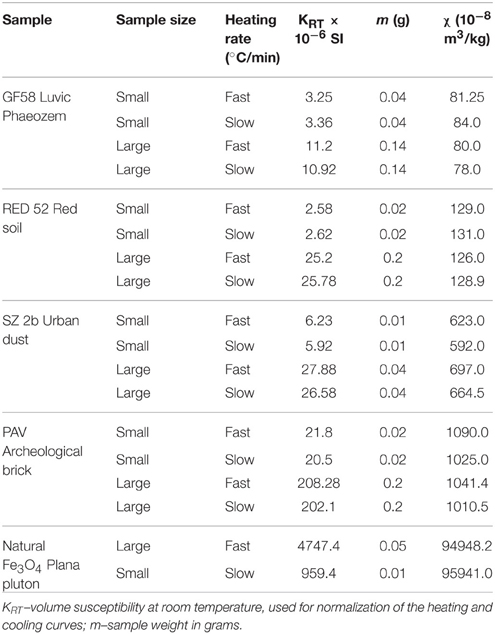
Table 1. Volume (KRT) and mass-specific (χ) magnetic susceptibilities of samples used in thermomagnetic analyses with small and large sample sizes.
Curie Temperature Determination from Thermomagnetic Analysis of Magnetic Susceptibility—Exploring the Effect of Heating Rate
As we see from the thermomagnetic analyses of archeological brick sample (part Archaeological Brick Sample PAV.), the obtained Curie temperatures by using different heating rates and sample sizes differ, especially for the slow heating rate (see Figure 6). However, the obtained Tc values and the additional mineralogical data suggest that the main magnetic career is Mn-substituted magnetite, which enhances the effect of foreign cation reordering during laboratory heating experiments and its influence on Curie temperature (Rezlescu and Cuciureanu, 1970; Isambert et al., 2003). To check the effect for a stoichiometric phase, we carried out thermomagnetic analysis on magnetite extract from the coarse grained fraction of Plana pluton (NW Bulgaria). The results are shown on Figure 11. Almost rectangular shapes of both heating and cooling branches with no change in susceptibility after heating are obtained for slow and fast rates. The observed sharp drop of susceptibility corresponding to the Curie point of magnetite is repeatable and coincides exactly. Small decrease of susceptibility on cooling probably reflects a surface oxidation effect of the large magnetite crystals.
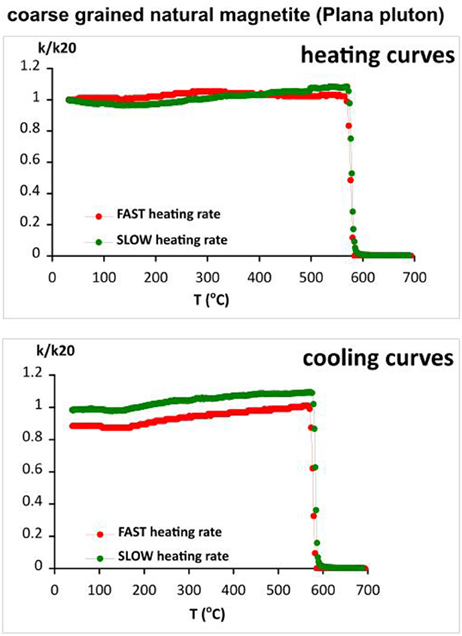
Figure 11. Heating and cooling curves of the thermomagnetic analysis carried out with slow and fast heating rates for natural coarse grained magnetite.
Moreover, an additional check on possible effect of different distance of the powder material to the tip of the thermocouple on the obtained Curie temperatures, is carried out for sample PAV, characterized by marked differences in the Tcs'. An experiment is carried out using small sample size (m = 0.02 g) with fast and slow heating rates, while the material is spread on top of Al2O3 powder, filling the gap between thermocouple's tip and bottom of the tube. Thermomagnetic curve for pure Al2O3 is also measured, showing constant signal which fluctuates around zero. The differences in the calculated Curie temperatures (ΔTc) for pure sample and sample + Al2O3 using slow and fast heating rates are in the range of 2–4°C (Table 2). Having in mind the specified by the manufacturer accuracy of the thermocouple (±3°C), the observed variations of Tcs are not significant, indicating that differences between Tcs using various sample sizes are not influenced by the distance between the tip of the thermocouple and the sample powder.
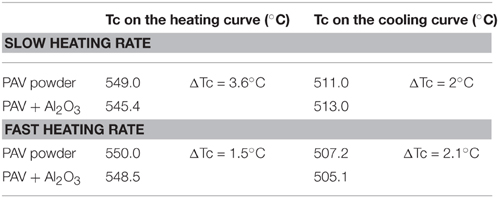
Table 2. Comparison of the calculated Curie temperatures (Tc) for sample PAV using small sample size without supporting uplift of the material (powder PAV) and with uplift of the powder up to the thermocouple's tip by using Al2O3 powder.
Discussion
Thermomagnetic Analysis of Magnetic Susceptibility of Soil Samples
Soils are representatives of natural materials, formed at ambient conditions. Consequently, most of the mineral constituents are instable with increasing temperature and suffer gradual transformations due to laboratory heating. The major reactions, which occur can be grouped in the following way: (a) loss of hydrated water; (b) dehydroxilation of clay minerals; (c) oxidation and solid state transformations of Fe-bearing minerals; (d) decomposition of CaCO3; (e) high-temperature destruction of clays and formation of new phases (Rowland, 1955; Plante et al., 2009; Trindade et al., 2009). All these processes superimpose in the response of different physical properties of soils with increasing temperature. In classical thermal analyses frequently applied in soil science, the effects of heating rate, sample size and grain size of the material are well studied (Gallagher et al., 2003; Romero et al., 2008; Braga et al., 2011; Fernandez et al., 2011; Kousksou et al., 2011). Low field magnetic susceptibility is another basic property of the material, reflecting the content of strongly magnetic minerals. Temperature-dependent magnetic susceptibility behavior monitored in the temperature range 20–700°C gives possibilities for determination of the specific Curie temperature of the ferromagnetic mineral present in the sample, which for the major Fe-containing phases in natural materials falls within this range (Hunt et al., 1995). Kinetics of phase transitions is especially sensitive to grain size of the mineral compound (Navrotsky et al., 2010; Chen, 2013). Moreover, natural samples are complex systems, containing different mineral phases, organic compounds and liquids. All these components react with each other during laboratory heating and cooling experiments, which strongly increases the number of possible resultant magnetic signatures. For example, the presence of organic matter causes a reducing atmosphere during high-temperature experiments because of CO2 gas evolving as a result of burning organic matter. Another frequent reaction occurs between iron oxides in the sample and compounds liberated from dehydroxilation of clay minerals, CaCO3 and other phases (Jiang et al., 2015). As a result, new strongly magnetic minerals are created during heating—cooling experiments and mono-phase reactions and transitions are modified (Hanesch et al., 2006). Kinetics of these non-isothermal solid phase transformations strongly depend on the heating and cooling rates applied (Raju and Mohandas, 2010).
The results from the present experiments by using two different heating rates in thermomagnetic analysis of magnetic susceptibility, together with different sample sizes reveal for the first time the effect of the two parameters on the shape and observed peculiarities of the heating-cooling curves for several case studies. The two examples from soils are taken as representative of a wide range of soil mineralogy, typical for soils in the temperate climatic belt (Chernozems, Phaeozems) and Mediterranean (Rhodic Luvisols). The first obvious effect is that of varying sample size—in cases of small sample size, no significant formation of new strongly magnetic phases is recorded in the heating and cooling runs of the two samples GF58 and RED52. As far as heating and cooling runs for different heating rates coincide (Figures 1A,B, 2A,B), the prevailing effect, which dictates the shape of the thermomagnetic curves is temperature dependence of magnetic susceptibility of the initially present strongly magnetic fraction. Due to the small sample size, the effective atmosphere in interstitial spaces between particles of the powder material, is oxidative (all runs in air). Even though destruction of clay minerals occurs at high temperatures (T > 600°C), the resulting flux of CO2 between mineral grains is readily diluted by the incoming oxygen from air and cannot produce and maintain an effective reducing conditions, which promotes formation of new strongly magnetic phase upon heating. The potential of the mineral composition of the samples to produce such is revealed on the thermomagnetic curves, taken with larger sample sizes (Figures 1C,D, 3C,D). Decrease of susceptibility on heating after the maximum in the temperature range 260–320°C (for both samples GF58 and RED 52) most probably reflects the occurring γ - α Fe2O3 transformation of the pedogenic strongly magnetic fraction. Systematically the onset temperature of this transformation is higher for the fast heating rate as compared with slow heating rate for the same sample (Figures 1C, 3C). The difference in the two examples is the occurrence of a strong maximum at 500°C at slow heating curve for GF58 and at fast heating curve for sample RED 52. Both samples contain hematite, as evidenced from the additional mineralogical data (Figures 2, 4). Its reduction on heating in reducing atmosphere is most probably causing the creation of strongly magnetic magnetite (Mazo-Zuluaga et al., 2003; Jozwiak et al., 2007). The appearance of this event on heating with different rates for the two samples could be related to different mean grain size of hematite, or different clay mineralogy together with presence/ absence of Al-substitutions in the hematite structure (Jiang et al., 2015). The absence of susceptibility decrease after ~300°C on the heating curves for small sample size (Figures 1A, 2A) is difficult to explain, most probably results from stabilization of pedogenic maghemite grains due to established protective hematitic shell at low temperatures and excess oxygen. According to the additional mineralogical information for sample RED52 (Figure 4), high amount of goethite is also present. The observed small bump on the slow heating curve in the temperature interval 270–310°C (Figure 3C) for the large size sample may be related to goethite—maghemite transformation, followed by γ – α Fe2O3 transition. This is not seen on the fast heating curve, as far as the characteristic temperatures of the two reactions for the two heating rates overlap and cannot be separated. Similar feature for both soil samples is that cooling curve for larger sample sizes are always higher than heating, resulting in significant enhancement of susceptibility. The shape of the curves is indicative for the formation of new magnetite-like phase. Higher amounts of magnetic phases created during fast heating/cooling experiments are in accordance with the kinetics of solid state transformations, predicting increasing amount of the transformed phase with increasing heating rate. On the other hand, high transformation rates result in formation of highly disordered metastable phases (Harrison et al., 2000; Bartelt et al., 2013). Presumably, the newly formed magnetic phases are mainly particles in superparamagnetic domain state. This is manifested by the observed well expressed maximum of susceptibility on the cooling curve, representing a Hopkinson effect. A second kink at lower temperatures is observed on the cooling curve for sample RED52 at 120 and 400°C for fast and slow heating rates, respectively, (Figure 3D). This effect is probably related to structural changes (re-organization) in newly formed magnetite during cooling of the established metastable states at the temperature of their formation. The great temperature difference in the two inflection points signifies the importance of the transformation rate on the domain state of newly formed fraction.
Thermomagnetic Analysis of Susceptibility of Arheological Brick (Sample PAV)
In contrast to previous examples, thermal behavior of samples from baked clay material such as bricks, shows much less pronounced mineral transformations due to the fact that these materials were prone to firing during their production (preparation) in the past. This high-temperature stability of the fired brick is expressed by the observed reversible thermomagnetic curves, both for slow and fast heating rates, as well as small and large sample sizes (Figure 5). The most visible feature here is that the obtained Curie temperatures on the heating curves are higher than that on the corresponding cooling curves. Having in mind the mineralogical information from Figure 7, the carrier of susceptibility signal is spherical Mn-substituted magnetite of about 1.2 μm size. Lowering of Curie temperature on cooling may be explained by redistribution and change of valence state of Mn and Fe cations with increasing temperature (Zhang et al., 1998). The effect of cation reordering in magnesioferrites, titanomagnetites and magnetite has been extensively studied (Harrison and Putnis, 1996, 1999; Bartelt et al., 2013; Bowles et al., 2013). Similar effect could be evoked for the observed lowering of Tc on the cooling curves (Figure 5). Until now, the effect of different heating rate on cation reordering is not studied through thermomagnetic analysis of magnetic susceptibility. The example presented here gives such a preliminary data. According to the calculated Tcs' for the two sample sizes and two heating rates following the procedure in Petrovsky and Kapicka (2006), it is observed (Figure 6) that at slow heating rates, highest differences in the Curie temperatures are present. At the same time, the difference in Tcs for small and large sample size is also detected. Consequently, cation reordering as a result of laboratory heating of already heated materials is enhanced by the slow heating rates. Similar lowering of Tc is obtained by Harrison and Putnis (1996) for magnetite-spinel solid solution for sample quenched from 1400°C and another one, subsequently heated to 650°C. In our case the initial quenching occurred during brick's preparation. This is deduced from TG-DTA results and strongly vitrified texture of the brick, suggesting that it had underwent heating at not less than 1100°C. Broad occurrence in the brick of black round inclusions, which contain the observed under SEM Fe-Mn spherules and glassy structures suggests that it represents a remnant of burnt organic fuel. Similar texture and inclusions are reported by Pavia (2006) in his study of Irish bricks. According to it, fuel additions induce locally fast heating rates, reducing conditions and high temperatures, which cause local melting and production of spinel and glass in “hot spots.” In spite of the large amount of hematite deduced by Moessbauer spectroscopy, XRD, and magnetic hysteresis (Figure 5), it does not appear on the thermomagnetic curves.
Another particular result deduced from Figure 5 is that Tcs using small sample size are higher than Tcs deduced for large sample size. The main question in this case of archeological sample is what is the true Curie temperature of the magnetic fraction? Large portion of the strongly magnetic grains should be in a superparamagnetic state because of high percent frequency dependent susceptibility (8%). We carried out also thermomagnetic analysis on magnetic extract, taken by hand magnet, from the bulk material of the brick PAV (data not shown). The obtained Tc on heating is 560°C and Tc on cooling −542°C. These values are higher than the obtained from the bulk samples and suggest that in the magnetic extract only coarse grained particles are present, while in the bulk, significant amount of SP grains lead to a lower Tc on the thermomagnetic curves. Thus, if we consider the Tc of 560°C as representative for the bulk crystalline Mn-substituted magnetite, according to Amighian et al. (2013) could correspond to Mn substitutions x = 0.2 in bulk crystalline phase. Rough estimate of the composition from EDX analysis of Fe-Mn spherule (Figure 7F) suggests Mn content of x = 0.176, which is quite close to the calculated one according to Tc and literature data.
Thermomagnetic Analysis of Anthropogenic Dust Sample (SZ 2b)
The example of thermomagnetic analysis of dust sample aim to reveal the effect of different heating rates / different sample sizes on the behavior of coarse grained strongly magnetic phase, originating from high temperature combustion processes in the anthropogenic emissions. As evidenced from Figure 8, thermomagnetic analysis differ according to the sample size utilized—lower sample size—lower degree of alteration and vice versa. Taking into account the information from additional analyses, strongly magnetic fraction in the sample is represented by coarse grained magnetite of combustion origin (see Figure 9D). Consequently, in this case we avoid the influence of the presence of superparamagnetic fraction on the thermomagnetic behavior. Regarding the data from small sample size (m = 0.01 g) almost reversible k-T curves are obtained. Small peaks on the heating curves have maxima at different temperatures, shifted toward higher temperature for fast heating experiment. This peak most probably results from unblocking of small amount of fine grained particles before sharp decrease of the signal at Curie temperature. Cooling curves are lower than the heating due to surface oxidation of coarse grained magnetic particles (Figures 8A,B). Estimated Curie temperatures on heating and cooling curves are coinciding and range between 578 and 582°C, which is within the range of sensitivity of the thermocouple. A second phase, probably hematite is present also in the dust sample, unblocked at 700°C on the heating curves. Larger sample size causes appearance of new strongly magnetic phase, probably magnetite-like as a result of reduction of hematite in the presence of organic matter and clay minerals. Thermomagnetic analysis using fast heating and different sample sizes (Figure 10) again supports the hypothesis that larger amount of material creates local reducing microenvironment, which causes reduction of hematite.
Thermomagnetic Analysis of Coarse Grained Natural Magnetite
The effect of different heating rates on the obtained Curie temperatures appeared significant in the case of substituted magnetite (sample PAV), which results probably from the redistribution of doping cations. In order to check if there is an effect for k-T results for pure magnetite, additional results for coarse grained magnetite are included in the study. The obtained results (Figure 11) prove that determination of the Curie temperature of pure magnetite is not affected by the heating rate.
Conclusions
1. Thermomagnetic analysis of magnetic susceptibility of natural materials (e.g., soils), revealing thermal transformations of unstable minerals, shows dependence on heating rate and sample size, which is typical for the classical technics in thermal analysis such as thermogravimetry, DTA, differential scanning calorimetry, evolving gas analysis, etc. Fast heating rate exaggerates the effects from solid state thermal transformations, showing higher transformation temperatures and stronger peaks. Larger sample size plays role of a factor for creation of local reducing microenvironment during thermal transformations of samples with organic matter and unstable clay minerals.
2. Thermomagnetic analysis of susceptibility of heated materials (such as archeological baked clay, bricks, etc.) using different heating rates, is sensitive to the magnetic mineralogy in case of non-equilibrium cation distribution in solid solution series or substituted oxides. Determined Curie temperatures on the heating curves for large size samples are lower than that using small sample size. This phenomenon results probably from cation re-distribution during heating, which alters the strength of superexchange interactions between the sublattices and correspondingly changes Tc.
3. Thermomagnetic analysis of pure coarse magnetite shows coinciding Curie temperatures for fast and slow heating rates.
4. The results from our study suggest that if the aim of the analysis is to follow detailed mineralogical transformations in the sample, then it is recommended to use fast heating rate and large sample size in case of fine grained powder material, and fast heating with small sample size in case of coarse grained material. If the intention is to check the presence of substituted iron oxides or solid solutions (e.g., titanomagnetites) helpful results could be obtained comparing the Curie temperatures from fast and slow heating k(T) analyses.
5. This study shows that sample size and heating rate in thermomagnetic analysis of magnetic susceptibility have crucial effects on the shape, behavior and identified Curie temperatures. Consequently, further utilization of the k-T results in data analysis needs exact specification of the two parameters in order to ensure objective inter-laboratory comparison and wider applications.
Author Contributions
DJ contributed to experimental setup, interpretation of the results and drafting the manuscript. NJ contributed to development of research idea, interpretation of the data and preparation of figures.
Funding
Funding provided by project DFNI K02/13 at Bulgarian National Science Fund.
Conflict of Interest statement
The authors declare that the research was conducted in the absence of any commercial or financial relationships that could be construed as a potential conflict of interest.
Acknowledgments
This study is carried out within the frame of the project DFNI K02/13 “Fire in the past, recorded in archeological remains and soils—implications for archeology and soil science from a rock-magnetic perspective” funded by Bulgarian National Science Fund (FNI). The authors acknowledge helpful comments and suggestions made by F. Lagroix.
References
Amighian, J., Karimzadeh, E., and Mozaffari, M. (2013). The effect of Mn2+ substitution on magnetic properties of MnxFe3-xO4 nanoparticles prepared by coprecipitation method. J. Magn. Magn. Mater. 332, 157–162. doi: 10.1016/j.jmmm.2012.12.005
Bartelt, N. C., Nie, S., Starodub, E., Bernal-Villamil, I., Gallego, S., Vergara, L., et al. (2013). Order-disorder phase transition on the (100) surface of magnetite. Phys. Rev. B 88:235436. doi: 10.1103/physrevb.88.235436
Bowles, J. A., Jackson, M. J., Berquo, T. S., Sølheid, P. A., and Gee, J. S. (2013). Inferred time- and temperature-dependent cation ordering in natural titanomagnetites. Nat. Commun. 4, 1916. doi: 10.1038/ncomms2938
Braga, C. I., Rezende, M. C., and Costa, M. L. (2011). Methodology for DSC calibration in high heating rates. J. Aerosp.Technol. Manag. São José dos Campos 3, 179–192. doi: 10.5028/jatm.2011.03021911
Brown, M. E. (1998). “Handbook of thermal analysis and calorimetry,” in Principles and Practice, Vol. 1, ed P. K. Gallagher (The Netherlands: Elsevier), 1–145.
Chen, Y. H. (2013). Thermal properties of nanocrystalline goethite, magnetite, and maghemite. J. Alloys Compd. 553, 194–198. doi: 10.1016/j.jallcom.2012.11.102
Dunlop, D. J. (2014). High-temperature susceptibility of magnetite: a new pseudo- single-domain effect. Geophys. J. Int. 199, 707–716. doi: 10.1093/gji/ggu247
Egli, R. (2009). Magnetic susceptibility measurements as a function of temeperature and freqeuncy I: inversion theory. Geophys. J. Int. 177, 395–420. doi: 10.1111/j.1365-246X.2009.04081.x
Fabian, K., Shcherbakov, V. P., and McEnroe, S. A. (2013). Measuring the curie temperature. Geochem. Geophys. Geosyst. 14, 947–961. doi: 10.1029/2012GC004440
Fernandez, J. M., Plante, A. F., Leifeld, J., and Rasmussen, C. (2011). Methodological considerations for using thermal analysis in the characterization of soil organic matter. J. Therm. Anal. Calorim. 104, 389–398. doi: 10.1007/s10973-010-1145-6
Gallagher, P. K., Blaine, R., Charsley, E. L., Koga, N., Ozao, R., Sato, H., et al. (2003). Magnetic temperature standards for TG. J. Therm. Anal. Calorim. 72, 1109–1116. doi: 10.1023/A:1025032013135
Gromme, C. S., Wright, T. L., and Peck, D. L. (1969). Magnetic properties and oxidation of iron-titanium oxide minerals in Alae and Makaopuhi lava lakes, Hawaii. J. Geophys. Res. 74, 5277–5293. doi: 10.1029/JB074i022p05277
Hanesch, M., Stanjek, H., and Petersen, N. (2006). Thermomagnetic measurements of soil iron minerals: the role of organic carbon. Geophys. J. Int. 165, 53–61. doi: 10.1111/j.1365-246X.2006.02933.x
Harrison, R., Redfern, S. A. T., and Smith, R. I. (2000). In-situ study of the R3 – to R3–c phase transition in the ilmenite-hematite solid solution using time-of-flight neutron powder diffraction. Am. Mineral. 85, 194–205. doi: 10.2138/am-2000-0119
Harrison, R. J., and Putnis, A. (1996). Magnetic properties of the magnetite-spinel solid solution: curie temperatures, magnetic susceptibilities, and cation ordering. Am. Mineral. 81, 375–384.
Harrison, R. J., and Putnis, A. (1999). Determination of the mechanism of cation ordering in magnesioferrite (MgFe2O4) from the time- and temperature-dependence of magnetic susceptibility. Phys. Chem. Miner. 26, 322–332. doi: 10.1007/s002690050192
Hrouda, F. (1994). A technique for the measurement of thermal changes of magnetic susceptibility of weakly magnetic rocks by the CS-2 apparatus and KLY-2 Kappabridge. Geophys. J. Int. 118, 604–612. doi: 10.1111/j.1365-246X.1994.tb03987.x
Hunt, C. P., Moskowitz, B. M., and Banerjee, S. K. (1995). Magnetic properties of rocks and minerals. Rock Phys. Phase Relat Handb. Phys. Constants AGU Ref. Shelf 3, 189–204.
Isambert, A., Valet, J.-P., Gloter, A., and Guyot, F. (2003). Stable Mn-magnetite derived from Mn-siderite by heating in air. J. Geophys. Res. 108, 2283. doi: 10.1029/2002jb002099
Jiang, Z., Liu, Q., Zhao, X., Jin, C., Liu, C., and Li, S. (2015). Thermal magnetic behaviour of Al-substituted haematite mixed with clay minerals and its geological significance. Geophys. J. Int. 200, 130–143. doi: 10.1093/gji/ggu377
Jordanova, D., Jordanova, N., Lanos, P. H., Petrov, P., and Tsacheva, T. S. (2012). Magnetism of outdoor and indoor settled dust and its utilization as a tool for revealing the effect of elevated particulate air pollution on cardiovascular mortality. Geochem. Geophys. Geosys. 13, Q08Z49. doi: 10.1029/2012gc004160
Jordanova, D., Jordanova, N., Petrov, P., and Tsacheva, T. (2010). Soil development of three chernozem-like profiles from North Bulgaria revealed by magnetic studies. Catena 83, 158–169. doi: 10.1016/j.catena.2010.08.008
Jordanova, N., Jordanova, D., Liu, Q., Hu, P., Petrov, P., and Petrovský, E. (2013). Soil formation and mineralogy of a Rhodic Luvisol - insights from magnetic and geochemical studies. Glob. Planet. Change 110, 397–413. doi: 10.1016/j.gloplacha.2013.08.020
Jozwiak, W. K., Kaczmarek, E., Maniecki, T. P., Ignaczak, W., and Maniukiewicz, W. (2007). Reduction behavior of iron oxides in hydrogen and carbon monoxide atmospheres. Appl. Catal. 326, 17–27. doi: 10.1016/j.apcata.2007.03.021
Kissinger, H. (1956). Variation of peak temperature with heating rate in differential thermal analysis. J. Res. Natl. Bur. Stand. 57, 217–221. doi: 10.6028/jres.057.026
Kousksou, T., Jamil, A., El Omari, K., Zeraouli, Y., and Le Guera, Y. (2011). Effect of heating rate and sample geometry on the apparent specific heat capacity: DSC applications. Thermochim. Acta 519, 59–64. doi: 10.1016/j.tca.2011.02.033
Lattard, D., Engelmann, R., Kontny, A., and Sauerzapf, U. (2006). Curie temperatures of synthetic titanomagnetites in the Fe-Ti-O system: effects of composition, crystal chemistry, and thermomagnetic methods. J. Geophys. Res. 111, B12S28. doi: 10.1029/2006JB004591
Liu, Q., Deng, C., Yu, Y., Torrent, J., Jackson, M. J., Banerjee, S. K., et al. (2005). Temperature dependence of magnetic susceptibility in an argon environment: implications for pedogenesis of Chinese loess/palaeosols. Geophys. J. Int. 161, 102–112. doi: 10.1111/j.1365-246X.2005.02564.x
Maher, B. (1986). Characterization of soils by mineral magnetic measurements. Phys. Earth Planet. Inter. 42, 76–92.
Maniatis, Y., and Tite, M. S. (1981). Technological examination of Neolithic – Bronze age pottery from Central and Southeast Europe and from the Near East. J. Archeol. Sci. 8, 59–76. doi: 10.1016/0305-4403(81)90012-1
Mazo-Zuluaga, J., Barrero, C. A., Diaz-teran, J., and Jerez, A. (2003). Thermally Induced Magnetite–haematite transformation. Hyperfine Interact. 148/149, 153–161. doi: 10.1023/B:HYPE.0000003776.84005.89
Myung, C. L., and Park, S. (2014). Review on characterization of nano-particle emissions and PM morphology from internal combustion engines: Part 1. Int. J. Automotive Technol. 15, 203-218. doi: 10.1007/s12239-014-0022-x
Navrotsky, A., Ma, C., Lilova, K., and Birkner, N. (2010). Nanophase transition metal oxides show large thermodynamically driven shifts in oxidation-reduction equilibria. Science 330, 199–200. doi: 10.1126/science.1195875
Pavia, S. (2006). The determination of brick provenance and technology using analytical techniques from the physical sciences. Archaeometry 48, 201–218. doi: 10.1111/j.1475-4754.2006.00251.x
Peter, E., and Kalman, A. (1964). Quantitative X-ray analysis of crystalline multicomponent systems. Acta Chim. Hung. 41, 413–422.
Petrovsky, E., and Kapicka, A. (2006). On determination of the Curie point from thermomagnetic curves. J. Geophys. Res. 111, B12S27. doi: 10.1029/2006JB004507
Plante, A. F., Fernández, J. M., and Leifeld, J. (2009). Application of thermal analysis techniques in soil science. Geoderma 153, 1–10. doi: 10.1016/j.geoderma.2009.08.016
Raju, S., and Mohandas, E. (2010). Kinetics of solid state phase transformations: measurement and modelling of some basic issues. J. Chem. Sci. 122, 83–89. doi: 10.1007/s12039-010-0010-2
Rezlescu, N., and Cuciureanu, E. (1970). Cation distribution and Curie temperature in some ferrites containing copper and manganese. Phys. Status Solidi (a) 3, 873–878. doi: 10.1002/pssa.19700030403
Romero, M., Kovacova, M., and Rincón, J. Ma. (2008). Effect of particle size on kinetics crystallization of an iron-rich glass. J. Mater. Sci. 43, 4135–4142. doi: 10.1007/s10853-007-2318-y
Rowland, R. A. (1955). “Differential thermal analysis of clays and carbonates,” in Clays and Clay Technol., Bull, eds J. A. Pask and M. D. Turner (California, SF), 151–163.
Trindade, M. J., Dias, M. I., Coroado, J., and Rocha, F. (2009). Mineralogical transformations of calcareous rich clays with firing: a comparative study between calcite and dolomite rich clays from Algarve, Portugal. Appl. Clay Sci. 42, 345–355. doi: 10.1016/j.clay.2008.02.008
Keywords: magnetic susceptibility, temperature dependence, heating rate, Curie temperature
Citation: Jordanova D and Jordanova N (2016) Thermomagnetic Behavior of Magnetic Susceptibility—Heating Rate and Sample Size Effects. Front. Earth Sci. 3:90. doi: 10.3389/feart.2015.00090
Received: 16 October 2015; Accepted: 15 December 2015;
Published: 07 January 2016.
Edited by:
Qingsong Liu, Chinese Academy of Sciences, ChinaReviewed by:
Oscar Pueyo Anchuela, Universidad de Zaragoza, SpainLeonardo Sagnotti, Istituto Nazionale di Geofisica e Vulcanologia, Italy
Copyright © 2016 Jordanova and Jordanova. This is an open-access article distributed under the terms of the Creative Commons Attribution License (CC BY). The use, distribution or reproduction in other forums is permitted, provided the original author(s) or licensor are credited and that the original publication in this journal is cited, in accordance with accepted academic practice. No use, distribution or reproduction is permitted which does not comply with these terms.
*Correspondence: Diana Jordanova, diana_jordanova77@abv.bg;
vanedi@geophys.bas.bg