Seasonal Changes in Fe along a Glaciated Greenlandic Fjord
 Mark J. Hopwood1
  Douglas P. Connelly2*
  Kristine E. Arendt3
  Thomas Juul-Pedersen3
  Mark C. Stinchcombe2
  Lorenz Meire3,4
  Mario Esposito2
  Ram Krishna5
- 1Chemical Oceanography, GEOMAR Helmholtz Centre for Ocean Research, Kiel, Germany
- 2National Oceanography Centre, Southampton, UK
- 3Greenland Institute of Natural Resources, Greenland Climate Research Centre, Nuuk, Greenland
- 4Marine Biology Laboratory, Ghent University, Ghent, Belgium
- 5Dalton Cumbrian Facility, Dalton Nuclear Institute, University of Manchester, Cumbria, UK
Greenland's ice sheet is the second largest on Earth, and is under threat from a warming Arctic climate. An increase in freshwater discharge from Greenland has the potential to strongly influence the composition of adjacent water masses with the largest impact on marine ecosystems likely to be found within the glaciated fjords. Here we demonstrate that physical and chemical estuarine processes within a large Greenlandic fjord are critical factors in determining the fate of meltwater derived nutrients and particles, especially for non-conservative elements such as Fe. Concentrations of Fe and macronutrients in surface waters along Godthåbsfjord, a southwest Greenlandic fjord with freshwater input from six glaciers, changed markedly between the onset and peak of the meltwater season due to the development of a thin (< 10 m), outflowing, low-salinity surface layer. Dissolved (< 0.2 μm) Fe concentrations in meltwater entering Godthåbsfjord (200 nM), in freshly melted glacial ice (mean 38 nM) and in surface waters close to a land terminating glacial system (80 nM) all indicated high Fe inputs into the fjord in summer. Total dissolvable (unfiltered at pH < 2.0) Fe was similarly high with concentrations always in excess of 100 nM throughout the fjord and reaching up to 5.0 μM close to glacial outflows in summer. Yet, despite the large seasonal freshwater influx into the fjord, Fe concentrations near the fjord mouth in the out-flowing surface layer were similar in summer to those measured before the meltwater season. Furthermore, turbidity profiles indicated that sub-glacial particulate Fe inputs may not actually mix into the outflowing surface layer of this fjord. Emphasis has previously been placed on the possibility of increased Fe export from Greenland as meltwater fluxes increase. Here we suggest that in-fjord processes may be effective at removing Fe from surface waters before it can be exported to coastal seas.
Introduction
The annual volume of freshwater runoff from the Greenland Ice Sheet has been subject to pronounced increases in the past decade (Hanna et al., 2008; Bamber et al., 2012; Langen et al., 2015). With increasing surface air temperatures over the Arctic, recent increases in annual mass loss from the Greenland Ice Sheet (van Angelen et al., 2013; Vizcaíno et al., 2014) are expected to continue. Fjords in Greenland are important both as carbon sinks (Rysgaard et al., 2012; Sejr et al., 2014; Meire et al., 2015) and as distinct components of the coastal ecosystem (Tang et al., 2011; Arendt et al., 2013; Dziallas et al., 2013). Seasonal discharge from the Greenland Ice Sheet creates strong lateral and vertical gradients in the physical properties of water along these fjords (Rysgaard et al., 2003; Mortensen et al., 2013). As this is a dominant factor in determining ecosystem structure (Arendt et al., 2010; Calbet et al., 2011; Dziallas et al., 2013), increasing freshwater fluxes will have profound impacts in these fjords.
In addition to influencing the physical structure of the water column (Mortensen et al., 2011, 2013; Kjeldsen et al., 2014), glacial discharge can influence nutrient budgets. Glaciers can supply dissolved organic carbon (DOC) (Barker et al., 2006; Hood et al., 2009; Bhatia et al., 2013a), dissolved Si (Apollonio, 1973; Azetsu-Scott and Syvitski, 1999), and the micronutrient Fe (Statham et al., 2008; Gerringa et al., 2012; Planquette et al., 2013) to recipient fresh and coastal waters. Here we report surface water Fe concentrations in Godthåbsfjord, a fjord system in southwest Greenland affected by meltwater from three marine and three land terminating glaciers. In order to determine the fate of glacially derived nutrients, we conducted both spring and summer transects of Godthåbsfjord. We measured macronutrient (dissolved NO3, PO4, and Si), DOC and Fe concentrations along the fjord surface and in freshwater sources to the fjord.
Godthåbsfjord was selected as a fieldsite because it is one of the best studied large fjords in Greenland. The fjord is over 180 km long, 4–8 km wide and up to 625 m deep (mean depth 260 m). The shallowest sill within the main fjord branch is at ~170 m, although a shallow bank, Fyllas Banke, on the continental shelf outside the fjord sits at about 50 m depth (Mortensen et al., 2011). Godthåbsfjord exhibits two pronounced annual phytoplankton blooms of approximately equal magnitude. A spring bloom occurs in April/May followed by a summer bloom in July/August (Juul-Pedersen et al., 2015). Of specific relevance to this work is the fact that the seasonally different circulation modes are well characterized (Mortensen et al., 2011; Kjeldsen et al., 2014). Coastal seawater flows into the fjord at depth with a normal residence time of 1–2 years (Mortensen et al., 2011). Freshwater inputs, beginning intermittently in May and peaking in July (van As et al., 2014), drive estuarine circulation and the formation of a low salinity surface layer (5–10 m deep) in summer (Mortensen et al., 2011, 2013) which flows toward the fjord mouth. Relatively high temperatures in this low salinity surface plume (5–10°C) mean that sufficient heat is present in summer to melt all ice calved into the fjord (Mortensen et al., 2011; Bendtsen et al., 2015). In the inner fjord, buoyant sub-glacial freshwater inputs drive intense mixing close to the glacial fronts which is attributed with driving localized high production (Arendt et al., 2010; Juul-Pedersen et al., 2015). As sub-glacial discharge rises from >100 m depth, large volumes of ambient fjord water are entrained within the plume which then becomes trapped underneath the low salinity surface layer (Mortensen et al., 2011, 2013; Bendtsen et al., 2015). The focus of this work is therefore on the surface waters within Godthåbsfjord because the low-salinity, out-flowing summer surface layer has the greatest potential to export Fe away from glacial outflows.
Materials and Methods
Two transects were conducted in Godthåbsfjord from the coastal zone to the Greenland Ice Sheet (Figures 1, 2). The first cruise, using RV Sanna, subsequent to the spring phytoplankton bloom in Godthåbsfjord (10–14 May 2014) progressed from outside the fjord to the edge of a dense ice mélange (GF11.5). The summer cruise was conducted when the low-salinity plume in the inner fjord was expected to be at, or close to, its annual maximum extent (15, 18, 20–22 August 2014). The transect progressed to the edge of a dense ice mélange (GF13.5) ~6 km away from Narsap Sermia- a marine terminating glacier calving into Godthåbsfjord (Figure 1). Monthly sampling of deep (400 m) fjord water was conducted at station GF10 throughout 2013 using a 5 L Niskin bottle on a stainless steel cable.
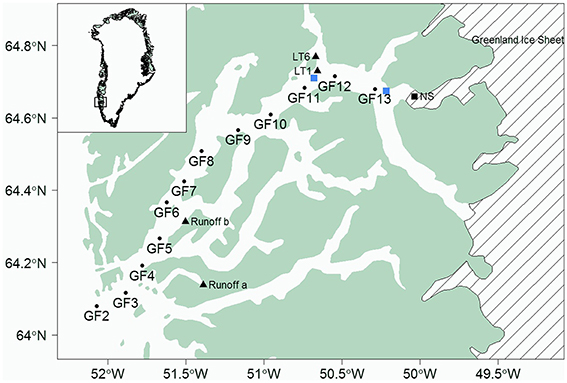
Figure 1. Location of Godthåbsfjord showing fjord stations (GFx), freshwater runoff collection points at Kobbefjord (a) and Sermitsiaq (b), Lake Tasersuaq estuary end stations (LT1 and LT6) and the marine terminating glacier Narsap Sermia (NS). GF11.5 and GF13.5 were conducted at the ice-edge (marked by blue squares close to GF11 and GF13 respectively).
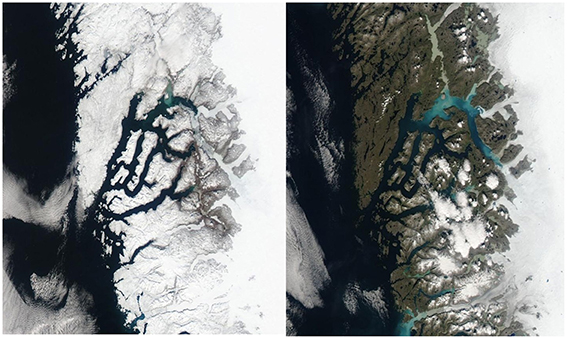
Figure 2. MODIS images of the Godthåbsfjord region (west Greenland) close to our May and August cruise dates. AQUA 11/05/2014 (left) and 06/08/2014 (right). Images provided by the Danish Meteorological Institute1.
Except where stated otherwise, all chemical reagents were ACS grade and used as received from Sigma Aldrich. On both cruises water for Fe, macronutrients, and DOC was collected from surface waters using an extendable plastic pole, fitted with pre-cleaned 1 L (LDPE, nalgene) bottles, that was held ~2 m upstream of the ship. All Godthåbsfjord (GFx) sampling stations were mid-fjord (Figure 1). Dissolved oxygen samples were collected directly from a 5 L Niskin bottle using a Tygon tube, fixed immediately upon collection and then analyzed using the Winkler titration method (Grasshoff et al., 1983). One to two liters of water were filtered (Whatman GF/F filters, 0.7 μm), with subsequent extraction in 10 mL 96% ethanol for 24 h, and chlorophyll a fluorescence in the filtrate was then analyzed (TD-700, Turner Designs fluorometer) before and after the addition of 200 μL 1 M HCl as per Arendt et al. (2010). Physical parameters were collected from a CTD profiler (Seabird SBE 19plus equipped with a Seapoint turbidity sensor) at each station.
Dissolved Fe (DFe, < 0.2 μm), macronutrient, and DOC samples were collected by filtering samples through pre-cleaned (1 M laboratory grade HCl then de-ionized water rinse) 0.2 μm filters (millex, polyvinylidene fluoride). The first 5 mL of filtrate was discarded. Detection limits were 2.7 nM DFe (3 standard deviations of the field blank), 7.0 μM DOC, 0.04 μM NO3, 0.02 μM Si, and 0.02 μM PO4. All vials and filtration apparatus for Fe samples were pre-cleaned (detergent, >1 week in 6 M laboratory grade HCl, 3 rinses with de-ionized water) and then stored double bagged (LDPE bags) until required. DOC samples were collected in pre-combusted 25 mL glass vials, preserved with 100 μL 1 M HCl and refrigerated. DOC was determined by high temperature combustion analysis on a Shimadzu 5000-A Total Organic Carbon Analyzer (Farmer and Hansell, 2007). Macronutrient samples were collected in de-ionized water rinsed 25 mL plastic vials, preserved by the addition of 1 μL HgCl2 and then frozen. Macronutrient concentrations (nitrate + nitrite, nitrite, phosphate, and dissolved Si) were measured using an auto-analyzer (Grasshoff et al., 1983). Prior to analysis the preserved Si samples were defrosted and stood at room temperature overnight. TdFe (total dissolvable Fe in unfiltered samples at pH < 2.0) and DFe samples (both 60 mL) were acidified (pH < 2.0) under a laminar flow hood by the addition of 70 μL HCl (SpA grade, Romil), double sealed in LDPE bags and allowed to stand for 1 month prior to analysis.
Pieces of ice (5–10 kg) were collected manually from small boats and subsampled on RV Sanna. Small pieces (~1–2 kg) were bagged in de-ionized water rinsed LDPE bags and allowed to melt at room temperature. After ~10% of each piece had melted (typically 1–2 h), the bags were swilled and drained. This process was repeated 7 times before meltwater was sampled (for TdFe, DFe, and macronutrients) to ensure that any contaminants or biofilms on the ice surface were removed.
TdFe and DFe were determined via flow injection analysis (FIA) using luminol chemiluminescence (Obata et al., 1993; de Jong et al., 1998). A FIA system was assembled using two 10-port valco valves (Vici), a photonmultiplier tube (PMT, H9319-11, Hamamatsu), a glass flow cell with a mirrored base (Waterville Analytical Products), and a peristaltic pump (MiniPuls 3, Gilson) under a laminar flow hood in a class 100 clean laboratory. The PMT and flow cell were sealed inside two electronic boxes to minimize the baseline light signal and all tubing after the mixing of reagents was opaque (black PTFE, Global FIA). Reagents were made as follows: luminol (5-amino-2,3-dihydro-1,4-phthalazinedione) stock solution [270 mg luminol (Roth, >98%), 500 mg K2CO3 and 15 mL de-ionized water] was sonnicated for 15 min and then refrigerated overnight prior to use. Daily solutions were made of luminol [3 mL stock solution, 100 μL TETA (>97%) up to 1 L with de-ionized water], 0.4 M HCl (SpA grade, Romil), 0.9 M NH4OH (trace metal grade), and 0.3 M H2O2 (trace metal grade). Reagents and the reagent mixing loop were heated to 40°C. One hour prior to analysis, 60 μL 0.1% H2O2 (trace metal grade) was added to 60 mL samples. Samples were analyzed in triplicate. A pre-concentration column (ToyaPearl AF-Chelate 650 M) was used for all samples to prevent interference from metal ions other than Fe(III). Samples were run in batches of similar salinities with the column retention time varied accordingly (15, 45, or 180 s). Fe concentrations were determined from chemiluminescence peak height using Labview software. Five standards encompassing the sample range were run daily and always produced a linear response between 1.0 and 80 nM (R2 > 0.99). Samples with >80 nM Fe were diluted with de-ionized water. Prior to analysis and between sample batches the FIA system was flushed with 1 M HCl for 1 h followed by de-ionized water. The standard deviations of 21 discrete DFe and 5 TdFe sets of triplicate samples collected in quick succession at fjord and estuarine stations were 11 and 10% respectively (all data for GFx and LTx stations is included in the Data Sheet 1 in Supplementary Materials).
The Fe field blank was determined by filtering de-ionized water under field conditions in Greenland and then treating as per the samples. Analytical blanks prepared using acidified de-ionized water in the laboratory always had Fe concentrations below the lowest standard (< 0.10 nM). Field blanks (n = 4), deducted from all sample measurements, had a mean Fe concentration of 4.35 ± 0.89 nM (range 3.29–5.24 nM). This reflects the filtering of samples in the absence of trace metal clean conditions in the field and is therefore much higher than the analytical blank in a class 100 clean laboratory. Analysis of GEOTRACES reference seawater GS (consensus value 0.546 ± 0.046 nM) produced a Fe concentration of 0.69 ± 0.21 nM. Prior to analysis, the pH of GS reference seawater had to be adjusted using 1.5 M ammonium acetate. So, for analysis of GS seawater only, a stock solution of ammonium acetate was neutralized with HCl (SpA grade, Romil) and then used to spike 0.1–5.0 nM Fe standards with the final concentration of ammonium present in GS. The contribution of SpA grade HCl to the sample Fe concentration was assumed to be negligible (reported as < 0.5 ppb, Romil, resulting in a Fe addition of < 0.01 nM to reported concentrations).
Ten sediment samples were either scraped from the surface of ice in situ using plastic apparatus, or collected by filtering (0.2 μm) freshly melted ice. Energy-dispersive X-ray spectroscopy (EDS) was conducted using a Quanta FEG 250 Scanning Electron Microscope (SEM) after sediment collected from ice was freeze-dried and sieved (70 μm nylon mesh to remove anomalous large particles) by mounting samples on plastic disks covered in carbon tape. Elemental peaks were assigned using AZtec EDS software. Total organic carbon (TOC) and nitrogen (TON) were determined via combustion analysis using a Carlo Erba EA 1108 after freeze drying and acid treatment of the samples. An ascorbic acid leach to determine labile Fe (Raiswell et al., 2010) was conducted immediately after sieving samples. In brief, ~60 mg of sediment was added to a 20 mL leaching solution (50 g L−1 sodium citrate, 50 g L−1 sodium bicarbonate, and 10 g L−1 ascorbic acid) through which N2 gas had been bubbled for 2 h. The mixture was then sealed in airtight vials and allowed to leach for 24 h. Leached Fe in solution was determined by measuring absorbance at 562 nm in a 1 cm quartz cell before and after the addition of ferrozine (Stookey, 1970).
Results
Physical Parameters
In May, salinity decreased slightly along the fjord from 33.0 at the mouth of the fjord (GF2) to 31.5 at the edge of dense ice mélange (GF11.5, Figure 3) compared to 27.4 in the shallow waters of the estuary outlet from Lake Tasersuaq (LT1) reflecting the first seasonal input of snow melt (Figure 3). Sea ice is not a predominant feature of Godthåbsfjord, occurring only during winter in limited parts of the inner fjord (Mortensen et al., 2013). Most ice within the fjord is therefore glacial in origin. In August, consistent with the water column structure observed in previous years (Mortensen et al., 2011, 2014), a shallow (< 10 m) low salinity surface plume was evident along the fjord (Figure 3). Salinity decreased from 31.7 in the fjord mouth (GF2) to 8.3 at the ice edge (GF13.5) compared to 13.5 at the estuary station LT1. In both May and August surface water temperature increased in the fjord between GF2 and GF10 (Figure 3). Turbidity (measured as optical backscatter, OBS) in May was consistently low at all surface Godthåbsfjord stations apart from those close to the Lake Tasersuaq outlet (GF11 and neighboring stations) where a tidally driven sediment plume exists in surface waters throughout the year (Figures 2, 3). In August, turbidity in surface waters (0–10 m) at the stations closest to this discharge (GF11 and neighboring stations) was increased. Additionally, there was evidence of a particle plume at depth (beneath 20 m) in front of the marine terminating glacier close to GF13.5 (Figure 3).
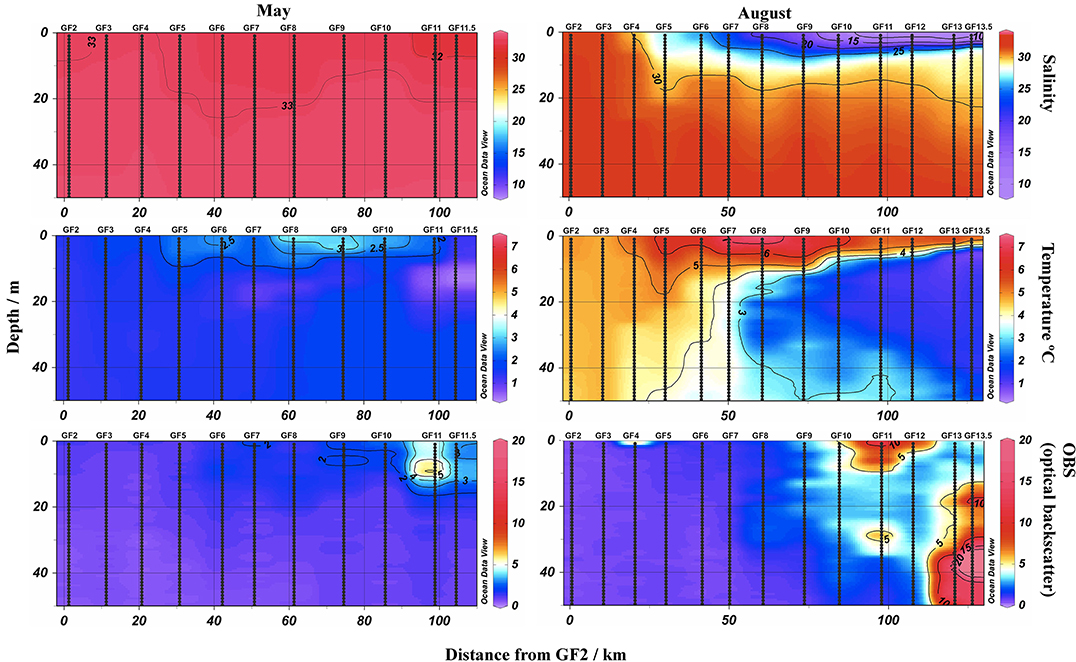
Figure 3. Physical properties in the upper 50 m of the water column within Godthåbsfjord in May (left) and August (right) 2014. Salinity (top), temperature (°C, middle) and turbidity (measured as optical backscatter, OBS, bottom). Sections plotted using Ocean Data View (Schlitzer, 2004) as distance away from GF2. Note the August transect proceeded further toward the Greenland Ice Sheet than the May transect due to reduced ice cover.
Chlorophyll a, DOC, and Dissolved Oxygen
Chlorophyll a in surface water (Figure 4) increased along the fjord transect (2.6–11 μg L−1) in May. Particularly high algal biomass was observed at GF10 and GF11 (10 and 11 μg L−1 respectively). This may reflect the normally later development of the spring bloom in the fjord compared to coastal waters, particularly at these innermost stations, due to ice cover in spring. In August chlorophyll a concentrations were lower (range 0.50–1.8 μg L−1, mean 1.0 μg L−1 across all Godthåbsfjord stations). Within the sediment plume downstream of Lake Tasersuaq (stations LT1-LT6) chlorophyll a was always < 0.25 μg L−1, probably due to light limitation. DOC concentrations in the fjord ranged from 75 to 210 μM and were very similar in both seasons (Figure 5). Unlike temperate estuaries, there was no strong relationship between salinity and DOC concentration (linear R2 < 0.3). Dissolved oxygen increased along the fjord toward the glaciers (Figure 5) with a similar trend in May and August.
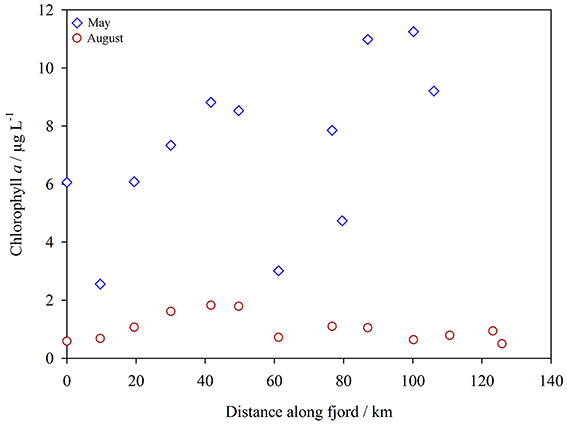
Figure 4. Chlorophyll a in the surface waters of Godthåbsfjord, May (blue diamonds) and August 2014 (red circles). Plotted as distance from GF2.
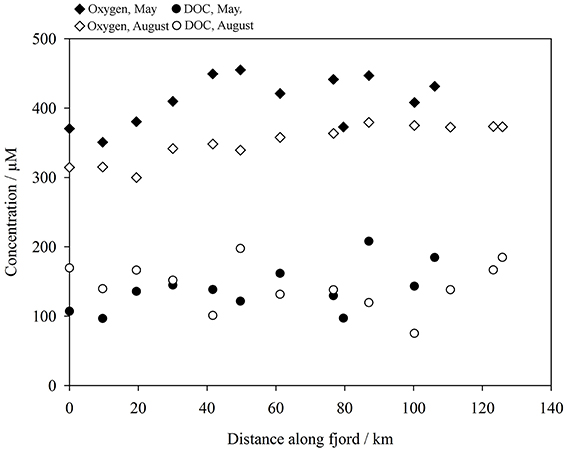
Figure 5. Dissolved oxygen (diamonds) and dissolved organic carbon (DOC, < 0.2 μm, circles) in the surface waters of Godthåbsfjord, May (closed shapes) and August (open shapes) 2014. Plotted as distance from GF2.
Particles and Fe
As normally observed in both glacial discharge (Hawkings et al., 2014) and estuarine environments (Buck et al., 2007; Lippiatt et al., 2010), TdFe concentrations were much higher than DFe concentrations at every station. DFe was equivalent to a mean of 3% TdFe at GFx stations in May, 1% in August and 1% of TdFe at LTx stations. DFe and TdFe (Figure 6) both increased along the fjord in May and August. DFe concentration was highest in August close to the particle plume at GF11 (85 nM) and the ice edge at GF13.5 (34 nM). Other stations in the inner fjord had relatively low DFe concentrations for estuarine waters; 12 nM DFe was found at GF12 and at GF13 DFe was below detection (< 2.7 nM). At stations GF2-9 the range of DFe observed was similar in May (< 2.7–6.9 nM) and August (< 2.7–11 nM). DFe concentrations at stations GF2-9 were much lower than expected, particularly in August considering the low salinity (17–32), and in several cases below our detection limit (< 2.7 nM). Our ability to conduct a statistical comparison of DFe measured from the two transects is therefore limited.
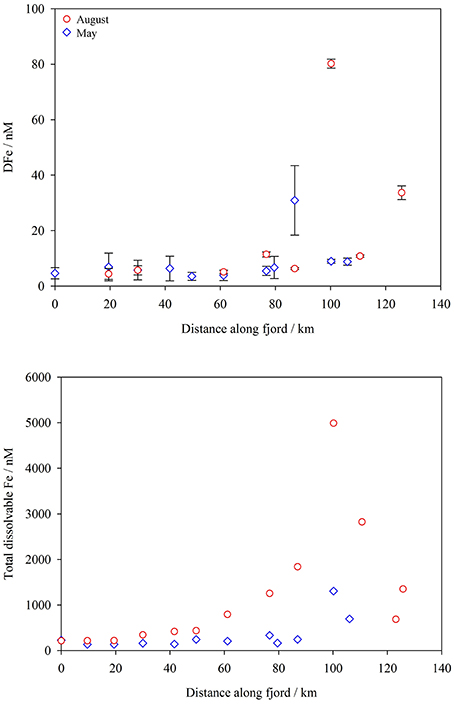
Figure 6. Top: dissolved Fe (DFe, < 0.2 μm) concentrations in the surface waters of Godthåbsfjord May (blue diamonds) and August (red circles) 2014. Plotted as distance from GF2. Bottom: total (dissolvable in unfiltered samples at pH < 2.0) Fe concentrations in the surface waters of Godthåbsfjord May and August 2014.
TdFe was highest within the inner fjord in August (Figure 6). Yet TdFe at GF2 was almost identical in August and May (220 and 230 nM respectively). The concentrations of DFe and TdFe in runoff entering Godthåbsfjord (Runoff b, Figure 1) were 200 nM and 640 nM respectively. At estuarine stations close to Lake Tasersuaq (LT1-LT6, Figure 1), concentrations in August ranged from 40 to 260 nM DFe and 13–41 μM TdFe. The vast majority of Fe present in the estuary must therefore be associated with fine suspended particles. Whilst the size fractions used to define Fe phases vary between studies, our concentrations are within the range reported for freshwater elsewhere around Greenland (Statham et al., 2008; Bhatia et al., 2013b; Hawkings et al., 2014). The non-conservative decline in DFe along estuaries has been well characterized for many river systems worldwide (Boyle et al., 1977; Sholkovitz, 1978), including some in glaciated catchments (Schroth et al., 2014; Zhang et al., 2015). The dominant feature of DFe and TdFe distribution in this fjord however appears to be the particle plume by GF11 which causes some deviation from the expected decline in DFe concentration with increasing salinity (Figure 7). TdFe shows the same pattern of very high concentrations close to the particle plume which occurs at intermediate salinities (Figure 7).
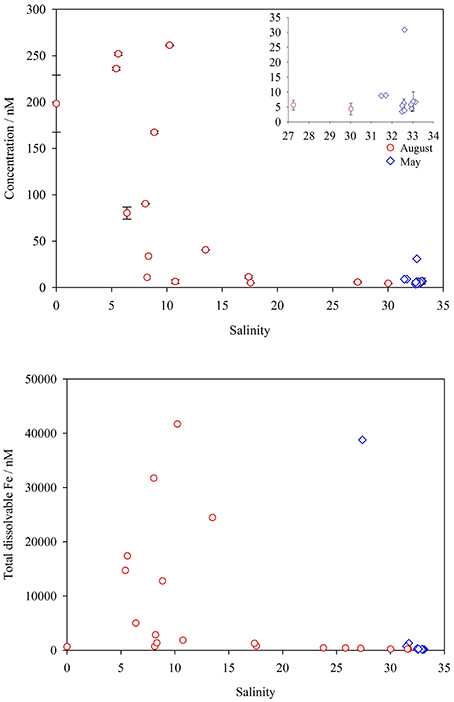
Figure 7. Top: dissolved Fe along the salinity gradient in Godthåbsfjord, including Lake Tasersuaq estuarine waters and runoff, before (May, blue diamonds) and during (August, red circles) the meltwater season. Inset, high salinity stations only. Bottom: total (dissolvable in unfiltered samples at pH < 2.0) Fe concentrations along the salinity gradient in Godthåbsfjord, before and during the meltwater season.
Surface elemental analysis (EDS) of sedimentary material, collected either from the surface of icebergs or by melting ice, indicated a mean particle surface Fe content of 1040 ± 400 μmol g−1 (n = 10). This is within the range of glacially derived sediments from other catchments (Poulton and Raiswell, 2005; Hopwood et al., 2014b). TOC on these particles was 41 ± 42 μmol g−1 and the quantity of labile Fe (Fe removed using an ascorbic acid leach that selectively targets ferrihydrite, Raiswell et al., 2010) was 2.5 ± 1.9 μmol g−1. TOC and labile Fe are known to be proportional because of the association of freshly formed Fe(III) oxyhydroxide nanoparticles with organic smears present on particle surfaces (Poulton and Raiswell, 2005). TOC and labile Fe in these particles are both at the low end of the range observed for glacially derived particles (Poulton and Raiswell, 2005; Hopwood et al., 2014b). The fraction of labile Fe in ice derived particles (0.06–0.4% of surface Fe measured by EDS) is very similar to that reported previously (0.04–0.17%) in the Southern Ocean (Raiswell, 2011). Surface P, 15 ± 11 μmol g−1 (n = 10), was found to be close to that expected from freshly ground base rock (Rudnick and Gao, 2004) which is consistent with the low concentration of organic carbon within the sediment. The particles on the surface of, or within, ice mélange were distinguishable from those collected from within icebergs (Table 1). Whilst all sediment was sieved at 70 μm, SEM revealed that the sediment collected from the surface of ice mélange was much better sorted consisting mainly of fine (1–2 μm diameter), angular particles. The iceberg-borne material was poorly sorted with a higher mean particle size (Figure 8).
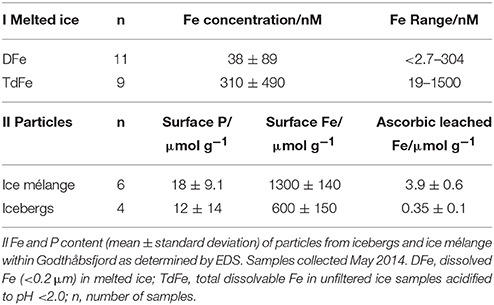
Table 1. I Fe content of meltwater from ice.
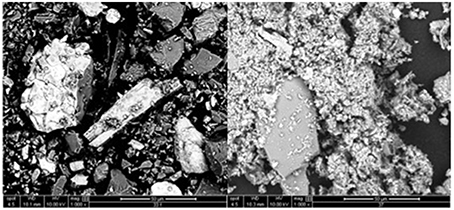
Figure 8. SEM image of sediment collected from ice within Godthåbsfjord (collected within 500 m of station GF 11). Particles collected from melting part of an iceberg (left) and from ice mélange (right).
Particle rich layers were visible both on the surface of icebergs and as thin layers running through ice masses. In May, whilst collecting pieces of ice with visible particles, it was estimated that only 3% (9 out of 300) of icebergs within the vicinity of GF11 had any visible smears of particles on the surface when viewed 1–20 m away from a small boat. In August icebergs were more disperse and far fewer were observed within the vicinity of GF11, but the proportion of icebergs with visible particle smears was higher.
A series of meltwater samples from the same ice chunk (as per other ice samples, the majority of ice was allowed to melt, and drained before beginning to collect a series of meltwater samples) with no visible particle rich layers produced meltwater fractions with 120, 140, 180, 37, and 150 nM TdFe indicating high spatial variability. The range of both DFe and TdFe was also very broad for the ice masses sampled (Table 1). Surface Fe, P, and labile Fe (determined via an ascorbic acid leach) on particles collected from ice mélange and icebergs were relatively constant with much smaller ranges found (Table 1).
Macronutrients
The concentration of dissolved Si and the ratio of NO3:PO4:Si present in surface waters were very different in May and August. In May dissolved Si was lowest in the middle of the fjord (< 0.02 μM at GF7) with concentrations increasing to around 1 μM moving toward either the fjord mouth or the Greenland Ice Sheet (Figure 9). In August dissolved Si was much higher reaching 24 μM close to glacial inputs (GF11) and decreasing with distance from the glaciers (Figure 9). PO4 concentrations were highest by the fjord mouth and lowest at the innermost fjord stations in both seasons (Figure 9). In August PO4 was consistently low at stations above GF9 with concentrations of 0.03 μM or less. NO3 concentrations close to the fjord mouth were similar in May and August (6.6 and 5.6 μM respectively at GF2), but NO3 concentrations at stations above GF8 were lower in August.
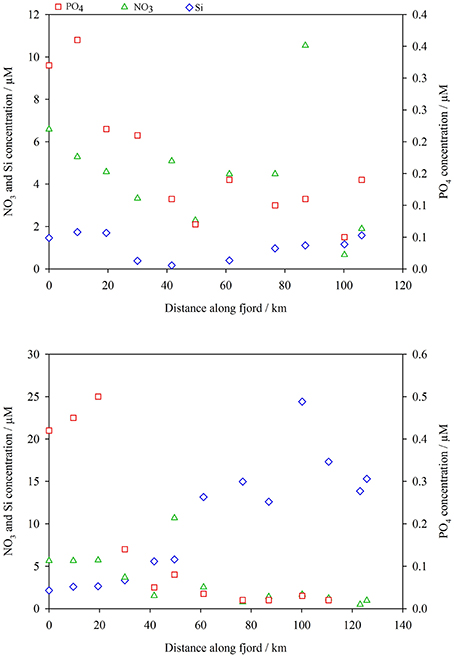
Figure 9. Top: spring macronutrient concentrations at surface stations along Godthåbsfjord, May 2014 (Si blue diamonds, PO4 red squares, NO3 green triangles). Plotted as distance from GF2. Bottom: summer macronutrient concentrations at surface stations along Godthåbsfjord, August 2014.
Freshwater Inputs into the Fjord
Water was sampled from the shallow estuary that drains Lake Tasersuaq (LT1-6, Figure 1), melted icebergs, surface runoff into Godthåbsfjord (Runoff b, Figure 1) and surface runoff into Kobbefjord (a smaller adjacent fjord, Runoff a, Figure 1) for dissolved nutrients (Table 2). The freshwater content of runoff entering Godthåbsfjord via Lake Tasersuaq could not be measured directly so was estimated by extrapolating back from plots of nutrient concentration against salinity for estuarine samples (LT1-6, salinities 5.4–13.5). The low salinity surface water in the inner fjord (GF12-13.5) originates from both melting icebergs and runoff. Given the low PO4 and NO3 at GF13.5 (Figure 9) in August (PO4 < 0.02 and NO3 0.96 μM at a salinity of 8.3), we can conclude that freshwater input at this location must have low mean PO4 and NO3 content of < 0.02 and < 1.0 μM respectively.
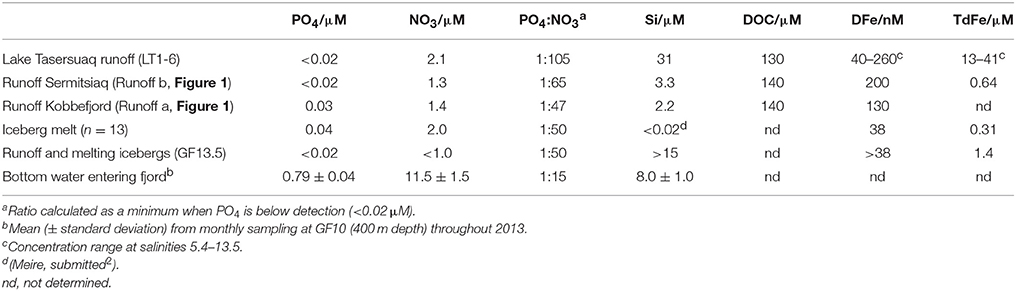
Table 2. Nutrient content of fresh and low salinity water in the region of Godthåbsfjord.
Iceberg meltwater was found to contain comparable PO4 and NO3 to runoff (Table 2). Concentrations of 0.48 μM PO4 and 1.41 μM NO3 are reported for an iceberg in Kangerlugssuaq fjord, East Greenland (Azetsu-Scott and Syvitski, 1999). Not only is the NO3 and PO4 content of all freshwater entering this fjord low (Table 2), but the ratio of PO4:NO3 is also very low compared to coastal seawater entering the fjord at depth. In accordance with the basic Redfield N:P ratio of 16:1, all meltwater and runoff entering this fjord is deficient in PO4 (Table 2) (Redfield, 1934).
The DOC concentration of all freshwater sources sampled was relatively similar (Table 2). As salinity was almost constant from GF12 to GF13.5 (8.1–8.3), we could not estimate the mean freshwater DOC concentration close to the marine terminating glacier by extrapolating back to a salinity of 0.
Discussion
Freshwater Input as a Source of Nutrients other than Fe
Freshwater inputs into this fjord have recently been quantified in several high resolution models (van As et al., 2014; Langen et al., 2015). Estimates of mean annual freshwater discharge between 2002 and 2012 into Godthåbsfjord are 18.4 ± 5.8 Gt yr−1 from the Greenland Ice Sheet and 7.5 ± 2.1 Gt yr−1 from land surface runoff (Langen et al., 2015). An additional freshwater source is calved ice, the majority of which melts within the fjord due to the relatively warm summer surface water temperature (Figure 3) in the upper 10 m (Bendtsen et al., 2015). A recent estimate of the total ice calved into the fjord annually is 7.6 ± 1.5 km3 (Mortensen et al., 2011). It is therefore possible to estimate the total contribution of meltwater to fjord nutrient budgets using the concentrations in Table 2.
Given the very low concentration of NO3 and PO4 in all freshwater sources compared to seawater flowing into the fjord (Table 2), it would however be misleading to suggest that meltwater directly adds these two macronutrients to Godthåbsfjord. In contrast to dissolved Si, which is mostly added at a concentration equivalent to or greater than that in coastal seawater (Meire, submitted2), freshwater actually acts to dilute the NO3 and PO4 content of seawater within the fjord surface layer.
The organic carbon present in meltwater, and the change to the flux of organic carbon into fjords on glacial to inter-glacial timescales, is of interest because fjords are a disproportionately large sink for organic carbon burial given their small surface area (Nuwer and Keil, 2005; Smith et al., 2015). The concentrations of DOC we report in Godthåbsfjord and in runoff sources to the fjord are similar to those reported previously for surface seawater in an adjacent fjord (Sejr et al., 2014), outflow from a proglacial lake in west Greenland (Bhatia et al., 2013a), and freshwater in partially glaciated Alaskan catchments (Hood et al., 2009). The DOC concentration in freshwater is very similar to the concentration of DOC found along Godthåbsfjord in May and only slightly elevated compared to that observed in August (Figure 5). DOC in glacial discharge in west Greenland immediately adjacent to land terminating glacial outflows is lower (25–100 μM) than the concentrations found in Godthåbsfjord and in runoff (Bhatia et al., 2013a). Combined with the lack of a pronounced increase in DOC moving from the fjord mouth toward the inner fjord in August, despite the large salinity gradient, this suggests that total DOC concentrations in Godthåbsfjord are not strongly influenced by input from meltwater or calved ice.
Suspended Particles within the Fjord
Increasing fluxes of glacially derived particles into Greenlandic fjords have the potential to decrease productivity by decreasing the depth of the photic zone (Hop et al., 2002; Murray et al., 2015). There is some limited evidence that particle plumes around Greenland are expanding along with increasing meltwater volumes (Chu et al., 2009; Hudson et al., 2014). In Godthåbsfjord we observed an intense particle plume in surface waters downstream of the Lake Tasersuaq drainage system (Figures 2, 3) with the maximum particle density observed at the surface (0–2 m) and the plume almost entirely confined to the uppermost 10 m (Figure 3). High turbidity explains the low chlorophyll a concentrations in this estuary and the relatively high TdFe concentrations measured (Figure 7). This particle plume is created by tidal mixing in the water column over a shallow mud flat and thus is present throughout the year. Models suggest that the only significant increase in freshwater input into this fjord over the past decade has come from sub-glacial discharge (Langen et al., 2015), which appears to result in a particle plume at depth (Figure 3) rather than at the fjord surface (Arendt et al., 2011; Mortensen et al., 2013). A small surface plume may exist closer to marine terminating glaciers (our closest station in August was 6 km away from the terminus of Narsap Sermia), but if so must be much less extensive than the particle plume around GF11 (Figure 3). We do not therefore expect that turbidity in the surface waters of Godthåbsfjord has increased appreciably with recent increases in total freshwater input. As the sub-glacial input is the only freshwater input that has increased significantly in the past decade (Langen et al., 2015), satellite imagery may not be able to detect the particle plumes that are most likely to be expanding around Greenland.
In addition to sub-glacial discharge, melting icebergs may be a source of some particles to the water column in the inner fjord (Azetsu-Scott and Syvitski, 1999; Raiswell et al., 2006; Shaw et al., 2011). The distribution of particles within ice was found to be very heterogeneous with most particles occurring in thick, darkened layers on or near the surface of ice. The composition of glacial flour collected from ice within the fjord is relatively uniform in terms of its surface P, surface Fe, and labile Fe (Table 1), so the high variability in ice Fe content (TdFe and DFe) must arise from spatial variability in particle density. Our DFe and TdFe concentrations (Table 1) are similar to the large range (4–600 nM DFe) reported in icebergs from the Scotia and Weddell Seas (Lin et al., 2011). This range in DFe and TdFe concentrations, combined with the heterogeneous particle density within ice masses, makes the mean Fe content of icebergs difficult to determine. The difference in particle size (Figure 8) and in the Fe content of particles (Table 1) between icebergs and ice mélange likely reflects the different origins of these particles. Fine (1–2 μm diameter), angular, well sorted particles are suspended in the estuary draining Lake Tasersuaq throughout the year (Figure 2) and thus can be incorporated into ice mélange, or deposited on the surface of icebergs as they roll in the shallow estuary. A broader size range of particles arises in icebergs from the glacial weathering of base rock.
Fe Input and Potential Export to Coastal Seas
Fe is almost certainly not a limiting micronutrient in fjords around Greenland due to the abundant supply from terrestrial and shelf sources throughout the year. Seasonal Fe limitation has however been found in parts of the high latitude North Atlantic (Nielsdottir et al., 2009; Ryan-Keogh et al., 2013). As high concentrations of dissolved and particulate Fe have been reported in meltwater from the Greenland Ice Sheet (Statham et al., 2008; Bhatia et al., 2013b; Hawkings et al., 2014) and glaciers around parts of Antarctica have been demonstrated to supply Fe to adjacent polynyas (Gerringa et al., 2012; Sherrell et al., 2015), there is a clear interest in determining whether or not increasing volumes of meltwater discharge from Greenland could affect Fe supply to offshore marine ecosystems (Yde et al., 2014; Aciego et al., 2015; Hopwood et al., 2015). As most calved ice melts within this fjord (Bendtsen et al., 2015), the summer outflow of the low salinity surface layer along Godthåbsfjord (Mortensen et al., 2011, 2014) is the most likely direct export mechanism for the particulate and dissolved Fe in meltwater to coastal seas.
The water column profile obtained in August (Figure 3) is typical of summer conditions in Godthåbsfjord. A pronounced 7–10 m low salinity surface layer and a 30–60 m sub-glacial discharge layer (Figure 3) exist along the fjord (Mortensen et al., 2013). The thickness of these layers reflects increasing freshwater inputs, demonstrated in 2010 when total glacial ice melt was twice that observed in 2009 and the sub-glacial discharge layer around twice as thick (32–58 m compared to 12–23 m) (Mortensen et al., 2013). This water column structure has major implications for how Fe is transported away from glacial outflows. Turbidity profiles show how the sub-glacial particle plume from a marine terminating glacier (GF13.5, Figure 3) is entirely trapped beneath the surface freshwater layer which essentially indicates that none of the Fe contained within it can be effectively exported to coastal seas. In contrast, the tidally driven particle plume from a land terminating glacial system (GF11, Figure 3) is confined within the low salinity surface layer. Both plumes are localized and do not extend more than 10 km along the fjord. This turbidity profile explains the much higher DFe and TdFe (80 nM and 5.0 μM) at GF11, close to a tidally created particle plume, compared to GF13.5, close to a marine terminating glacier (34 nM and 1.4 μM respectively).
The majority of Fe in glacial meltwater is known to be in the particulate fraction, even if only the most labile Fe minerals (likely to be more bioavailable) are considered (Raiswell, 2011; Hawkings et al., 2014; Schroth et al., 2014). Fe distribution in Godthåbsfjord surface waters (Figures 6, 7) is typical in this respect and similar to observations made previously downstream of Alaskan glacial catchments (Lippiatt et al., 2010; Schroth et al., 2014). Whilst the surface freshwater layer in Godthåbsfjord is exported toward the fjord mouth in the summer circulation mode (Mortensen et al., 2011, 2014), the sheer length of the fjord (the closest glacial inputs are >100 km from the fjord mouth) is a mitigating factor in considering both dissolved and particulate Fe export to coastal waters (Figure 6). None the less, a relatively high concentration of TdFe (>100 nM) appears to be maintained in suspension at stations near the fjord mouth throughout the year (Figure 6). But, as this Fe is present both before (May) and during (August) the meltwater season, it cannot be directly derived from recent meltwater input.
Unless dissolved Fe is complexed by ligands (Kuma et al., 1996; Johnson et al., 1997), it is rapidly scavenged from solution. The high particle concentration within the vicinity of glacial outflows is likely to promote the rapid removal of dissolved Fe from the aqueous phase as occurs in particle rich bottom water (Homoky et al., 2012). Scavenging is a major reason why dissolved Fe concentrations in the open ocean are so low (Johnson et al., 1997; Wu and Boyle, 2002; Boyd and Ellwood, 2010). Terrestrially derived DOC present in temperate rivers normally includes organic Fe ligands (Powell and Wilson-Finelli, 2003; Buck et al., 2007). These ligands promote Fe solubility (Gerringa et al., 2007; Laglera and van den Berg, 2009) by facilitating the transfer of Fe from labile particulate phases to dissolved phases. Terrestrially derived ligands are still important after the removal of most DFe during estuarine mixing as, whilst the majority of terrestrial humic material is also flocculated (Sholkovitz et al., 1978), a fraction of the humics remain in solution and continue to contribute to Fe solubility in coastal waters (Buck et al., 2007; Laglera and van den Berg, 2009). However, relative to temperate estuaries, DOC concentrations in freshwater sources to Godthåbsfjord are very low (Table 2). The high ratio of Fe:DOC in the fjord estuary (and presumably therefore also the ratio of Fe: terrestrially derived Fe ligands), coupled with plumes of lithogenic particles in the freshwater outflows, means that scavenging is likely to be particularly efficient. Fe behavior in the glacially fed Arctic River Bayelva supports this hypothesis. Eighty percent of dissolved Fe (< 0.40 μm) was found to aggregate along a 4 km stretch of river prior to additional removal during estuarine mixing (Zhang et al., 2015). This resulted in a final dissolved Fe removal of around 98% between a glacial outflow and the sea, which is at the upper end of the range observed in temperate estuarine systems (Boyle et al., 1977; Sholkovitz, 1978).
The development of the low salinity surface layer along the fjord in summer (Figure 3) appears to have very little effect on TdFe concentrations close to the fjord mouth (Figure 6) suggesting that much of the “new” particulate Fe deposited within the inner fjord in summer remains trapped there. TdFe or DFe could be transported out of the fjord at depth, but this is not viable throughout summer when the fjord's outflow is at the surface (Mortensen et al., 2011). As DFe is present at similar concentrations in May and August, despite very different water column properties, we can speculate that the concentration of DFe observed at stations GF2-9 may be at, or close to, a maximum value that cannot increase further without an increase in ligand concentration. Ligands within the vicinity of Fe-rich glacial outflows are likely to be saturated (Lippiatt et al., 2010; Thuroczy et al., 2012), so DFe export away from such Fe inputs may be “ligand limited.” For rivers the fraction of DFe removed from the dissolved phase during transport through an estuary is normally estimated as a fixed percentage (typically 90–98%) of the freshwater Fe concentration (Boyle et al., 1977; Sholkovitz et al., 1978; Mayer, 1982). The magnitude and speciation of Fe passing through estuaries may however vary seasonally (Mayer, 1982; Ozturk et al., 2002; Hopwood et al., 2014a), so it is not entirely clear whether it is generally correct to assume that river water DFe concentration is always proportional to DFe concentration in high salinity estuarine water. Whilst, to our knowledge, no measurements of trace metal ligand concentrations are available for a high latitude fjord environment, if ligands can limit DFe in estuaries (Buck et al., 2007) then the DFe capacity of high Fe, low DOC meltwater is always likely to be constrained by a low ligand concentration (Lippiatt et al., 2010). A major question beyond the scope of this manuscript is therefore how ligand concentrations will change within this environment as glaciers retreat and fresh water fluxes increase.
The summer stratification observed at stations in the middle of Godthåbsfjord breaks down at the fjord mouth (Figure 3) such that at GF2 and in shelf waters full depth profiles of Fe would be necessary in order to quantify the different processes acting as Fe sources to the water column (for example shelf sediment re-suspension and outflow from Godthåbsfjord and adjacent fjords). Distinguishing between direct meltwater input of DFe and recycled DFe input (Fe that may have been through one or more “rejuvenation” cycles as it is progressively solubilized and then re-precipitated as Fe-oxyhydroxides, Raiswell and Canfield, 2012) at the fjord mouth and in offshore waters is important as it has implications for the timing of DFe delivery into the water column and for how DFe will respond to increasing freshwater fluxes into the fjord.
In Godthåbsfjord there are some specific features that generally impede the potential for both dissolved and particulate Fe export. The dominant southerly winds and the warm (up to 10°C) summer surface water temperature (Figure 3) mean that most ice melts within the fjord rather than being exported (Mortensen et al., 2011). These wind conditions are not typical of other Greenlandic fjords. Scaling up results from one fjord to the entire Greenland Ice Sheet is always difficult due to the poor understanding of fjord-scale seasonal water mass movements around Greenland. It is thus not possible to say that Godthåbsfjord is “representative” of all large Greenlandic fjords. However, Straneo and Cenedese (2015) estimated that most large glacial outflows in Greenland occur 50–100 km inside coastal fjords, so in-fjord processes are certainly an important consideration when quantifying the export of any meltwater derived components.
In summary, our results emphasize the importance of an integrated approach to determine the effect of increasing discharge from ice sheets on adjacent water bodies. Changes to the biogeochemical cycling of Fe and macronutrients do not occur in isolation from physical processes driven by increasing water fluxes. Especially with elements such as Fe, which exhibit non-conservative mixing behavior in estuaries (Boyle et al., 1977; Sholkovitz, 1978; Sholkovitz et al., 1978), speculation about the potential influence of increasing glacial meltwater fluxes on offshore Fe concentrations based solely on freshwater composition is misguided.
Conclusions
Glacial freshwater inputs act as sources of Fe to Godthåbsfjord. Sub-glacial discharge into this fjord is increasing which could lead to greater Fe and Si fluxes into the inner fjord. However, in this fjord we found much higher surface DFe and TdFe concentrations close to a land terminating glacial outflow than next to a marine terminating glacial outflow. Particle inputs and DFe from sub-glacial discharge do not appear to enter the fjord's surface outflowing layer. Thus, increases in the volume of sub-glacial discharge may have a minimal effect on fjord and coastal DFe concentrations. TdFe concentrations in this fjord were high (>100 nM at all stations) both before and during the meltwater season, but ligand concentration may limit DFe concentration in fjord waters. It is presently uncertain how trace metal ligand concentrations will change with increasing freshwater discharge, glacial retreat and other manifestations of climate change around Greenland.
High Fe concentrations in a Greenlandic fjord (Bhatia et al., 2013b) have been used to speculate that meltwater from the Greenland Ice Sheet may become an increasingly important source of dissolved Fe to basins of the high latitude North Atlantic that can be seasonally iron limited or co-limited (Nielsdottir et al., 2009; Ryan-Keogh et al., 2013). Fjords are however a key influence on the physical dynamics and biogeochemistry of coastal waters around Greenland and yet their influence on Fe export from glaciers to coastal seawater has not previously been characterized. Here we demonstrate that due to a combination of the summer circulation mode in Godthåbsfjord, rapid iceberg melting, scavenging and the likely saturation of Fe ligands in fjord waters (Lippiatt et al., 2010; Thuroczy et al., 2012), almost all of the new Fe (dissolved and particulate) entering the fjord from glacial outflows in summer appears to be trapped within this fjord. There is thus no clear mechanism, other than possibly an increase in ligand concentration, via which increasing supply of meltwater could directly lead to increasing dissolved or particulate Fe concentrations in coastal or offshore waters.
Suspended particles and Fe may of course enter the ocean directly from glaciers that terminate over the shelf rather than within a confined fjord (Gerringa et al., 2012), but glacial inputs around Greenland typically occur 50–100 km within fjords (Straneo and Cenedese, 2015). Glacially derived sediment on the shelf outside this fjord could still ultimately be an important source of Fe to coastal seawater, as has been demonstrated to be the case in other shelf systems (Johnson et al., 1999; Elrod et al., 2004; Lam and Bishop, 2008). However, the magnitude of this source of Fe to the water column may not respond solely to increasing sediment inputs. Fe inputs into bottom water from shelf sediments are known to be regulated by a combination of the oxygen and particle content of bottom water (Severmann et al., 2010; Homoky et al., 2012). The physical structure and circulation within the water column is also important in determining whether or not this benthic source supplies Fe to surface waters (Wu and Luther, 1996; Croot and Hunter, 2000; Gerringa et al., 2015). Sherrell et al. (2015) for example reported elevated benthic DFe concentrations at >400 m in the Amundsen Sea Polynya in Antarctic shelf waters, but concluded that this Fe input is not a major supply term to the euphotic zone. The assumption that increasing freshwater or sediment fluxes from the Greenland Ice Sheet into fjords will increase DFe supply to coastal seas is therefore not necessarily correct.
Author Contributions
DC, MH, LM, KA, and TJ designed the study. MH, KA, TJ, and LM conducted fieldwork. MH, KA, ME, RK, LM, and MS conducted laboratory analysis. MH wrote the initial draft of the paper and then all authors contributed to its revision.
Conflict of Interest Statement
The authors declare that the research was conducted in the absence of any commercial or financial relationships that could be construed as a potential conflict of interest.
Acknowledgments
The authors thank the embarked scientists and crews of RV Sanna and the GINR inshore vessels. This work was part funded by the Natural Environmental Research Council (UK). The May 2014 cruise onboard RV Sanna was conducted as part of the climate monitoring program “MarineBasis-Nuuk,” a component of GEM, the Greenland Ecosystem Monitoring Programme. S Akbari (University of Southampton) assisted with the analysis of TOC. C Schlosser (GEOMAR) is thanked for assistance assembling a Fe FIA system. Labview software for operating the Fe FIA system was designed by P Croot, M Heller, C Neill, and W King. Two reviewers are thanked for comments that improved the manuscript. LM was supported by the Research Foundation Flanders (FWO aspirant grant).
Supplementary Material
The Supplementary Material for this article can be found online at: https://www.frontiersin.org/article/10.3389/feart.2016.00015
Footnotes
1. ^http://ocean.dmi.dk/arctic/satimg.uk.php.
2. ^High dissolved silica export from the Greenland Ice Sheet.
References
Aciego, S. M., Stevenson, E. I., and Arendt, C. A. (2015). Climate versus geological controls on glacial meltwater micronutrient production in southern Greenland. Earth Planet. Sci. Lett. 424, 51–58. doi: 10.1016/j.epsl.2015.05.017
Apollonio, S. (1973). Glaciers and nutrients in Arctic seas. Science 180, 491–493. doi: 10.1126/science.180.4085.491
Arendt, K. E., Dutz, J., Jonasdottir, S. H., Jung-Madsen, S., Mortensen, J., Moller, E. F., et al. (2011). Effects of suspended sediments on copepods feeding in a glacial influenced sub-Arctic fjord. J. Plankton Res. 33, 1526–1537. doi: 10.1093/plankt/fbr054
Arendt, K. E., Juul-Pedersen, T., Mortensen, J., Blicher, M. E., and Rysgaard, S. (2013). A 5-year study of seasonal patterns in mesozooplankton community structure in a sub-Arctic fjord reveals dominance of Microsetella norvegica (Crustacea, Copepoda). J. Plankton Res. 35, 105–120. doi: 10.1093/plankt/fbs087
Arendt, K. E., Nielsen, T. G., Rysgaard, S., and Tonnesson, K. (2010). Differences in plankton community structure along the Godthabsfjord, from the Greenland ice sheet to offshore waters. Mar. Ecol. Prog. Ser. 401, 49–62. doi: 10.3354/meps08368
Azetsu-Scott, K., and Syvitski, J. P. M. (1999). Influence of melting icebergs on distribution, characteristics and transport of marine particles in an East Greenland fjord. J. Geophys. Res. 104, 5321. doi: 10.1029/1998JC900083
Bamber, J., van den Broeke, M., Ettema, J., Lenaerts, J., and Rignot, E. (2012). Recent large increases in freshwater fluxes from Greenland into the North Atlantic. Geophys. Res. Lett. 39:L19501. doi: 10.1029/2012gl052552
Barker, J. D., Sharp, M. J., Fitzsimons, S. J., and Turner, R. J. (2006). Abundance and dynamics of dissolved organic carbon in glacier systems. Arct. Antarct. Alp. Res. 38, 163–172. doi: 10.1657/1523-0430(2006)38[163:AADODO]2.0.CO;2
Bendtsen, J., Mortensen, J., Lennert, K., and Rysgaard, S. (2015). Heat sources for glacial ice melt in a West Greenland tidewater outlet glacier fjord: the role of subglacial freshwater discharge. Geophys. Res. Lett. 42, 4089–4095. doi: 10.1002/2015GL063846
Bhatia, M. P., Das, S. B., Xu, L., Charette, M. A., Wadham, J. L., and Kujawinski, E. B. (2013a). Organic carbon export from the Greenland ice sheet. Geochim. Cosmochim. Acta 109, 329–344. doi: 10.1016/j.gca.2013.02.006
Bhatia, M. P., Kujawinski, E. B., Das, S. B., Breier, C. F., Henderson, P. B., and Charette, M. A. (2013b). Greenland meltwater as a significant and potentially bioavailable source of iron to the ocean. Nat. Geosci. 6, 274–278. doi: 10.1038/ngeo1746
Boyd, P. W., and Ellwood, M. J. (2010). The biogeochemical cycle of iron in the ocean. Nat. Geosci. 3, 675–682. doi: 10.1038/ngeo964
Boyle, E. A., Edmond, J. M., and Sholkovitz, E. R. (1977). Mechanism of iron removal in estuaries. Geochim. Cosmochim. Acta 41, 1313–1324. doi: 10.1016/0016-7037(77)90075-8
Buck, K. N., Lohan, M. C., Berger, C. J. M., and Bruland, K. W. (2007). Dissolved iron speciation in two distinct river plumes and an estuary: implications for riverine iron supply. Limnol. Oceanogr. 52, 843–855. doi: 10.4319/lo.2007.52.2.0843
Calbet, A., Riisgaard, K., Saiz, E., Zamora, S., Stedmon, C., and Nielsen, T. G. (2011). Phytoplankton growth and microzooplankton grazing along a sub-Arctic fjord (Godthabsfjord, west Greenland). Mar. Ecol. Prog. Ser. 442, 11–22. doi: 10.3354/meps09343
Chu, V. W., Smith, L. C., Rennermalm, A. K., Forster, R. R., Box, J. E., and Reeh, N. (2009). Sediment plume response to surface melting and supraglacial lake drainages on the Greenland ice sheet. J. Glaciol. 55, 1072–1082. doi: 10.3189/002214309790794904
Croot, P. L., and Hunter, K. A. (2000). Labile forms of iron in coastal seawater: Otago Harbour, New Zealand. Mar. Freshw. Res. 51, 193–203. doi: 10.1071/MF98122
de Jong, J. T. M., den Das, J., Bathmann, U., Stoll, M. H. C., Kattner, G., Nolting, R. F., et al. (1998). Dissolved iron at subnanomolar levels in the Southern Ocean as determined by ship-board analysis. Anal. Chim. Acta 377, 113–124. doi: 10.1016/S0003-2670(98)00427-9
Dziallas, C., Grossart, H. P., Tang, K. W., and Nielsen, T. G. (2013). Distinct communities of free-living and copepod-associated microorganisms along a salinity gradient in Godthabsfjord, West Greenland. Arct. Antarct. Alp. Res. 45, 471–480. doi: 10.1657/1938-4246.45.4.471
Elrod, V. A., Berelson, W. M., Coale, K. H., and Johnson, K. S. (2004). The flux of iron from continental shelf sediments: a missing source for global budgets. Geophys. Res. Lett. 31, L12307. doi: 10.1029/2004GL020216
Farmer, C. T., and Hansell, D. H. (2007). “Determination of dissolved organic carbon and total dissolved nitrogen in sea water,” in Guide to Best Practices for Ocean CO2 Measurements, PICES Special Publication 3, eds A. G. Dickson, C. L. Sabine, and J. R. Christian, 191.
Gerringa, L. J. A., Alderkamp, A.-C., Laan, P., Thuroczy, C.-E., de Baar, H. J. W., Mills, M. M., et al. (2012). Iron from melting glaciers fuels the phytoplankton blooms in Amundsen Sea (Southern Ocean): iron biogeochemistry. Deep. Res. Part II Top. Stud. Oceanogr. 71–76, 16–31. doi: 10.1016/j.dsr2.2012.03.007
Gerringa, L. J. A., Laan, P., van Dijken, G. L., van Haren, H., de Baar, H. J. W., Arrigo, K. R., et al. (2015). Sources of iron in the Ross Sea Polynya in early summer. Mar. Chem. 177, 447–459. doi: 10.1016/j.marchem.2015.06.002
Gerringa, L. J. A., Rijkenberg, M. J. A., Wolterbeek, H. T., Verburg, T. G., Boye, M., and de Baar, H. J. W. (2007). Kinetic study reveals weak Fe-binding ligand, which affects the solubility of Fe in the Scheldt estuary. Mar. Chem. 103, 30–45. doi: 10.1016/j.marchem.2006.06.002
Grasshoff, K., Ehrhardt, M., and Kremling, K. (1983). “Determination of oxygen,” in Methods of seawater analysis, 2nd Edn., eds. K. Grasshoff, M. Ehrhardt, and K. Kremling (Weinheim: Verlag Chemie), 75–89.
Hanna, E., Huybrechts, P., Steffen, K., Cappelen, J., Huff, R., Shuman, C., et al. (2008). Increased runoff from melt from the Greenland ice sheet: a response to global warming. J. Clim. 21, 331–341. doi: 10.1175/2007JCLI1964.1
Hawkings, J. R., Wadham, J. L., Tranter, M., Raiswell, R., Benning, L. G., Statham, P. J., et al. (2014). Ice sheets as a significant source of highly reactive nanoparticulate iron to the oceans. Nat. Commun. 5:3929. doi: 10.1038/ncomms4929
Homoky, W. B., Severmann, S., McManus, J., Berelson, W. M., Riedel, T. E., Statham, P. J., et al. (2012). Dissolved oxygen and suspended particles regulate the benthic flux of iron from continental margins. Mar. Chem. 134, 59–70. doi: 10.1016/j.marchem.2012.03.003
Hood, E., Fellman, J., Spencer, R. G. M., Hernes, P. J., Edwards, R., D'Amore, D., et al. (2009). Glaciers as a source of ancient and labile organic matter to the marine environment. Nature 462, 1044–1047. doi: 10.1038/nature08580
Hop, H., Pearson, T., Hegseth, E. N., Kovacs, K. M., Wiencke, C., Kwasniewski, S., et al. (2002). The marine ecosystem of Kongsfjorden, Svalbard. Polar Res. 21, 167–208. doi: 10.1111/j.1751-8369.2002.tb00073.x
Hopwood, M. J., Bacon, S., Arendt, K., Connelly, D. P., and Statham, P. J. (2015). Glacial meltwater from Greenland is not likely to be an important source of Fe to the North Atlantic. Biogeochemistry 124, 1–11. doi: 10.1007/s10533-015-0091-6
Hopwood, M. J., Statham, P. J., and Milani, A. (2014a). Dissolved Fe(II) in a river-estuary system rich in dissolved organic matter. Estuar. Coast. Shelf Sci. 151, 1–9. doi: 10.1016/j.ecss.2014.09.015
Hopwood, M. J., Statham, P. J., Tranter, M., and Wadham, J. (2014b). Glacial flours as a potential source of Fe(II) and Fe(III) to polar waters. Biogeochemistry 118, 443–452. doi: 10.1007/s10533-013-9945-y
Hudson, B., Overeem, I., McGrath, D., Syvitski, J. P. M., Mikkelsen, A., and Hasholt, B. (2014). MODIS observed increase in duration and spatial extent of sediment plumes in Greenland fjords. Cryosphere 8, 1161–1176. doi: 10.5194/tc-8-1161-2014
Johnson, K. S., Chavez, F. P., and Friederich, G. E. (1999). Continental-shelf sediment as a primary source of iron for coastal phytoplankton. Nature 398, 697–700. doi: 10.1038/19511
Johnson, K. S., Gordon, R. M., and Coale, K. H. (1997). What controls dissolved iron in the world ocean? Mar. Chem. 57, 137–161. doi: 10.1016/S0304-4203(97)00043-1
Juul-Pedersen, T., Arendt, K. E., Mortensen, J., Blicher, M. E., Søgaard, D., and Rysgaard, S. (2015). Seasonal and interannual phytoplankton production in a sub-Arctic tidewater outlet glacier fjord, SW Greenland. Mar. Ecol. Prog. Ser. 524, 27–38. doi: 10.3354/meps11174
Kjeldsen, K. K., Mortensen, J., Bendtsen, J., Petersen, D., Lennert, K., and Rysgaard, S. (2014). Ice-dammed lake drainage cools and raises surface salinities in a tidewater outlet glacier fjord, west Greenland. J. Geophys. Res. Surf. 119, 1310–1321. doi: 10.1002/2013JF003034
Kuma, K., Nishioka, J., and Matsunaga, K. (1996). Controls on iron(III) hydroxide solubility in seawater: the influence of pH and natural organic chelators. Limnol. Oceanogr. 41, 396–407. doi: 10.4319/lo.1996.41.3.0396
Laglera, L. M., and van den Berg, C. M. G. (2009). Evidence for geochemical control of iron by humic substances in seawater. Limnol. Oceanogr. 54, 610–619. doi: 10.4319/lo.2009.54.2.0610
Lam, P. J., and Bishop, J. K. B. (2008). The continental margin is a key source of iron to the HNLC North Pacific Ocean. Geophys. Res. Lett. 35:L07608. doi: 10.1029/2008gl033294
Langen, P. L., Mottram, R. H., Christensen, J. H., Boberg, F., Rodehacke, C. B., Stendel, M., et al. (2015). Quantifying energy and mass fluxes controlling Godthåbsfjord freshwater input in a 5-km simulation (1991–2012). J. Clim. 28, 3694–3713. doi: 10.1175/JCLI-D-14-00271.1
Lin, H., Rauschenberg, S., Hexel, C. R., Shaw, T. J., and Twining, B. S. (2011). Free-drifting icebergs as sources of iron to the Weddell Sea. Deep. Res. Part II Top. Stud. Oceanogr. 58, 1392–1406. doi: 10.1016/j.dsr2.2010.11.020
Lippiatt, S. M., Lohan, M. C., and Bruland, K. W. (2010). The distribution of reactive iron in northern Gulf of Alaska coastal waters. Mar. Chem. 121, 187–199. doi: 10.1016/j.marchem.2010.04.007
Mayer, L. M. (1982). Aggregation of colloidal iron during estuarine mixing: kinetics, mechanism and seasonality. Geochim. Cosmochim. Acta 46, 2527–2535. doi: 10.1016/0016-7037(82)90375-1
Meire, L., Sogaard, D. H., Mortensen, J., Meysman, F. J. R., Soetaert, K., Arendt, K. E., et al. (2015). Glacial meltwater and primary production are drivers of strong CO2 uptake in fjord and coastal waters adjacent to the Greenland Ice Sheet. Biogeosciences 12, 2347–2363. doi: 10.5194/bg-12-2347-2015
Mortensen, J., Bendtsen, J., Lennert, K., and Rysgaard, S. (2014). Seasonal variability of the circulation system in a west Greenland tidewater outlet glacier fjord, Godthåbsfjord (64°N). J. Geophys. Res. Earth Surf. 119, 2591–2603. doi: 10.1002/2014JF003267
Mortensen, J., Bendtsen, J., Motyka, R. J., Lennert, K., Truffer, M., Fahnestock, M., et al. (2013). On the seasonal freshwater stratification in the proximity of fast-flowing tidewater outlet glaciers in a sub-Arctic sill fjord. J. Geophys. Res. 118, 1382–1395. doi: 10.1002/jgrc.20134
Mortensen, J., Lennert, K., Bendtsen, J., and Rysgaard, S. (2011). Heat sources for glacial melt in a sub-Arctic fjord (Godthabsfjord) in contact with the Greenland Ice Sheet. J. Geophys. Res. 116. doi: 10.1029/2010jc006528
Murray, C., Markager, S., Stedmon, C. A., Juul-Pedersen, T., Sejr, M. K., and Bruhn, A. (2015). The influence of glacial melt water on bio-optical properties in two contrasting Greenland fjords. Estuar. Coast. Shelf Sci. 163, 72–83. doi: 10.1016/j.ecss.2015.05.041
Nielsdottir, M. C., Moore, C. M., Sanders, R., Hinz, D. J., and Achterberg, E. P. (2009). Iron limitation of the postbloom phytoplankton communities in the Iceland Basin. Global Biogeochem. Cycles 23:GB3001. doi: 10.1029/2008GB003410
Nuwer, J. M., and Keil, R. G. (2005). Sedimentary organic matter geochemistry of Clayoquot Sound, Vancouver Island, British Columbia. Limnol. Oceanogr. 50, 1119–1128. doi: 10.4319/lo.2005.50.4.1119
Obata, H., Karatani, H., and Nakayama, E. (1993). Automated Determination of Iron in seawater by chelating resin concentration and chemiluminescence detection. Anal. Chem. 65, 1524–1528. doi: 10.1021/ac00059a007
Ozturk, M., Steinnes, E., and Sakshaug, E. (2002). Iron speciation in the Trondheim fjord from the perspective of iron limitation for phytoplankton. Estuar. Coast. Shelf Sci. 55, 197–212. doi: 10.1006/ecss.2001.0897
Planquette, H., Sherrell, R. M., Stammerjohn, S., and Field, M. P. (2013). Particulate iron delivery to the water column of the Amundsen Sea, Antarctica. Mar. Chem. 153, 15–30. doi: 10.1016/j.marchem.2013.04.006
Poulton, S. W., and Raiswell, R. (2005). Chemical and physical characteristics of iron oxides in riverine and glacial meltwater sediments. Chem. Geol. 218, 203–221. doi: 10.1016/j.chemgeo.2005.01.007
Powell, R. T., and Wilson-Finelli, A. (2003). Importance of organic Fe complexing ligands in the Mississippi River plume. Estuar. Coast. Shelf Sci. 58, 757–763. doi: 10.1016/S0272-7714(03)00182-3
Raiswell, R. (2011). Iceberg-hosted nanoparticulate Fe in the Southern Ocean: mineralogy, origin, dissolution kinetics and source of bioavailable Fe. Deep. Res. Part II Top. Stud. Oceanogr. 58, 1364–1375. doi: 10.1016/j.dsr2.2010.11.011
Raiswell, R., and Canfield, D. E. (2012). The Iron biogeochemical cycle past and present. Geochemical Perspect. 1, 1–220. doi: 10.7185/geochempersp.1.1
Raiswell, R., Tranter, M., Benning, L. G., Siegert, M., De'ath, R., Huybrechts, P., et al. (2006). Contributions from glacially derived sediment to the global iron (oxyhydr)oxide cycle: implications for iron delivery to the oceans. Geochim. Cosmochim. Acta 70, 2765–2780. doi: 10.1016/j.gca.2005.12.027
Raiswell, R., Vu, H. P., Brinza, L., and Benning, L. G. (2010). The determination of labile Fe in ferrihydrite by ascorbic acid extraction: methodology, dissolution kinetics and loss of solubility with age and de-watering. Chem. Geol. 278, 70–79. doi: 10.1016/j.chemgeo.2010.09.002
Redfield, A. C. (1934). “On the proportions of organic derivations in sea water and their relation to the composition of plankton,” in James Johnstone Memorial Volume, ed R. J. Daniel (Liverpool: University Press of Liverpool), 177–192.
Rudnick, R. L., and Gao, S. (2004). “Composition of the continental crust,” in Treatise on geochemistry: Vol. 3, The Crust, eds H. D. Holland and K. K. Turekian (Amsterdam: Elsevier), 1–65.
Ryan-Keogh, T. J., Macey, A. I., Nielsdottir, M. C., Lucas, M. I., Steigenberger, S. S., Stinchcombe, M. C., et al. (2013). Spatial and temporal development of phytoplankton iron stress in relation to bloom dynamics in the high-latitude North Atlantic Ocean. Limnol. Oceanogr. 58, 533–545. doi: 10.4319/lo.2013.58.2.0533
Rysgaard, S., Mortensen, J., Juul-Pedersen, T., Sørensen, L. L., Lennert, K., Søgaard, D. H., et al. (2012). High air–sea CO2 uptake rates in nearshore and shelf areas of Southern Greenland: temporal and spatial variability. Mar. Chem. 128–129, 26–33. doi: 10.1016/j.marchem.2011.11.002
Rysgaard, S., Vang, T., Stjernholm, M., Rasmussen, B., Windelin, A., and Kiilsholm, S. (2003). Physical conditions, carbon transport, and climate change impacts in a northeast Greenland fjord. Arct. Antarct. Alp. Res. 35, 301–312. doi: 10.1657/1523-0430(2003)035[0301:PCCTAC]2.0.CO;2
Schlitzer, R. (2004). Ocean Data View. Available online at: https://odv.awi.de/
Schroth, A. W., Crusius, J., Campbell, R. W., and Hoyer, I. (2014). Estuarine removal of glacial iron and implications for iron fluxes to the ocean. Geophys. Res. Lett. 41, 3951–3958. doi: 10.1002/2014GL060199
Sejr, M. K., Krause-Jensen, D., Dalsgaard, T., Ruiz-Halpern, S., Duarte, C. M., Middelboe, M., et al. (2014). Seasonal dynamics of autotrophic and heterotrophic plankton metabolism and PCO2 in a subarctic Greenland fjord. Limnol. Oceanogr. 59, 1764–1778. doi: 10.4319/lo.2014.59.5.1764
Severmann, S., McManus, J., Berelson, W. M., and Hammond, D. E. (2010). The continental shelf benthic iron flux and its isotope composition. Geochim. Cosmochim. Acta 74, 3984–4004. doi: 10.1016/j.gca.2010.04.022
Shaw, T. J., Raiswell, R., Hexel, C. R., Vu, H. P., Moore, W. S., Dudgeon, R., et al. (2011). Input, composition, and potential impact of terrigenous material from free-drifting icebergs in the Weddell Sea. Deep. Res. Part II Top. Stud. Oceanogr. 58, 1376–1383. doi: 10.1016/j.dsr2.2010.11.012
Sherrell, R. M., Lagerström, M. E., Forsch, K. O., Stammerjohn, S. E., and Yager, P. L. (2015). Dynamics of dissolved iron and other bioactive trace metals (Mn, Ni, Cu, Zn) in the Amundsen Sea Polynya, Antarctica. Elem. Sci. Anthr. 3:000071. doi: 10.12952/journal.elementa.000071
Sholkovitz, E. R. (1978). The flocculation of dissolved Fe, Mn, Al, Cu, Ni, Co and Cd during estuarine mixing. Earth Planet. Sci. Lett. 41, 77–86. doi: 10.1016/0012-821X(78)90043-2
Sholkovitz, E. R., Boyle, E. A., and Price, N. B. (1978). The removal of dissolved humic acids and iron during estuarine mixing. Earth Planet. Sci. Lett. 40, 130–136. doi: 10.1016/0012-821X(78)90082-1
Smith, R. W., Bianchi, T. S., Allison, M., Savage, C., and Galy, V. (2015). High rates of organic carbon burial in fjord sediments globally. Nat. Geosci. 8, 450–453. doi: 10.1038/ngeo2421
Statham, P. J., Skidmore, M., and Tranter, M. (2008). Inputs of glacially derived dissolved and colloidal iron to the coastal ocean and implications for primary productivity. Global Biogeochem. Cycles 22:GB3013. doi: 10.1029/2007GB003106
Stookey, L. L. (1970). Ferrozine- a new spectrophotometric reagent for iron. Anal. Chem. 42, 779–781. doi: 10.1021/ac60289a016
Straneo, F., and Cenedese, C. (2015). The Dynamics of Greenland's Glacial Fjords and their role in climate. Ann. Rev. Mar. Sci. 7, 89–112. doi: 10.1146/annurev-marine-010213-135133
Tang, K. W., Nielsen, T. G., Munk, P., Mortensen, J., Moller, E. F., Arendt, K. E., et al. (2011). Metazooplankton community structure, feeding rate estimates, and hydrography in a meltwater-influenced Greenlandic fjord. Mar. Ecol. Prog. Ser. 434, 77–90. doi: 10.3354/meps09188
Thuroczy, C.-E., Alderkamp, A.-C., Laan, P., Gerringa, L. J. A., Mills, M. M., Van Dijken, G. L., et al. (2012). Key role of organic complexation of iron in sustaining phytoplankton blooms in the Pine Island and Amundsen Polynyas (Southern Ocean). Deep. Res. Part II Top. Stud. Oceanogr. 71–76, 49–60. doi: 10.1016/j.dsr2.2012.03.009
van Angelen, J. H., Lenaerts, J. T. M., van den Broeke, M. R., Fettweis, X., and van Meijgaard, E. (2013). Rapid loss of firn pore space accelerates 21st century Greenland mass loss. Geophys. Res. Lett. 40, 2109–2113. doi: 10.1002/grl.50490
van As, D., Andersen, M. L., Petersen, D., Fettweis, X., van Angelen, J. H., Lenaerts, J. T. M., et al. (2014). Increasing meltwater discharge from the Nuuk region of the Greenland ice sheet and implications for mass balance (1960–2012). J. Glaciol. 60, 314–322. doi: 10.3189/2014JoG13J065
Vizcaíno, M., Lipscomb, W. H., Sacks, W. J., and van den Broeke, M. (2014). Greenland surface mass balance as simulated by the community earth system model. Part II: Twenty-First-Century Changes. J. Clim. 27, 215–226. doi: 10.1175/JCLI-D-12-00588.1
Wu, J. F., and Boyle, E. (2002). Iron in the Sargasso Sea: implications for the processes controlling dissolved Fe distribution in the ocean. Global Biogeochem. Cycles 16:1086. doi: 10.1029/2001GB001453
Wu, J., and Luther, G. W. III. (1996). Spatial and temporal distribution of iron in the surface water of the northwestern Atlantic Ocean. Geochim. Cosmochim. Acta 60, 2729–2741. doi: 10.1016/0016-7037(96)00135-4
Yde, J. C., Knudsen, N. T., Hasholt, B., and Mikkelsen, A. B. (2014). Meltwater chemistry and solute export from a Greenland Ice Sheet catchment, Watson River, West Greenland. J. Hydrol. 519, 2165–2179. doi: 10.1016/j.jhydrol.2014.10.018
Keywords: glacier, iron, Greenland, meltwater, runoff, icebergs
Citation: Hopwood MJ, Connelly DP, Arendt KE, Juul-Pedersen T, Stinchcombe MC, Meire L, Esposito M and Krishna R (2016) Seasonal Changes in Fe along a Glaciated Greenlandic Fjord. Front. Earth Sci. 4:15. doi: 10.3389/feart.2016.00015
Received: 16 September 2015; Accepted: 08 February 2016;
Published: 01 March 2016.
Edited by:
Cecile Guieu, Centre National de la Recherche Scientifique, FranceReviewed by:
Peter Sedwick, Old Dominion University, USAKristen Nicolle Buck, University of South Florida, USA
Copyright © 2016 Hopwood, Connelly, Arendt, Juul-Pedersen, Stinchcombe, Meire, Esposito and Krishna. This is an open-access article distributed under the terms of the Creative Commons Attribution License (CC BY). The use, distribution or reproduction in other forums is permitted, provided the original author(s) or licensor are credited and that the original publication in this journal is cited, in accordance with accepted academic practice. No use, distribution or reproduction is permitted which does not comply with these terms.
*Correspondence: Douglas P. Connelly, douglas.connelly@noc.ac.uk