Detecting Terrestrial Nutrient Limitation: A Global Meta-Analysis of Foliar Nutrient Concentrations after Fertilization
 Rebecca Ostertag1,2*
  Nicole M. DiManno1,2
- 1Department of Biology, University of Hawaii at Hilo, Hilo, HI, USA
- 2Tropical Conservation Biology and Environmental Science Program, University of Hawaii at Hilo, Hilo, HI, USA
Examining foliar nutrient concentrations after fertilization provides an alternative method for detecting nutrient limitation of ecosystems, which is logistically simpler to measure than biomass change. We present a meta-analysis of response ratios of foliar nitrogen and phosphorus (RRN, RRP) after addition of fertilizer of nitrogen (N), phosphorus (P), or the two elements in combination, in relation to climate, ecosystem type, life form, family, and methodological factors. Results support other meta-analyses using biomass, and demonstrate there is strong evidence for nutrient limitation in natural communities. However, because N fertilization experiments greatly outnumber P fertilization trials, it is difficult to discern the absolute importance of N vs. P vs. co-limitation across ecosystems. Despite these caveats, it is striking that results did not follow “conventional wisdom” that temperate ecosystems are N-limited and tropical ones are P-limited. In addition, the use of ratios of N-to-P rather than response ratios also are a useful index of nutrient limitation, but due to large overlap in values, there are unlikely to be universal cutoff values for delimiting N vs. P limitation. Differences in RRN and RRP were most significant across ecosystem types, plant families, life forms, and between competitive environments, but not across climatic variables.
Introduction
Soil nutrient availability is a factor that defines the structure, function, and dynamics of many terrestrial ecosystems, particularly in those where nutrients are limited. The primary experimental approach used to determine soil nutrient limitation has been fertilization experiments (Tanner et al., 1998; Sullivan et al., 2014). At a species level, and from an evolutionary perspective, fertilization experiments seek to examine the relative importance of intra- and interspecific competition for abiotic resources. At ecosystem and global levels, fertilization experiments confirm biogeographic patterns of nutrient limitation, relating patterns to climate, substrate age, and other physical factors (Crews et al., 1995; Laliberté et al., 2012).
Most fertilization studies focus on plant biomass as the response variable, with increased growth after fertilization defining limitation (Eviner et al., 2000; Sullivan et al., 2014). However, foliar nutrient concentrations are another valuable way to assess nutrient limitation because numerous studies demonstrate that they reflect soil nutrient concentrations at spatial scales of single sites (Shaver and Melillo, 1984; Valentine and Allen, 1990) and across chronosequences, environmental gradients, and ecosystem types (Vitousek, 1998; Han et al., 2005; Parfitt et al., 2005; Townsend et al., 2007; Ordoñez et al., 2009; Cleveland et al., 2011). When foliar nutrients are assessed as one-time measurements it is difficult to use them as evidence of nutrient limitation, because of the tremendous variation among study sites and the lack of universal cutoff values that indicate limitation. However, when foliar nutrients are assessed in relation to a fertilization event, they represent an alternative window on nutrient limitation (Güsewell and Koerselman, 2002; Wardle et al., 2004; Ågren, 2008; Sullivan et al., 2014). It is often easier and faster to collect foliar nutrient data before and after fertilization that it is to measure changes in biomass, plant height, or other size characteristics (Koerselman and Meuleman, 1996).
We present a meta-analysis of the fertilization studies that have measured foliar nutrient concentrations, to develop insights about nutrient limitation. In this review we limit our conclusions to proximate nutrient limitation (sensu Vitousek et al., 2010), in which fertilization is performed to measure the response of a biological process, rather than ultimate nutrient limitation where nutrient addition leads to whole-scale ecosystem change, such as species replacement. Meta-analysis is a tool that allows for detection of broad-scale patterns, not only through the inclusion of multiple studies, but through statistical techniques that account for differences in power and sample size among studies (Rosenberg et al., 2000). Recent examples of meta-analysis have examined plant biomass responses to fertilization (e.g., Elser et al., 2007; Vadeboncoeur, 2010; Harpole et al., 2011) but none to date have taken advantage of the large data sets available on foliar nutrient concentrations. We concentrate on nitrogen (N) and phosphorus (P) because they are the two most limiting nutrients to plants, and large amounts of foliar N and P data exist in the ecological literature. We present data either as: (1) response ratios (ratio of foliar nutrients in fertilized treatment to control treatment) or (2) ratios of nitrogen-to-phosphorus (hereafter N:P). Response ratios are a tractable way to compare nutrient responses, consistent with other meta-analyses on nutrient limitation (Elser et al., 2007). Because the response ratio index is a relative measure, it allows for cross-study comparisons that employ different methodologies and experimental designs (e.g., greenhouse vs. field studies), and additionally it was found to have great capabilities in detecting truly significant effects (Lajeunesse and Forbes, 2003). N:P values are included because foliar N:P appears to be correlated with N:P supply in both aquatic and terrestrial ecosystems and it has been suggested that specific N:P values isolate the type of limitation (i.e., N limitation, P limitation, or co-limitation; Redfield, 1958; Koerselman and Meuleman, 1996; Sterner and Elser, 2002; Tessier and Raynal, 2003; Güsewell, 2004). These ratios are prevalent in stoichiometric theory, which predicts that organisms have ideal proportions of chemical elements based on their metabolic requirements (Elser et al., 1996; Sterner and Elser, 2002; Ågren, 2008), that is consistent among organisms ranging from marine phytoplankton, terrestrial plants, and insect herbivores (Broadley et al., 2004; Güsewell, 2004; Karpinets et al., 2006).
We hypothesize that response ratios will differ in magnitude for N and P, given differences in their plant use and bioavailability. We base our hypothesis on the fact that plants have separate adaptations for maximizing N and P uptake (Wassen et al., 2005; Lambers et al., 2008; Hayes et al., 2014), and on studies that have suggested differential plant use of soil N and P when assimilated into leaf tissue (Güsewell and Koerselman, 2002; Townsend et al., 2007; Ostertag, 2010). Potential explanations could relate to the ability of plants to store P more effectively than N (Ostertag, 2010) or the inability to downregulate P uptake under high P supply. The latter mechanism has been supported by experimentally demonstrating P toxicity after P addition, for species from P-poor environments (Musick, 1978; Shane et al., 2004; Lambers and Shane, 2007; Standish et al., 2007; de Campos et al., 2013). We further hypothesize that any differences in response ratios between the two elements and within a given nutrient can be explained by: (1) climate, ecosystem type, and the competitive environment of the study (whether plants were fertilized as individuals, under intraspecific competition, or under interspecific competition), and (2) variables relating to species characteristics such as life form and family. Understanding the causes of variability in foliar nutrient concentrations is of primary ecological importance because leaf nutrients can predict resource capturing attributes, whole-plant functions, net primary productivity, and rates of nutrient cycling (Wright et al., 2005).
Methods
Studies pertaining to foliar N and P response to fertilization were identified by searching combinations of the following key words: foliar, nitrogen, phosphorus, leaf, litter, fertilization, foliage, and fertilizer, in titles and abstracts using the Biological Abstracts search engine. Articles published up to the year 2011 were included in this meta-analysis. The search procedure resulted in 201 articles that contained relevant data. Only fertilization experiment studies were included (as opposed to natural fertility gradients) and studies needed to report foliar nutrient concentrations under both fertilized and unfertilized (control) conditions. The fertilization studies could have experimentally fertilized with N, P, and/or N and P. We did not classify fertilization methods beyond the nutrient added for several reasons. While we initially wanted to contrast organic vs. inorganic fertilizations, almost all studies added fertilizer in an inorganic form, making a comparison untenable. Studies diverged widely in the rate and timing of application, in ways that were often specifically chosen to complement ecosystem characteristics, but that made it difficult to develop categorical variables across studies. Many studies had multiple dosages of fertilizer applied and we addressed this methodological issue by including only the entries responding to the highest dosage for a given study. Finally, our focus is ecological, so we included studies in natural ecosystems, greenhouses, or forestry studies but excluded cropland studies.
Because fertilization methodology varied considerably, we express the response variables as ratios that describe the nutrient concentration of plants after fertilization divided by the nutrient concentration of unfertilized plants. Utilizing ratios enabled comparisons to be made across a wide range of relevant studies. The ln-transformed response ratio (RR) was calculated for all foliar N and P data using the following equations:
A summary of relevant information from each publication was entered into an Excel sheet. Foliar N and P concentrations of the control and treatments were entered either on a mass (mg/g) or area (mg/m2) basis, yet the sample size of values entered by area was too small to analyze. Bytescout Graph Digitizer Scout 1.2.4 was used to identify foliar N and P concentrations when presented in graphical form within the publications.
Appendices A, B in Supplementary Material provides the variables by which the ln of foliar N and foliar P were analyzed. Ecosystem type was determined based on what was described by authors in their site descriptions, or if that was unavailable we used prior knowledge based on latitude and geography to assign an ecosystem class. Forest was considered tropical if it fell in between 23.5°N and S and Arctic Tundra was designated if the site was at ≥66°N; dry forest was defined as <1000 mm mean annual precipitation (MAP) and wet forest as >2500 mm MAP. Other descriptors such as montane and alpine were determined based on topographic position. In addition to ecosystem type we analyzed abiotic factors, temperature and precipitation, as well as organism categorizations, family and life form. Lastly, we only included field fertilization studies but noted the neighborhood in which plants were fertilized. Fertilization could have occurred on individual plants, or on multi-individual monocultures (subject to intraspecific competition) or on mixtures (interspecific competition on a plot level).
One common feature of data used for meta-analyses is that studies differ in their sampling effort and taking not only the mean but also sample sizes and variance into consideration has been recommended (Gurevitch and Hedges, 2001). We did this using MetaWin v. 2 (Rosenberg et al., 2000). We first calculated effect sizes (i.e., response ratios) with corresponding variances and then determined significance based on the Qbetween term. We used a random effects model which is considered more appropriate for ecological studies (Adams et al., 1997). The model consisted of 5000 resampling tests. Data are presented as means and 95% confidence intervals. Metawin analysis provides a P-value for each test conducted, yet mean comparisons output is not provided. Therefore, we inferred significant differences between the categories analyzed based on non-overlapping 95% confidence intervals. We evaluated the problem of publication bias (not publishing negative results as frequently) with the Rosenthal's fail-safe test. Using an alpha value of 0.05 the Rosenthal test tells you the number of values that would need to be added to the analysis to change the significance of the results (Rosenthal, 1979). We also used t-tests to evaluate whether means of the response ratios were significantly different from zero.
Control and fertilized N:P ratios were calculated for the entire dataset as well as across ecosystems, families, and life forms. Generally speaking, sample sizes were smaller for these analyses in comparison to the Metawin approach because the dataset used only studies that included both foliar N and P responses to fertilization (Appendices A, B in Supplementary Material). The percent change in N:P following fertilization was calculated as
Results
Overall Patterns
Across all studies, fertilization with a specific nutrient elicited an increase in foliar concentration of that nutrient. A positive N response occurred after N or NP fertilization (e.g., RRN significantly > 0), and similarly, a positive P response (RRP significantly > 0) occurred after fertilization with P or NP (Table 1; Figure 1A). We also investigated whether the magnitude of each response ratio differed from one another due to the three different types of fertilizations. We found RRN > RRP with the addition of N and RRP > RRN with the addition of P, but these response ratios were not different from one another when both nutrients were added together (Table 2).
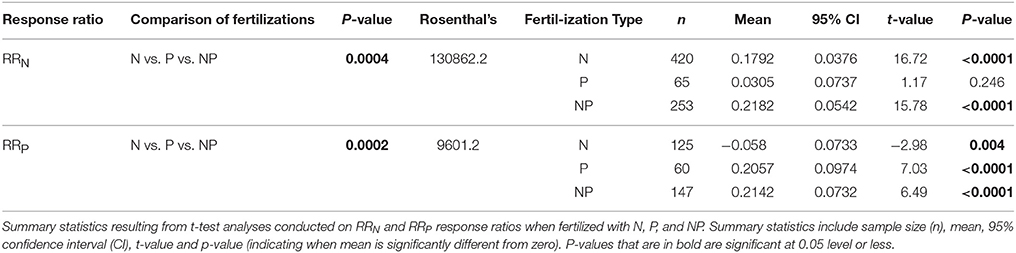
Table 1. Summary statistics, including P-value, and Rosenthal's fail safe test value, resulting from MetaWin analyses conducted for RRN and RRP response ratios with comparisons between nitrogen (N), phosphorus (P), and nitrogen and phosphorus (NP) fertilizations.
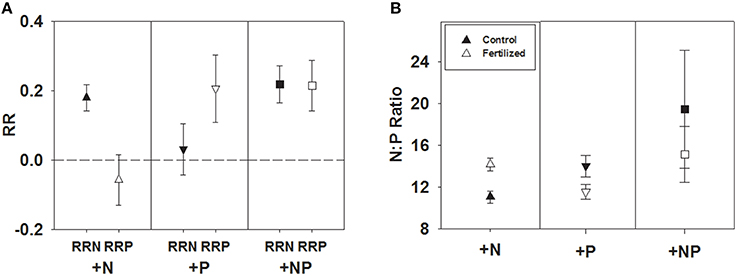
Figure 1. Symbols illustrate mean ± 95 CI differences between RRN and RRP response ratios when fertilized with +N, +P, and +NP (A), or N:P, mean ± 95 CI, differences between control and fertilized (+N, +P, +NP) treatments (B).
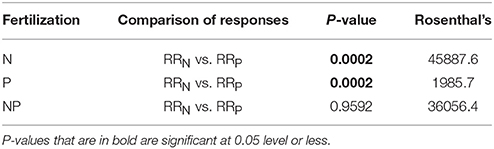
Table 2. Summary statistics, including P-value, and Rosenthal's fail safe test value, resulting from MetaWin analyses conducted for comparisons between RRN and RRP response ratios when fertilized with nitrogen (N), phosphorus (P), and nitrogen and phosphorus (NP).
An alternative way of examining the data is to compare N:P ratios before and after fertilization (+N, +P and +NP). We found N:P ratios to increase significantly after N fertilization [t(79) = 7.94, P < 0.0001] and decrease significantly after P fertilization [t(49) = −3.81, P < 0.0004], while no difference in N:P ratios resulted from NP fertilization [t(127) = −1.38, P = 0.1705; Figure 1B].
Climate, Ecosystems, and Competitive Environment
Surprisingly, the two climate variables, temperature and precipitation, were not good predictors of RRN or RRP. In some cases there were significant effects, yet the R2 values were too low to suggest strong relationships (Appendices A and B in the Supplementary Material). Thus, we are unable to draw conclusions of N or P limitation based on precipitation or temperature.
RRN > 0 was seen in 12 of 14 ecosystems fertilized with N and 8 of 15 ecosystems fertilized with NP. Ecosystem responses differed significantly with non-forested wetland showing the largest response and temperate coniferous forest showing the smallest response to both fertilization treatments (Figures 2A,C; Table 3). N fertilization resulted in 2 of 13 ecosystems (non-forested wetland and temperate coniferous forest) showing a negative RRP response, indicating a nutrient interaction effect, with no difference between the ecosystems (Figures 2B,D; Table 3).
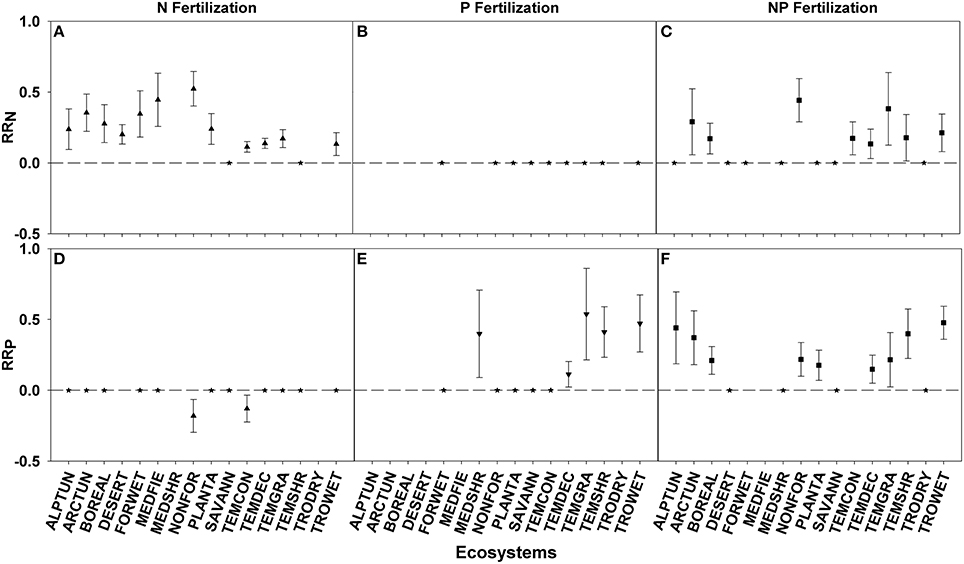
Figure 2. Symbols illustrate RRN, means ± 95 confidence interval (CI), across ecosystems with nitrogen (N), phosphorus (P), and nitrogen and phosphorus (NP) fertilizations (A–C respectively), or RRP, means ± 95 confidence interval (CI), across ecosystems with nitrogen (N), phosphorus (P), and nitrogen and phosphorus (NP) fertilizations (D–F respectively). Ecosystems abbreviations used were: ALPTUN, (Alpine Tundra); ARCTUN, (Arctic Tundra); BOREAL, (Boreal Forest); DESERT, (Desert); FORWET, (Forested Wetland); MEDFIE, (Mediterranean Field); MEDSHR, (Mediterranean Shrubland); NONFOR, (Non-forested Wetland); PLANTA, (Plantation); SAVANN, (Savanna); TEMCON, (Temperate Coniferous); TEMDEC, (Temperate Deciduous); TEMGRA, (Temperate Grassland); TEMSHR, (Temperate Shrubland); TRODRY, (Tropical Dry Forest); and TROWET, (Tropical Wet Forest). Asterisks represent RR values that are not significantly different from zero.
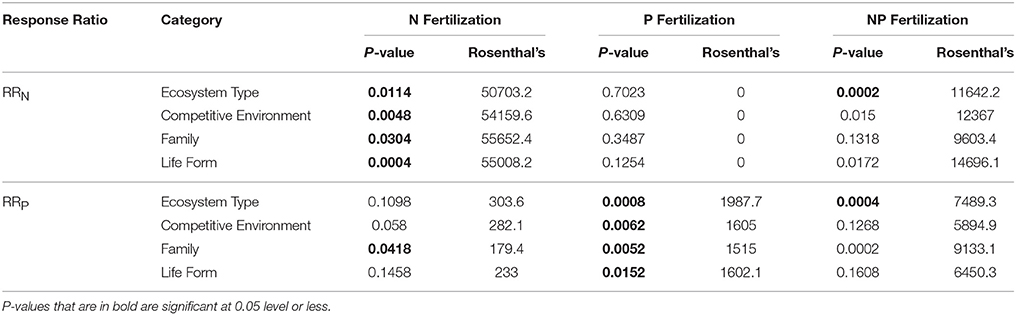
Table 3. Summary statistics, including P-value, and Rosenthal's fail safe test value, resulting from MetaWin analyses conducted for RRN and RRP response ratios when fertilized with nitrogen (N), phosphorus (P), and nitrogen and phosphorus (NP) across categories: ecosystem type, competitive environment, family, and life form.
RRP > 0 was seen in 5 of 10 ecosystems fertilized with P and 9 of 13 ecosystems fertilized with NP. Ecosystem responses differed significantly with temperate grassland and tropical montane wet forest showing the largest response for the P and NP fertilization treatments, respectively, while temperate deciduous forest showed the smallest response for both treatments (Figures 2E,F; Table 3).
Competitive environment influenced the foliar nutrient response. Plants fertilized as individuals had a larger RRN after N or NP fertilization response than those planted in interspecific or intraspecific combinations (Figures 3A–C; Table 3). For RRP plants in intraspecific combinations after P fertilization had the largest responses (Figures 3D,E; Table 3). There was no significant difference in RRP between the competitive environments when fertilization with NP was conducted (Figure 3F; Table 3).
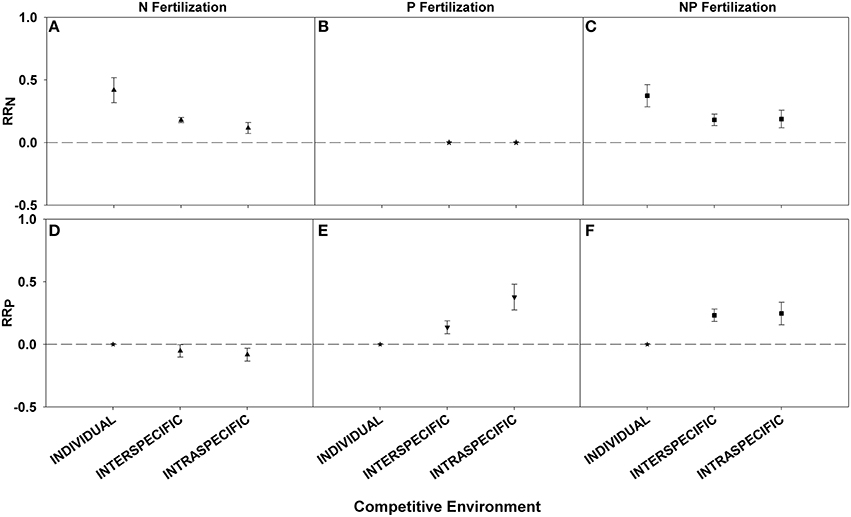
Figure 3. Symbols illustrate RRN, means ± 95 confidence interval (CI), across competitive environments: individual, interspecific, and intraspecific, with nitrogen (N), phosphorus (P), and nitrogen and phosphorus (NP) fertilizations (A–C respectively), or RRP, means ± 95 confidence interval (CI), across competitive environments: individual, interspecific, and intraspecific, with nitrogen (N), phosphorus (P), and nitrogen and phosphorus (NP) fertilizations (D–F respectively). Asterisks represent RR values that are not significantly different from zero.
Family and Life Forms
RRN increases were seen in 14 of 33 families fertilized with N, one of 12 fertilized with P, and four of 26 fertilized with NP. Significant differences in RRN were found between the families with Ericaceae, Cyperaceae, and Ginkgoaceae showing the greatest responses to N fertilization (Figure 4A; Table 3). Poaceae was the only family that resulted in a positive RRN response when fertilized with P (Figure 4B; Table 3), indicating a nutrient interaction for this family. Significant differences of RRN were not found among the four families (i.e., Ericaceae, Poaceae, Myrtaceae, and Pinaceae) that showed positive responses to NP fertilization (Figure 4C; Table 3).
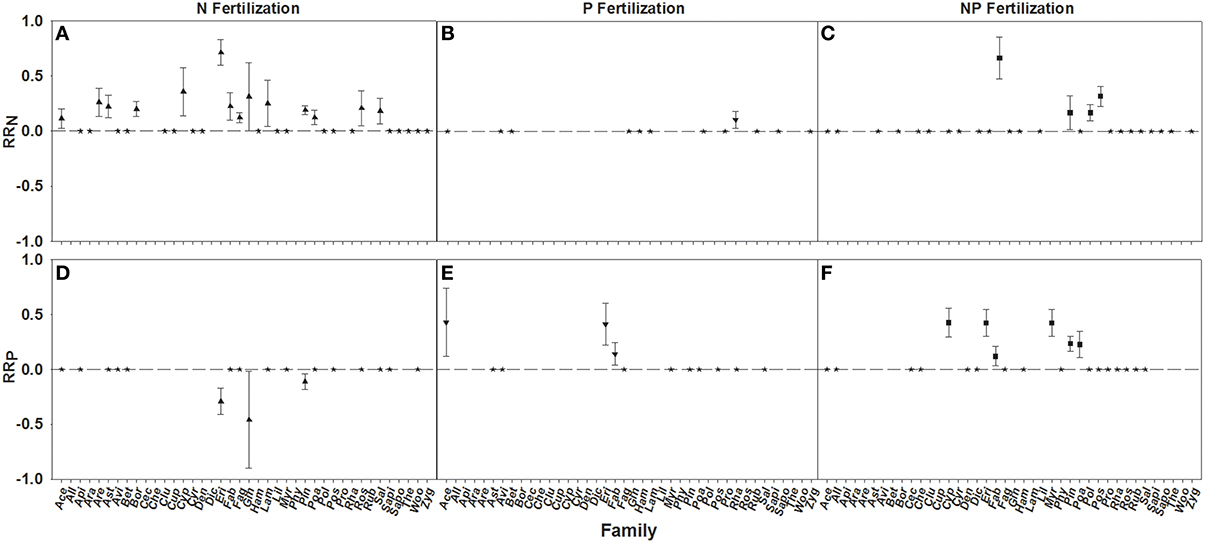
Figure 4. Symbols illustrate RRN, means ± 95 confidence interval (CI), across familes, with nitrogen (N), phosphorus (P), and nitrogen and phosphorus (NP) fertilizations (A–C respectively), or RRP, means ± 95 confidence interval (CI), across families, with nitrogen (N), phosphorus (P), and nitrogen and phosphorus (NP) fertilizations (D–F respectively). Family abbreviations used were: Ace, (Aceraceae); All, (Alliaceae); Api, (Apiaceae); Ara, (Araceae); Are, (Arecaceae); Ast, (Asteraceae); Avi, (Avicenniaceae); Bet, (Betulaceae); Bor, (Boraginaceae); Cec, (Cecropiaceae); Che, (Chenopodiaceae); Clu, (Clusiaceae); Cup, (Cupressaceae); Cyp, (Cyperaceae); Cyr, (Cyrillaceae); Den, (Dennstaedtiaceae); Dic, (Dicksoniaceae); Eri, (Ericaceae); FAB, (Fabaceae); Fag, (Fagaceae); Gin, (Ginkgoaceae); Ham, (Hamamelidaceae); Lam, (Lamiaceae); Lil, (Liliaceae); Myr, (Myrtaceae); Phy, (Phytolaccaceae); Pin, (Pinaceae); Poa, (Poaceae); Pol, (Polygonaceae); Pos, (Posidoniaceae); Pro, (Proteaceae); Rha, (Rhamnaceae); ROS, (Rosaceae); RUB, (Rubiaceae); SAL, (Salicaceae); Sapi, (Sapindaceae); Sapo, (Sapotaceae); The, (Theaceae); Woo, (Woodsiaceae); and Zyg, (Zygophyllaceae). Asterisks represent RR values that are not significantly different from zero.
A positive RRP response to P and NP fertilization was found for three of 12 families fertilized with P and six of 22 families fertilized by NP. RRP response of Ericaceae was found to be greater after P fertilization than Fabaceae, while the response of Cyperaceae, Ericaceae, and Myrtaceae were found to be greater than Fabaceae after NP fertilization (Figures 4E,F; Table 3). An interaction effect was evidenced by negative RRP responses to N fertilization for 3 out of 18 families, suggesting an interaction effect. Across these three families Ericaceae had a significantly greater RRP response than Pinaceae (Figure 4D; Table 3).
All life forms except ferns demonstrated positive responses to N fertilization, with shrubs showing the greatest RRN response (Figures 5A,C; Table 3). An interaction effect was found for graminoids which showed a positive RRN response to P fertilization (Figure 5B; Table 3). Positive fertilization responses were found for shrubs and trees when fertilized with P and for all life forms except ferns when fertilized with NP (Figures 5E,F; Table 3). Shrubs had the greatest RRP response to P fertilization. Yet, no significant differences in RRP response were found between life forms fertilized with NP. An interaction effect was noted for forbs, shrubs, and trees because of the negative RRP response to N fertilization (Figure 5D; Table 3).
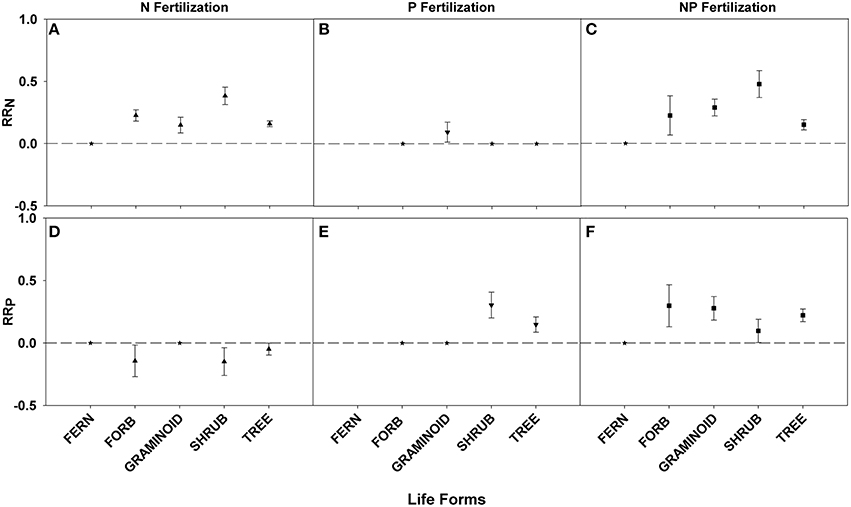
Figure 5. Symbols illustrate RRN, means ± 95 confidence interval (CI), across life forms: fern, forb, graminoid, shrub, and tree, with nitrogen (N), phosphorus (P), and nitrogen and phosphorus (NP) fertilizations (A–C respectively). Symbols illustrate RRP, means ± 95 confidence interval (CI), across life forms: fern, forb, graminoid, shrub, and tree, with nitrogen (N), phosphorus (P), and nitrogen and phosphorus (NP) fertilizations (D–F respectively). Asterisks represent RR values that are not significantly different from zero.
Ratios of N:P as an Alternative Indicator
N:P ratios, a common tool used to infer nutrient limitation, were compared across ecosystems, families, and life forms in order to assess whether we can infer N or P limitation based on shifts in N:P ratio following fertilization (Figures 6, 7, see Appendix C in Supplementary Material for sample sizes). For instance, a significantly greater N:P ratio when fertilized with N or NP compared to the control suggests N limitation. Similarly, a smaller N:P ratio when fertilized with P or NP compared to the control could indicate P-limitation.
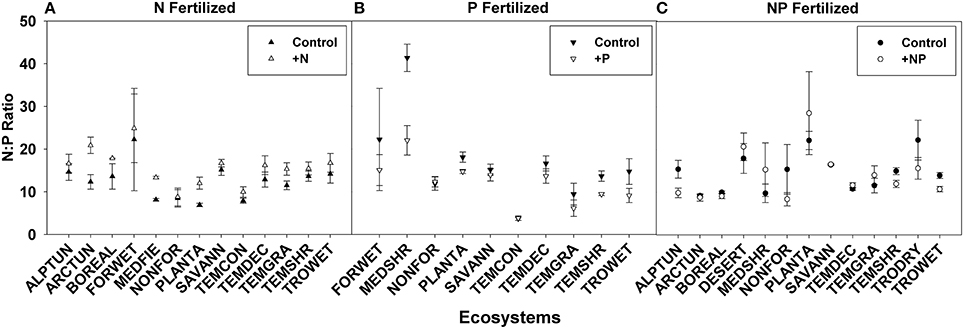
Figure 6. Symbols illustrate N:P ratio, mean ± 95 CI, differences between control and fertilized (+N, +P, +NP) treatments (A–C respectively) across ecosystems. Ecosystem abbreviations used were: ALPTUN, (Alpine Tundra); ARCTUN, (Arctic Tundra); BOREAL, (Boreal Forest); DESERT, (Desert); FORWET, (Forested Wetland); MEDFIE, (Mediterranean Field); MEDSHR, (Mediterranean Shrubland); NONFOR, (Non-forested Wetland); PLANTA, (Plantation); SAVANN, (Savanna); TEMCON, (Temperate Coniferous); TEMDEC, (Temperate Deciduous); TEMGRA, (Temperate Grassland); TEMSHR, (Temperate Shrubland); TRODRY, (Tropical Dry Forest); TROWET, (Tropical Wet Forest).
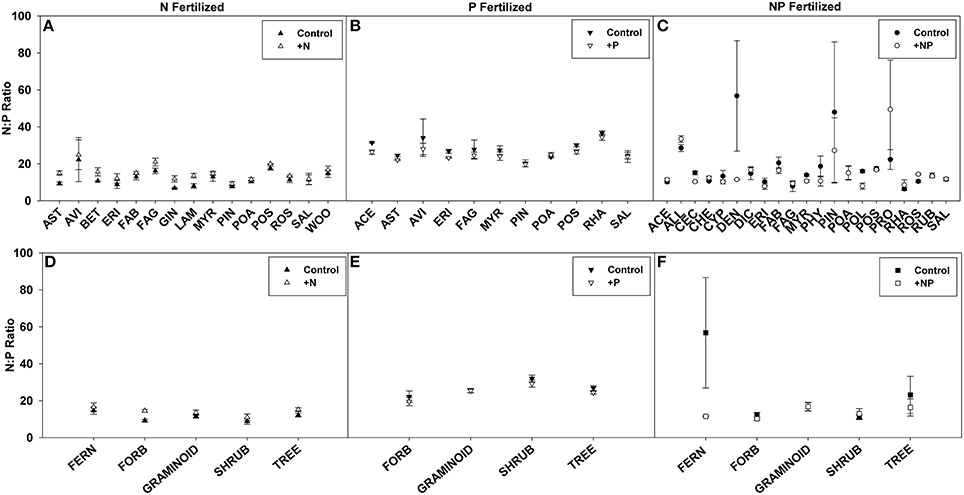
Figure 7. Symbols illustrate N:P ratio, mean ± 95 CI, differences between control and fertilized (+N, +P, +NP) treatments (A–C respectively) across families. Family abbreviations used were: ACE, (Aceraceae); ALL, (Alliaceae); AST, (Asteraceae); AVI, (Avicenniaceae); BET, (Betulaceae); CEC, (Cecropiaceae); CHE, (Chenopodiaceae); CYP, (Cyperaceae); DEN, (Dennstaedtiaceae); DIC, (Dicksoniaceae); ERI, (Ericaceae); FAB, (Fabaceae); FAG, (Fagaceae); GIN, (Ginkgoaceae); LAM, (Lamiaceae); MYR, (Myrtaceae); PHY, (Phytolaccaceae); PIN, (Pinaceae); POA, (Poaceae); POL, (Polygonaceae); POS, (Posidoniaceae); PRO, (Proteaceae); RHA, (Rhamnaceae); ROS, (Rosaceae); RUB, (Rubiaceae); SAL, (Salicaceae); and WOO, (Woodsiaceae). Symbols illustrate N:P ratio, mean ± 95 CI, differences between control and fertilized (+N, +P, +NP) treatments (D–F respectively) across life forms: fern, forb, graminoid, shrub, and tree.
Using these criteria, we found suggestions of N-limitation for five of the 13 ecosystems, five of the 15 families, and two of the five life forms fertilized with N. Similarly, we found suggestions of P-limitation for four of the 10 ecosystems, four of the 10 families, and one of the four life forms fertilized with P. After NP fertilization we found that the majority of changes across ecosystems, families, and life forms were driven by P concentrations, due to the significant decreases rather than increases in N:P ratios (Figures 6, 7).
Publication Bias and Rosenthal's Value
Rosenthal's fail-safe test provides the number of values that would need to be added to the analysis to change the significance of the results, and therefore serves as a measure of publication bias. Large Rosenthal values provided for the entire dataset analyses indicate low probability of publication bias; all of our values (see Tables 1, 2) were larger than the suggested cutoff of 5N +10, where N = number of cases (Rosenberg et al., 2000). It should be noted though that Rosenthal's values were much lower for RRN responses to P fertilizations and RRP responses to N fertilizations (Table 3), a likely publication bias because very few P fertilization studies measure N concentrations (see Appendices A, B in Supplementary Material for sample sizes). See Appendix D in Supplementary Material for a list of studies used in the meta-analysis.
Discussion
Detecting Nutrient Limitation and the Stoichiometry of N and P
Regardless of whether response ratios (RRN or RRP) or N:P values are considered (Figures 1A–D), there is strong evidence for N and P limitation in natural communities. Our results mirror those of Elser et al. (2007), who conducted similar types of analyses on nutrient enrichment across terrestrial, freshwater, and marine ecosystems, but who used biomass as a response variable. The consistency among the response variables is remarkable, given that foliar nutrient concentrations vary for many reasons not analyzed in this study (e.g., with laboratory methods, age of leaves, canopy position, seasonality, study duration, fertilization dosage, and type). Not only are foliar nutrients logistically simpler than measuring plant growth rates, but in the absence of nutrient supplementation experiments, foliar nutrient analysis will provide a relative assessment of nutrient status (Tanner et al., 1998).
Contrary to our predictions, but in agreement with Elser et al. (2007), single nutrient additions of N and P when compiled across many studies were approximately equivalent in response (i.e., RRN after +N addition and RRP after +P addition, Figure 1). There are many examples in individual studies, within a single ecosystem or biome, that suggest that P concentrations are inherently greater in magnitude and more variable than foliar N concentrations (Güsewell and Koerselman, 2002; Campo and Dirzo, 2003; Güsewell, 2004, 2005; Townsend et al., 2007; Ågren, 2008; Ostertag, 2010; Mayor et al., 2014). In the global aggregate however, this meta-analysis supports the tight stoichiometric coupling of N and P across ecosystems, taxa, and life forms.
The fact that N and P varied about the same order of magnitude in response to fertilization also suggests that N:P can be a useful index of nutrient limitation. We saw a general pattern that with N fertilization N:P values increased (also seen in a meta-analysis by Sardans et al., 2012), and with P fertilization N:P decreased. Indeed, leaf N:P values have been widely adopted in the literature as indications of N or P limitation (Güsewell and Koerselman, 2002; Townsend et al., 2007; Ågren, 2008). Initial work identified values <14 as indicative of N-limitation and >16 as indicative of P limitation (Koerselman and Meuleman, 1996). In the ecosystems surveyed here in which RRN indicated N limitation, N:P values ranged from 3.8 to 19.3 (mean = 10.5) and for those in which RRP indicated P limitation, N:P values ranged from 9.2 to 17.7 (mean = 13.0). Given the large range, we agree with others that have pointed out that the ratios provide useful information when used in a comparative context, but there are unlikely to be universal cutoff values that determine the type of nutrient limitation (Tessier and Raynal, 2003; Drenovsky and Richards, 2004; McGroddy et al., 2004; Soudzilovskaia et al., 2005; Townsend et al., 2007; He et al., 2008). Ratios of N:P vary with more than just soil nutrient availability; for instance, values can be influenced by species and phylogeny (Townsend et al., 2007), seasonality (Townsend et al., 2007; Rivas-Ubach et al., 2012), environmental stress (Rivas-Ubach et al., 2012), and tissue type and age (Schreeg et al., 2014). Thus, we strongly suggest that determining a cut-off value to indicate N or P limitation should be a site-specific endeavor.
Under +NP fertilization, examination of foliar nutrients did not yield a synergistic nutrient response, unlike meta-analyses that focused on biomass production (Elser et al., 2007; Harpole et al., 2011). New growth causing a dilution of nutrient concentrations is the most logical explanation for our results (Jarrell and Beverly, 1981). In addition, the timing of sample collection relative to fertilization events may be important, as foliar nutrient changes may be shorter-lived or occur before growth responses, making them difficult to detect. For example, in the Alaskan tundra, Shaver and Chapin (1995) demonstrated that growth responses could occur a year after fertilization; in spruce and pine stands a single fertilization can affect conifer growth for 7–10 years (Pettersson and Högbom, 2004). The timing of the foliar nutrient increases after fertilization in relation to growth responses is generally unknown. More mechanistic studies are required to determine the level of decoupling of foliar nutrient concentration and growth responses under a wide range of environmental conditions.
This meta-analysis contains hints of multiple elemental limitations, which deserves much more intense study through experimentation, given that it may be common in terrestrial ecosystems (Vitousek et al., 2010; Harpole et al., 2011; Wright et al., 2011). A consistent result across the entire data set was the interaction between N and P (Figure 1); fertilizing with N decreases RRP by about 130% and fertilizing with P decreases RRN by about 80%. Similar patterns were noted across ecosystems, families, and life forms, particularly for the decrease in RRP with +N. Why do we see this asymmetry?
In the case of N fertilization affecting foliar P levels, several studies demonstrate that N fertilization increases phosphatase enzyme activity within ecosystems (Treseder and Vitousek, 2001; Wang et al., 2007), for both plant and soil phosphatases (Marklein and Houlton, 2012). The additional N plants receive via fertilization may therefore be allocated to phosphatase activity, enhancing P uptake, which in theory should lead to increased foliar P concentrations. This result was seen in a regional study in the northeastern US, where higher foliar P concentrations were noted in areas with higher N deposition rates (Crowley et al., 2012). Allocation to mycorrhizae may be an alternative or synergistic mechanism; for example, nitrogen-fixing trees in lowland wet tropical forests in Costa Rica had greater phosphatase enzyme activity and greater arbuscular mycorrhizal colonization than non-fixers (Nasto et al., 2014). However, a contrasting hypothesis better fits the data from this meta-analysis: that additional N inputs push a system closer to N saturation, shifting the balance toward P limitation, perhaps because the accompanying soil acidification slows P mineralization (Harrison, 1982), or because there is less effective P uptake via negative effects of fertilization on root biomass, length, and/or mycorrhizal activity and diversity (Ostertag, 2001; Treseder, 2004; Porras-Alfaro et al., 2007). It is also important to note that the additional N does not quantitatively add new P molecules to the ecosystem, but only changes the cycling rates (Vitousek et al., 2010).
In the case of P fertilization affecting foliar N levels, Vitousek et al. (2010) suggested that fertilizing with P can actually quantitatively increase the amount of N in an ecosystem, due to the stimulation of N-fixation by N-fixing plants and microbes. Evidence for this hypothesis comes from greater N-fixation rates in P-fertilized plots in a tallgrass prairie (Reed et al., 2007); in theory, N-fixing plants should have higher foliar N concentrations. While this mechanism is plausible, it seems unlikely to explain our results. First, the response is in the wrong direction because in our meta-analysis, there is a decline in RRN relative to RRP. Second, many of the studies analyzed in this meta-analysis did not feature N-fixing plant species, although the possibility of free-living N-fixers in the soil being stimulated by the external P inputs cannot be ruled out (Reed et al., 2011). What seems plausible to explain the meta-analysis results is that P fertilization is shifting ecosystems toward N limitation; Vitousek et al. (2010) outlines this possibility in P-fertilized ecosystems or those where atmospheric dust containing P is transferred long distances.
Trends in RRN and RRP across Climatic Gradients and Ecosystems
Surprisingly, there were not strong patterns in RRN and RRP across global climate gradients of mean annual temperature and precipitation. We expected to find increasing RRN and RRP with increasing temperatures based on studies that have shown foliar N and P to decrease with increasing temperatures (McGroddy et al., 2004; Reich and Oleksyn, 2004; Han et al., 2005; Sardans et al., 2011). Furthermore, we expected to find increasing response ratios, especially RRP, with increasing levels of precipitation based on a global meta-analysis that found P availability in soil to decrease with increasing precipitation (Ordoñez et al., 2009). At a smaller scale, foliar P was correlated with mean annual precipitation gradient (350–1400 mm) across >3500 plots representing the Mediterranean ecosystems of NE Spain (Sardans et al., 2011). We may not have found a strong trend across these climatic variables due to confounding factors, such as community composition, substrate, and altitude. For example, similar to our results, Alvarez-Clare and Mack (2011) found in wet tropical forests that mean annual precipitation was not correlated with foliar N or P. The abundance of legumes was suggested as a confounding factor because the legume abundance varied across their rainfall gradient (3500–5500 mm). In addition, this meta-analysis may differ from temperature and rainfall gradient studies for two important reasons: (1) we assessed changes in foliar concentrations following fertilization rather than solely trends in foliar quality across climatic gradients, and (2) our study included a wider range of mean annual temperature and precipitation values than other literature (−13.7–32.0°C and 102–7800 mm).
In contrast, comparisons of foliar nutrient responses across ecosystem categories suggest nutrient limitations. Two previous meta-analyses focusing on N limitation are in agreement with our results, although both of these focused on ANPP and not foliar nutrient concentrations. LeBauer and Treseder (2008) showed that across all studies there was no correlation between ANPP response ratio and latitude, MAP, or MAT, but they did find that N limitation was evident in temperate forest, tropical forest, temperate grassland, tropical grassland, wetlands, and tundra, which agree fully with our results (Appendix A in Supplementary Material). In addition, Yahdjian et al. (2011) focused more intensively on arid-subhumid ecosystems (MAP/PET ratio from 0.05 to 0.75), which they argued have been under-sampled in the two other main meta-analyses (Elser et al., 2007; LeBauer and Treseder, 2008). They found that ANPP after N fertilization increased by 50% across all studies; we found that deserts responded positively to N fertilization. It is therefore encouraging that all studies converge on the same conclusions despite using different response variables. It is also encouraging that their analyses found that the effect of N-application rate, and duration of time from fertilization to field measurement (LeBauer and Treseder, 2008), and the form of fertilizer applied (LeBauer and Treseder, 2008; Yahdjian et al., 2011) did not significantly influence the growth response. These results provide reassurance that fertilizer studies can be compared, despite differences in methodology.
Because N fertilization experiments greatly outnumber P fertilization trials, it is difficult to discern the absolute importance of N vs. P vs. co-limitation across ecosystems. In addition, as pointed out by Sullivan et al. (2014), fertilization experiments are more common in ecosystems with short-statured plants, such as grassland, shrubland, and tundra. While our data set does have a considerable number of forest studies (see Appendices A, B in Supplementary Material for sample sizes), the sample sizes are quite unequal among ecosystems. Despite these caveats, it is striking that our results did not follow “conventional wisdom” that temperate ecosystems are N-limited and tropical ones are P-limited, a conclusion based on soil age, weathering processes, and litterfall patterns (Walker and Syers, 1976; Vitousek, 1984; McGroddy et al., 2004). If we assume that foliar response can detect nutrient limitation, then alpine tundra, Arctic tundra, boreal forests, non-forested wetlands, plantations, temperature coniferous forest, temperate deciduous forest, temperate grasslands, and tropical wet forest were all both N-limited and NP co-limited. Furthermore, temperate deciduous forest, temperate grasslands, temperature shrublands and tropical wet forest showed patterns of being both P-limited and NP co-limited. These results agree with other recent studies that have found co-limitation to occur in temperate (Niinemets and Kalevi, 2005; Vadeboncoeur, 2010) and tropical (Wullaert et al., 2010) ecosystems. P-limitation or co-limitation in temperate systems might occur because: (1) until recently P limitations have not been investigated as rigorously as N limitations in the temperate systems (Vadeboncoeur, 2010), and (2) increased N deposition and its physiological consequences are shifting the nature and extent of nutrient limitations (Von Oheimb et al., 2010). Similarly, some tropical forests have been found to have N-limitation due to substrate age and type that does not fit the norm for tropical systems (Domingues et al., 2010). This study and two others (Elser et al., 2007; LeBauer and Treseder, 2008) all demonstrate that there does not appear to be a consistent latitudinal trend in nutrient limitation. We argue that a broader mindset needs to be employed when considering nutrient limitation, taking into account that many factors beyond soil age and climate. Some of these factors are: soil alkalinity (Drenovsky and Richards, 2005), fire (Sardans et al., 2006; Stock and Verboom, 2012), flooding (Day, 1987; Feller et al., 2007), size class (Alvarez-Clare et al., 2013), species and phylogeny (Alvarez-Clare et al., 2013), and anthropogenic disturbance (Gariola et al., 2009).
Influences of Taxonomy and Attributes of Experimental Design on RRN and RRP
It is important to note that this study cannot make definitive conclusions about the relative importance of N and P limitation for these families, because of the paucity of fully reciprocal fertilization experiments. In addition, key families such as the Proteaceae, known to thrive under low nutrient conditions (Witkowski, 1990; Lambers and Shane, 2007; Stock and Verboom, 2012) and to have adaptations for efficient P use (de Campos et al., 2013), could not be included due to low sample sizes (i.e., not enough fertilization experiments). However, some interesting phylogenetic patterns were observed. Families that demonstrated nutrient limitation were often those that are dominants in nutrient-poor ecosystems. For example, Ericaceae is able to thrive on acidic and infertile soils due to special root mycorrizhal associations with fungi that maximize its uptake of nutrients (Lambers et al., 2008), and in this study the family was suggested to be N-, P-, and co-limited. Cyperaceae also has specialized root adaptations for low P soils (Lambers et al., 2008) and is common in many herbaceous communities; it was likely to be N- and co-limited. Two notable ectomycorrhizal families were Pinaceae, abundant in temperate coniferous and boreal forests and Fagaceae, often found on low-nutrient soils associated with temperate forests, Mediterranean shrublands, and tropical montane forests (Manos and Stanford, 2001). Finally, Fabaceae responded to fertilization with P and NP; as many species are nitrogen-fixing, the N added to soils from these species could be influencing the rates of P cycling (Vitousek et al., 2010).
Differences among life forms were also noted. A meta-analysis of foliar nutrient concentrations conducted on 753 Chinese species found N and P concentrations to be higher in herbs than woody plants (Han et al., 2005). The difference was explained by opposite growth form strategies, in which herbs are short-lived and fast-growing thus cycling nutrients at a faster rate than the longer-lived slow-growing woody species. Our meta-analysis suggested co-limitation for herbs, graminoids, shrubs, and trees but the significant differences in responses between life forms are difficult to decipher. The lack of clear patterns across the different life forms is most likely due to interactions with the families and ecosystems in which they exist.
We conducted an analysis across competitive environments in order to assess if this detail of experimental design might influence the magnitude of nutrient response. We found greater RRN for plants fertilized individually, rather than for plants with other individuals and thus undergoing inter- or intra-specific competition. These results were expected because growing a plant individually removes competition, thus allowing that plant greater access to the nutrients provided. The small pool of P data available for plants fertilized individually made it difficult to draw conclusions on this category, but we would have expected RRP to follow the same pattern seen in RRN. There was no difference between combinations of plants for RRN, yet for RRP the response was greater when plants were fertilized in intra-specific combinations than inter-specific combinations. However, based on niche partitioning theory we would have expected the opposite result: mixtures of species would have greater nutrient levels because of access to different nutrient pools via mechanisms such as rooting depth (Reynolds et al., 2003; Rennenberg and Schmidt, 2010). Evidence for this complementarity mechanism is readily available in the forestry literature comparing monocultures and polycultures (Oelmann et al., 2010; Richards and Schmidt, 2010). A larger sample size and more equal sampling among categories are required to make definitive conclusions.
Sample Size and Publication Bias
Historically, N has been a nutrient well studied in terrestrial systems. It has not been until recent years that the importance of P limitation for these ecosystems has become documented and that more studies have begun to examine the ecology surrounding P. This is evident in the much smaller sample sizes for RRP found in our dataset. Unfortunately, this made it impossible to make some cross-comparisons between categories for RRN and RRP. In assessing the Rosenthal's values across the different categorical analyses we found the power of our results weakened by poor sample size for RRN with +P and to a lesser extent RRP with +N (Table 3). Uneven sample sizes are also evident across ecosystems and this has a cascading effect on other categories such as families and life forms. For instance, temperate coniferous and deciduous forests have 3-10- fold greater sample sizes than the other ecosystems, Pinaceae and Fagaceae were very well represented, and contributed to the number of trees being 3-80-fold greater than the other life forms.
Conclusions
The value of meta-analysis—combining many studies together to discern broad scale patterns—is also its weakness, in that fertilization experiments differ in many ways. Meta-analyses will always have bias (Osenberg et al., 1999). In this case, the ecosystems where ecologists have worked is non-random, publication rates may be lower for negative results, there are fewer studies on P, and differences in laboratory analytical techniques in nutrient measurements might influence N and P values. Yet, despite these known factors our overall results were strongly significant and consistent across categories. Therefore, meta-analysis has proved a valuable tool in examining foliar nutrient responses to fertilization, providing evidence for the following: (1) magnitudes of response to +N and +P are similar for RRN and RRP, respectively, (2) parallel patterns exist in RRN and RRP to what would be predicted with N:P stoichiometric theory, (3) climate is not a good predictor of RRN or RRP, but response ratios do vary in predictable ways across families, ecosystems, life forms, and competitive situations, and (4) fertilization studies show interactions between N and P and evidence of co-limitation in many situations. In order to understand N/P interactions, we put out a methodological plea: studies need to measure both N and P simultaneously because our sample sizes clearly show that most individual experiments that fertilize with one nutrient usually do not measure the other nutrient in plant tissue. While foliar nutrient concentrations are just one tool in the toolbox (sensu Sullivan et al., 2014) to determine nutrient limitation, the fact that our results confirm known ecological patterns about ecosystems offers reassurance that foliar nutrient responses to fertilization are a valuable and simple assessment of nutrient limitation.
Author Contributions
ND compiled and analyzed the data, made figures and tables, RO and ND wrote the paper.
Funding
This work was supported primarily by NSF CAREER 0546868 to RO, but received facilitation through NSF EPSCoR grants # 0237065, # 0554657, and # 0903833.
Conflict of Interest Statement
The authors declare that the research was conducted in the absence of any commercial or financial relationships that could be construed as a potential conflict of interest.
Acknowledgments
We thank Meagan Selvig for assistance in data gathering and Jodie Schulten for general logistic support that facilitated this work. Megan McGroddy, Sarah Hobbie, and Emma Sayer provided comments on an earlier version.
Supplementary Material
The Supplementary Material for this article can be found online at: https://www.frontiersin.org/article/10.3389/feart.2016.00023
References
Adams, D. C., Gurevitch, J., and Rosenberg, M. S. (1997). Resampling tests for meta-analysis of ecological data. Ecology 78, 1277–1283. doi: 10.2307/2265879
Ågren, G. (2008). Stoichiometry and nutrition of plant growth in natural communities. Annu. Rev. Ecol. Syst. 39, 153–170. doi: 10.1146/annurev.ecolsys.39.110707.173515
Alvarez-Clare, S., and Mack, M. C. (2011). Influence of precipitation on soil and foliar nutrients across nine Costa Rican forests. Biotropica 4, 433–441. doi: 10.1111/j.1744-7429.2010.00732.x
Alvarez-Clare, S, Mack, M. C., and Brooks, M. (2013). A direct test of nitrogen and phosphorus limitation to net primary productivity in a lowland tropical wet forest. Ecology 94, 540–1551. doi: 10.1890/12-2128.1
Broadley, M. R., Bowen, H. C., Cotterill, H. L., Hammond, J. P., Meacham, M. C., Mead, A., et al. (2004). Phylogenetic variation in the shoot mineral concentration of angiosperms. J. Exp. Bot. 55, 321–336. doi: 10.1093/jxb/erh002
Campo, J., and Dirzo, R. (2003). Leaf quality and herbivory responses to soil nutrient addition in secondary tropical dry forests of Yucatán, Mexico. J. Trop. Ecol. 19, 525–530. doi: 10.1017/S0266467403003572
Cleveland, C. C., Townsend, A. R., Taylor, P., Alvarez-Clare, S., Bustamante, M. M. C., Chuyong, G., et al. (2011). Relationships among net primary productivity, nutrients and climate in tropical rain forest: a pan-tropical analysis. Ecol. Lett. 14, 939–947. doi: 10.1111/j.1461-0248.2011.01658.x
Crews, T. E., Kitayama, K., Fownes, J. H., Riley, R. H., Herbert, D. A., Mueller-Dombois, D., et al. (1995). Changes in soil phosphorus fractions and ecosystem dynamics across a long chronosequence in Hawaii. Ecology 76, 1407–1424. doi: 10.2307/1938144
Crowley, K. F., McNeil, B. E., Lovett, G. M., Canham, C. D., Driscoll, C. T., Rustad, L. E., et al. (2012). Do nutrient limitation patterns shift from nitrogen toward phosphorus with increasing nitrogen deposition across the Northeastern United States? Ecosystems 15, 940–957. doi: 10.1007/s10021-012-9550-2
Day, F. P. Jr. (1987). Effects of flooding and nutrient enrichment on biomass allocation in Acer rubrum seedlings. Am. J. Bot. 74, 1541–1554. doi: 10.2307/2444048
de Campos, M. C. R., Pearse, S. J., Oliveira, R. S., and Lambers, H. (2013). Downregulation of net phosphorus-uptake capacity is inversely related to leaf phosphorus-resorption proficiency in four species from a phosphorus-impoverished environment. Ann. Bot. 111, 445–454. doi: 10.1093/aob/mcs299
Domingues, T. F., Meir, P., Feldpausch, T. E. D. R., Saiz, G., Veenendaal, E. M., Schrodt, F., et al. (2010). Co-limitation of photosynthetic capacity by nitrogen and phosphorus in West Africa woodlands. Plant Cell Environ. 33, 959–980. doi: 10.1111/j.1365-3040.2010.02119.x
Drenovsky, R. E., and Richards, J. H. (2004). Critical N:P values: predicting nutrient deficiencies in desert shrublands. Plant Soil 259, 59–69. doi: 10.1023/B:PLSO.0000020945.09809.3d
Drenovsky, R. E., and Richards, J. H. (2005). Nitrogen addition increases fecundity in the desert shrub Sarcobatus vermiculatus. Oecologia 143, 349–356. doi: 10.1007/s00442-004-1821-y
Elser, J. J., Bracken, M. E. S., Cleland, E. E., Gruner, D. S., Harpole, W. S., Hillebrand, H., et al. (2007). Global analysis of nitrogen and phosphorus limitation of primary producers in freshwater, marine and terrestrial ecosystems. Ecol. Lett. 10, 1135–1142. doi: 10.1111/j.1461-0248.2007.01113.x
Elser, J. J., Dobberfuhl, D. R., MacKay, N. A., and Schampel, J. H. (1996). Organism size, life history, and N:P stoichiometry: toward a unified view of cellular and ecosystem processes. Bioscience 46, 674–684. doi: 10.2307/1312897
Eviner, V. T., Chapin, F. S. III, and Vaughn, C. E. (2000). “Nutrient manipulations in terrestrial ecosystems,” in Methods in Ecosystem Science, eds O. E. Sala, R. B. Jackson, H. A. Mooney, and R. W. Howarth (New York, NY: Springer-Verlag), 291–307.
Feller, I. C., Lovelock, C. E., and McKee, K. L. (2007). Nutrient addition differentially affects ecological processes of Avicennia germinans in nitrogen versus phosphorus limited mangrove ecosystems. Ecosystems 10, 347–359. doi: 10.1007/s10021-007-9025-z
Gariola, S., Rawal, R. S., and Dhar, U. (2009). Patterns of litterfall and return of nutrients across anthropogenic disturbance gradients in three subalpine forests of west Himalaya, India. J. Forest. Res. 14, 73–80. doi: 10.1007/s10310-008-0104-6
Gurevitch, J., and Hedges, L. V. (2001). “Meta-analysis: combining results of independent experiments,” in Design and Analysis of Ecological Experiments, eds S. M. Scheiner and J. Gurevitch (Oxford: Oxford University Press), 347–369.
Güsewell, S. (2004). N:P ratios in terrestrial plants: variation and functional significance. New Phytol. 164, 243–266. doi: 10.1111/j.1469-8137.2004.01192.x
Güsewell, S. (2005). Nutrient resorption of wetland graminoids is related to the type of nutrient limitation. Funct. Ecol. 19, 344–354. doi: 10.1111/j.0269-8463.2005.00967.x
Güsewell, S., and Koerselman, W. (2002). Variation in nitrogen and phosphorus concentrations of wetland plants. Perspect. Plant Ecol. 5, 37–61. doi: 10.1078/1433-8319-0000022
Han, W., Fang, J., Guo, D., and Zhang, Y. (2005). Leaf nitrogen and phosphorus stoichiometry across 753 terrestrial plant species in China. New Phytol. 168, 377–385. doi: 10.1111/j.1469-8137.2005.01530.x
Harpole, W. S., Ngai, J. T., Cleland, E. E., Seabloom, E. W., Borer, E. T., Bracken, M. E. S., et al. (2011). Nutrient co-limitation of primary producer communities. Ecol. Lett. 14, 852–862. doi: 10.1111/j.1461-0248.2011.01651.x
Harrison, A. F. (1982). Labile organic phosphorus mineralization in relationship to soil properties. Soil Biol. Biochem. 14, 343–351. doi: 10.1016/0038-0717(82)90004-9
Hayes, P., Turner, B. L., Lambers, H., and Laliberté, E. (2014). Foliar nutrient concentrations and resorption efficiency in plants of contrasting nutrient-acquisition strategies along a 2-million-year dune chronosequence. J. Ecol. 102, 396–410. doi: 10.1111/1365-2745.12196
He, J.-S., Wang, L., Flynn, D. F. B., Wang, X., Ma, W., and Fang, J. (2008). Leaf nitrogen:phosphorus stoichiometry across Chinese grassland biomes. Oecologia 155, 301–310. doi: 10.1007/s00442-007-0912-y
Jarrell, W. M., and Beverly, R. B. (1981). The dilution effect in plant nutrition studies. Adv. Agron. 34, 197–224. doi: 10.1016/S0065-2113(08)60887-1
Karpinets, T. V., Greenwood, D. J., Sams, C. E., and Ammons, J. T. (2006). RNA:protein ratio of the unicellular organism as a characteristic of phosphorus and nitrogen stoichiometyr and of the cellular requirement of ribosomes for protein synthesis. BMC Biol. 4:30, doi: 10.1186/1741-7007-1184-1130
Koerselman, W., and Meuleman, A. F. M. (1996). The vegetation N:P ratio: a new tool to detect the nature of nutrient limitation. J. Appl. Ecol. 33, 1441–1450. doi: 10.2307/2404783
Lajeunesse, M. J., and Forbes, M. R. (2003). Variable reporting and quantitative reviews: a comparison of three meta-analytical techniques. Ecol. Lett. 6, 448–454. doi: 10.1046/j.1461-0248.2003.00448.x
Laliberté, E., Turner, B. L., Costes, T., Pearse, S. J., Wyrwoll, K.-H., Zemunik, G., et al. (2012). Experimental assessment of nutrient limitation along a 2-million year dune chronosequence in the south-western Australia biodiversity hotspot. J. Ecol. 100, 631–642. doi: 10.1111/j.1365-2745.2012.01962.x
Lambers, H., Raven, J. A., Shaver, G. R., and Smith, S. E. (2008). Plant nutrient-acquisition strategies change with soil age. Trends Ecol. Evol. 23, 95–103. doi: 10.1016/j.tree.2007.10.008
Lambers, H., and Shane, M. W. (2007). Phosphorus nutrition of Australian Proteaceae and Cyperaceae: a strategy on old landscapes with prolonged oceanically buffered climates. South Afr. J. Bot. 73, 274–275. doi: 10.1016/j.sajb.2007.02.005
LeBauer, D. S., and Treseder, K. K. (2008). Nitrogen limitation of net primary productivity in terrestrial ecosystems is globally distributed. Ecology 89, 371–379. doi: 10.1890/06-2057.1
Manos, P. S., and Stanford, A. M. (2001). The historical biogeography of Fagaceae: tracking the tertiary history of temperate and subtropical forests of the Northern Hemisphere. Int. J. Plant Sci. 162 (Suppl. 6), S77–S93. doi: 10.1086/323280
Marklein, A. R., and Houlton, B. Z. (2012). Nitrogen inputs accelerate phosphorus cycling rates across a wide variety of terrestrial ecosystems. New Phytol. 193, 696–704. doi: 10.1111/j.1469-8137.2011.03967.x
Mayor, J. R., Wright, S. J., and Turner, B. L. (2014). Species-specific responses of foliar nutrients to long-term nitrogen and phosphorus additions in a lowland tropical forest. J. Ecol. 102, 36–44. doi: 10.1111/1365-2745.12190
McGroddy, M. E., Daufresne, T., and Hedin, L. O. (2004). Scaling of C:N:P stoichiometry in forests worldwide: implications of terrestrial Redfield-type ratios. Ecology 85, 2390–2401. doi: 10.1890/03-0351
Musick, H. B. (1978). Phosphorus toxicity in seedlings of Larrea divaricata grown in solution culture. Bot. Gazette 139, 108–111. doi: 10.1086/336976
Nasto, M. K., Alvarez-Clare, S., Lekberg, Y., Sullivan, B. W., Townsend, A. R., and Cleveland, C. C. (2014). Interactions among nitrogen fixation and soil phosphorus acquisition strategies in lowland tropical rain forests. Ecol. Lett. 17, 1282–1289. doi: 10.1111/ele.12335
Niinemets, U., and Kalevi, K. (2005). Co-limitation of plant primary productivity by nitrogen and phosphorus in a species-rich wooded meadow on calcareous soils. Acta Oecolog. 28, 345–356. doi: 10.1016/j.actao.2005.06.003
Oelmann, Y., Potvin, C., Mark, T., Werther, L., and Tapernon, S. (2010). Tree mixture effects on aboveground nutrient pools of trees in an experimental plantation in Panama. Plant Soil 326, 199–212. doi: 10.1007/s11104-009-9997-x
Ordoñez, J. C., Van Bodegom, P. M., Witte, J.-P. M., Wright, I. J., Reich, P. B., and Aerts, R. (2009). A global study of relationships between leaf traits, climate and soil measures of nutrient fertility. Global Ecol. Biogeogr. 18, 137–149. doi: 10.1111/j.1466-8238.2008.00441.x
Osenberg, C. W., Sarnelle, O., Cooper, S. D., and Holt, R. D. (1999). Resolving ecological questions through meta-analysis: goals, metrics, and models. Ecology 80, 1105–1117. doi: 10.1890/0012-9658(1999)080[1105:REQTMA]2.0.CO;2
Ostertag, R. (2001). The effects of nitrogen and phosphorus availability on fine-root dynamics in Hawaiian montane forests. Ecology 82, 485–499. doi: 10.1890/0012-9658(2001)082[0485:EONAPA]2.0.CO;2
Ostertag, R. (2010). Foliar nitrogen and phosphorus accumulation responses after fertilization: an example from nutrient-limited Hawaiian forests. Plant Soil 334, 1–14. doi: 10.1007/s11104-010-0281-x
Parfitt, R. L., Ross, D. J., Coomes, D. A., Richardson, S. J., Smale, M. C., and Dahlgren, R. A. (2005). N and P in New Zealand soil chronosequences and relationships with foliar N and P. Biogeochemistry 75, 305–328. doi: 10.1007/s10533-004-7790-8
Pettersson, F., and Högbom, L. (2004). Long-term growth effects following forest nitrogen fertilization in Pinus sylvestris and Picea abies stands in Sweden. Scand. J. Forest Res. 19, 339–347. doi: 10.1080/02827580410030136
Porras-Alfaro, A., Herrera, J., Natvig, D. O., and Sinsabaugh, R. L. (2007). Effect of long-term nitrogen fertilization on mycorrhizal fungi associated with a dominant grass in a semiarid grassland. Plant Soil 296, 65–75. doi: 10.1007/s11104-007-9290-9
Redfield, A. C. (1958). The biological control of chemical factors in the environment. Am. Sci. 46, 205–221.
Reed, S. C., Cleveland, C. C., and Townsend, A. R. (2011). Functional ecology of free-living nitrogen fixation: a contemporary review. Annu. Rev. Ecol. Syst. 42, 489–512. doi: 10.1146/annurev-ecolsys-102710-145034
Reed, S. C., Seastedt, T. R., Mann, C. M., Suding, K. N., Townsend, A. R., and Cherwin, K. L. (2007). Phosphorus fertilization stimulates nitrogen fixation and increases inorganic nitrogen concentrations in a restored prairie. Appl. Soil Ecol. 36, 238–242. doi: 10.1016/j.apsoil.2007.02.002
Reich, P. B., and Oleksyn, J. (2004). Global patterns of plant leaf N and P in relation to temperature and latitude. Proc. Natl. Acad. Sci. U.S.A. 101, 11001–11006. doi: 10.1073/pnas.0403588101
Rennenberg, H., and Schmidt, S. (2010). Perennial lifestyle—an adaptation to nutrient limitation? Tree Physiol. 30, 1047–1049. doi: 10.1093/treephys/tpq076
Reynolds, H. L., Packer, A., Bever, J. D., and Clay, K. (2003). Grassroots ecology: plant-microbe-soil interactions as drivers of plant community structure and dynamics. Ecology 84, 2281–2291. doi: 10.1890/02-0298
Richards, A. E., and Schmidt, S. (2010). Complementary resource use by tree species in a rain forest tree plantation. Ecol. Appl. 20, 1237–1254. doi: 10.1890/09-1180.1
Rivas-Ubach, A., Sardans, J., Pérez-Trujillo, M., Estiarte, M., and Peñuelas, J. (2012). Strong relationship between elemental stoichiometry and metabolome in plants. Proc. Natl. Acad. Sci. U.S.A. 109, 4181–4186. doi: 10.1073/pnas.1116092109
Rosenberg, M. S., Adams, D. C., and Gurevitch, J. (2000). MetaWin Statistical Software for Meta-Analysis. Sunderland, MA: Sinauer Associates, Inc.
Rosenthal, R. (1979). The file drawer problem and tolerance for null results. Psychol. Bull. 86, 638–641. doi: 10.1037/0033-2909.86.3.638
Sardans, J., Peñuelas, J., and Rodà, F. (2006). Plasticity of leaf morphologic traits, leaf nutrient content, and water capture in the Mediterranean evergreen oak Quercus ilex subsp. ballota in response to fertilization and changes in competitive conditions. Ecoscience 13, 258–270. doi: 10.2980/i1195-6860-13-2-258.1
Sardans, J., Rivas-Ubach, A., and Peñuelas, J. (2011). Factors affecting nutrient concentration and stoichiometry of forest trees in Catalonia (NE Spain). Forest Ecol. Manag. 262, 2024–2034. doi: 10.1016/j.foreco.2011.08.019
Sardans, J., Rivas-Ubach, A., and Peñuelas, J. (2012). The C:N:P stoichiometry of organisms and ecosystems in a changing world: a review and perspectives. Perspect. Plant Ecol. Evol. Syst. 14, 33–47. doi: 10.1016/j.ppees.2011.08.002
Schreeg, L. A., Santiago, L. S., Wright, S. J., and Turner, B. L. (2014). Stem, root, and older leaf N:P ratios are more responsive indicators of soil nutrient availability than new foliage. Ecology 95, 2062–2068. doi: 10.1890/13-1671.1
Shane, M. W., Szota, C., and Lambers, H. (2004). A root trait accounting for the extreme phosphorus sensitivity of Hakea prostrata (Proteaceae). Plant Cell Environ. 27, 991–1004. doi: 10.1111/j.1365-3040.2004.01204.x
Shaver, G. R., and Chapin, F. S. III. (1995). Long-term responses to factorial, NPK fertilizer treatment by Alaskan wet and moist tundra sedge species. Ecography 18, 259–275. doi: 10.1111/j.1600-0587.1995.tb00129.x
Shaver, G. R., and Melillo, J. M. (1984). Nutrient budgets of marsh plants: efficiency concepts and relation to availability. Ecology 65, 1491–1510. doi: 10.2307/1939129
Soudzilovskaia, N. A., Onipchenko, V. G., Cornelissen, J. H. C., and Aerts, R. (2005). Biomass production, N: P ratio and nutrient limitation in a Caucasian alpine tundra plant community. J. Veg. Sci. 16, 399–406. doi: 10.1111/j.1654-1103.2005.tb02379.x
Standish, R. J., Stokes, B. A., Tibbett, M., and Hobbs, R. J. (2007). Seedling response to phosphate addition and inoculation with arbuscular mycorrhizas and the implications for old-field restoration in Western Australia. Environ. Exp. Bot. 61, 58–65. doi: 10.1016/j.envexpbot.2007.03.004
Sterner, R. W., and Elser, J. J. (2002). Ecological Stoichiometry: The Biology of Elements from Molecules to the Biosphere. Princeton, NJ: Princeton University Press.
Stock, W. D., and Verboom, G. A. (2012). Phylogenetic ecology of foliar N and P concentrations and N:P ratios across mediterranean-type ecosystems. Global Ecol. Biogeogr. 21, 1147–1156. doi: 10.1111/j.1466-8238.2011.00752.x
Sullivan, B. W., Alvarez-Clare, S., Castle, S. C., Porder, S., Reed, S. C., Schreeg, L., et al. (2014). Assessing nutrient limitation in complex forested ecosystems: alternatives to large-scale fertilization experiments. Ecology 95, 668–681. doi: 10.1890/13-0825.1
Tanner, E. V. J., Vitousek, P. M., and Cuevas, E. (1998). Experimental investigation of nutrient limitation of forest growth on wet tropical mountains. Ecology 79, 10–22. doi: 10.1890/0012-9658(1998)079[0010:EIONLO]2.0.CO;2
Tessier, J. T., and Raynal, D. J. (2003). Use of nitrogen to phosphorus ratios in plant tissue as an indicator of nutrient limitation and nitrogen saturation. J. Appl. Ecol. 40, 523–534. doi: 10.1046/j.1365-2664.2003.00820.x
Townsend, A. R., Cleveland, C. C., Asner, G. P., and Bustamante, M. M. C. (2007). Controls over foliar N:P ratios in tropical rain forests. Ecology 88, 107–118. doi: 10.1890/0012-9658(2007)88[107:COFNRI]2.0.CO;2
Treseder, K. K. (2004). A meta-analysis of mycorrhizal responses to nitrogen, phosphorus, and atmospheric CO2 in field studies. New Phytol. 164, 347–355. doi: 10.1111/j.1469-8137.2004.01159.x
Treseder, K. K., and Vitousek, P. M. (2001). Potential ecosystem-level effects of genetic variation among populations of Metrosideros polymorpha from a soil fertility gradient in Hawaii. Oecologia 126, 266–275. doi: 10.1007/s004420000523
Vadeboncoeur, M. A. (2010). Meta-analysis of fertilization experiments indicates multiple limiting nutrients in northeastern deciduous forests. Can. J. Forest Res. 40, 1766–1780. doi: 10.1139/X10-127
Valentine, D. W., and Allen, H. L. (1990). Foliar responses to fertilization identify nutrient limitation in loblolly pine. Can. J. Forest Res. 20, 144–151. doi: 10.1139/x90-020
Vitousek, P. M. (1984). Litterfall, nutrient cycling, and nutrient limitation in tropical forests. Ecology 65, 285–298. doi: 10.2307/1939481
Vitousek, P. M. (1998). Foliar and litter nutrients, nutrient resorption, and decomposition in Hawaiian Metrosideros polymorpha. Ecosystems 1, 401–407. doi: 10.1007/s100219900033
Vitousek, P. M., Porder, S., Houlton, B. Z., and Chadwick, O. A. (2010). Terrestrial phosphorus limitation: mechanisms, implications, and nitrogen-phosphorus interactions. Ecol. Appl. 20, 5–15. doi: 10.1890/08-0127.1
Von Oheimb, G., Power, S. A., Falk, K., Friedrich, U., Mohamed, A., Krug, A., et al. (2010). N:P ratio and the nature of nutrient limitation in Calluna-dominated heathlands. Ecosystems 13, 317–327. doi: 10.1007/s10021-010-9320-y
Walker, T. W., and Syers, J. K. (1976). The fate of phosphorus during pedogenesis. Geoderma 15, 1–19. doi: 10.1016/0016-7061(76)90066-5
Wang, P. E. I., Olsson, B. A., and Lundkvist, H. (2007). Effects of wood ash, vitality fertilizer and logging residues on needle and root chemistry in a young Norway spruce stand. Scand. J. Forest Res. 22, 136–149. doi: 10.1080/02827580701231480
Wardle, D. A., Walker, L. R., and Bardgett, R. D. (2004). Ecosystem properties and forest decline in contrasting long-term chronosequences. Science 305, 509–513. doi: 10.1126/science.1098778
Wassen, M. J., Venterlink, H. O., Lapshina, E. D., and Tanneberger, F. (2005). Endangered plants persist under phosphorus limitation. Nature 437, 547–550. doi: 10.1038/nature03950
Witkowski, E. T. F. (1990). Nutrient limitation of inflorescence and seed production in Leucospermum parile (Proteaceae) in the Cape fynbos. J. Appl. Ecol. 27, 148–158 doi: 10.2307/2403574
Wright, I. J., Reich, P. B., Cornelissen, J. H. C., Falster, D. S., Garnier, E., Hikosaka, K., et al. (2005). Assessing the generality of global leaf trait relationships. New Phytol. 166, 485–496. doi: 10.1111/j.1469-8137.2005.01349.x
Wright, S. J., Yavitt, J. B., Wurzburger, N., Turner, B. L., Tanner, E. V. J., Sayer, E. J., et al. (2011). Potassium, phosphorus, or nitrogen limit root allocation, tree growth, or litter production in a lowland tropical forest. Ecology 92, 1616–1625. doi: 10.1890/10-1558.1
Wullaert, H., Homeier, J., Valarezoc, C., and Wilcke, W. (2010). Response of the N and P cycles of an old-growth montane forest in Ecuador to experimental low-level N and P amendments. Forest Ecol. Manag. 260, 1434–1445. doi: 10.1016/j.foreco.2010.07.021
Keywords: leaf nutrients, N:P ratio, nutrient availability, nutrient limitation, response ratio, stoichiometry
Citation: Ostertag R and DiManno NM (2016) Detecting Terrestrial Nutrient Limitation: A Global Meta-Analysis of Foliar Nutrient Concentrations after Fertilization. Front. Earth Sci. 4:23. doi: 10.3389/feart.2016.00023
Received: 07 September 2015; Accepted: 22 February 2016;
Published: 30 March 2016.
Edited by:
Juergen Homeier, University of Goettingen, GermanyReviewed by:
Louis S. Santiago, University of California, Riverside, USASilvia Alvarez-Clare, North Central College, USA
Copyright © 2016 Ostertag and DiManno. This is an open-access article distributed under the terms of the Creative Commons Attribution License (CC BY). The use, distribution or reproduction in other forums is permitted, provided the original author(s) or licensor are credited and that the original publication in this journal is cited, in accordance with accepted academic practice. No use, distribution or reproduction is permitted which does not comply with these terms.
*Correspondence: Rebecca Ostertag, ostertag@hawaii.edu