An Interdecadal Increase in the Spring Bering Sea Ice Cover in 2007
 Renguang Wu1,2*
  Zhang Chen1,3
- 1Center for Monsoon System Research, Institute of Atmospheric Physics, Chinese Academy of Sciences, Beijing, China
- 2State Key Laboratory of Numerical Modeling for Atmospheric Sciences and Geophysical Fluid Dynamics, Institute of Atmospheric Physics, Chinese Academy of Sciences, Beijing, China
- 3University of Chinese Academy of Sciences, Beijing, China
The sea ice coverage of the Northern Hemisphere as a whole has been declining since 1979. On contrary, the March–April sea ice concentration in the Bering Sea experienced a prominent increase in year 2007. The present study documents the changes in surface air temperature, surface heat fluxes, sea surface temperature, and atmospheric circulation accompanying the above interdecadal change in the Bering Sea ice concentration. It is shown that an obvious decrease in surface air temperature, sea surface temperature, and surface net shortwave radiation occurred in concurrent with the sea ice increase. The surface air temperature decrease is associated with a large-scale circulation change, featuring a decrease in sea level pressure extending from the Pacific coast of Alaska to northwestern Europe and an increase in sea level pressure over the high-latitude Asia and the high-latitude North Atlantic Ocean. The enhancement of northwesterly winds over the Bering Sea led to a large decrease in surface air temperature there. The associated increase in upward turbulent heat flux cooled the sea surface temperature in the waters south of the ice covered region, favoring the southward expansion of ice extent. This, together with a positive ice-albedo feedback, amplified the sea ice anomalies after they were initiated, leading to the interdecadal increase in sea ice in the Bering Sea.
Introduction
Sea ice cover change in the Arctic region has received a substantial attention in recent years because of its continuous decline in recent decades and its important indication of climate change (e.g., Screen and Simmonds, 2010; Stroeve et al., 2012; Screen et al., 2013; Vihma, 2014). A feature of great concern to the scientific community is that the Northern Hemisphere sea ice as a whole reached a record minimum in September 2007 during a period of accelerated decline (Comiso et al., 2008; Stroeve et al., 2008, 2012; Cavalieri and Parkinson, 2012). Much effort has been devoted to understanding of the reasons of the decline in the Northern Hemisphere sea ice cover after 1979 (Rigor et al., 2002; Serreze et al., 2007; Deser and Teng, 2008; Stroeve et al., 2012; Park et al., 2015).
Analysis showed that the sea ice change is not uniform in the Northern Hemisphere (Ukita et al., 2007). The sea ice area and extent in January–April show a positive trend during 1979–2010 in the Bering Sea (Cavalieri and Parkinson, 2012), opposite to that in the other regions of the Northern Hemisphere. Wendler et al. (2014) found a slight increase of annual ice area in the Bering Sea over the period 1979–2012 and associated the ice area increase with the change of the Pacific Decadal Oscillation from positive to more negative values. Our analysis shows that the positive trend of sea ice cover in the Bering Sea in March–April is due to a prominent interdecadal increase in year 2007. An issue is what may have contributed to the distinct increase in the Bering Sea ice cover. The present study focuses on addressing this issue.
The datasets used in the present study are described in Section Data. The interdecadal change in sea ice is presented in Section Results. The associated changes in surface air temperature, sea surface temperature, sea level pressure, surface winds, and surface heat fluxes are analyzed in Section Results to understand the sea ice change. A summary is provided in Section Summary.
Data
The monthly mean SST and sea ice concentration data used in the present analysis are from the Hadley Centre Sea Ice and Sea Surface Temperature data set (HadISST) (Rayner et al., 2003), which is available on a 1 degree latitude-longitude grid from 1870 to date. The HadISST was obtained from http://www.metoffice.gov.uk/hadobs/hadisst/data/download.html.
Present study also uses monthly sea ice concentration data from the National Snow and Ice Data Center (NSIDC), which is provided at 25 km spatial resolution for the period October 1978 through December 2014 (Cavalieri et al., 1996). The sea ice extent (SIE) is calculated as the cumulative area of all grid cells having at least 15% sea ice concentration. The 15% threshold is widely used for both ice extent and ice area calculations in previous studies (e.g., Parkinson et al., 1999; Parkinson and Cavalieri, 2008; Stroeve et al., 2012). The reasons for choosing a 15% threshold of ice coverage were discussed by Parkinson and Cavalieri (2008).
Surface wind, sea level pressure, surface shortwave radiation, and surface latent and sensible heat fluxes are from the National Centers for Environmental Prediction (NCEP)-Department of Energy reanalysis 2 (Kanamitsu et al., 2002). They are available on T62 Gaussian grids from 1979 to date. The reanalysis data were obtained by anonymous ftp at ftp://ftp.cdc.noaa.gov/.
Results
In this section, we start with a documentation of the interdecadal change in sea ice in the Bering Sea in 2007. Then, we analyze accompanying changes in surface air temperature, sea surface temperature (SST), and surface heat fluxes. The circulation change is analyzed to understand its contribution to the surface air temperature change. At last, the processes for the initiation and maintenance of the decadal sea ice cover anomalies in the Bering Sea are investigated.
Sea Ice Change
We start with a comparison of the March sea ice extent change between the Bering Sea region and the whole Northern Hemisphere to motivate the readers. For the Northern Hemisphere as a whole, the March sea ice extent shows an obvious downward trend during the analysis period with a linear trend of −0.039 10 km2/a (Figure 1A). In sharp contrast, the March sea ice extent in the region of 56–62°N and 180–160°W shows a pronounced increase from before to after year 2007 (Figure 1B). The difference of sea ice extent in the above region between 2007–2013 and 2000–2006 is about 0.25 million km2. The increase of sea ice extent in the Bering Sea is observed in April as well (Figure 1B) with a difference of sea ice extent about 0.21 million km2 between 2007–2013 and 2000–2006.
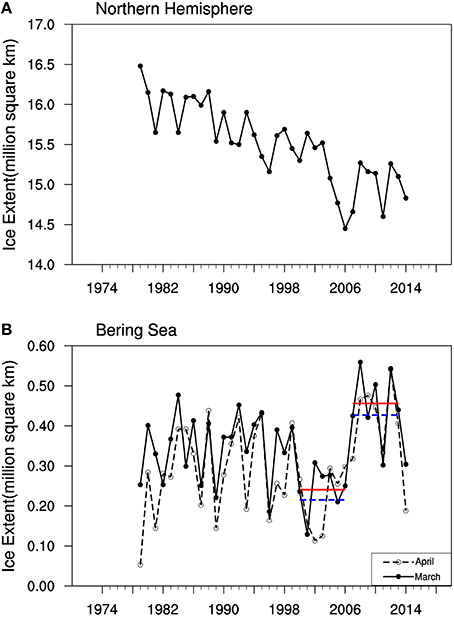
Figure 1. Sea ice extent (106 km2) for the whole Northern Hemisphere in March (A) and the region of 56–62°N and 180–160°W of the Bering Sea in March (solid lines) and April (dashed lines) (B) based on NSIDC data. The horizontal lines in (B) denote the average value over the respective period.
The increase of sea ice concentration in the Bering Sea is further demonstrated in Figure 2 that shows the difference of March and April sea ice concentration between 2007–2013 and 2000–2006. The increase of sea ice concentration in March reaches 0.5 in eastern Bering Sea (Figure 2A). The increase of sea ice concentration in the Bering Sea is also observed in April with a northwestward shift in the location of largest increase (Figure 2B). The difference field not only shows an increase in sea ice concentration, but also an obvious southward expansion of the ice covered region in the Bering Sea.
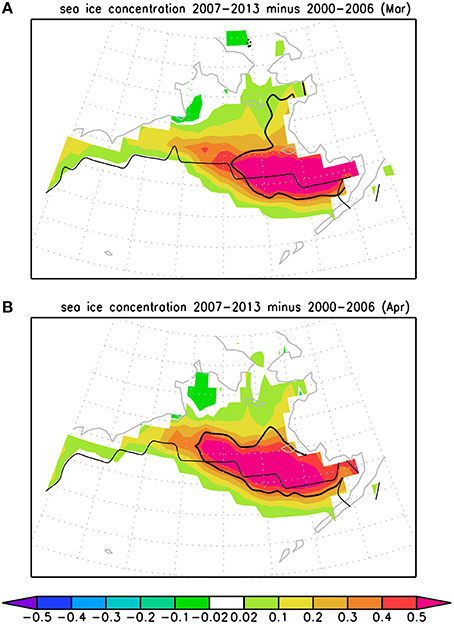
Figure 2. Difference of sea ice concentration (100%) in March (A) and April (B) derived as mean during 2007–2013 minus that during 2000–2006 based on HadISST data. Thin lines denote the south edge of mean sea ice based on the period 2000–2006. The thick lines denote that the difference between 2007–2013 and 2000–2006 is significant at the 99% confidence level according to the Student t-test.
Surface Air Temperature and Sea Surface Temperature Change
The ice formation and melting is associated with surface air temperature and ocean water temperature. Lower surface air temperature may reduce surface water temperature by surface turbulent heat exchange between the atmosphere and ocean. That would provide a favorable condition for ice formation. Higher surface air temperature may favor the ice melting. So is higher water temperature. To understand the reasons for the sea ice increase in the Bering Sea, we analyze the changes in surface air temperature and SST. Figures 3, 4 show the difference of March and April surface air temperature and SST between 2007–2013 and 2000–2006.
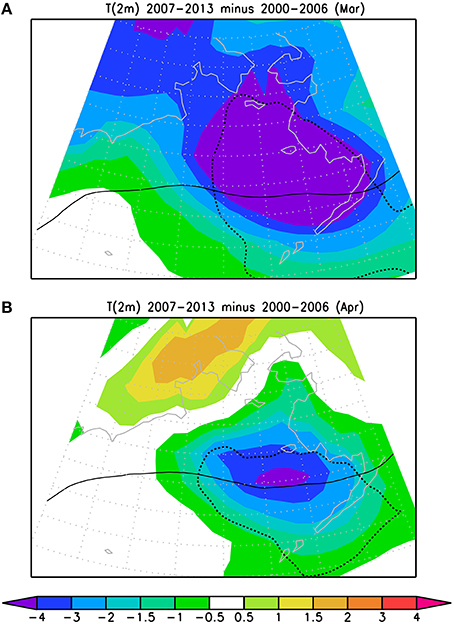
Figure 3. Difference of surface (2 m) air temperature (°C) in March (A) and April (B) derived as mean during 2007–2013 minus that during 2000–2006. Thin lines denote the mean surface air temperature of 0°C based on the period 2000–2006. The thick-dotted lines denote that the difference between 2007–2013 and 2000–2006 is significant at the 99% confidence level according to the Student t-test.
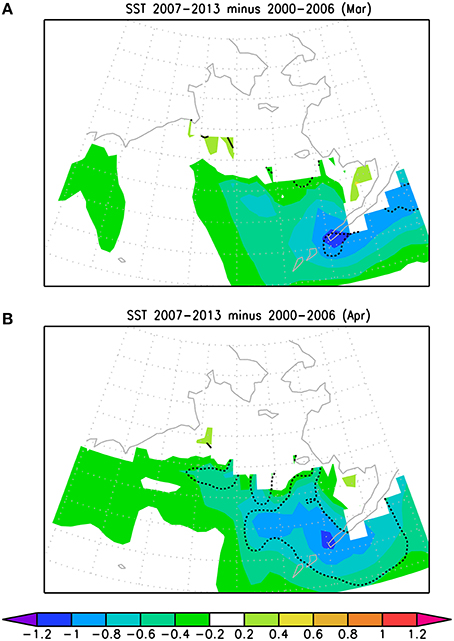
Figure 4. Difference of SST (°C) in March (A) and April (B) derived as mean during 2007–2013 minus that during 2000–2006. The thick lines denote that the difference between 2007–2013 and 2000–2006 is significant at the 99% confidence level according to the Student t-test.
Surface air temperature in March shows an obvious decrease in the whole Bering Sea region, with the largest decrease in eastern Bering Sea where the decrease reaches more than 4°C (Figure 3A). The decrease in surface air temperature is also observed in April though with a smaller magnitude and over a reduced domain (Figure 3B). Note that the temperature decrease near the climatological zero line indicates a southward expansion of the freezing surface temperature in eastern Bering Sea. This is consistent with the southward expansion of the sea ice covered region.
SST decrease is observed in southeastern Bering Sea in both March and April (Figures 4A,B). The largest decrease is about 1°C. The SST decrease along the periphery of the sea ice covered region in climatology (Figure 2A) explains the southward expansion of the sea ice covered region during 2007–2013. The SST decrease may be partly related to surface air temperature change through surface turbulent heat fluxes. Lower surface air temperature increases sea-air temperature difference and induces upward turbulent heat fluxes in the non-ice covered region in March (Figure 5A). These enhanced turbulent heat fluxes contribute to the decrease in SST as ocean loses more heat. In the ice covered region, the turbulent heat exchange between the ocean and the overlying atmosphere is prohibited, leading to a reduction in turbulent surface heat fluxes. In April, turbulent heat flux differences are mainly confined to the ice concentration increase region (Figure 5B).
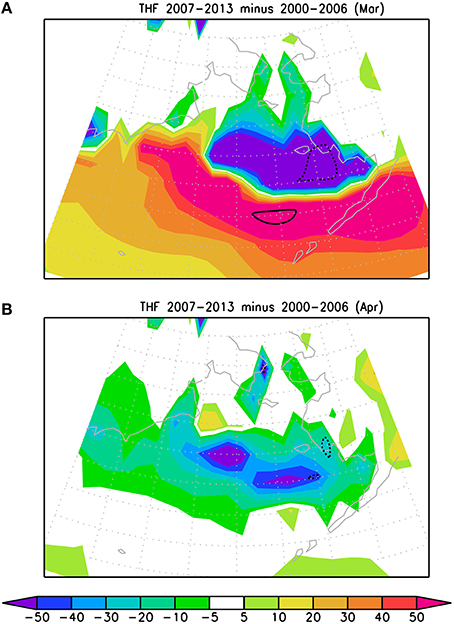
Figure 5. Difference of surface turbulent heat flux (W/m2) in March (A) and April (B) derived as mean during 2007–2013 minus that during 2000–2006. The thick lines denote that the difference between 2007–2013 and 2000–2006 is significant at the 99% confidence level according to the Student t-test.
The large SST decrease region extends to the south coast of Alaska (Figures 4A,B) where the surface air temperature difference is smaller (Figures 3A,B). In particular, the SST decrease along the south coast of Alaska is maintained in April when the turbulent heat flux difference is small in the above region (Figure 5B). This appears to suggest that oceanic processes may also contribute to the SST change. However, this is beyond the region where large sea ice concentration change is observed (Figures 2A,B).
Atmospheric Circulation Change
The above analysis suggests that the surface air temperature decrease may be one reason for the sea ice cover increase in the Bering Sea region. What induces the decrease in surface air temperature? On the ice-covered surface, the surface air temperature decrease may be contributed by the reduction of heat exchange from the underlying ocean. This, however, cannot explain the surface air temperature decrease in the broad region. To understand the surface air temperature decrease, we analyze atmospheric circulation changes.
The sea level pressure in March shows an obvious change with a large-scale pattern. A decrease in sea level pressure is observed in a broad region extending from the Pacific coast of Alaska through the Arctic to the northwestern Europe (Figure 6A). This is sandwiched by sea level pressure increases over high-latitude Asia and over high-latitude North Atlantic-Newfoundland. Correspondingly, the surface wind change features northwesterly over Russian Far East and the Bering Sea (Figure 7A). These bring more air from the high-latitude land that is colder than the air over the ocean, lowering surface air temperature over the Bering Sea. The anomalous northwesterly winds over eastern Bering Sea may contribute to the SST cooling there (Figure 4A) through Ekman advection. The wind speed effect on turbulent heat flux anomalies appears small as anomalous winds tend to be perpendicular to climatological mean northeasterly winds in this region.
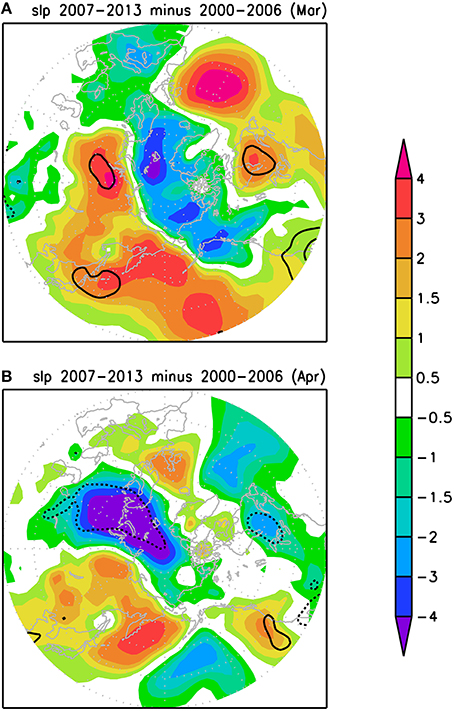
Figure 6. Difference of sea level pressure (hPa) in March (A) and April (B) derived as mean during 2007–2013 minus that during 2000–2006. The thick lines denote that the difference between 2007–2013 and 2000–2006 is significant at the 95% confidence level according to the Student t-test.
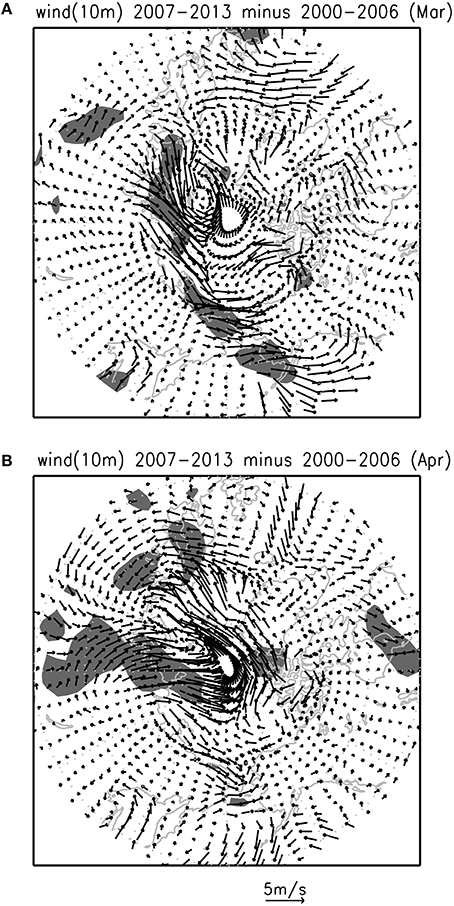
Figure 7. Difference of surface (10 m) wind (m/s) in March (A) and April (B) derived as mean during 2007-2013 minus that during 2000-2006. The shading denotes that the difference between 2007–2013 and 2000–2006 is significant at the 95% confidence level according to the Student t-test.
In April, the sea level pressure increase is observed around the Kamchatka Peninsula (Figure 6B). Correspondingly, surface wind change features northwesterly or westerly over northern part and northerly over southeastern part of the Bering Sea (Figure 7B). Such wind changes appear to be favorable for maintaining lower surface air temperature over the Bering Sea in April (Figure 3B) and thus the increase of sea ice concentration and the expansion of sea ice cover (Figure 2B).
Surface Net Shortwave Radiation Change
Due to its high albedo, the ice surface reflects more downward shortwave radiation than the water surface. With the increase in ice cover, the reflected shortwave radiation is expected to increase accordingly. This results in the decrease in shortwave radiation received by the ocean water. In turn, water temperature would become lower and favor the formation of more ice. This constitutes a positive feedback for ice change (Perovich et al., 2007; Stroeve et al., 2012). In addition, following the increase of ice cover, the heat exchange from the ocean to the overlying atmosphere is reduced consequently. This may contribute to the decrease in surface air temperature. In turn, the ice melting is reduced.
The positive feedback is confirmed by the change in surface net shortwave radiation. Figure 8 shows the difference of surface net shortwave radiation between 2007–2013 and 2000–2006. Large decrease in surface net shortwave radiation is observed in the region of sea ice concentration decrease in both March and April. In comparison, the region of shortwave radiation decrease moves northwestward from March to April, which is consistent with the shift of sea ice concentration decrease region (Figure 2).
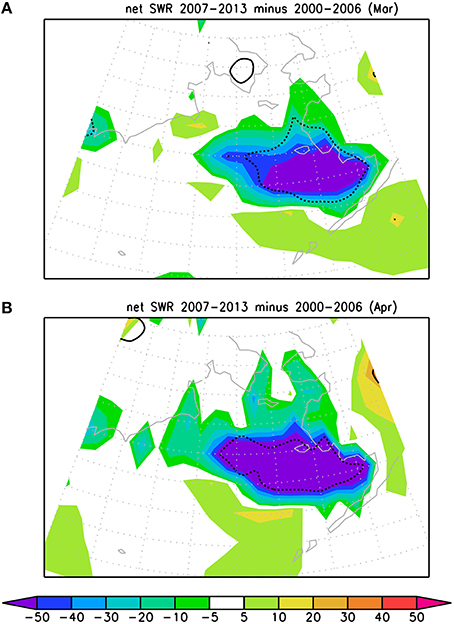
Figure 8. Difference of surface net shortwave radiation (W/m2) in March (A) and April (B) derived as mean during 2007–2013 minus that during 2000–2006. The thick lines denote that the difference between 2007–2013 and 2000–2006 is significant at the 99% confidence level according to the Student t-test.
Initiation and Maintenance of the Interdecadal Anomalies
The above analysis shows concurrent interdecadal changes in sea ice cover, surface air temperature, and sea surface temperature. Then, what initiate the above changes? As the sea ice formation may be related to atmospheric and oceanic conditions, we examine the evolution of surface air temperature and SST anomalies to identify plausible signals for the sea ice change. Figure 9 shows monthly anomalies of sea ice concentration, SST, and surface air temperature from December 2006 to March 2007. The anomalies are computed based on mean of the period 2000–2006.
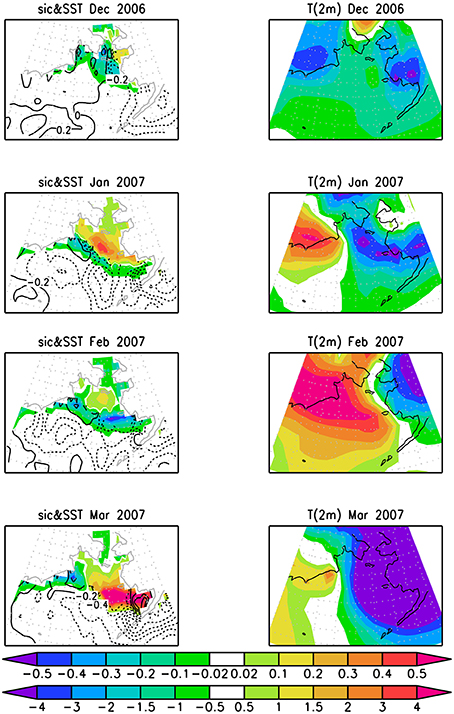
Figure 9. Anomalies of sea ice concentration (100%, shading) and SST (°C, contour, interval: 0.2°C) (left), surface (2 m) air temperature (°C) (right) from December 2006 to March 2007 obtained as departure from 2000 to 2006 mean. The upper and lower color bar is for sea ice concentration and surface air temperature, respectively.
In December 2006, sea ice concentration anomaly is mainly negative and surface air temperature anomaly is small in the northern Bering Sea. Negative SST anomalies are observed in the eastern part, but the SST anomalies are small positive in the western part. More and less sea ice concentration is observed in the northern Bering Sea and the periphery of ice covered region in January 2007. A lower surface air temperature is observed over the region of ice concentration increase. Negative SST anomalies are present in the region with negative ice concentration anomaly. Upward turbulent heat flux anomalies are observed (not shown), which indicates an impact of surface air temperature on SST. The sea ice anomaly distribution appears to be maintained in February 2007 with a reduction of positive anomalies in northern part and an increase of negative anomalies along 60°N. The change from January to February is consistent with positive surface air temperature anomalies in February 2007, which may be associated with southerly wind anomalies (not shown). The negative SST anomalies decrease from January to February 2007, which may be linked to the surface air temperature increase that suppresses upward turbulent heat flux (not shown).
Large negative surface air temperature anomalies are observed over the eastern Bering Sea in March 2007. The development of lower air temperature in this region is likely contributed by northerly wind anomalies (not shown). Accompanying the air temperature decrease, large increase in sea ice is observed in the eastern Bering Sea. At the same time, large negative SST anomalies are observed, in particular in the southeastern Bering Sea. The SST anomalies may be affected by surface air temperature decrease as the upward turbulent heat flux increases (not shown).
From the temporal evolution, both sea ice, and surface air temperature show month–month fluctuations. On the other hand, the SST anomalies appear earlier and show persistence. This indicates that the ocean state provides a pre-condition for the decadal sea ice anomalies. The initiation of large sea ice anomalies, however, may be related to atmospheric changes. It is possible that an individual cold event may initiate the increase of sea ice and then a positive feedback process amplifies the initial change, leading to large monthly mean anomalies.
To examine the above possibility, we show in Figure 10 area-mean surface air temperature and meridional wind averaged over the region of 56–62°N and 180–160°W where large sea ice anomalies are observed in March 2007. During January 8–February 10, surface air temperature in most of the days is higher in 2007 than that in 2006, in particular in mid-January and late-January to early-February when the difference reaches 10–20°C (Figure 10A). The air temperature difference appears to be due to wind difference. Large southerly winds are observed in mid-January and late-January to early-February of 2007, whereas northerly winds dominated in the same periods of 2006 (Figure 10B). The winds turn to northerly starting from mid-February of 2007 (Figure 10B), which is followed by surface air temperature lowering to below 0°C (Figure 10A). An enhancement in northerly winds occurred during early- to mid-March, which results in surface air temperature of 10–15°C below the freezing point. The temperature difference between 2007 and 2006 reaches over 10°C for a period of about 3 weeks in March. The extreme low surface air temperature may be the reason for the formation of large sea ice anomalies in March 2007. After March 20, the meridional wind difference between the 2 years is reduced (Figure 10B). This is followed by a dramatic rise of surface air temperature in late March of 2007 and a reduction of the air temperature difference between the 2 years (Figure 10A). The temporal relationship between surface air temperature and wind variations signifies an important role of atmospheric wind changes.
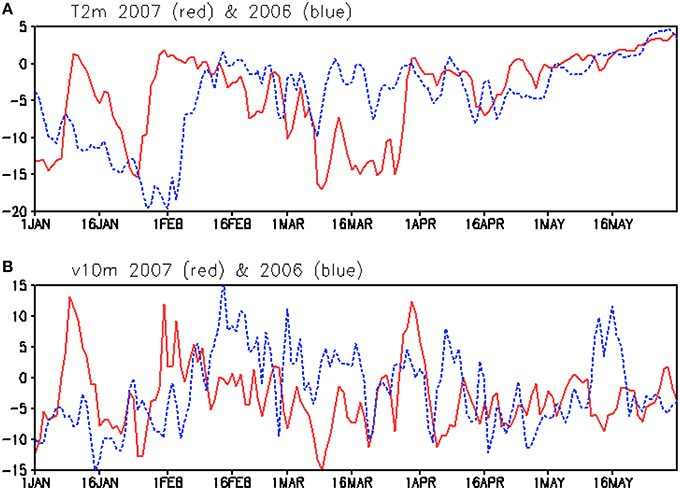
Figure 10. Area-mean surface (2 m) air temperature (°C) (A) and surface (10 m) meridional wind (B) averaged over the region of 56–62°N and 180–160°W in 2007 (red) and 2006 (blue).
Examination of surface wind distribution shows that the Bering Sea is under the influence of very different circulation system during early- and mid-March in the 2 years. In year 2007, the Bering Sea is under the influence of an anticyclone with northerly winds controlling the eastern part (Figure 11B). In contrast, in year 2006, a cyclone controls most of the Bering Sea with southerly winds over southeastern part (Figure 11A). The dramatic different wind system causes large surface air temperature difference in March over the Bering Sea between the 2 years. In year 2007, zero temperature line in the eastern Bering Sea was pushed to southern Aleutian Islands in mid- and late-March (50–52°N) (Figure 11B), whereas in year 2006, the zero temperature line stayed around 54–56°N in March (Figure 11A).
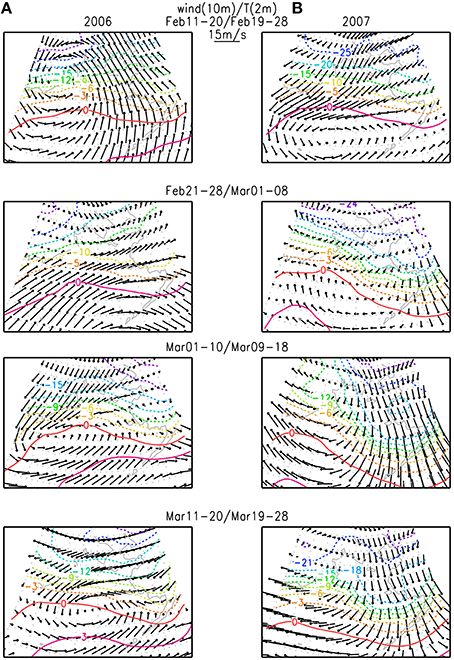
Figure 11. Surface (10 m) winds (vector, scale at top-middle) and surface (2 m) air temperature (contour, interval: 3°C) in 2006 (A, left) and 2007 (B, right) during February 11–20, February 21–28, March 1–10, and March 11–20 for winds and during February 19–28, March 1–8, March 9-18, and March 19–28 for air temperature.
With the seasonal increase in surface air and ocean water temperature, the sea ice in the Bering Sea is expected to melt out in summer. As shown before, the sea ice anomalies in March persist from year to year during 2007–2013 (Figure 1B). Why did the sea ice anomalies reappear in 2008? We speculate that this is due to the maintenance of atmospheric and oceanic conditions favorable for sea ice increase. This is confirmed by Figure 12 that shows surface air temperature and SST anomalies from May to November in every other month for the period 2007–2013. The persistence of negative surface air temperature and SST anomalies in the eastern Bering Sea are apparent during the period though there are some changes in the magnitude of anomalies. Due to the maintenance of negative surface air temperature and SST anomalies, more ice may reform when the next ice formation season comes and thus the ice anomalies may recur during the period 2007–2013.
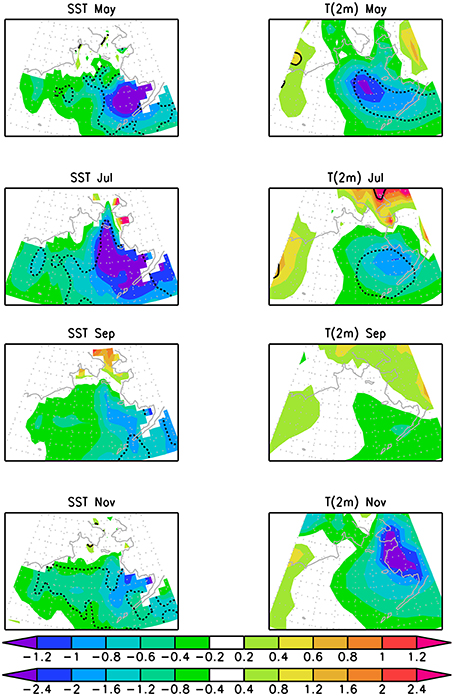
Figure 12. Difference of SST (°C) (left) and surface (2 m) air temperature (°C) (right) in May, July, September, and November derived as mean during 2007–2013 minus that during 2000–2006. The thick lines denote that the difference between 2007–2013 and 2000–2006 is significant at the 99% confidence level according to the Student t-test. The upper and lower color bar is for SST and surface air temperature, respectively.
The maintenance of negative SST anomalies may be partly contributed by more sea ice melt during the ice melting season. As more ice melt consumes more solar radiation, this reduces the part of solar radiation for warming the ocean water. This leads to lower SST in the coming months. The ocean change may play a role in the maintenance of SST anomalies as well. As pointed out by Wendler et al. (2014), the Pacific Decadal Oscillation experienced a change from positive to more negative values in the last decade, indicating a cooling of the North Pacific waters. Such cooling in turn weakens the Aleutian Low. This is accompanied by less advection of relatively warm air from the Aleutians into the Northern Bering Sea, favoring SST cooling. The maintenance of negative surface air temperature anomalies appears to be partly related to negative SST anomalies as upward turbulent heat flux over the eastern Bering Sea is reduced during May through September (not shown), and partly contributed by northerly winds in May, September, and November (not shown).
Summary
The sea ice concentration in the Bering Sea is found to be much larger during 2007–2013 than during 2000–2006. An obvious southward expansion of ice covered region concurred in March and April. This interdecadal increase in the Bering Sea ice is contrary to the continuous decline of sea ice coverage of the Northern Hemisphere as a whole since 1979. This indicates a unique regional feature of the sea ice change in the Bering Sea.
The increase in sea ice concentration in the Bering Sea is consistent with a large decrease in surface air temperature. The regional surface air temperature decrease, in turn, is related to a large-scale pattern of sea level pressure and surface wind changes. The sea level pressure decreases in a region extending from the Pacific coast of Alaska to northwestern Europe and increases over high-latitude Asia. This is accompanied by enhanced northwesterly winds over the Bering Sea, which may be a main factor for the surface air cooling. The surface air temperature decrease induces surface water cooling through enhancing upward turbulent heat flux in the waters south of the ice covered region. This leads to a southward expansion of ice extent in the Bering Sea.
A positive ice-albedo feedback involving surface shortwave radiation changes may play an important role in amplifying the sea ice anomalies after they are formed. The recurrence of sea ice anomalies in the Bering Sea for multiple years following the change in 2007 may be attributed to the persistence of negative surface air and water temperature anomalies during 2007–2013. The maintenance of these oceanic and atmospheric conditions may be due to the consumption of more solar radiation for ice melt after large ice anomalies are formed and the decrease of upward turbulent heat flux. The initiation of the sea ice anomalies in March 2007 seems to be due to a large lowering of surface air temperature of more than 10°C under the influence of large and persistent northerly winds over the Bering Sea for several weeks.
The present study suggests that a strong and persistent cold event may switch the sea ice state in high-latitude oceans from one regime to the other via changing the surface condition. The ice-albedo feedback may amplify the initial sea ice anomalies. The maintenance of coupled atmospheric and oceanic states then may help to sustain the new regime for multiple years until a strong event switches the state. The ocean circulation changes may also play a role in the initiation and maintenance of the interdecadal sea ice increase, which, however, has not been discussed in this study. Further studies are needed to address this issue.
Author Contributions
RW initiated the idea of this work. RW and ZC accomplished the analysis of this work together. RW wrote most part of the manuscript and ZC helped in improving the writing.
Conflict of Interest Statement
The authors declare that the research was conducted in the absence of any commercial or financial relationships that could be construed as a potential conflict of interest.
Acknowledgments
This study is supported by National Natural Science Foundation of China grants (41475081, 41275081, and 41530425). The NCEP reanalysis 2 data were obtained from ftp://ftp.cdc.noaa.gov/. The sea ice concentration data were obtained from http://nsidc.org/data/seaice/. The HadISST data were obtained from http://www.metoffice.gov.uk/hadobs/hadisst/data/download.html.
References
Cavalieri, D. J., and Parkinson, C. L. (2012). Arctic sea ice variability and trends, 1979-2010. Cryosphere 6, 881–889. doi: 10.5194/tc-6-881-2012
Cavalieri, D. J., Parkinson, C. L., Gloersen, P., and Zwally, H. (1996). Updated Yearly, Sea Ice Concentrations from Nimbus-7 SMMR and DMSP SSM/I-SSMIS Passive Microwave Data. [1979-2014]. Boulder, CO: NASA National Snow and Ice Data Center Distributed Active Archive Center.
Comiso, J. C., Parkinson, C. L., Gersten, R., and Stock, L. (2008). Accelerated decline in the Arctic sea ice cover. Geophys. Res. Lett. 35, L01703. doi: 10.1029/2007GL031972
Deser, C., and Teng, H. (2008). Evolution of Arctic sea ice concentration trends and the role of atmospheric circulation forcing, 1979-2007. Geophys. Res. Lett. 35, L02504. doi: 10.1029/2007GL032023
Kanamitsu, M., Ebisuzaki, W., Woollen, J., Yang, S.-K., Hnilo, J. J., Fiorino, M., et al. (2002). NCEP–DOE AMIP-II Reanalysis (R-2). Bull. Amer. Meteor. Soc. 83, 1631–1643. doi: 10.1175/BAMS-83-11-1631
Park, D.-S. R., Lee, S.-Y., and Feldstein, S. B. (2015). Attribution of the recent winter sea ice decline over the Atlantic sector of the Arctic Ocean. J. Climate 28, 4027–4033. doi: 10.1175/JCLI-D-15-0042.1
Parkinson, C. L., and Cavalieri, D. J. (2008). Arctic sea ice variability and trends, 1979–2006. J. Geophys. Res. 113, C07003. doi: 10.1029/2007jc004558
Parkinson, C. L., Cavalieri, D. J., Gloersen, P., Zwally, H. J., and Comiso, J. C. (1999). Arctic sea ice extents, areas and trends, 1978–1996. J. Geophys. Res. 104, 20, 837–20, 856. doi: 10.1029/1999jc900082
Perovich, D. K., Light, B., Eicken, H., Jones, K. F., Runciman, K., and Nghiem, S. V. (2007). Increasing solar heating of the Arctic Ocean and adjacent seas, 1979–2005: attribution and role in the ice-albedo feedback. Geophys. Res. Lett. 34, L19505. doi: 10.1029/2007GL031480
Rayner, N. A., Parker, D. E., Horton, E. B., Folland, C. K., Alexander, L. V., Rowell, D. P., et al. (2003). Global analyses of sea surface temperature, sea ice, and night marine air temperature since the late nineteenth century. J. Geophys. Res. 108, 4407. doi: 10.1029/2002JD002670
Rigor, I. G., Wallace, J. M., and Colony, R. L. (2002). Response of sea ice to the Arctic oscillation. J. Climate 15, 2648–2663. doi: 10.1175/1520-0442(2002)015<2648:ROSITT>2.0.CO;2
Screen, J. A., and Simmonds, I. (2010). The central role of diminishing sea ice in recent Arctic temperature amplification. Nature 464, 1334–1337. doi: 10.1038/nature09051
Screen, J. A., Simmonds, I., Deser, C., and Tomas, R. (2013). The atmospheric response to three decades of observed Arctic sea ice loss. J. Climate 26, 1230–1248. doi: 10.1175/JCLI-D-12-00063.1
Serreze, M. C., Holland, M. M., and Stroeve, J. (2007). Perspectives on the Arctic's shrinking sea-ice cover. Science 315, 1533–1536. doi: 10.1126/science.1139426
Stroeve, J. C., Serreze, M. C., Holland, M. M., Kay, J. E., Malanik, J., and Barrett, A. P. (2012). The Arctic's rapidly shrinking sea ice cover: a research synthesis. Climate Change 110, 1005–1027. doi: 10.1007/s10584-011-0101-1
Stroeve, J., Serreze, M., Drobot, S., Gearheard, S., Holland, M., Maslanik, J., et al. (2008). Arctic sea ice extent plummets in 2007. EOS Trans. AGU 89, 13–14. doi: 10.1029/2008EO020001
Ukita, J., Honda, M., Nakamura, H., Tachibana, Y., Cavalieri, D. D. J., Parkinson, C. L., et al. (2007). Northern Hemisphere sea ice variability: lag structure and its implications. Tellus 59, 261–272. doi: 10.1111/j.1600-0870.2006.00223.x
Vihma, T. (2014). Effects of Arctic sea ice decline on weather and climate: a review. Surv. Geophys. 35, 1175–1214. doi: 10.1007/s10712-014-9284-0
Keywords: interdecadal sea ice increase, the Bering Sea, surface air temperature change, SST change, ice-albedo feedback
Citation: Wu R and Chen Z (2016) An Interdecadal Increase in the Spring Bering Sea Ice Cover in 2007. Front. Earth Sci. 4:26. doi: 10.3389/feart.2016.00026
Received: 25 December 2015; Accepted: 29 February 2016;
Published: 11 March 2016.
Edited by:
Wen Zhou, City University of Hong Kong, Hong KongReviewed by:
Sagnik Dey, Indian Institute of Technology Delhi, IndiaDaoyi Gong, Beijing Normal University, China
Emanuel Dutra, European Centre for Medium-Range Weather Forecasts, UK
Copyright © 2016 Wu and Chen. This is an open-access article distributed under the terms of the Creative Commons Attribution License (CC BY). The use, distribution or reproduction in other forums is permitted, provided the original author(s) or licensor are credited and that the original publication in this journal is cited, in accordance with accepted academic practice. No use, distribution or reproduction is permitted which does not comply with these terms.
*Correspondence: Renguang Wu, renguang@mail.iap.ac.cn