Assessing Homogeneity and Climate Variability of Temperature and Precipitation Series in the Capitals of North-Eastern Brazil
 Stephanie Hänsel1
  Deusdedit M. Medeiros1,2*
  Jörg Matschullat1 Reinaldo A. Petta3
  Isamara de Mendonça Silva4
- 1Interdisciplinary Environmental Research Center, Technische Universität Bergakademie Freiberg, Freiberg, Germany
- 2School of Sciences and Technology, Federal University of Rio Grande do Norte, Natal, Brazil
- 3Department of Geology, Federal University of Rio Grande do Norte, Natal, Brazil
- 4Department of Atmospheric Sciences and Climate, Federal University of Rio Grande do Norte, Natal, Brazil
A 51-year dataset (1961–2011) from nine meteorological stations in the capitals of northeastern Brazil (NEB), with daily data of precipitation totals and of mean, minimum, and maximum temperatures, was statistically analyzed for data homogeneity and for signals of climate variability. The hypothesis was explored that a connection exists between inhomogeneities of the time series and the meteorological systems influencing the region. Results of the homogeneity analysis depend on the selected test variable, the test algorithm, and the chosen significance level; all more or less subjective choices. Most of the temperature series was classified as “suspect,” while most of the precipitation series was categorized as “useful.” Displaying and visually checking the time series demonstrates the power of expertise and may allow for a deeper data analysis. Consistent changes in the seasonality of temperature and precipitation emerge over NEB despite manifold breaks in the temperature series. Both series appear to be coupled. The intra-annual temperature and precipitation ranges have increased, along with an intensified seasonal cycle. Temperature mainly increased during DJF, MAM, and SON, with decreases in JJA being related to wetter conditions and more frequent heavy precipitation events. Drought conditions mostly increased in SON and DJF, depending on the timing of the local dry season.
Introduction
Temperature and precipitation extremes have serious impacts on natural ecosystems and on human society. Related studies of changing extremes received widespread attention within the last two decades. The quality of such studies is often hampered by both temporal and spatial data availability and by a limited quality of many datasets. Such datasets are affected worldwide by inhomogeneities that result from changes in the observational routines. Thus, the reliability of empirical observation data needs to be tested prior to their application and deeper analysis in order to avoid ambiguous trend results. The interpretation of inhomogeneous data may lead to incorrect conclusions, compromising all previous scientific endeavors.
We have studied the homogeneity and trends in selected climate indices of daily temperature and precipitation time series of nine states in north-eastern Brazil (NEB) for the years 1961–2011. The high population density around the state capitals determined the choice of stations. About 73% of the population in NEB lives in the urban areas of its nine capitals (IBGE, 2010). Most people suffer from health issues besides social and economic disequilibria, from floods in periods of intensive precipitation, as well as from serious trouble in times of drought.
Many climatological studies—based on parameters provided by national agencies—exist for South-America and specifically NEB. Studies for NEB include the analysis of rainfall characteristics (Rao and Hada, 1990; Rao et al., 2016), trends of (heavy) rainfall events (Oliveira et al., 2012, 2013; Priscilla et al., 2014), drought and connected vegetation dynamics (Barbosa et al., 2006, 2015; Marengo and Bernasconi, 2015), trends of maximum and minimum temperature (da Silva, 2004), or the tendency of wind speed (Alexandre and Santos e Silva, 2013). Vincent et al. (2005) describe changes in the temperature extremes in South America for the period 1961–2000 that are particularly pronounced for climate indices related to minimum temperature, while those based on maximum temperature reveal no consistent changes. The night-time warming corresponds to a significant decrease in the diurnal temperature range (DTR) over South America; also described by Frich et al. (2002). Haylock et al. (2006) studied changes in total and extreme rainfall over South America within 1961–2000 and described a trend toward drier conditions and less frequent heavy precipitation events in NEB. Current climate models indicate that NEB could be one of the areas most affected by climate change in South America, with simulated rainfall reductions of up to 40% during the twenty-first Century (Marengo et al., 2011; Marengo and Bernasconi, 2015).
Limited information is available on the homogeneity of climatological data series in Brazil, e.g., the work of Roziane et al. (2012) for Minas Gerais state. A combination of statistical methods and methods relying on metadata information is most effective in tracking down inhomogeneities (Wijngaard et al., 2003). Unfortunately, such meta information on meteorological records is often missing, making any evaluation of homogeneity in climatic time series more challenging. The application of absolute homogeneity tests together with the missing metadata limits the distinction between breaks caused by inhomogeneities from those related to climate variations. Therefore, regional climate variations and their relation to the break years, as detected by the homogeneity tests, were also examined.
NEB is characterized by a high space-time variability of precipitation with the largest rainfall totals in the coastal and forest zone (Mata Atlântica) and decreasing rainfall amounts toward the interior. This high space-time variability of rainfall in NEB is connected to the presence and permanence of various meteorological systems, namely the Intertropical Convergence Zone (ITCZ), cold fronts, intense cyclones, easterly disturbance waves, sea and land breezes, southeasterly trade wind, and tropical instability lines (Molion and Bernardo, 2002). These systems have distinct temporal and spatial scales and operate at different parts of the year. In addition, phenomena resulting from ocean-atmosphere interaction significantly affect the amount and the distribution of rainfall in NEB, particularly the El Niño Southern Oscillation (ENSO) with El Niño (EN) and La Niña (LN) events and the Atlantic Ocean dipole (Aragão, 1986, 1990; Uvo et al., 1998; Kayano and Andreoli, 2006; Andreoli and Kayano, 2009).
During El Niño events, the warming of the Equatorial Eastern Pacific Ocean may extend to the central part of the ocean, favoring the emergence of a downward cell over NEB (Walker circulation), inhibiting the formation of clouds and the occurrence of precipitation (Aragão, 1986; Rao et al., 1986; Nobre and Molion, 1988; Grimm et al., 1998; Berlato and Fontana, 2003). Thus, El Niño events are accompanied by a prolonged period without rainfall, and by precipitation totals below the climatological normal (Kousky and Cavalcanti, 1984; Melo, 1999). Normal precipitation totals or those slightly above the climatological normal were observed in the periods of La Niña events, verifying a high space-time variability of rainfall in this region (Diaz et al., 1998; Grimm et al., 1998; Marengo and Oliveira, 1998; Oliveira and Satyamurty, 1998; Berlato and Fontana, 2003). Precipitation in NEB is above the climatological normal in years of a favorable Atlantic Ocean dipole (warmer waters in the tropical South Atlantic Ocean and colder waters in the tropical North Atlantic Ocean; Aragão et al., 1994). On the other hand, an enhanced northward temperature increase in the tropical Atlantic is accompanied by a stronger meridional pressure gradient and an accelerated southerly wind component. The connected northward displacement of the Inner-tropical Convergence Zone (ITCZ) leads to drought conditions in NEB (Hastenrath and Druyan, 1993; Hastenrath and Greischar, 1993; Hastenrath, 2006). Several studies have explored the relation of climate anomalies in the tropical Atlantic with the Pacific El Niño phenomenon and suggested an “atmospheric bridge” (Curtis and Hastenrath, 1995; Hastenrath, 2000). This bridge consists of an upper-tropospheric wave train involving upper-tropospheric divergence and vertical motion over the tropical North Atlantic (Hastenrath, 2006). This affects the surface meridional pressure profile and thus the North Atlantic trade winds. The connected alteration of wind-stress forcing modulates the sea surface temperature (SST) pattern and particularly the interhemispheric thermal gradient, which in turn controls the latitudinal position of the ITCZ (Hastenrath, 2006). Generally, the impacts of the phenomena ENSO and Atlantic Ocean dipole on temperatures are smaller than those observed for precipitation (Repelli et al., 1998). Nonetheless, annual mean temperatures were elevated in El Niño years (Halpert and Ropelewski, 1992; Molion, 1998), while slightly lower mean annual temperatures occur in years of La Niña and Atlantic Ocean dipole, consistent with rising cloudiness in the region.
This study aims at evaluating the quality of daily temperature and precipitation series of NEB capitals and at assessing their suitability for analyses of climate variability and change. Thereby, possible influences of climate anomalies related to circulation anomalies on the identified break points of homogeneity analysis are discussed. Section Material and Methods introduces the study area, datasets, climate, and circulation indices as well as the approach of homogeneity testing. The outcomes of the homogeneity analysis, the seasonal temperature and precipitation cycle and their temporal shifts as well as seasonal climate variability and trends are described in the Section Results. Reliability and consequences of these results are discussed in Section Discussion; followed by a concluding chapter.
Materials and Methods
Study Area and Datasets
The study area NEB (Figure 1) borders the Atlantic Ocean in the north and east. Eight of NEB's nine capital cities are located along the coast: São Luís, Fortaleza, Natal, João Pessoa, Recife, Maceió, Aracaju, and Salvador. Teresina is the only inland capital city, at about 300 km off the coast. NEB lies under the direct influence of the (ITCZ; Coelho et al., 2004). Minor influence occurs from the Amazon Rainforest basin that forms the western boundary of NEB (Cavalcanti et al., 2009). The major dynamic atmospheric systems operating in NEB were reviewed recently by Chaves and Cavalcanti (2001) and Molion and Bernardo (2002).
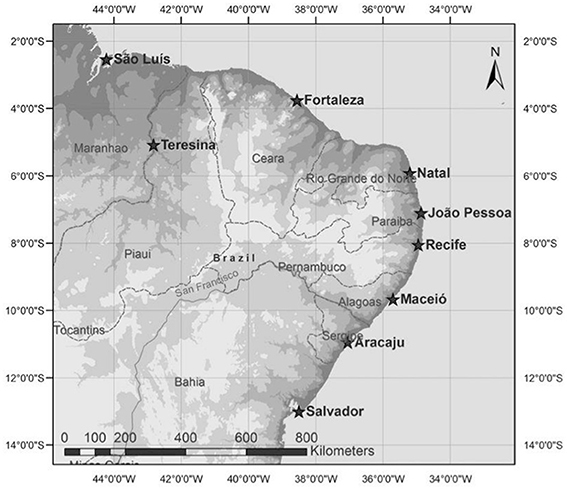
Figure 1. The national states and its corresponding capitals of northeastern Brazil.
The data of daily temperature and precipitation derive from the Meteorological Database for Education and Research (Banco de Dados Meteorológicos para Ensino e Pesquisa, BDMEP) of the National Institute of Meteorology of Brazil (Instituto Nacional de Meteorologia, INMET). The units of temperature and precipitation are degrees Celsius (°C) and millimeters (mm), respectively. Here, data from 1961 to 2011 (51 years) were utilized for seven of the nine cities. Two series start later—Recife in March 1962 and Salvador in July 1963.
The data series were checked for consistency; suspicious daily minimum and maximum temperature values were identified. A graphical analysis of the daily time series by eye and comparisons to other stations helped distinguishing between extreme values connected to climate anomalies (e.g., longer cold or warm spells) and erroneous values that needed to be removed.
Homogeneity Assessment
General Approach
It is common practice to apply statistical methods to climatological observations in order to verify the homogeneity of time series (Wijngaard et al., 2003; Štěpánek et al., 2009), including the development of software (Štěpánek, 2010a1,b2 Relative homogeneity tests that check the series with respect to a supposedly homogeneous station, are generally favored over absolute tests that evaluate a single location only (e.g., Peterson et al., 1998). Such relative tests, which may be applied for sufficiently correlated stations in close proximity are better capable of distinguishing inhomogeneities from real climate variations, but are not capable of dealing with simultaneous changes in the observational routines at both stations (Wijngaard et al., 2003). Absolute tests are required in case of low spatial station density (Wijngaard et al., 2003). Absolute homogeneity tests were applied for our study because of the large distance between the NEB capitals and the absence of reliable long-term observations close to these capitals. The missing reference series renders the interpretation of the homogeneity results more difficult (Haylock et al., 2006).
Various methods are available to evaluate the homogeneity of climate time series in monthly to annual resolution, but well established statistical methods for testing the homogeneity of daily resolution series are rare (Wijngaard et al., 2003). We follow the suggestion of Wijngaard et al. (2003) and compiled an annual resolution set of variables from the daily data set that represents important characteristics of variation at the daily scale. These variables are the annual mean of (1) the DTR and (2) the absolute day-to-day differences of the DTR. The annual mean of average, minimum, and maximum temperatures were additionally tested for homogeneity. Homogeneity of the precipitation time series was tested for the annual precipitation totals. These tests were not only performed for the annual time scale, but also separately for both the rainy season (RS) and the dry season (DS). Four traditional homogeneity tests, developed for monthly, and annual series (Homogeneity Tests), were then applied to the resulting annual data sets. The test results were grouped into three individual classes, based on the number of homogeneity tests that reject the null hypothesis of a homogeneous dataset for a significance level of 1% (Schönwiese and Rapp, 1997; Wijngaard et al., 2003). The alternative hypothesis proclaims that there is a date with a change in the data. In accordance with Wijngaard et al. (2003) these classes are:
Class “useful” (U): None or one test rejects the null hypothesis at the 1% level. Thus, no apparent signal of an inhomogeneity exists and the series are suitable for climate trend analyses.
Class “doubtful” (D): Two tests reject the null hypothesis at the 1% level. This indicates an inhomogeneity with a magnitude exceeding the level of the inter-annual standard deviation of the tested variable series.
Class “suspect” (S): Three or four tests reject the null hypothesis at the 1% level. Inhomogeneity is likely and marginal results of trend and variability analysis should be regarded as spurious (Wijngaard et al., 2003).
After individually testing each of the four temperature variables for homogeneity, their evaluation class (U, D, S) is combined for a final evaluation of the usefulness of the temperature series. The temperature series is useful, if at least three of four variables are useful (4 × U, 3 × U and 1 × D/S). It is classified as doubtful in case of only two variables passing the homogeneity testing (2 × U and 2 × D/S) and suspect with more than two suspect variables. The evaluation of usefulness of precipitation time series is derived analogously from the individual homogeneity assessment of the four tested variables. This integrated evaluation for trend analysis is used for the interpretation of changes in selected climate indices.
The tests cannot always identify the break year correctly, but may differ by a few years. Thus, breaks that differ only by about 1–4 years should be pooled, which has been done in the related figures below.
Homogeneity Tests
Four methods were used to evaluate the homogeneity of the time series (Wijngaard et al., 2003), namely the Pettitt test (Pettitt, 1979), the standard normal homogeneity test (SNHT) for a single break (Alexandersson, 1986), the Buishand range test (Buishand, 1982), and the Von Neumann ratio test (Von Neumann, 1941). The null hypothesis is accepted in all four tests, if the annual values of the test variable are independent and identically distributed. The Pettitt, the Buishand range, and the SNHT assume under the alternative hypothesis that a step-wise shift in the mean occurs. They are location-specific tests and can locate the year where a break is probable (Wijngaard et al., 2003). Although all three tests can generally detect an inhomogeneity in all parts of the time series, the Pettitt and the Buishand range tests are more accurate in discovering break points in the middle of time series (Hawkins, 1977), while the SNHT test works better in the extremes, easily discovering the breaks at the beginning and at the end of the series. Moreover, the principle of the Pettitt test is that it is based on the ranks of the elements of series, while the SNHT and the Buishand range test suppose that the annual values are normally distributed, making the last two tests more sensitive to outliers than the Pettitt test. The Von Neumann ratio test assumes under the alternative hypothesis that the series is not randomly distributed, without indicating the timing of the break. Thus, this test is not location specific. It completes the others, because it is sensitive to other kinds of deviation from homogeneity than strict step-wise shifts (Buishand, 1981, 1982).
The Pettitt test is a nonparametric test, based in ascending order (ri) of rank of the n elements in the series (Pettitt, 1979). The test considers that
Beyond that, when a break takes place in year t, the statistics of Pettitt test is determined by
The SNHT is defined as (Alexandersson, 1986)
where k is more probable to be the year for the break (matching to the maximum Tmax), is the mean of the series before the shift k, and is the mean of the series from k+1 to n.
If Y1, Y2, ⋯ , Yn is an annual series, with being the mean, the Buishand test for homogeneity is based on the adjusted partial sums (Buishand, 1982), such that
When k = n, , then will float around zero if the series is homogeneous, and there is no systematic pattern in the deviations of the series components from their mean. achieves also an extreme (maximum or minimum) near the year k whenever a break is found on this k.
Lastly, the von Neumann ratio N (Von Neumann, 1941) is defined by
where is the average of the series.
All analysis was performed with the software R3 and XLSTAT4.
Analyzed Variables
To obtain a better quality with respect to the sensitivity of the homogeneity tests, we examined two characteristics of the DTR, the numerical difference between the observed minimum and maximum values. We computed the DTR annual mean (mDTR; Heino et al., 1999) and the annual mean of the absolute day-to-day differences (vDTR; Sparks, 1972). This allows encountering breaks for the DTR tests that are barely visible in the minimum and maximum temperature series, or do not appear in mean temperature series. More precisely,
where DTRi is the DTR for day i in a specific year, and M is the number of days in that year. The mDTR and vDTR units were expressed in °C and °C/day, respectively.
Besides mDTR and vDTR, we considered the annual mean maximum temperature (mTX), and the annual minimum temperature mean (mTN) in our study. In addition to the annual values, all parameters were analyzed for two sub-intervals. These were defined as the half years with more frequent precipitation (rainy season, RS) and lesser precipitation intensity (dry season, DS). RS prevails from January to June in the cities of northern NEB (São Luís, Teresina, and Fortaleza), and DS dominates from July to December each year. The RS starts in March and ends in August of the same year in the capitals of eastern NEB (Natal, João Pessoa, Recife, Maceió, Aracaju, and Salvador), while the DS occurs from September to February of the following year. In this latter coastal strip, we also checked the annual precipitation behavior, with the respective hydrological year (HY) starting in March and ending in the subsequent February. For precipitation, we examined the four tests in the yearly, RS, DS, and HY periods, through the PREC, PREC Rainy, PREC Dry, and PRECHY parameters.
Climate Indices
Temperature and precipitation variability were explored via indices (Table 1). Most indices derive from the World Meteorological Organisation (WMO; Klein Tank et al., 2009) and the European Climate Assessment and Data set (ECA&D, 2013) with some modifications and extensions. Thereby, we used percentile-based and fixed thresholds for the identification of moderately extreme temperature and precipitation conditions. Thresholds based on percentile values allow for a comparative evaluation of seasonal characteristics over diverse geographical locations (Shevchenko et al., 2014; Lhotka and Kyselý, 2015), while fixed thresholds help understanding regional climate characteristics (Kyselý, 2002, 2010).
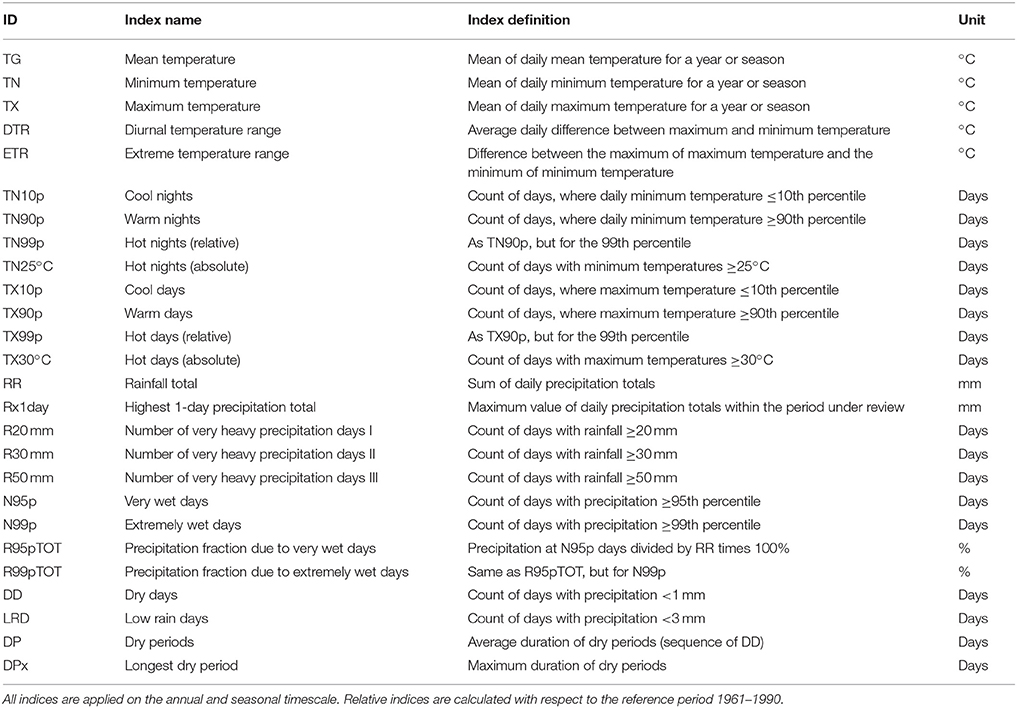
Table 1. Description of temperature and precipitation indices.
ENSO Indices
Two indices characterize El Niño Southern Oscillation (ENSO), the standardized Southern Oscillation index SOI5 (Trenberth, 1984), and the Multivariate ENSO Index MEI (Wolter and Timlin, 2011). The standardization of the SOI (Standardized Tahiti—Standardized Darwin) uses the approach outlined by Trenberth (1984) to maximize the signal. The MEI integrates more information (sea-level pressure, zonal and meridional components of the surface wind, sea surface and surface air temperature, and total cloudiness fraction of the sky) than other indices. Thus, it probably better reflects the nature of the coupled ocean-atmosphere than each individual component.
Results
Homogeneity Assessment
Table 2 presents the results of homogeneity testing for the nine capitals in NEB including the identified break years. Several potential break years were identified for the four temperature-related variables at each station. Thus, most temperature series were classified as “suspect.” The rainfall-related variables only rarely show significant breaks and thus the rainfall series are mainly classified as “useful.” There are five periods, where most of the identified break years occur (Table 2 and Figures 2–4):
• 1968–75 (Teresina, São Luís, Natal, João Pessoa, Recife, and Maceió)
• 1978–82 (Teresina, São Luís, Recife, Maceió, and Aracaju)
• 1985/86 (Fortaleza, Natal, João Pessoa, Maceió, Aracaju, and Salvador)
• 1988–94 (all NEB capitals except Maceió)
• 2000–06 (São Luís, Aracaju, and Salvador)
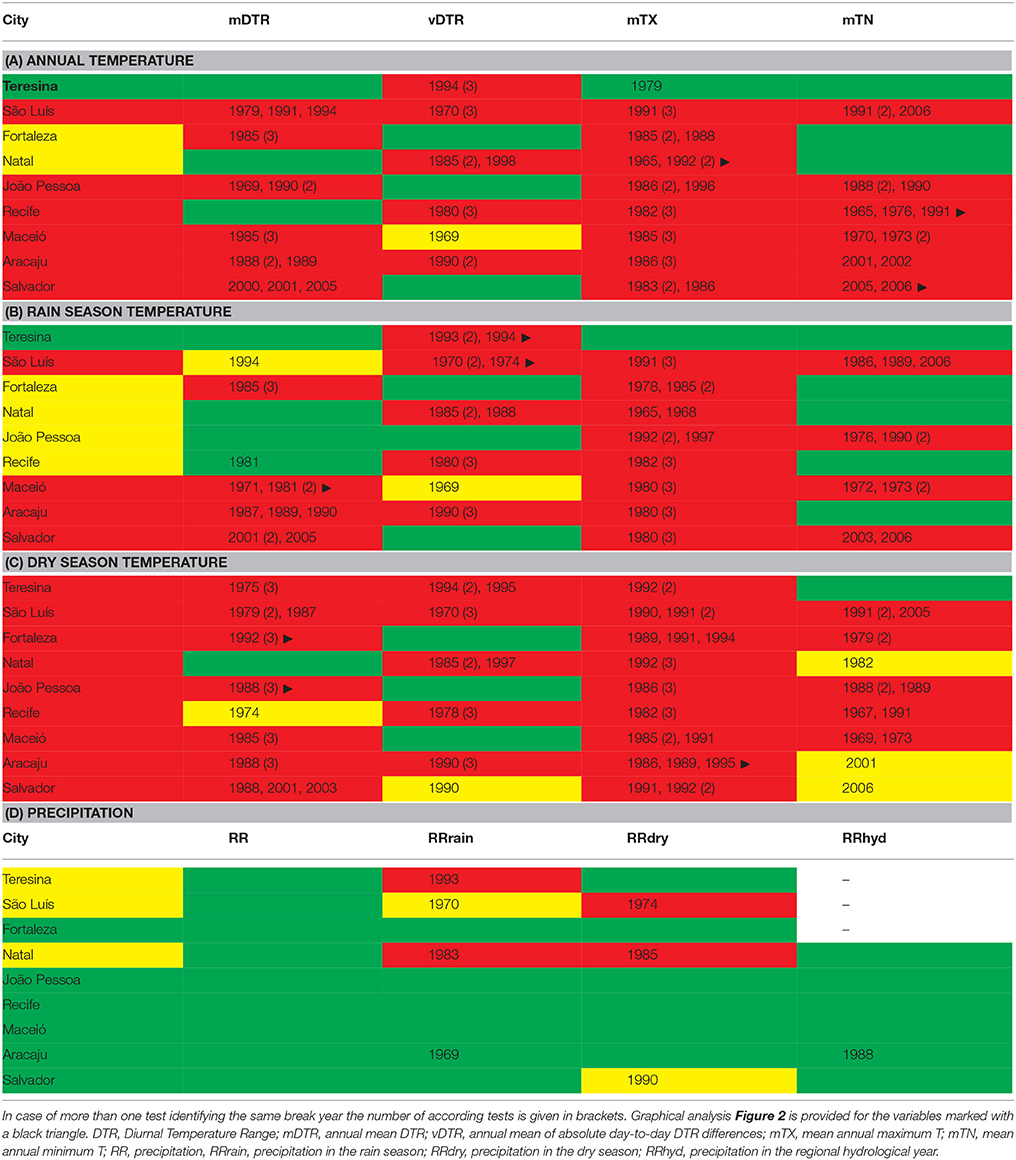
Table 2. Break year identified by the homogeneity tests for (A) yearly, (B) rain season, and (C) dry season temperatures as well as (D) precipitation totals including homogeneity classification (green, useful; yellow, doubtful; red, suspicious).
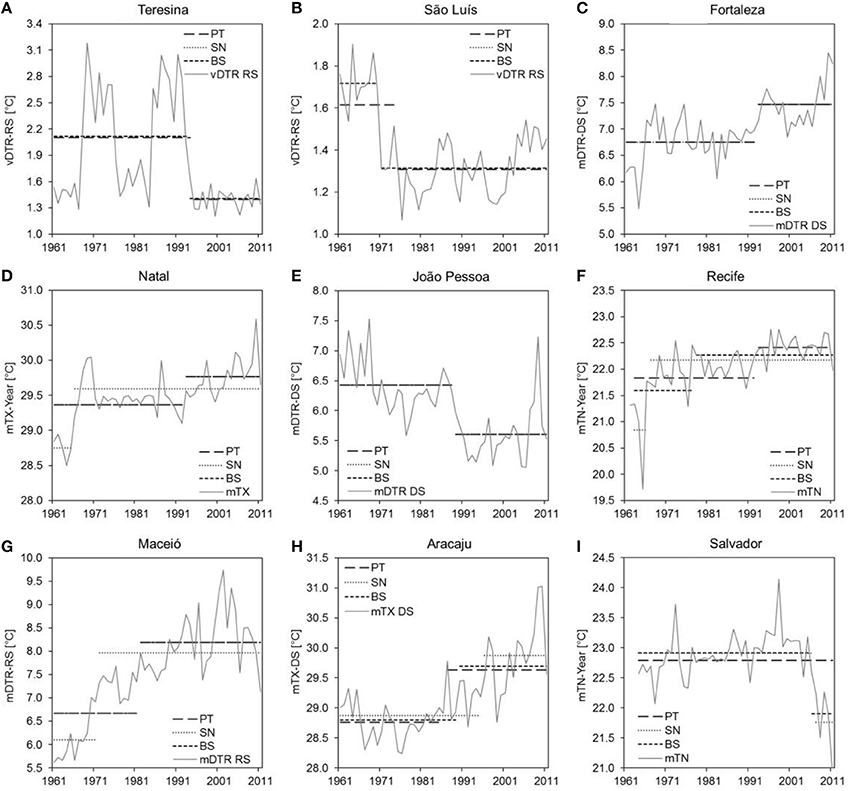
Figure 2. Exemplary results of the homogeneity testing for the three tests (PT, Pettitt test; SN, Standard normal homogeneity test SNHT; BS, Buishand test) for (A) vDTR-RS (RS: rain season) at Teresina, (B) vDTR-RS at São Luís, (C) mDTR-DS (DS: dry season) at Fortaleza, (D) mTX at Natal, (E) mDTR-DS at João Pessoa, (F) mTN at Recife, (G) mDTR-RS at Maceió, (H) mTX-DS at Aracaju, (I) mTN at Salvador.
The display of the monthly time series (12 month moving average) of daily minimum and maximum temperature as well as daily precipitation totals in Figure 3 illustrates several additional suspicious time-series characteristics. For instance, several periods with unrealistically low inter-annual variability in minimum (TN) and maximum temperature (TX) as well as precipitation (RR) occur at the following stations:
• São Luís: 1961–70 (all)
• Teresina: 1968–75, 1985–92 (all)
• Fortaleza: 1986–93 (all)
• Natal: 1972–82 (all)
• Maceió: 1972/73 and 1982–84 (all); 1982–1993 (TN)
• Aracaju: 1977–86 (TN)
• Salvador: 1881–86 (all)
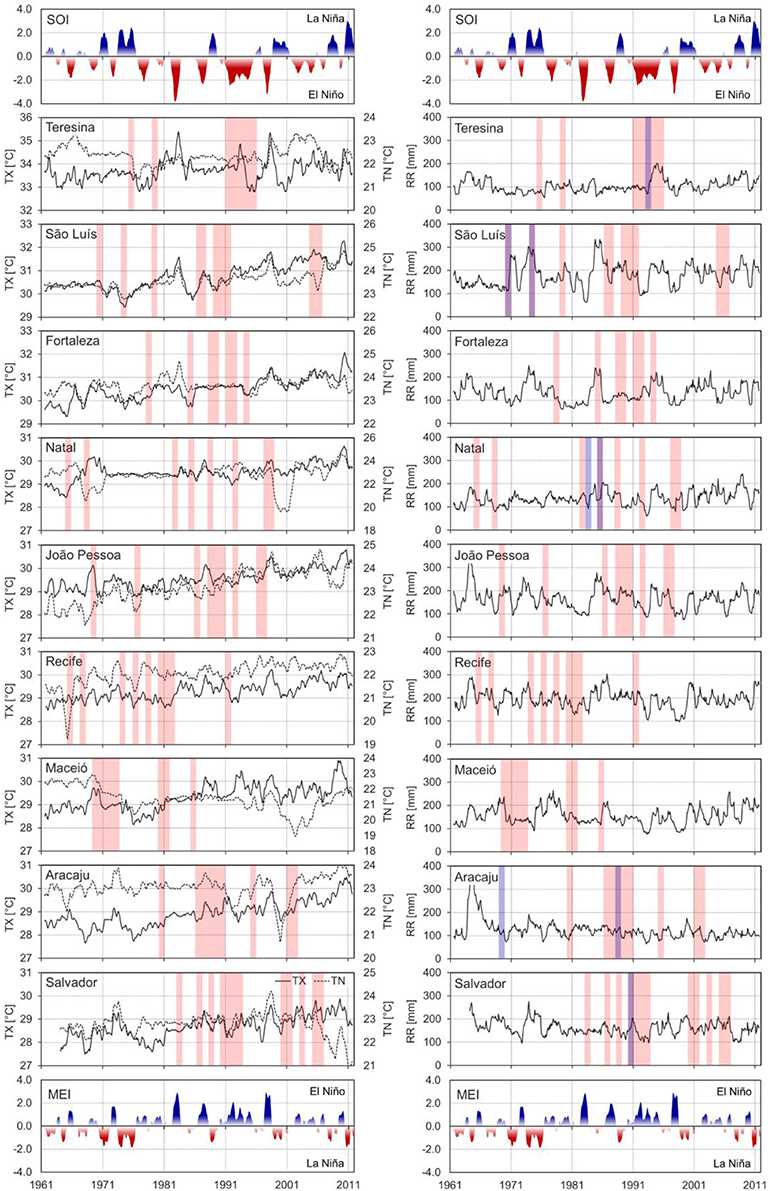
Figure 3. Time series (12-month moving average) of temperature (TN: minimum and TX: maximum; left) and precipitation (right) at nine stations in NEB within 1961–2011 in comparison to two indices representing the El-Nino-Southern Oscillation. Break years as identified by the homogeneity tests are indicated by vertical bars [red for the tested temperature indices (left) and blue for precipitation (right; those of temperature are additionally given in red)].
This shows an arbitrary distribution, suggesting erratic and non-systematic errors or inconsistencies in data acquisition. Furthermore, there are unrealistically low values of TN in 1964 and between 1999 and 2001 at Aracaju station and exceptionally high rainfall totals in 1964/65 at João Pessoa station (values three/two times higher than normal) that potentially bias calculated climate trends.
More homogeneity tests identified possible break years for variables related to dry season temperature (73% of all tested series) as compared to the annual (68.5%) or wet season (59%) temperature. Almost all tested time series of maximum temperature exhibit a pronounced break (91%), while the other temperature variables show less jumps (TN: 52%, mDTR: 67%, vDTR: 58%; Figure 4). São Luís is the station with the highest percentage of positive (indicating a break) homogeneity test results (96%). Still 54% of the tests indicated jumps in the “best” temperatures series at Teresina. The Von Neumann ratio test was the most sensitive at the significance level of 0.01 with regard to the four homogeneity tests. It indicates breaks at 90.7% of all tested temperature series, while the SNHT for a single break identified significant jumps in 65.7% of the series. The other two tests had only slightly higher percentages of inhomogeneous series as compared to SNHT (Pettitt test: 69.4%; Buishand range test: 68.5%; Figure 4). All tests detect many breaks in the middle of the time series—around the years 1980, 1985, and 1991. Nonetheless, there are distinct differences in the identified break years between the tests (see Figure 2) with the SNHT additionally identifying frequency jumps at the beginning (1971) and end (2005) of the time series.
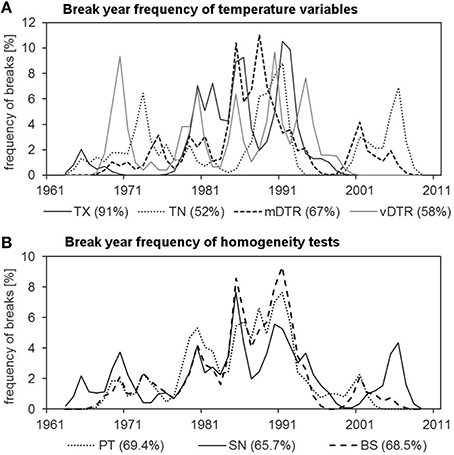
Figure 4. Illustration of the frequency of break years within 1961–1990 for (A) the four analyzed variables TN, TX, mDTR, and vDTR and (B) for the conducted homogeneity tests (PT, Pettitt test; SN, Standard normal homogeneity test SNHT; BS, Buishand test). The percentage of tested data series with breaks is given in brackets.
Changes in the Seasonal Cycle of Temperature and Precipitation
We are using a 31-day moving-window approach for our analysis of the seasonal cycle and observed changes between the periods 1991–2011 and 1961–1990 (Figure 5). This approach provides additional information on the timing of the wet and dry seasons and changes in their timing (Table 3) as compared to most other studies using monthly averages or totals (e.g., Rao and Hada, 1990; Rao et al., 2016). Additionally, the three consecutive months with the highest/lowest temperature averages and precipitation totals, respectively, were analyzed (Table 4) in order to ensure the comparability to other studies determining the dry and wet season based on the 3-month precipitation totals.
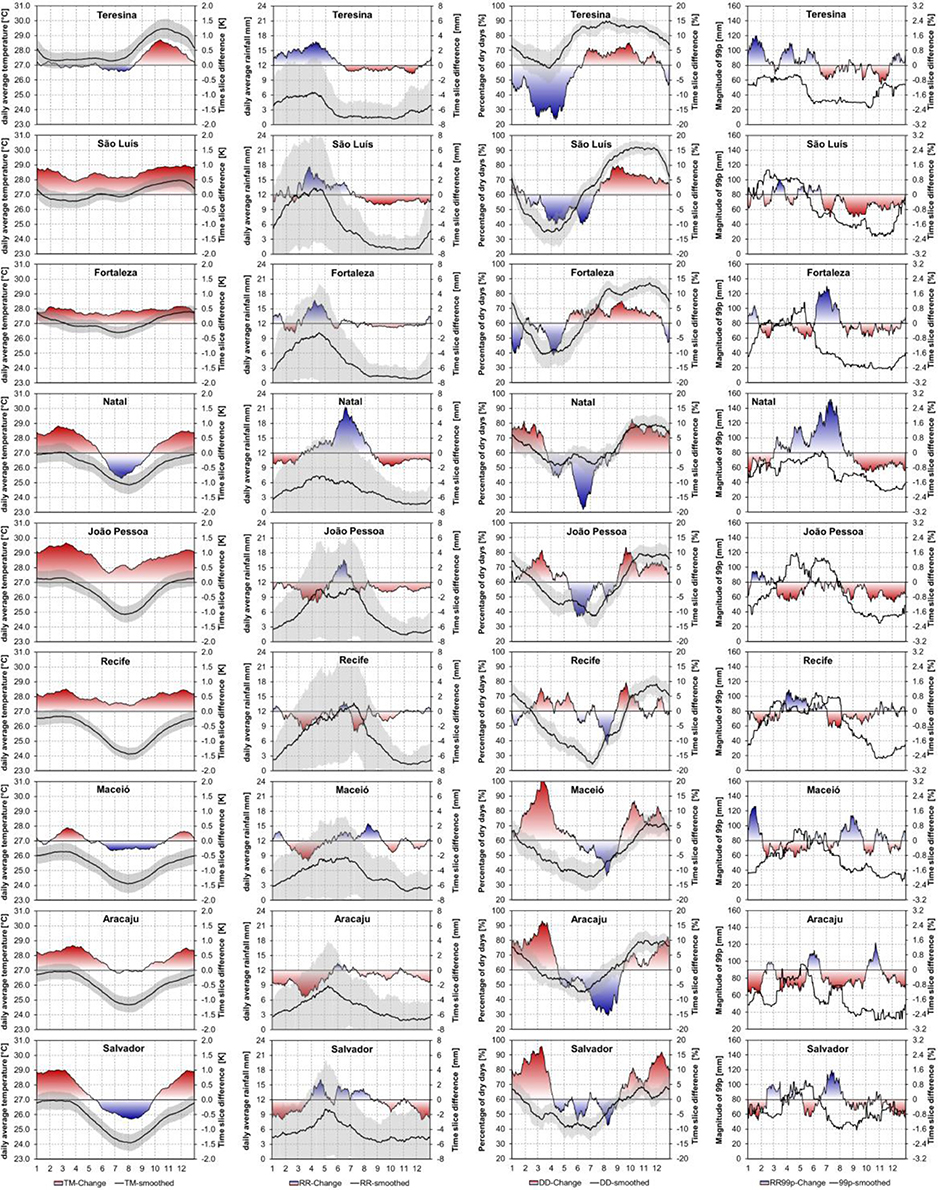
Figure 5. Seasonal cycle of low-pass filtered (31-days moving average) daily average temperature (TM, first row), precipitation (RR, second row), dry day (DD, third row), and heavy precipitation (99th percentile, fourth row) frequency at nine stations in NEB within 1961–1990 as well as change in the seasonal cycle in 1991–2011 as compared to 1961–1990. Gray shaded areas indicate the temporal variability (standard deviation) of TM, RR, and DD.

Table 3. Characteristics of the seasonal cycle [Min, lowest value; Max, highest value; Av., Average; Δ, Annual spread (Max minus Min) of the respective variable] of daily mean temperature and precipitation as well as dry day frequency (based on the 31-day centered moving average approach illustrated in Figure 3) within the two periods P1 = 1961–1990 and P2 = 1991–2011 and for the time slice difference (TSD: P2 minus P1).
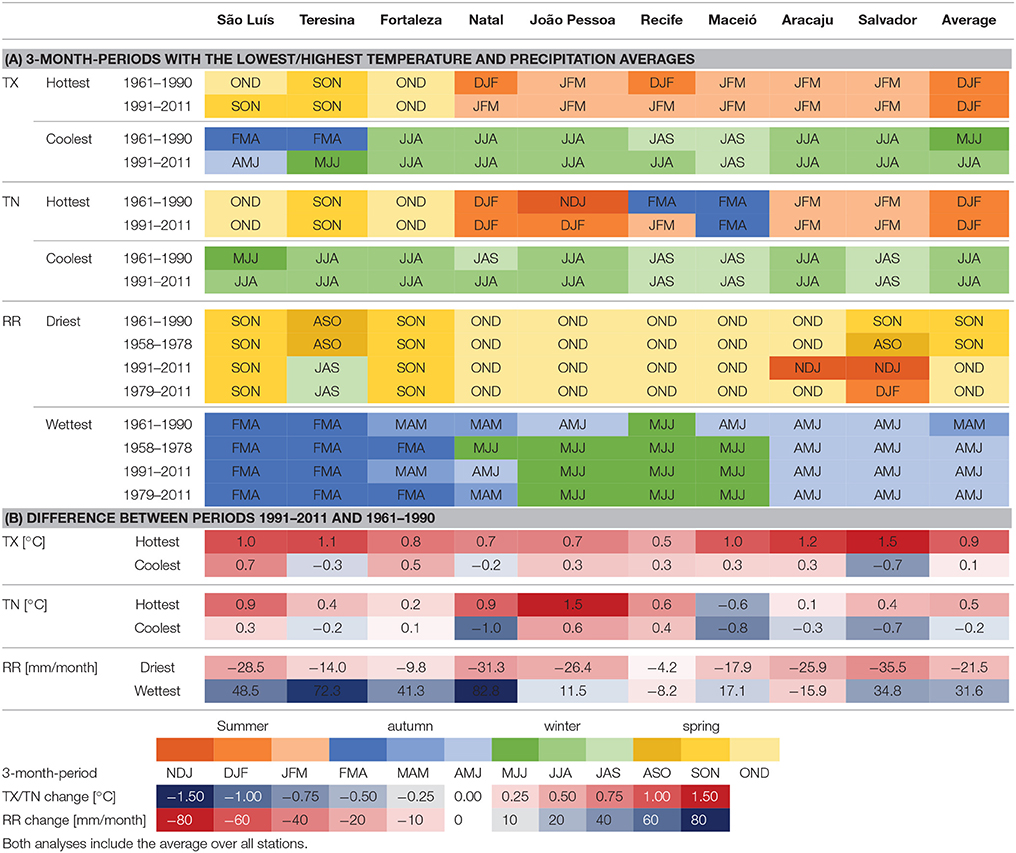
Table 4. (A) Comparison of the timing of the 3 months with the lowest/highest temperature (TX, maximum temperature; TN, minimum temperature) and precipitation (RR) average within the analysis periods 1961–1990 and 1991–2011; for precipitation the results are also compared to those of the studies by Rao and Hada (1990) for 1958–1978 and by Rao et al. (2016) for 1979–2011; (B) Changes in the average values in period 1991–2011 as compared to 1961–1990 for the respective 3-month periods with the lowest and highest values.
Temperature
The intra-annual temperature variability in the study area is very low. Only slight temperature variations, on average 1.3°C (São Luís) to 2.4°C (Recife) occurred over the year at all stations (Figure 5, column 1; Table 3). The data quality of the series is sufficient to distinguish three types of seasonal temperature cycle in NEB. The only inland station Teresina showed the highest mean temperatures—with the lowest values of about 27.5°C from January to July and the highest temperatures in October (29.1°C). The two northern coastal cities São Luís and Fortaleza displayed slightly lower intra-annual temperature variability (26.2–27.6°C) with the highest values from November to December. The other capitals at the eastern coast were very similar in their seasonal temperature cycle with the highest temperatures between 26.2°C (Maceió) and 26.8°C (João Pessoa) from December to March and the lowest values between 24.0°C (Recife) and 25.1°C (Natal) in July or August.
Distinct changes in the seasonal temperature cycle were identified (Figure 5), despite the problematic of possible inhomogeneities in the temperature series. Temperature has been increasing strongest within 1991–2011 during those times of the year with the highest intra-annual temperatures within 1961–1990. However, temperature increases were lower and temperature decreases occurred in periods of the lowest temperature. Thus, the annual spread between the lowest and the highest mean temperature increased over the entire region by 0.3 K (Fortaleza) to 1.8 K (Natal; Table 2). This equals a percentage increase in the annual temperature range by 20 up to >100%.
Temperature increased over the entire year by around 0.4 K at Fortaleza and by about 0.5–1.0 K at São Luís, while temperature increases at Teresina only occurred from September to December with the most pronounced increases (up to 0.9 K) in October (Figure 5). Temperature increases at the eastern coastal capitals were highest mainly between October and April with the lowest increase at Maceió (0.2 K) and the highest at João Pessoa (1.1 K). Temperature decreases (−0.1 to −0.7 K) were mainly observed at Natal, Maceió and Salvador between June and September (Table 3).
The timing of the highest mean temperatures during the year shifted to later months (Dec/Feb → Mar; Jan → Feb) at the southern coastal stations, while the timing of the minima is less affected (except for Teresina and São Luís showing a delay in the lowest values, Feb → Jun/Mar; Table 3). The analysis of 3-month periods with the highest/lowest minimum and maximum temperatures shows that the highest temperatures are on average reached during summer (DJF) with slightly earlier dates (OND) in the North and slightly later dates (JFM) in the South (Table 4). The winter season (JJA) is on average the coolest 3-month period with considerably earlier dates (FMA) for the maximum temperatures at Teresina and São Luís.
Only slight changes in the timing of the hottest and coolest months, respectively, are visible between the periods 1991–2011 and 1961–1990 (Table 4). The differences in the magnitude of the average maximum and minimum temperatures during these 3-month-periods are much more pronounced. The strongest temperature increases are visible for 3 hottest months according to the average maximum temperatures (+0.9 K on average over all stations; between +0.5 K at Recife and +1.5 K at Salvador). The 3 hottest months (based on nighttime temperatures) warmed less distinctively at most stations (+0.5 K average over all stations; between −0.6 K at Maceió and +1.5 K at João Pessoa), except for João Pessoa and less distinct for Natal and Recife. The 3 coolest months generally show smaller changes in the averages of maximum and minimum temperatures. At some stations even temperature decreases were observed in 1991–2011 as compared to 1961–1990 (TX: −0.7 K at Salvador to +0.7 K at Teresina; TN: −1.0 K at Natal to +0.6 K at João Pessoa).
Precipitation
Precipitation totals
The seasonal cycle of precipitation and its changes from period 1961–1990 to period 1991–2011 was analyzed by calculating the average daily precipitation totals using a centered 31-day moving window (Figure 5, second column) and by comparing the 3 months with the highest and lowest precipitation totals (Table 4).
The highest intra-annual ranges of average daily precipitation totals (about 12.5 mm; Table 3) within the period 1961–1990 occurred at São Luis [0.9 mm (Oct) to 13.4 mm (Apr)] and at Recife [1.3 mm (Nov) to 13.7 mm (Jul)], while they are lowest (about 5.5 mm) at Teresina [1.2 mm (Oct) to 6.6 mm (Mar)] and Natal [1.6 mm (Nov) to 7.4 mm (Apr)]. At the three southernmost costal stations Maceió [1.8 mm (Nov) to 8.7 mm (Jun)], Aracaju [1.8 mm (Oct) to 8.9 mm (May)], and Salvador [3.4 mm (Sep) to 10.1 mm (May)] the intra-annual precipitation variability barely reached 7 mm.
There were distinct differences in the seasonal precipitation cycles between the northern and the south-eastern stations. Rainfall was highest between January and April at Teresina and between January and June at São Luís and Fortaleza (Figure 5). The other six stations showed the highest precipitation totals between March and July with a particularly pronounced maximum in April and May at the two southernmost stations Aracaju and Salvador, and broader maxima stretching from April to July at Natal, João Pessoa, Recife, and Maceió.
Daily precipitation totals increased mainly during the rainy season at the three northern stations in 1991–2011 with respect to the reference period 1961–1990 (Figure 5). The increases ranged around 2 mm from January to May at Teresina (+37%) and from March to April at São Luís (+18%) and Fortaleza (+19%). The decreases during the dry season were smaller in absolute (−0.5 to −1.5 mm), but not in relative numbers (−31% at Teresina for Jun–Nov; −67% at São Luís for Aug–Dec; -26% at Fortaleza for Aug–Nov). Precipitation mainly decreased during the dry season at the south-eastern stations (Natal: −45% for Sep–Feb; João Pessoa: −43% for Sep–Dec; Recife: −21% for Sep–Oct; Maceió: −19% from mid Sep. to mid Dec; Aracaju: −36% for Sep–Feb; Salvador: −32% for Oct–Feb). Additional precipitation decreases during the rainy season were observed at João Pessoa (−23%), Recife (−16%), Maceió (−24%), and Aracaju (−41%) in March and April. The strongest precipitation increases in 1991–2011 as compared to 1961–1990 occurred at Natal in June and July (approx. +4 mm daily precipitation total; +73%). Distinct precipitation increases were also observed at João Pessoa from mid-May to June (+16%), at Maceió in August (+38%) and at Salvador in April (+23%) as well as June to mid-August (+20%).
Consistent shifts are neither visible in the timing of the highest intra-annual precipitation totals nor in the dry day frequency minima and maxima (Table 3). The timing of the lowest daily precipitation total has a tendency of shifting to earlier dates in northern and central NEB (Teresina, São Luís, Natal, Recife) and to later dates at the southernmost stations (Maceió, Aracaju, Salvador). These results are generally confirmed by the analysis of 3-month-periods with the highest and lowest precipitation totals (Table 4).
The wet/dry season rainfall totals for the 3-month periods with the highest and lowest rainfall amounts, respectively, mainly increased/decreased from period 1961–1990 to 1991–2011 (Table 4). Those increases in wet season rainfall are most pronounced at the northernmost stations (São Luís, Teresina, Fortaleza, and Natal). Decreases in dry season rainfall are least pronounced at Fortaleza and Recife. The increases in wet season and decreases in dry season rainfall amounts lead to a larger intra-annual spread between the highest and lowest precipitation amounts. This trend is also visible in the analysis of the seasonal cycle of daily precipitation totals. The intra-annual spread has increased at the majority of stations, except for Recife (Table 3), ranging from 0.6 mm (Aracaju) to 5.8 mm (Natal).
Dry days
The seasonal cycle of dry days and its respective changes between the periods 1991–2011 vs. 1961–1990 are illustrated in Figure 5 (third column) by calculating and comparing the average frequency of dry days within a centered 31-day moving window. The driest conditions occurred at the inland station Teresina with a pronounced dry season from June to October and an average dry-day frequency of 80–90%. The dry-day frequency still averaged around 60–75% even during the rainy season, with a lowest value of 58% in March (Table 3). The dry-day frequency at São Luís and Fortaleza ranged around 75–90% during the dry season (August to December) and around 35–50% during the rainy season. The dry-day frequency at the other stations averaged between 60 and 80% during the dry season (October–January) and reached the lowest numbers between May and July [from 24% (Jul) at Recife to 45% (Jun) at Aracaju].
The frequency of dry days particularly increased during times of the year with decreasing precipitation totals and decreasing frequency of heavy precipitation events. The increase in dry-day frequency by about 5% during the dry season (Jun–Nov) at Teresina is meaningful since the dry-day frequency was already very high during this time of the year (on average 86%). The trend toward drier conditions in the dry season was even more pronounced at São Luís, where 5–10% add up to an average dry-day frequency of about 90%. Similar observations of increasing dry period frequencies during times of precipitation decrease were made for the other stations. A pronounced decrease in dry-day frequency in July and August (-22%) was observed at Aracaju, although precipitation slightly decreased (−8%) during these months. Decreases in dry period frequency were also observed at the neighboring stations Recife, Maceió and Salvador; this coincided with a slight precipitation increase at Maceió (+24%) and Salvador (+15%). The most pronounced dry-day frequency increased by 10–20% at the three southernmost coastal stations Maceió, Aracaju, and Salvador in March; which is normally a transitional month from the dry to the rainy season (with average dry-day frequencies between 45 and 65%). This may indicate a shift in wet season timing.
The intra-annual spread between the highest and lowest dry-day frequency increased in accordance with the described increase in the range of daily precipitation totals (Table 3). The increases ranged from 1% (Recife) to 23% (Natal). Increases in the intra-annual dry-day frequency spread mainly due to decreasing minimum values during the rainy season at Teresina, Fortaleza and Natal, while they are mainly due to increasing maximum values during the dry season at Maceió and Salvador.
Heavy precipitation
The annual cycle of the magnitude of heavy-precipitation events was similar to the one of precipitation totals with the strongest heavy precipitation events during the rainy season. We illustrate the seasonal cycle of the 99th percentile in the reference period 1961–1990 and the changes in the exceedance frequency of this percentile threshold between period 1991–2011 and the reference period (Figure 5, fourth column). The seasonal cycle of the 99th percentile as well as the change signals between the two time slices is much noisier than those of precipitation totals and of the 95th percentile (without display), as singular events may strongly influence the characteristics of the two compared time slices.
Seasonal Changes in Climate Indices
Seasonal climate trends, using a selection of 13 temperature and precipitation indices each (Table 1), were studied next. We relate these results to the already presented changes in the seasonal cycles of mean air temperature, mean daily precipitation, dry-day frequency, and the frequency of very heavy precipitation events above the 99th percentile. The studied climate indices mainly represent extreme temperature, precipitation and drought conditions, complementing the analysis of mean climate changes. Linear trends were computed for the entire period 1961–2011, as well as for five different sub-periods of 30–41 years duration (1961 to 1990/2000, 1971 to 2000/2011, and 1981 to 2011). The comparison of trend direction and magnitude between the six trend analysis periods allows (1) to evaluate the temporal stability of the trends and (2) to include the results of the homogeneity assessment in Section Homogeneity assessment. Trends for (sub-)periods that were assessed to be severely corrupted by non-climatic causes are marked by white hatching of the according cells in Figure 6—slightly fading out the less reliable trend results, but still allowing a comparison to the more reliable trend values.
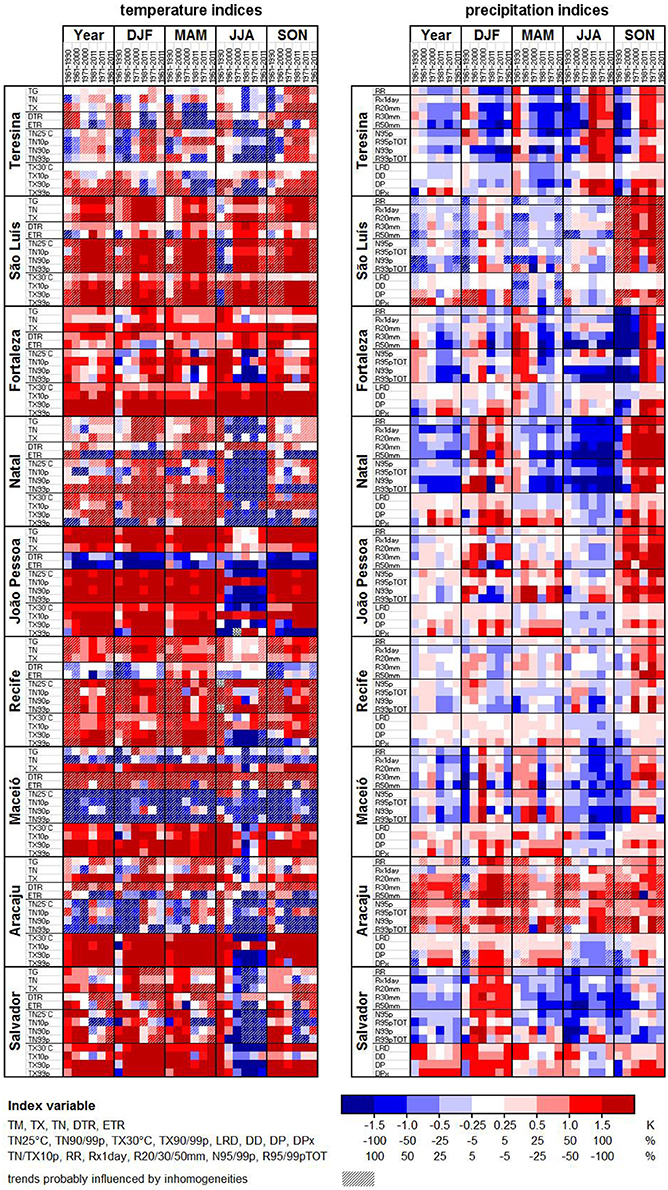
Figure 6. Annual and seasonal trends in 13 temperature (left) and 13 precipitation (right) indices (see Table 1 for index explanation) for six analysis periods of 30–51 years duration (sub-columns of the season columns: 1961–1990/2000/2011, 1971–2000/2011, 1981–2011) at nine stations in NEB. The trend values are illustrated by a color scale (see legend) from blue (colder, wetter) over white (no change) to red (warmer, drier). Trends assessed to be unreliable due to data quality problems are faded out by white hatching.
Temperature Indices
The changes in average temperature, visible in the time slice comparison of the seasonal cycle (Figure 5), also show themselves in the linear regression analysis of 13 extreme temperature indices (Figure 6). Increases in their index values dominate at most stations over the entire year and during all seasons except for the austral winter season (JJA). These increases are particularly pronounced for the periods starting 1971 and 1981 and for indices connected to maximum temperature. Generally, the trends strongly depend on the analysis period, which may either be related to the occurrence of climate anomalies or to inhomogeneities in the time series. Trends for the period 1961–1990 particularly differ from those of other periods. This is probably a real signal as it is visible at more or less all sites independent of individual break points. Strong decreases in indices, connected to minimum temperature, were calculated for Aracaju and Maceió, also influencing the DTR and ETR trends. The temperature records of both stations suffer from manifold break points in the homogeneity analysis that are unlikely related to purely climatic anomalies. The ETR trends are often similar to those of DTR, but the general reliability of the trends is probably low due to frequent inhomogeneities in minimum temperature. Increasing trends in DTR and ETR prevail at the two northern coastal stations São Luís and Teresina, while decreases were observed for João Pessoa (all seasons) and Recife (except MAM).
Precipitation Indices
With a few exceptions, the trends in indices related to heavy precipitation and to drought conditions follow the trends of precipitation totals (Figure 6). The different heavy precipitation indices often have the same trend direction and a similar magnitude. The choice of the threshold for defining a (comparatively) dry day [1 mm (DD) vs. 3 mm (LRD)] also has little influence on the calculated trends.
Increasing heavy precipitation trends (and decreases in drought related indices) were mainly observed in JJA (most pronounced at Natal, Maceio, Salvador) and in MAM (São Luis, Teresina, Natal), while increasing drought conditions (and less heavy precipitation events) were calculated mainly for SON (particularly São Luis, Natal, João Pessoa) and DJF (Natal, João Pessoa, Salvador). Aracaju is the only station with negative heavy precipitation trends in all seasons and most analysis periods, while dry days became less frequent and dry periods became shorter in JJA.
Discussion
Assessment of Data Quality and Homogeneity
Non-climate factors interfering with the inter-annual climate variations produce breaks and compromise the climate-series homogeneity. Such non-climatic reasons involve the misuse or lack of instrument calibration, incorrect measurements, changes in vegetation cover, and the location of instruments in or near urban areas (Aguilar et al., 2003; Brunet et al., 2006). Thus, homogeneity testing is needed to ensure that trends in climate variables are related to climate variability and change and not to inhomogeneities in the series. The small intra-annual temperature range in this tropical region strongly influences the homogeneity analysis and probably leads to the detection of several breaks that are related to climate variability and change and not to non-climatic reasons.
The identified break years in the temperature series are assumed to be years of rupture, when all homogeneity tests (Pettitt, SNHT, and Buishand) detect the same break year and when the Von Newmann test indicates an inhomogeneity. This applies to the years 1970, 1975, 1985, 1991/92, 1994, and 2006 for the north of NEB (São Luís, Teresina, Fortaleza, Natal); and the years 1978–83, 1985/86, 1988, 1990, and 1992 for the east of NEB (João Pessoa, Recife, Maceió, Aracaju, Salvador). Unfortunately the Von Neumann ratio test does not indicate the years, when a jump occurs. Thus, several possible break years might have been missed.
The visual inspection of the variables tested for homogeneity, and the monthly resolved time series of yearly (calculated with a 12-month moving average) minimum and maximum temperature as well as precipitation averages, indicate more suspicious features in the time series (Figure 3), as the homogeneity tests suggest (Section Homogeneity Assessment). The identification of short (several years) anomalies (jumps to another level and back or decreased temporal variability) is particularly problematic. The homogeneity analysis was done only once for the entire time series; identifying the most pronounced discontinuity in the data only (Figure 2). Repeating the tests for the resulting two time series would probably lead to the identification of more visible breaks in the time series. Furthermore, the chosen significance level of the homogeneity tests (α = 0.01) influences the number of detected break points. A higher significance level (α = 0.05) would be connected with a considerably higher amount of potential break points.
The periods of unrealistically low intra and inter-annual variability in temperature and precipitation that were detected at seven out of nine stations during very different times are probably connected to inconsistencies in data acquisition. Thus, the study of variability changes in temperature and precipitation is restricted, and particularly the trends of the DTR and ETR indices are probably influenced by non-climatic causes. The trends of the other indices are likely less affected since the average of the variables is at a realistic level. The homogeneity tests detected several, but not all of the start and end points of lower variability visible in Figure 3.
The low minimum temperatures at Aracaju and the extremely high precipitation totals at João Pessoa in 1964 seem to be unrealistic, although this year has been an extremely wet year in NEB (e.g., Rao et al., 1995). These values furthermore strongly influence the trend analysis, as they are located at the very beginning of the time series. Thus, the trends at these stations calculated from 1961 are not reliable, because they are probably biased by these events. We therefore focus on periods starting after the 1960s in our assessment of climate trends based on these stations.
The homogeneity results were influenced by the temporal variability of the tested parameters. The inland station Teresina is the only one that was classified as useful for temperature analysis, but the visual analysis shows that this series is affected by many inconsistent features like periods of unusually low temporal variability or changes in the relation of minimum and maximum temperature. Visually, this series is not better than the one from São Luís with the highest number of tests indicating a break. Other stations—classified as “suspect”—seem much more reliable for climate trend analysis than the “useful” series of Teresina. This may be connected to the higher continentality at Teresina, leading to higher natural temperature variability masking potential inhomogeneities: The Von Newmann ratio test indicates inhomogeneous behavior at 11 out of 12 tested temperature variables and seems to be more appropriate for the evaluation of homogeneity in this case. Using a significance level of 0.05 instead of 0.01 would increase the percentage of tests indicating a break from 54 to 73%, resulting in the classification as “suspect.”
The more frequent detection of break years in the analyzed temperature in comparison to the precipitation variables is also connected to the much higher temporal variability of precipitation relative to temperature. This high natural variability tends to mask possible inhomogeneities in the precipitation time series. Most of the identified breaks in the temperature series relate to maximum temperature. Visually, the minimum temperature series seem to be more affected by features inconsistent with climatic reasons. The DTR is affected in both cases. Recent examples of potential inhomogeneities are (a) the shift from manual thermometers to electronic sensors, (b) urban heat island effects due to growing cities, and (c) the relocation of stations from city centers to airports. Both urban heat island effects and relocations to airports have stronger effects on the night-time (minimum) temperatures than on the daily temperature maxima. Wilby (2003) reported that the urban heat island effects in London were most intense in the city center, during the night, in summer, and during anticyclonic weather conditions.
The identified break points could not be verified by metadata, as these were not available to the authors. Nonetheless, several breaks are probably caused by changes in (a) the measurement equipment, (b) the observing practices, and (c) the location of the stations. Another factor that might cause the varying temporal variability of the series over several years could be the merging of records at different locations or the application of methods to fill existing gaps. It is nevertheless very unlikely that all identified breaks are due to such non-climatic triggers, as there are similar break years for most stations and the aforementioned non-climatic alterations are unlikely to occur simultaneously at all stations. Thus, relations of the break years to real climate variations as caused for instance by the El Nino Southern Oscillation or the Atlantic Ocean dipole are explored in the next section, since these phenomena modulate a large part of inter-annual climate variation over South America (Nobre and Shukla, 1996).
Relation of Break Years to Climate and Circulation Anomalies
The years 1979/80, 1982/83, 1990–93, 1997/98, and 2006/2007 were periods of El Niño (EN) events, while 1984/85, and 1998–2001 were years of La Niña (LN) events. These years show a good agreement with the break years in the temperature series. In EN periods, the maximum temperatures on NEB, resulting from the inhibition of clouds, tended to be higher, while negative temperature anomalies occurred in LN years due to enhanced rainfall, and higher cloudiness. Our results are consistent with those obtained by other studies, which indicate the period from the late 1970s to the late 1990s as a period of changes in the behavior of air temperature (Molion, 2005). The raised frequency of strong EN events between 1977 and 1998 partially favored further warming in recent times (Molion, 2005). At the global scale heating of the lower troposphere by EN raised the average global temperature by about 0.8°C in 1998. However, there is no clear relationship between the identified break years and certain climate events and influences due to data quality problems at individual stations interfere with the climate signal.
The identified break points in the precipitation variables are mainly associated with the El Nino years (1968–70, 1979/80, 1982/83, 1986–88, 1990–93, 2004/05). This contradicts the findings of Obregón and Nobre (2003), who observed changes in rainfall behavior in the mid 1970s in Brazil (except for NEB) and confirms the observation of Haylock et al. (2006) that significant jumps in the record coincide with wet EN years. The authors describe this to be connected with the large inter-annual variability of annual rainfall, particularly in the ENSO-dominated dry regions of western South America.
Seasonal Cycle
The NEB state capitals belong to two of the three regions that Rao et al. (1995) describe based on the annual cycle of rainfall. The stations Teresina, São Luís and Fortaleza belong to northern NEB with a comparatively short rainy season (February–May) and very little rain during the remaining 8 months. The remaining six stations at the Atlantic Coast belong to eastern coastal NEB with a rainy season from April to July. Our collective includes no station of southern (inland) NEB for which Chu (1983) described the rainy season to be lasting from November to January. The limitation of our station sub-set to mainly coastal regions limits the transferability of the results to entire NEB, as some studies showed different trends for the semi-arid to arid interior of NEB as compared to the coastal regions.
The flat seasonal temperature cycle—typically for the tropical study area—became more pronounced during the last 50 years at all stations. This seems to be a real climate signal and not a relic of data consistency problems, as it is obvious at all stations independent of the assessment of their data quality and homogeneity. The main jump in the temperature variables tested for homogeneity occurred around 1990 (1985–1993). The timing of this jump—present at all stations—strongly affects the results of the time slice comparison of the seasonal cycle (1991–2011 vs. 1961–1990). In most cases this jump is mainly attributable to climate change with non-climatic reasons modulating the jump magnitude. An influence of the unusually strong El Nino events between 1982 and 1998 on the occurrence of this break in the temperature series seems reasonable.
The intensifying seasonal temperature cycle—visible, e.g., in the raised intra-annual spread between minimum and maximum values—goes along with an intensification of the seasonal precipitation cycle. Precipitation decreases and increased dry-day frequencies during the dry season are often connected with the most pronounced increases in temperature, whereas precipitation increases during the rainy season probably attenuate the temperature increase and may even be connected with decreasing temperature trends. Changes in heavy precipitation events above the 99th percentile within the year are connected to changes in precipitation totals, but individual events modulate the trend signals and make them nosier.
The tendency of dry seasons becoming drier and wet seasons becoming more wet has already been described by Rao et al. (2016) for the Amazon by comparing their results for period 1979–2011 with those of Rao and Hada (1990) for 1958–1978. Both publications describe the months FMA as being the three rainiest ones for areas including Teresina, São Luis and Fortaleza, MJJ for João Pessoa, Recife and Maceió and AMJ for Aracaju and Salvador, while the wet season shifted from MJJ to MAM for Natal. Strong similarities between the two studies are also visible for the 3 driest months over the sub-region of NEB constituting our study area. The driest 3 months are SON over the region enclosing Fortaleza and São Luis and OND for Natal, João Pessoa, Recife, and Maceió in both studies. Changes in the timing of the driest months were noticed for Teresina from ASO to JAS and for Salvador from ASO to DJF. Generally, those slight changes in the timing of the wet and the dry season stand back behind the changes in the intra-annual spread between dry and rain season totals.
Climate Variability and Change
Certain changes described by the analyses of the seasonal cycle were confirmed by the seasonal trend analysis. This applies, e.g., to the connection between temperature and precipitation trends. Temperature decreases in the austral winter (JJA) are connected with pronounced precipitation increases, including more frequent heavy precipitation events and less frequent dry days. Furthermore, differences in the seasonal cycle at different geographical locations influence the seasonal trends through the link of precipitation and temperature trend direction and magnitude to the seasonal cycle. Precipitation decreases and increasing drought conditions were strongest during the austral spring (SON) at most stations in the northern and central part of the study area, where this season comprises mainly the dry season. At the two southernmost stations Aracaju and Salvador, where the dry season extends into the austral summer (DJF), the trend toward drier conditions is most pronounced during DJF.
We found the trends in indices connected to maximum temperature to be higher than those connected to minimum temperature. This contradicts the results of Vincent et al. (2005), who described stronger trends in minimum temperature as compared to maximum temperature for the period 1961–2000 over South America. Accordingly, the significant decreases in the DTR, described by Vincent et al. (2005) and Frich et al. (2002), cannot be ascertained by our analysis for coastal NEB. Generally, changes in indices describing the temporal variability of temperature and precipitation (e.g., DTR and ETR) cannot be described reliably, due to the data quality problems—connected with “climatically erratic” phases of below average intra- and inter-annual variability—at most stations.
Teresina (precipitation maximum of the seasonal cycle and strongest trends toward wetter conditions during the seasons DJF and MAM) and Natal (both shift to MAM and JJA) stand for a shift in increasing precipitation patterns, related to their geographical position and their wet-season timing (Figures 5, 6).
Our analysis shows variable annual and seasonal precipitation trends at individual stations. No consistent annual precipitation trends are visible for the period 1961–2000 when averaged over our station collective, whereas Haylock et al. (2006) described trends toward drier conditions with less frequent heavy precipitation events for this period. da Silva (2004) noted that reduced rainfall over NEB was connected with a decreasing relative humidity. Marengo et al. (2013) and Marengo and Bernasconi (2015) describe the NEB region rainfall to exhibit a marked inter-annual variability with a slight decrease since the 1970's. Part of these rainfall changes have been attributed to SST-variations in the tropical Pacific manifested as extremes of ENSO and to the meridional SST gradient in the tropical Atlantic (e.g., Nobre et al., 2006; Aceituno et al., 2009; Marengo et al., 2013). The differences in the rainfall trends over NEB to our results are most probably connected to our station collective focusing on the coastal region and excluding the semiarid and arid NEB interior.
Increases in total rainfall amounts and in the annual frequency of heavy precipitation events occurred mainly for periods starting in 1971 or 1981 and ending 2011—except for Aracaju station showing mainly decreasing precipitation trends. Those positive trends in rainfall amounts and heavy precipitation event frequency are most pronounced in the austral winter JJA (eastern Atlantic coast) and austral autumn MAM (northern Atlantic coast), being the rainy season or the transition time from the wet to the dry season. De Oliveira et al. (2014) describe negative trends of normal rain events in the spring (SON) and winter (JJA) season, while Marengo et al. (2013) note a weak negative tendency during the peak of the rainy season (FMAM) in NEB since the late 1970s. Instead, our data-set showed the most pronounced precipitation decreases—being connected with increasing drought conditions—during the seasons SON and DJF. These were already characterized by the driest conditions within the year in the past. Rao et al. (2016) describe increasing precipitation totals over coastal NEB within the rainy season of period 1979–2011 and less pronounced increases during the dry season. The intensity of heavy rainfall events increased during autumn (MAM) and spring (SON), but their number decreased during spring (SON), according to de Oliveira et al. (2014). These authors furthermore describe that their results suggest alterations in the temporal distribution of rainfall over NEB, connected with an increase of the seasonality amplitude, fitting our observations. Rao et al. (2016) note an increasing annual cycle of rainfall for the North Amazon region with increasing precipitation totals during the rainy season and decreasing trends during the dry season. Similar results for the Amazon—with an intensification of the hydrological cycle that is concentrated in the wet season—were described by Gloor et al. (2013), who relate these precipitation increases to the increasing atmospheric water vapor import from the warming tropical Atlantic. This explanation may be also valid for the Atlantic coast rain forest of NEB.
Climate change projections suggest further temperature increases over NEB by about 2°C in 2011–2040 and above 4°C in 2071–2100 (Marengo and Bernasconi, 2015). Simulations by Marengo et al. (2011) project changes in the upper and low-level circulations and the mean sea level pressure (SLP) fields that are connected with a weakening/strengthening of the tropical/sub-tropical circulation. Their simulation go along with an increased temperature gradient between continental South America and the South Atlantic leading to stronger SLP gradients and thus altered moisture transport and rainfall patterns, with a weakening of the North Atlantic trade winds. Large rainfall reductions were simulated in NEB—particularly over western NEB and over the semiarid region (e.g., Marengo et al., 2011; Marengo and Bernasconi, 2015). The combination of projected temperature increases and precipitation decreases leads to strong water deficits affecting the availability of water for irrigation and thus the agricultural productivity and food security over the region (Marengo and Bernasconi, 2015). Several studies, based on different scenarios, project more frequent, and intense drought conditions over large parts of South America for the end of the twenty-first century despite substantial model uncertainties (e.g., Dai, 2013; Sillmann et al., 2013). This development goes along with a strong increase in aridity and an increasing areal extension of area with semi-arid conditions (Marengo and Bernasconi, 2015). In their aridity maps (Figures 3, 4), Marengo and Bernasconi (2015) show that the coastal areas are still not under semi-arid conditions in 2071–2100 despite strongly decreasing rainfall amounts and thus negative trends in the climatic water balance at the eastern Atlantic coast (Figure 2).
Conclusion
A 51-year dataset (1961–2011) from nine meteorological stations in each capital of NEB, yielding daily data for mean, maximum, and minimum temperature, and for precipitation totals, was statistically analyzed for data homogeneity as well as climate variability. Most of the temperature series were statistically classified as “suspect,” whereas most of the precipitation series were categorized as “useful.” These results are largely influenced by the differing temporal variability of the parameters and strongly depend on the analyzed variable—with maximum temperature during the dry season being most susceptible and yearly precipitation being the least susceptible of the tested variables. Furthermore, results of the homogeneity analysis depend on the chosen homogeneity test. The Von Neumann ratio test exhibited the strongest power in detecting discontinuities, but not providing break years, and the other three tests delivering similar rates of break detection. The chosen significance level is a further subjective component in the statistical homogeneity analysis that strongly influences the final results.
Displaying and visually checking the time series demonstrates that the human eye—with its ability of pattern recognition—is much more powerful in evaluating the quality of time series for climate trends analysis than any available purely statistical approach. Nevertheless, statistical tools for assessing the homogeneity are needed for large datasets, where not every station record can be thoroughly inspected visually. Some of the breaks in temperature and precipitation series coincide with climate anomalies and extreme events, particularly El Nino Southern Oscillation. Nonetheless, further analyses on these issues are needed.
Consistent changes in the seasonality of temperature and precipitation become visible over NEB, despite the manifold breaks in the temperature series. Precipitation and temperature trends seem to be coupled to each other as well as to their seasonal cycle. During times of precipitation increase/decrease, temperature decreases/increases are likely due to a denser/lighter cloud cover and less/more insolation. The intra-annual temperature and precipitation range, respectively, has increased—going along with an intensification of the seasonal cycle. Temperature mainly increased during DJF, MAM, and SON, while decreases in JJA are connected to wetter conditions including more heavy precipitation events. Drought conditions mainly increased in SON and DJF, in dependence of the timing of the dry season. Generally, drought trends over NEB would probably be considerably more pronounced, if the recent drought event of 2012/13 would be included in the analysis. This drought has been described as one of the most severe events within the last decades (e.g., Marengo et al., 2013; Pereira et al., 2014; Rodrigues and McPhaden, 2014; Barbosa et al., 2015; Marengo and Bernasconi, 2015). During drought years like 1998 and 2012/13 soil moisture reductions can reach deficit levels that severely affect regional agriculture and pose a risk to food security (Marengo and Bernasconi, 2015). These drying trends are projected to increase in the future similar to temperature. In combination with further land degradation the projected increases in aridity over NEB may increase the risk of desertification.
The lack of truly reliable data is a problem that complicates the analysis of climate trends, increasing the challenges of related relevant research. Data quality and homogeneity needs to be analyzed before doing climatological studies. This is valuable even if no data adjustments (homogenization) can be done due to missing metadata, as it helps in assessing trend reliability and in identifying suitable sub-periods for the analysis. Climate trends without indicating the quality of the underlying data are meaningless. It is increasingly important that governmental agencies manage their meteorological observation stations more rigorously in order to ensure a good quality data base for climatological and not only for pure meteorological studies.
Author Contributions
SH calculated the climate indices, planned and conducted the analysis on climate variability, prepared the figures and tables and discussed the results of the homogeneity and climate variability analyses. DM obtained the climate data, conducted the homogeneity analysis, and described the study area and the methodology of the homogeneity assessment. All authors contributed to the manuscript writing and the discussion of the findings.
Funding
The first author got funded from a Post-Doc research scholarship (Mary Hegeler habilitation scholarship) provided by TU Bergakademie Freiberg. The second author received a Post Ph.D. research scholarship, provided by Coordination for the Improvement of Higher Education Personnel (Coordenação de Aperfeiçoamento de Pessoal de Nível Superior, CAPES) and support from the German Academic Exchange Service (DAAD).
Conflict of Interest Statement
The authors declare that the research was conducted in the absence of any commercial or financial relationships that could be construed as a potential conflict of interest.
Acknowledgments
The authors wish to thank the Meteorological Database for Education and Research (Banco de Dados Meteorológicos para Ensino e Pesquisa, BDMEP) of the National Institute of Meteorology of Brazil (Instituto Nacional de Meteorologia, INMET) for providing the data. The lead author is grateful for her Post-Doc research scholarship (Mary Hegeler habilitation scholarship) by TU Bergakademie Freiberg. The second author thankfully acknowledges his Post-Doc research scholarship, provided by CAPES (Coordenação de Aperfeiçoamento de Pessoal de Nível Superior) and DAAD (German Academic Exchange Service). We furthermore thank two reviewers for their truly valuable comments and suggestions.
Abbreviations
NEB, north-eastern Brazil; EN, El Niño; LN, La Niña; RS, rainy season; DS, dry season; HY, hydrological year.
Footnotes
1. ^http://www.climahom.eu/AnClim.html.
2. ^http://www.climahom.eu/ProcData.html.
5. ^SOI data provided by the Climate Analysis Section, NCAR, Boulder, USA, Trenberth (1984). Updated regularly. Last access 22.12.2015.
References
Aceituno, P., del Rosario Prieto, M., Solari, M. E., Martínez, A., Poveda, G., and Falvey, M. (2009). The 1877-1878 El Niño episode: associated impacts in South America. Clim. Change 92, 389–416. doi: 10.1007/s10584-008-9470-5
Aguilar, E., Auer, I., Brunet, M., Peterson, T. C., and Wieringa, J. (2003). Guidelines on Climate Metadata and Homogenization. World climate programme data and monitoring n.53. WMO-TD No. 1186, Geneva: World Meteorological Organization.
Alexandersson, H. (1986). A homogeneity test applied to precipitation data. J. Climatol. 6, 661–675. doi: 10.1002/joc.3370060607
Alexandre, T. S. S., and Santos e Silva, C. M. (2013). Seasonality, interannual variability, and linear tendency of wind speeds in the Northeast Brazil from 1986 to 2011. Sci. World J. 2013:490857. doi: 10.1155/2013/490857
Andreoli, R. V., and Kayano, M. T. (2009). “O clima da região Nordeste do Brasil,” in Tempo e Clima do Brasil, Vol. 1, eds I. F. A. Cavalcanti, N. J. Ferreira, M. G. A. J. Silva, M. A. F. Dias (São Paulo: Oficina de Textos), 213–233.
Aragão, J. O. R. (1986). A General Circulation Model Investigation of the Atmospheric Response to El Niño, NCAR/CT-100, Ph.D. thesis, University of Miami, Miami.
Aragão, J. O. R. (1990). Fatos sobre o fenômeno de El Niño e sua relação com as secas no Nordeste do Brasil. Boletim Sociedade Brasileira Meteorol. 14, 2–8.
Aragão, J. O. R., Roucou, P., Harzallah, A., Fontaine, B., and Janicot, S. (1994). Variabilité atmosphérique sur le Nordeste brésilien dans le modèle de circulation générale du LMD (1970-1988). Publ. Assoc. Int. Climatol. 7, 432–438.
Barbosa, H. A., Huete, A. R., and Baethgen, W. E. (2006). A 20-year study of NDVI variability over the Northeast Region of Brazil. J. Arid Environ. 67, 288–307. doi: 10.1016/j.jaridenv.2006.02.022
Barbosa, H. A., Kumar, T. V. L., and Silva, L. R. M. (2015). Recent trends in vegetation dynamics in the South America and their relationship to rainfall. Nat. Hazards 77, 883–899. doi: 10.1007/s11069-015-1635-8
Berlato, M. A., and Fontana, D. C. (2003). El Niño e La Niña: Impactos no Clima, na Vegetação e na Agricultura do Rio Grande do Sul; Aplicações de Previsões Climáticas na Agricultura. Porto Alegre: Ed. da UFRGS.
Brunet, M., Saladié, O., Jones, P., Sigró, J., Aguilar, E., Moberg, A., et al. (2006). The development of a new dataset of Spanish daily adjusted temperature series (SDATS) (1850-2003). Int. J. Climatol. 26, 1777–1802. doi: 10.1002/joc.1338
Buishand, T. A. (1981). The Analysis of Homogeneity of Long-Term Rainfall Records in the Netherlands. KNMI Scientific Report WR 81-7, De Bilt, The Netherlands.
Buishand, T. A. (1982). Some methods for testing the homogeneity of rainfall records. J. Hydrol. 58, 11–27. doi: 10.1016/0022-1694(82)90066-X
Cavalcanti, I. F. A., Ferreira, M., Assunção, F., de, S. D., Gertrudes, A., and Silva, J. (2009). Tempo e Clima no Brasil. São Paulo: Oficina de Textos.
Chaves, R. R., and Cavalcanti, I. F. A. (2001). Atmospheric circulation features associated with rainfall variability over Southern Northeast Brazil. Mon. Weather Rev. 129, 2614–2626. doi: 10.1175/1520-0493(2001)129<2614:ACFAWR>2.0.CO;2
Chu, P. S. (1983). Diagnostic studies of rainfall anomalies in Northeast Brazil. Mon. Weather Rev. 111, 1655–1644.
Coelho, M. S., Gan, M. A., and Conforte, J. C. (2004). Estudo da variabilidade da posição e da nebulosidade associada à ZCIT do atlântico, durante a estação chuvosa de 1998 e 1999 no Nordeste do Brasil. Rev. Brasileira Meteorol. 19, 23–34.
Curtis, S., and Hastenrath, S. (1995). Forcing of anomalous sea surface temperature evolution in the tropical Atlantic during Pacific warm events. J. Geophys. Res. Oceans 100, 15835–15847. doi: 10.1029/95JC01502
da Silva, V. P. R. (2004). On climate variability in Northeast of Brazil. J. Arid Environ. 58, 575–596. doi: 10.1016/j.jaridenv.2003.12.002
Dai, A. (2013). Increasing drought under global warming in observations and models. Nat. Clim. Change 3, 52–58. doi: 10.1038/nclimate1633
de Oliveira, P. T., e Silva, C. M. S., and Lima, K. C. (2014). Linear trend of occurrence and intensity of heavy rainfall events on Northeast Brazil. Atmos. Sci. Lett. 15, 172–177. doi: 10.1002/asl2.484
Diaz, A. F., Studzinski, C. D., and Mechoso, R. C. (1998). Relationship between precipitation anomalies in Uruguay and southern Brazil and sea surface temperature in the Pacific and Atlantic Oceans. J. Clim. 11, 251–271. doi: 10.1175/1520-0442(1998)011<0251:RBPAIU>2.0.CO;2
ECA&D (2013). ‘European Climate Assessment & Dataset (ECA&D)’ Algorithm Theoretical Basis Document (ATBD), Version 10.7. Royal Netherlands Meteorological Institute KNMI. Available online at: http://www.ecad.eu/documents/atbd.pdf
Frich, P., Alexander, L. V., DellaMarta, P., Gleason, B., Haylock, M., Klein Tank, A. M. G., et al. (2002). Observed coherent changes in climatic extremes during the second half of the twentieth century. Clim. Res. 19, 193–212. doi: 10.3354/cr019193
Gloor, M., Brienen, R. J. W., Galbraith, D., Feldpausch, T. R., Schöngart, J., Guyot, J.-L., et al. (2013). Intensification of the Amazon hydrological cycle over the last two decades. Geophys. Res. Lett. 40, 1729–1733. doi: 10.1002/grl.50377
Grimm, A., Ferraz, S. E. T., and Gomes, J. (1998). Precipitation anomalies in southern Brazil associated with El Niño and La Niña events. J. Clim. 11, 2863–2880.
Halpert, M. S., and Ropelewski, C. F. (1992). Surface temperature patterns associated with the Southern Oscillation. J. Clim. 5, 577–593.
Hastenrath, S. (2000). Interannual and longer-term variability of upper air circulation in the northeast Brazil-tropical Atlantic sector. J. Geophys. Res. Atmos. 105, 7327–7335. doi: 10.1029/1999JD901104
Hastenrath, S. (2006). Circulation and teleconnection mechanisms of Northeast Brazil droughts. Prog. Oceanogr. 70, 407–415. doi: 10.1016/j.pocean.2005.07.004
Hastenrath, S., and Druyan, L. (1993). Circulation anomaly mechanisms in the tropical Atlantic sector during the northeast Brazil rainy season: Results from the GISS general circulation model. J. Geophys. Res. Atmos. 98, 14917–14923. doi: 10.1029/93JD01284
Hastenrath, S., and Greischar, L. (1993). Circulation mechanisms related to northeast Brazil rainfall anomalies. J. Geophys. Res. Atmos. 98, 5093–5102. doi: 10.1029/92JD02646
Hawkins, D. M. (1977). Testing a sequence of observations for a shift in location. J. Am. Stat. Assoc. 72, 180–186. doi: 10.1080/01621459.1977.10479935
Haylock, M. R., Peterson, T. C., Alves, L. M., Ambrizzi, T., Anunciação, Y. M. T., Baez, J., et al. (2006). Trends in total and extreme south american rainfall in 1960–2000 and links with sea surface temperature. J. Clim. 19, 1490–1512. doi: 10.1175/JCLI3695.1
Heino, R., Brázdil, R., Førland, E., Tuomenvirta, H., Alexandersson, H., Beniston, M., et al. (1999). Progress in the study of climatic extremes in northern and central Europe. Clim. Change 42, 151–181. doi: 10.1023/A:1005420400462
IBGE. (2010) Censo Nacional. Instituto Brasileiro de geografia e Estatística. Available online at: http://www.censo2010.ibge.gov.br/
Kayano, M. T., and Andreoli, R. V. (2006). Relationships between rainfall anomalies over northeastern Brazil and the El Niño–Southern Oscillation. J. Geophys. Res. 111, D13101. doi: 10.1029/2005JD006142
Klein Tank, A. M., Zwiers, F. W., and Zhang, X. (2009). Guidelines on Analysis of Extremes in a Changing Climate in Support of Informed Decisions for Adaptation. Geneva: WMO.
Kousky, V. E., and Cavalcanti, I. F. A. (1984). Eventos Oscilação Sul / El Niño. Características, evolução e anomalias de precipitação. Ciência Cult. 36, 1888–1899.
Kyselý, J. (2002). Temporal fluctuations in heat waves at Prague–Klementinum, the Czech Republic, from 1901–97, and their relationships to atmospheric circulation. Int. J. Climatol. 22, 33–50. doi: 10.1002/joc.720
Kyselý, J. (2010). Recent severe heat waves in central Europe: how to view them in a long-term prospect? Int. J. Climatol. 30, 89–109. doi: 10.1002/joc.1874
Lhotka, O., and Kyselý, J. (2015). Characterizing joint effects of spatial extent, temperature magnitude and duration of heat waves and cold spells over Central Europe. Int. J. Climatol. 35, 1232–1244. doi: 10.1002/joc.4050
Marengo, J. A., Alves, L. M., Soares, W. R., Rodriguez, D. A., Camargo, H., Riveros, M. P., et al. (2013). Two contrasting severe seasonal extremes in tropical South America in 2012: flood in amazonia and drought in Northeast Brazil. J. Clim. 26, 9137–9154. doi: 10.1175/JCLI-D-12-00642.1
Marengo, J. A., and Bernasconi, M. (2015). Regional differences in aridity/drought conditions over Northeast Brazil: present state and future projections. Clim. Change 129, 103–115. doi: 10.1007/s10584-014-1310-1
Marengo, J. A., Chou, S. C., Kay, G., Alves, L. M., Pesquero, J. F., Soares, W. R., et al. (2011). Development of regional future climate change scenarios in South America using the Eta CPTEC/HadCM3 climate change projections: climatology and regional analyses for the Amazon, São Francisco and the Paraná River basins. Clim. Dyn. 38, 1829–1848. doi: 10.1007/s00382-011-1155-5
Marengo, J. A., and Oliveira, G. S. (1998). “Impactos do fenômeno la niña no tempo e clima do brasil: desenvolvimento e intensificação do la niña 1998/1999,” in SBMET, Anais do X Congresso Brasileiro de Meteorologia, CD-ROM. Available online at: http://www.cbmet.com/edicoes.php?pageNum_Recordset_busca=7&totalRows_Recordset_busca=623&cgid=13&imageField2.x=51&imageField2.y=11
Molion, L. C. B. (1998). “Aquecimento global: Uma análise crítica,” in SBMET, Anais do X Congresso Brasileiro de Meteorologia, CD-ROM. Available online at: http://www.cbmet.com/edicoes.php?pageNum_Recordset_busca=1&totalRows_Recordset_busca=623&cgid=13&imageField2.x=51&imageField2.y=11
Molion, L. C. B. (2005). “Aquecimento global, El Niños, machas solares, vulcões e Oscilação Decadal do Pacífico,” in Climanálise. Available online at: http://climanalise.cptec.inpe.br/~rclimanl/revista
Molion, L. C. B., and Bernardo, S. O. (2002). Uma revisão da dinâmica das chuvas no nordeste brasileiro. Rev. Bras. Meteorol. 17, 1–10.
Nobre, C. A., and Molion, L. C. B. (1988). “The climatology of droughts and drought prediction,” in The Impact of Climatic Variations on Agriculture. Assessments in Semi-Arid Regions, eds M. Parry, T. R. Carter, and N. T. Konijn (Dordrecht; Boston: Kluwer Academic Pub.), 305–323.
Nobre, P., Marengo, J. A., Cavalcanti, I. F. A., Obregon, G., Barros, V., Camilloni, I., et al. (2006). Seasonal-to-decadal predictability and prediction of south American Climate. J. Clim. 19, 5988–6004. doi: 10.1175/JCLI3946.1
Nobre, P., and Shukla, J. (1996). Variations of sea surface temperature, wind stress, and rainfall over the tropical Atlantic and South America. J. Clim. 9, 2464–2479.
Obregón, G., and Nobre, C. A. (2003). Rainfall trends in Brazil. Bull. Am. Meteorol. Soc. 84, 1008–1009.
Oliveira, G. S., and Satyamurty, P. (1998). “O El Niño de 1997/98: Evolução e impactos no Brasil,” in SBMET, Anais do X Congresso Brasileiro de Meteorologia, CD-ROM. Available online at: http://www.cbmet.com/edicoes.php?pageNum_Recordset_busca=8&totalRows_Recordset_busca=623&cgid=13&imageField2.x=51&imageField2.y=11
Oliveira, P. T., Santos e Silva, C. M., and Lima, K. C. (2012). “Trend of rain in Northeast Brazil,” in Rainfall: Behavior, Forecasting and Distribution, eds O. E. Martín and T. M. Roberts (New York, NY: Nova Science Publishers), 155–166.
Oliveira, P. T., Santos e Silva, C. M., and Lima, K. C. (2013). Synoptic environment associated with heavy rainfall events on the coastland of Northeast Brazil. Adv. Geosci. 35, 73–78. doi: 10.5194/adgeo-35-73-2013
Pereira, M. P. S., Justino, F., Malhado, A. C. M., Barbosa, H., and Marengo, J. (2014). The influence of oceanic basins on drought and ecosystem dynamics in Northeast Brazil. Environ. Res. Lett. 9:124013. doi: 10.1088/1748-9326/9/12/124013
Peterson, T. C., Easterling, D. R., Karl, T. R., Groisman, P., Nicholls, N., Plummer, N., et al. (1998). Homogeneity adjustments of in situ atmospheric climate data: a review. Int. J. Climatol. 18, 1493–1517.
Pettitt, A. N. (1979). A non-parametric approach to the change-point detection. Appl. Stat. 28, 126–135. doi: 10.2307/2346729
Priscilla, T. O., Santos e Silva, C. M., and Lima, K. C. (2014). Linear trend of occurrence and intensity of heavy rainfall events on Northeast Brazil. Atmos. Sci. Lett. 15, 172–177. doi: 10.1002/asl2.484
Rao, V. B., Franchito, S. H., Santo, C. M. E., and Gan, M. A. (2016). An update on the rainfall characteristics of Brazil: seasonal variations and trends in 1979–2011. Int. J. Climatol. 36, 291–302. doi: 10.1002/joc.4345
Rao, V. B., and Hada, K. (1990). Characteristics of rainfall over Brazil: annual variations and connections with the Southern Oscillation. Theor. Appl. Climatol. 42, 81–91. doi: 10.1007/BF00868215
Rao, V. B., Hada, K., and Herdies, D. L. (1995). On the severe drought of 1993 in north-east Brazil. Int. J. Climatol. 15, 697–704. doi: 10.1002/joc.3370150608
Rao, V. B., Satyamurty, P., and De Brito, J. I. B. (1986). On the 1983 drought in north-east Brazil. J. Climatol. 6, 43–51. doi: 10.1002/joc.3370060105
Repelli, C. A., Alves, R., Souza, E. B., Ubarana, V. N., and Alves, J. M. B. (1998). “Sensação térmica para fortaleza – CE,” SBMET, Anais do X Congresso Brasileiro de Meteorologia, CD-ROM. Available online at: http://www.cbmet.com/edicoes.php?pageNum_Recordset_busca=10&totalRows_Recordset_busca=623&cgid=13&imageField2.x=51&imageField2.y=11
Rodrigues, R. R., and McPhaden, M. J. (2014). Why did the 2011–2012 La Niña cause a severe drought in the Brazilian Northeast? Geophys. Res. Lett. 41, 1012–1018. doi: 10.1002/2013GL058703
Roziane, S. S., Gilbeto, C. S., Robson, A. O., and Gabriel, M. A. (2012). Homogeneidade de séries climatológicas em Minas Gerais. Revista Brasileira Engenharia Agrícola e Ambiental 16, 1338–1345. doi: 10.1590/S1415-43662012001200011
Schönwiese, C. D., and Rapp, J. (1997). Climate Trend Atlas of Europe Based on Observations 1891–1990. Dordrecht: Kluwer.
Shevchenko, O., Lee, H., Snizhko, S., and Mayer, H. (2014). Long-term analysis of heat waves in Ukraine. Int. J. Climatol. 34, 1642–1650. doi: 10.1002/joc.3792
Sillmann, J., Kharin, V. V., Zwiers, F. W., Zhang, X., and Bronaugh, D. (2013). Climate extremes indices in the CMIP5 multimodel ensemble: Part 2. Future climate projections. J. Geophys. Res. Atmos. 118, 2473–2493. doi: 10.1002/jgrd.50188
Sparks, W. R. (1972). The Effect of Thermometer Screen Design on the Observed Temperature, WMO: 315. Geneva: WMO.
Štěpánek, P. (2010a). AnClim-Software for Time Series Analysis. Department of Geography, Faculty of Natural Sciences, Masaryk University, Brno Available online at: http://www.climahom.eu/AnClim.html
Štěpánek, P. (2010b). ProClimDB-Software for Processing Climatological Datasets. CHMI - Czech Hydro Meteorological Institute, regional office Brno Available online at: http://www.climahom.eu/ProcData.html
Štěpánek, P., Zahradníèek, P., and Skalák, P. (2009). Data quality control and homogenization of air temperature and precipitation series in the area of the Czech Republic in the period 1961–2007. Adv. Sci. Res. 3, 23–26. doi: 10.5194/asr-3-23-2009
Trenberth, K. E. (1984). Signal versus noise in the Southern Oscillation. Mon. Weather Rev. 112, 326–332.
Uvo, C. B., Repelli, C. A., Zebiak, S. E., and Kushnir, Y. (1998). The relationships between tropical Pacific and Atlantic SST and Northeast Brazil monthly precipitation. J. Clim. 11, 551–562.
Vincent, L. A., Peterson, T. C., Barros, V. R., Marino, M. B., Rusticucci, M., Carrasco, G., et al. (2005). Observed trends in indices of daily temperature extremes in South America 1960–2000. J. Clim. 18, 5011–5023. doi: 10.1175/JCLI3589.1
Von Neumann, J. (1941). Distribution of the ratio of the mean square successive difference to the variance. Ann. Math. Stat. 12, 367–395. doi: 10.1214/aoms/1177731677
Wijngaard, J. B., Klein Tank, A. M. G., and Können, G. P. (2003). Homogeneity of 20th century European daily temperature and precipitation series. Int. J. Climatol. 23, 679–692. doi: 10.1002/joc.906
Wilby, R. L. (2003). Past and projected trends in London's urban heat island. Weather 58, 251–260. doi: 10.1256/wea.183.02
Keywords: data quality, extreme events, regional climate change, seasonal cycle, seasonal trends, heavy precipitation, drought, El Niño Southern Oscillation
Citation: Hänsel S, Medeiros DM, Matschullat J, Petta RA and de Mendonça Silva I (2016) Assessing Homogeneity and Climate Variability of Temperature and Precipitation Series in the Capitals of North-Eastern Brazil. Front. Earth Sci. 4:29. doi: 10.3389/feart.2016.00029
Received: 27 May 2015; Accepted: 08 March 2016;
Published: 31 March 2016.
Edited by:
M. S. Madhusoodanan, The Energy and Resources Institute, IndiaReviewed by:
Federico Porcu, University of Bologna, ItalyAna María Durán-Quesada, University of Costa Rica, Costa Rica
Copyright © 2016 Hänsel, Medeiros, Matschullat, Petta and de Mendonça Silva. This is an open-access article distributed under the terms of the Creative Commons Attribution License (CC BY). The use, distribution or reproduction in other forums is permitted, provided the original author(s) or licensor are credited and that the original publication in this journal is cited, in accordance with accepted academic practice. No use, distribution or reproduction is permitted which does not comply with these terms.
*Correspondence: Stephanie Hänsel, stephanie.haensel@ioez.tu-freiberg.de