Sensitivity of Very Small Glaciers in the Swiss Alps to Future Climate Change
 Matthias Huss
 Mauro Fischer
- 1Department of Geosciences, University of Fribourg, Fribourg, Switzerland
- 2Laboratory of Hydraulics, Hydrology and Glaciology, ETH Zurich, Zurich, Switzerland
Very small glaciers (<0.5 km2) account for more than 80% of the total number of glaciers in mid- to low-latitude mountain ranges. Although their total area and volume is small compared to larger glaciers, they are a relevant component of the cryosphere, contributing to landscape formation, local hydrology, and sea-level rise. Worldwide glacier monitoring mostly focuses on medium-sized to large glaciers leaving us with a limited understanding of the response of dwarf glaciers to climate change. In this study, we present a comprehensive modeling framework to assess past and future changes of very small glaciers at the mountain-range scale. Among other processes our model accounts for snow redistribution, changes in glacier geometry, and the time-varying effect of supraglacial debris. It computes the mass balance distribution, the englacial temperature regime and proglacial runoff. The evolution of 1133 individual glaciers in the Swiss Alps is modeled in detail until 2060 based on new distributed data sets. Our results indicate that 52% of all very small glaciers in Switzerland will completely disappear within the next 25 years. However, a few avalanche-fed glaciers at low elevation might be able to survive even substantial atmospheric warming. We find highly variable sensitivities of very small glaciers to air temperature change, with gently-sloping, low-elevation, and debris-covered glaciers being most sensitive.
1. Introduction
Alpine glacier research mostly focuses on medium-sized and large valley glaciers. However, very small glaciers (here defined as being smaller than 0.5 km2 today) account for 80–90% of the number of glaciers in mid- to low-latitude mountain ranges (Paul et al., 2004; Pfeffer et al., 2014). Although the total area and volume of these glaciers is rather small (≈13% of overall glacier area, ≈ 5% of overall ice volume), they affect the hydrological regime in poorly glacierized drainage basins (Huss, 2011; Jost et al., 2012) and are highly relevant for landscape formation and bedrock erosion in cirques (Sanders et al., 2012; Seppi et al., 2015). Furthermore, several winter tourism resorts in the Alps rely on the presence of small remnants of glacier ice and increasingly try to protect them from further melting (Fischer et al., 2011). Many small glaciers, even at rather low elevation, are probably not completely temperate, which can impact on their hazard potential (Gilbert et al., 2012; Gilbert et al., 2015). The particular thermal conditions also increase the potential of very small glaciers to act as valuable long-term climate proxies storing very old ice (Haeberli et al., 2004; Grunewald and Scheithauer, 2010). Due to their vast number and short response time, very small glaciers are even relevant for global sea-level rise, at least over the next one or two decades (Bahr and Radić, 2012; Huss and Hock, 2015). Understanding the linkage of very small glaciers with climatic changes is a challenge as their mass balance is governed by complex advective processes of snow and small-scale effects that are difficult to be captured by numerical models. Although very small glaciers are relevant for a wide range of aspects in high mountain environments, they are undersampled in worldwide glacier monitoring efforts (WGMS, 2012). There still is considerable uncertainty regarding the past geometry changes of very small glaciers and their mass balance response to present and future atmospheric warming.
Very small glaciers occur where mountain peaks are little higher than the regional equilibrium line altitude (ELA), or at far lower elevations with extreme accumulation rates (e.g., González Trueba et al., 2008; Hughes, 2009). Accumulation rates on small cirque glaciers can be higher by up to a factor of four than the regional winter precipitation (Kuhn, 1993; Escher-Vetter and Rentsch, 1995). Very small glaciers are often situated in cirques and niches below rock walls and are strongly influenced by wind drift and partly by avalanches (Helfricht et al., 2015). Due to the lack of significant horizontal movement, many very small glaciers are lens- or wedge-shaped and display a large thickness to length ratio (Kuhn, 1995; Hagg et al., 2012).
In several studies, often focussed on the Mediterranean Mountains, the recent and long-term dynamics, as well as relevant processes determining the mass balance of very small glaciers were investigated (e.g., Gellatly et al., 1994; Chueca et al., 2007; Hughes, 2007, 2008; Pecci et al., 2008; Huss, 2010; Serrano et al., 2011; Colucci et al., 2015; Fischer et al., 2016). Several new monitoring techniques, e.g., relying on terrestrial/airborne laserscanning or drone-based acquisition of terrain models were tested (Carturan et al., 2013; Carrivick et al., 2015; Piermattei et al., 2015). Both in Southern Europe and in the Alps, very small glaciers were found to be subject to strong retreat and mass loss over the last century (e.g., Triglav-Čekada and Gabrovec, 2013; Fischer et al., 2015; Marti et al., 2015). A contrasting behavior with quasi-stable conditions for very small glaciers has been reported for the Canadian Rockies (Debeer and Sharp, 2007, 2009). Over the last four decades, very small glaciers in Switzerland lost roughly 70% of their area (Fischer et al., 2014) making them the size class with the highest shrinkage rate. A considerable number of very small glaciers has already vanished throughout the last century, although more than thousand of these dwarf glaciers are still present in the Swiss Alps.
Despite the numerous studies documenting the past changes in very small glaciers in response to climate forcing, no detailed model-based assessment of the future evolution of very small glaciers is yet available. Simulating the evolution of small glaciers is highly challenging as the factors driving their spatio-temporal evolution are difficult to be described in numerical models due to the importance of complex processes such as wind drift and avalanches. Assessing very small glacier response at the mountain-range scale thus requires a modeling approach optimally constrained with field data.
Our study aims at answering the following questions: How long can very small glaciers in the Swiss Alps (smaller than 0.5 km2 according to the latest glacier inventory) be expected to survive, and what is their sensitivity to climate change? We present a detailed modeling approach applied to all individual very small glaciers in Switzerland. The components of the mass budget, glacier geometry change, englacial temperature, and proglacial runoff are calculated both for the past (1961 to present) and for the future. The model has a high temporal (1 day) and spatial (10 m) resolution. It is individually constrained for each of the >1000 glaciers based on various direct field data ranging from glacier-specific geodetic mass balances to direct measurements of accumulation and ablation, ice thickness, and englacial temperature. Our comprehensive model allows us to assess the sensitivity of very small glaciers at the mountain-range scale, and to generalize their response to climate change specified for different glacier characteristics (e.g., area, slope, aspect).
2. Study Sites and Data
2.1. Very Small Glaciers in the Swiss Alps
Dwarf glaciers in Switzerland are numerous and accounted for 82% of all Swiss glaciers in 2010 (Fischer et al., 2014). According to a detailed inventory based on high-resolution aerial photographs (2008–2011) and manual delineation of glacier boundaries, more than 1100 glaciers smaller than 0.5 km2 were mapped with a total area of 116 km2. Very small glaciers are distributed across the entire Swiss Alps but are most frequent in the basins of the Rhone and the Rhine River, and are sparser in the Inn catchment and the drainage basin of the Po (Ticino, Doveria, Maira, Poschiavino, Figure 1). The size class of glaciers smaller than 0.1 km2 dominates in terms of the total number but most of the area is concentrated in the fewer glaciers belonging to the class 0.25–0.5 km2. By comparing the area of each individual glacier provided by the last complete inventory from 1973 (Müller et al., 1976) with that from 2010 (Fischer et al., 2014), relative changes in surface area of between –30 and –76% were found for individual classes of very small glaciers and the different drainage basins (Figure 1). This assessment does not account for glaciers that have disappeared between 1973 and 2010.
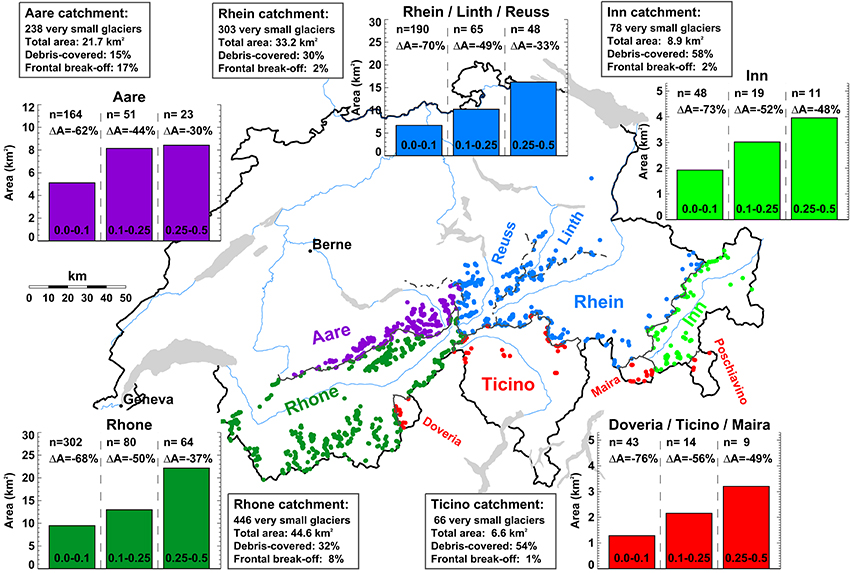
Figure 1. Distribution of very small glaciers in the Swiss Alps. Glacier count and area in three size classes for the major hydrological basins and the relative area changes 1973–2010 are stated. The percentage of glaciers with supraglacial debris and affected by frontal break-off of ice per catchment is given. Note that the basin of the Rhine River has been separated into two sub-catchments (Aare, Rhein/Linth/Reuss).
Very small glaciers in the Swiss Alps are characterized by an extreme variability in their topo-climatic setting. Median glacier elevations vary between 1700 and 4000 m a.s.l. over distances of a few tens of kilometers, thus providing an indication for strong differences in winter snow accumulation rates (Figure 2). Despite the variations in the glaciers' elevation, a clear spatial pattern throughout Switzerland is revealed: In the Rhone catchment, typical median elevations are around 2600 m a.s.l. in the West, rising to 3300 m a.s.l. in the center. The drainage basins of the Rhine and the Ticino are characterized by median glacier elevations of between 2600 and 2800 m a.s.l., and in the Inn catchment, glaciers are located at about 2900 m a.s.l. on average (Figure 2).
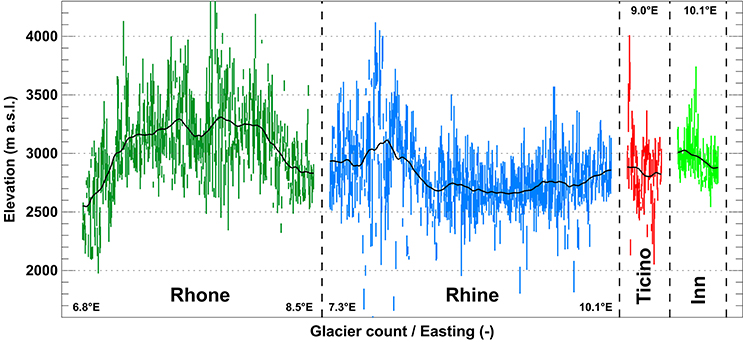
Figure 2. Elevation ranges (bars) of very small glaciers in Switzerland sorted according to Easting within the major hydrological basins (Figure 1). The solid line corresponds to a running mean.
A considerable number of very small glaciers are partially covered by supraglacial debris, which significantly influences glacier mass balance. In order to include some qualitative information on debris coverage into the most recent glacier inventory (Fischer et al., 2014), an indicator (not / slightly / strongly / completely debris-covered) was attributed to every glacier based on aerial imagery. About one third of all very small glaciers presently exhibits some debris coverage but the regional variations are considerable (Figure 1) and are likely related to different geological and topographical boundary conditions.
Some glaciers are subject to frontal break-off of ice over a rock cliff, i.e., an ablation process indirectly related to climate forcing. All very small glaciers were classified qualitatively (no / moderate / substantial frontal mass loss) using aerial images. Whereas, only few very small glaciers presently are influenced by this process in the Eastern Swiss Alps, 17% of the glaciers in the Aare basin show some frontal break-off of ice, probably supported by steep topographic gradients in that region (Figure 1). This indicates that frontal mass loss can not be completely neglected even for small glaciers in mid-latitude mountain ranges.
2.2. Data
A variety of data on very small glaciers has been collected for the Swiss Alps over the last years. Although the data series are generally short and partly discontinuous, the combination of direct seasonal mass balance observations, geodetic mass changes, and ice thickness measurements allows us to draw an integrative picture of the recent variations in the dwarf glaciers of Switzerland.
2.2.1. Mass Balance
Direct seasonal mass balance observations are available for 13 very small glaciers distributed throughout all regions of the Swiss Alps (Figure 3). Whereas, eight of the series are relatively short, some records have a length of up to three decades and have recently been homogenized (Huss et al., 2015; Fischer et al., 2016). Mass balance is determined based on the direct glaciological method (Cogley et al., 2011). The monitoring consists of dense snow probings and a snow pit in April/May for evaluating the winter balance, and ablation stake readings at a network of 2–17 stakes in September. Measurements are subsequently extrapolated to calculate annual mass change. The smallest glacier with mass balance observations (Blau Schnee) has an area of only 0.02 km2. Most data however refer to glaciers larger than 0.2 km2 (Figure 3).

Figure 3. Availability of different types of data on very small glaciers in the Swiss Alps. (1) surface mass balance (MB, red), (2) ice volume (V, blue), and (3) englacial temperature (T, purple). Glacier area (year 2010) in km2 is stated in brackets.
2.2.2. Geodetic Mass Change
Glacier-specific geodetic mass changes for a 20- to 50-year period are available for all 1133 very small glaciers in Switzerland from Fischer et al. (2015). The first Digital Elevation Model (DEM) of the entire Swiss Alps (DHM25 Level 1, 25 m resolution) originates from between 1961 and 1991 over glacierized surfaces and has been dated for each glacier individually. The SwissALTI3D DEMs (2 m resolution) acquired between 2008 and 2011 provide up-to-date information on glacier surface topography. By intersecting the two DEMs with the glacier outlines from the inventories of 1973 (Müller et al., 1976) and 2010 (Fischer et al., 2014), surface elevation change, volume change and geodetic mass balance was calculated. The average uncertainty in annual geodetic mass balance of very small glaciers is estimated as ±0.14 m water equivalent (w.e.) a−1 (Fischer et al., 2015). All DEMs were interpolated to a 10 × 10 m grid for the present study.
2.2.3. Ice Thickness and Volume
Direct ice thickness measurements using Ground-Penetrating Radar (GPR) are available for 14 very small glaciers in Switzerland (Figure 3, Huss, 2010; Fischer et al., 2013, and unpublished data). The measurements were acquired between 2009 and 2015. Average thicknesses of 8–26 m were found. By using a modeling approach based on the principles of ice flow mechanics (Huss and Farinotti, 2012), the ice thickness distribution was calculated on a 10 m grid for all glaciers. All model parameters were taken from Huss and Farinotti (2012). For comparing measured and modeled thicknesses, the time difference between GPR acquisitions and the date of model input data (glacier outline, DEM) was accounted for. Observed mean glacier-specific point thickness was reproduced within a root-mean-square error (RMSE) of 6.8 m (26% relative to local thickness). The average thickness of all glaciers was matched within 1 m, which is smaller than the measurement uncertainty. This indicates a considerable skill of the model in describing the ice thickness distribution of very small glaciers with strongly variable characteristics.
2.2.4. Englacial Temperature
Only few measurements documenting the englacial temperature of small glaciers in the Alps are available, and not much is known about their thermal regime (Gilbert et al., 2012). Direct observations of ice temperature using thermistor chains installed in boreholes with a depth of between 10 and 35 m have been acquired mostly in late summer on Altelsgletscher (Laternser, 1992), Vadret dal Corvatsch (Frauenfelder, 2001; Hager, 2002), St. Annafirn, and Glacier du Sex Rouge (Figure 3). Unfortunately, no continuous time series of englacial temperatures are available. The measurements indicate that ice at around −1°C is present in the ablation area of very small glaciers despite their relatively low elevation (Signer, 2014).
2.2.5. Meteorological Data and Climate Scenarios
Meteorological conditions throughout the Swiss Alps are described by gridded data sets of air temperature and precipitation provided by MeteoSwiss. Extrapolation to a 2 × 2 km grid with an underlying topography involves direct meteorological measurements, information on their representativeness and physical understanding of their variation in space (Frei, 2014; MeteoSwiss, 2014). The daily temperature and precipitation grids continuously cover the period January 1961–December 2014. A daily meteorological time series for the median elevation of each individual glacier is derived based on the closest cell of the gridded data set. We evaluate monthly temperature gradients with elevation using the cells within a radius of 40 km of each glacier. These gradients are used to correct air temperatures for the difference of the closest grid cell's elevation and the median glacier elevation. Precipitation is not adjusted for the elevation difference but a glacier-specific correction is performed during the calibration procedure (see Section 3.2).
Scenarios of future climate change are provided by the project CH2014 (CH2014-Impacts, 2014) presenting an analysis of results of the ENSEMBLES Regional Climate Model (RCM) runs (van der Linden and Mitchell, 2009). ENSEMBLES RCMs are driven by different general circulation models that are forced by the Special Report on Emission Scenarios (SRES) A1B and A2 emission scenarios, as well as the more moderate RCP3PD scenario (CH2014-Impacts, 2014). We use changes in air temperature and precipitation based on the “delta change” approach (e.g., Hay et al., 2000), expressing the effect of climate change between two periods in terms of the difference in the mean of a given variable. The periods have the same length (30 years) and are divided into a reference (1980–2009) and two scenario periods (2021–2050, 2045–2074). Additive (multiplicative) changes in daily mean air temperature (precipitation) are aggregated to monthly values relative to the reference period. These changes have been evaluated by CH2014-Impacts (2014) for all cells of the gridded meteorological data set in a probabilistic way for 14 RCMs, thus defining a median evolution, and a 95%-confidence range with a lower and an upper bound for temperature and precipitation for each of the three emission scenarios. For simulating glacier response, we define a median scenario using the median temperature and precipitation change of all RCMs. In order to capture the range in future climate evolution given by the RCMs, we combine the lower/upper end of the confidence interval for temperature/precipitation and generate a moderate scenario (cold/wet) regarding glacier mass balance, and inversely, an extreme scenario (hot/dry). The approach of using minimum/maximum bounds of the confidence intervals might lead to an unphysical combination of results for temperature and precipitation change derived from different RCMs. As we do not have access to the downscaled time series of all RCMs, we consider our definition of moderate/extreme scenarios as a simplified approach that embraces the complete range of possible future climate change.
For each glacier, we generate a continuous daily meteorological series until 2060. We first linearly interpolate the changes in temperature and precipitation between the center points of the reference and the scenario periods. We then superimpose observed day-to-day variability on the projected monthly means; for each year of the scenario time series, a specific year is randomly selected from the period 1961–2014 (see also Farinotti et al., 2012; Huss et al., 2014). Our approach assumes that day-to-day variability of temperature and precipitation remains constant over the next decades although climate models indicate that variability might increase until the end of the century (Beniston et al., 2007; Farinotti, 2013).
3. Methods
3.1. Glacier Model
For each individual very small glacier in Switzerland mass balance, glacier retreat, englacial temperature and proglacial runoff are calculated using the Glacier Evolution Runoff Model (GERM). GERM includes components for snow accumulation distribution, snow and ice melt, three-dimensional glacier geometry change, and runoff routing. A detailed description of the model components is given in Huss et al. (2008) and Farinotti et al. (2012). Hereafter, we summarize the most important parameterizations and describe specific developments of the original model regarding englacial temperature and the effect of supraglacial debris-coverage and frontal break-off of ice on mass balance. These additional model components are mostly simple approaches to complex and yet poorly understood physical processes. We assess whether the added model complexity is needed to capture the related feedback mechanisms. The model is run at daily temporal resolution on a 10 m grid.
3.1.1. Mass Balance
Snow accumulation C(x, y, t) at position (x, y) on the glacier and day t is calculated based on precipitation P(t) for local air temperatures T(x, y, t) < Tthr as
Air temperatures are extrapolated to all grid cells using an annually constant lapse rate dT∕dz = –6°C km−1. Tthr = 1.5°C is the threshold temperature between solid and liquid precipitation with a linear transition range of ±1°C. The factor cprec allows adjusting precipitation to the conditions of the individual glacier and accounts for errors in the gridded precipitation data. Spatial variations in accumulation across the glacier due to preferential snow deposition and wind-driven snow redistribution are taken into account by using a dimensionless snow distribution multiplier D(x, y) (Farinotti et al., 2010). D(x, y) is derived statistically from terrain characteristics and has values of between 0 and 2. It includes a parameterization for reduced snow depth on steep slopes (avalanches / drift); accumulation is reduced linearly from 100 to 0% between slope angles of 40 and 60°. Furthermore, the effects of snow deposition and erosion due to wind are empirically described by varying D(x, y) with surface curvature evaluated over a scale of 100 m around each grid cell.
Snow and ice melt is calculated based on a distributed temperature-index model (Hock, 1999). Degree-day factors are varied as a function of potential direct radiation in order to account for the effects of slope, aspect, and shading. Daily surface melt rates M(x, y, t) are computed as
where fM denotes a melt factor, rsnow∕ice are radiation factors for snow and ice surfaces and Ipot(x, y, t) is the potential solar radiation.
After the disappearance of the snow cover, melt over ice surfaces with supraglacial debris is calculated as
where fdebris is a reduction factor depending on the thickness of the debris layer (Schuler et al., 2002; Nicholson and Benn, 2006). We do not account for the effect of very fine debris that can locally enhance melting via lowering the surface albedo. In the absence of a detailed inventory of debris-covered areas for all glaciers we use estimated percentages of supraglacial debris for the four classes of coverage that have been attributed to all individual glaciers (see Section 2.1). Based on considerations of aerial imagery we prescribe a coverage of 15 / 40 / 75% to slightly / strongly / completely debris-covered glaciers relative to their total surface area. Debris is assumed to occupy the lowermost grid cells of a glacier, whereas the upper regions are characterized by clean ice or firn.
With glacier wastage supraglacial debris cover is expected to both thicken, hence increasing its potential to reduce melt, and to extend in space (Anderson, 2000). We parameterize these effects by prescribing a linear decrease in fdebris with time, and set up a simple model for debris extension. We prescribe initial values of fdebris of between 0.4 and 0.7, approximatively corresponding to debris thicknesses of 0.25–0.10 m (Nicholson and Benn, 2006), which are typical for glaciers in the European Alps (Brock et al., 2010). We assume a thicker debris layer for classes with high debris coverage. By the end of the modeling period fdebris is assumed to decrease to 0.25–0.55. Such an increase in debris cover thickness is motivated with findings by Rowan et al. (2015). The rate of change in debris-covered area relative to the initial geometry (in % per year) is prescribed for the debris classes and coverage is updated in 3-year steps. The debris-covered area thus propagates upglacier with time, which is consistent with observations of temporal changes in supraglacial debris (e.g., Stokes et al., 2007).
The physical processes leading to the frontal break-off of hanging glaciers are yet incompletely understood and are challenging to be described numerically (e.g., Faillettaz et al., 2015). Accounting for this effect is however important to realistically describe the mass balance distribution of such glaciers and to capture a potential stabilization related to their surface lowering and retreat leading to reduced frontal mass loss (Pralong and Funk, 2006). Motivated by the lack in detailed data on glaciers experiencing frontal ablation, we apply a simple ad-hoc approach. A reduction in local mass balance cfrontal is applied to the grid cells that occupy the lowermost 10% of the glacier surface (initial glacier geometry) mimicking mass loss by break-off. This reduction is maintained until the glacier retreats from those cells. Based on rough considerations of typical ice fluxes of hanging glaciers and losses by frontal break-off (Alean, 1985; Pralong and Funk, 2006) we set cfrontal = 2.5 m w.e. a−1 for glaciers classified as having “moderate frontal mass loss” (see Section 2.1), and cfrontal = 5 m w.e. a−1 for glaciers with “substantial frontal mass loss.”
3.1.2. Geometry Change
Glacier geometry change occurring in response to mass balance forcing is calculated based on the Δh-parameterization (Huss et al., 2010a). An empirical function relates glacier surface elevation change to the glacier's altitudinal range, typically resulting in maximum thickness changes at the snout and small variations in the accumulation area. The shape of the Δh-function is derived for each glacier individually based on the comparison of DEMs from 1961 to 1991 and 2010. Prescribing mass conservation, the annual change in ice volume calculated with the mass balance model is distributed across the glacier surface according to the Δh-function (see Huss et al., 2010a). The glacier disappears where ice thickness becomes zero.
3.1.3. Englacial Temperature
The englacial temperature regime of low-lying alpine ice bodies is yet poorly studied, but has an impact on ice dynamics (Gilbert et al., 2012) and the potential of small glaciers and ice patches to act as archeological archives (Dixon et al., 2005). In order to investigate the glacier's thermal regime and the temporal evolution of englacial temperatures, a one-dimensional heat transfer model including melt and refreezing processes is coupled to the glacio-hydrological model. Our model does, however, not account for the feedbacks of englacial temperature on glacier retreat rates and sensitivity.
The temperature of each 0.5 m layer between the surface and the bedrock is calculated based on heat conduction as
where ch is the heat capacity of ice, κ the thermal conductivity and ρ the firn/ice density. We do not account for advection of ice, which is justified by the typically very limited flow velocities of very small glaciers. The heat conduction equation is solved explicitly at daily resolution. For simplicity, the firn/ice temperature Tg, 0 of the uppermost layer is assumed to equal min(T, 0°), with T the daily mean air temperature, if snow depth d is smaller than a threshold dcrit, low. If it is greater than an upper threshold dcrit, high, Tg, 0 is 0°C. With a snowpack in between dcrit, low and dcrit, high, Tg, 0 is linearly interpolated between min(T, 0°) and 0°C depending on d. Constants of Equation (4) are taken from literature, and the parameters dcrit, low and dcrit, high are calibrated for the site Sex Rouge (Figure 3, Signer, 2014) so that modeled englacial temperatures are in agreement with direct observations. The same parameters were applied to all glaciers. This parameterization allows us to efficiently capture the qualitative effect of the snow cover on firn/ice surface temperature without modeling the complex heat transfer processes in the winter snow pack.
The free pore space in the firn layer can be filled with air or liquid water, when available from surface melt or rain. We assume no vertical water transfer through the ice, and complete permeability of the firn. The thickness of the firn layer is computed using the local mass balance history and is constrained to have a maximum thickness of 10 m. Furthermore, liquid water is assumed to be available at the glacier bed for days with significant surface melting (>10 mm w.e. d−1). Refreezing of water and the corresponding effects on the temperature profile are calculated in every time step.
3.1.4. Runoff
Water runoff is calculated based on the routing scheme implemented in GERM, and consists of the sum of meltwater and rain minus evaporation (Farinotti et al., 2012). The latter is computed for every grid cell and time step by the corresponding module (see Huss et al., 2008). We define a constant hydrological catchment for each individual glacier, which refers to the perimeter ice-covered in 1973. Thus, the size of the drainage basin remains unchanged in time but the glacierization is continuously updated. Runoff is also calculated for ice-free parts of the catchment accounting for snow melt, rain, and evapotranspiration.
3.2. Model Calibration
Calibrating a spatially distributed glaciological model to more than a thousand glaciers is challenging but crucial to realistically capture the governing processes and to correctly describe their sensitivity. We apply an automated multi-level calibration scheme that relies on the observed 20- to 50-year ice volume change for each individual glacier (Fischer et al., 2015). Compromises between the methodological requirements for an unambiguous model calibration and the available data basis must be accepted for studies with a regional scope.
GERM is initialized with the ice surface geometry derived from the inventory of 1973 and the DHM25 Level 1 terrain model (1961–1991 for glacierized surfaces). The year of model initialization t1 for each glacier refers to the acquisition date of this DEM known for each glacier. Surface mass balance and glacier geometry changes are calculated and the cumulative ice volume difference between t1 and the date of the SWISSALTI3D terrain model is compared to the volume change derived by differencing the two DEMs (Fischer et al., 2015). The parameters cprec (Equation 1), fM and rsnow∕ice (Eqation 2) need to be calibrated. Measurements of the long-term geodetic mass change do not contain any information on the components of mass balance (accumulation/ablation). We thus apply a two-step procedure to separately constrain accumulation and melt parameters of the model.
In a first step, the parameters of the distributed temperature-index model are set to literature values (e.g., Farinotti et al., 2012; Gabbi et al., 2014), and cprec is varied within the range [0.5,2.5]. Thus, we allow for potentially large biases in the gridded data set for precipitation (MeteoSwiss, 2014), which also includes effects of snow removal or deposition by wind and/or avalanches on the glacier surface. At this stage, we assume that the initial melt parameters adequately describe ablation, and define a value for cprec that satisfies the observed multi-decadal ice volume change. If the model is unable to reproduce the geodetic mass balance with cprec within the prescribed bounds, fM is varied in a second calibration step, keeping the ratios to rsnow∕ice constant. Now, cprec is set to the value yielding the smallest volume error in step 1. The melt parameters are varied until the observed volume change for each glacier is matched within 5%.
This fully automated calibration procedure results in a glacier-specific parameter set that reproduces the observed change in ice volume over the last decades (see Figure 4 for an example). Although the relative contributions of accumulation and ablation to total mass change can not be directly constrained due to a lack in glacier-specific data on the mass balance components, our approach is able to realistically resolve the effect of large-scale snow redistribution processes: For very small glaciers at low elevation, high values for cprec are found (Table 1), corresponding to a larger relevance of avalanche deposition or snow drift (see Kuhn, 1995). For glaciers at very high elevation, the results of our calibration approach indicate a precipitation overestimate of the gridded meteorological data set, which is in line with reduced snow accumulation due to wind or avalanche erosion. Calibrated melt parameters are consistent within a range of about ±25% for most glaciers except those at elevations >3400 m a.s.l. (6% of the number), where higher values were found (Table 1).
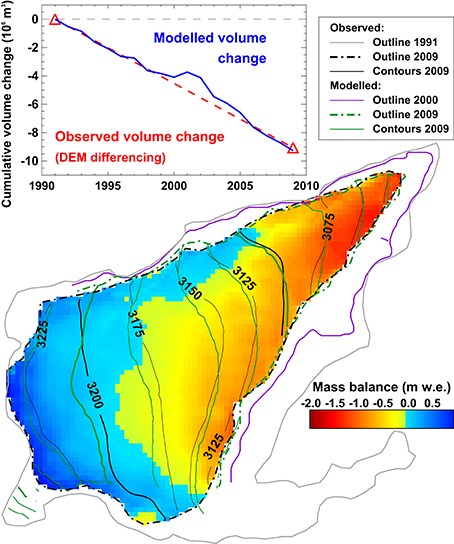
Figure 4. Calculated change in extent for Vadret dal Murtèl (Figure 3) during the calibration period 1991–2009. Modeled outlines are displayed for the year 2000 and 2009 (purple, green). Observed outlines for 1991 (model initialization) and 2009 are shown. Contour lines refer to observed (black) and calculated (green) ice surface topography in 2009. Mass balance distribution is given for a typical year within the calibration period (1998/99). The inset shows observed volume change from DEM differencing and cumulative annual volume change based on the model calibrated to these data.
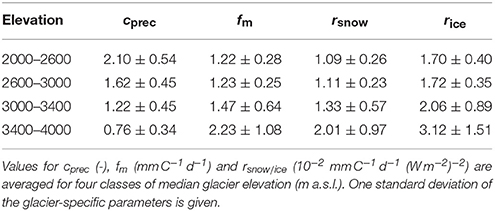
Table 1. Most important parameters of the model calibrated to each individual glacier.
We also derive a second set of model parameters using the same methods but completely ignoring the effects of supraglacial debris coverage and frontal break-off of ice on mass balance (see Section 3.1.1), processes that affect roughly one third of the investigated glaciers (Figure 1). Calibrated melt parameters are found to be 2% smaller on average for debris-covered glaciers when not accounting for supraglacial debris in the modeling. Contrarily, melt parameters for glaciers affected by frontal break-off of ice are 22% higher if the ad-hoc parameterization of this process is disabled. The description of frontal mass loss, hence, has a higher impact on melt factors than debris coverage in relative terms but only relates to 5% of the total ice volume of very small glaciers (compared to 33% for debris-covered glaciers).
3.3. Model Validation
We validate the model results against field-data based glacier-wide annual and winter mass balance. The observations are mostly outside of the calibration period (Figure 1) and allow evaluating the ability of the calibrated model to reproduce seasonal to annual mass balance variability and its spatial distribution. Measurements and model results are compared over the respective observation periods within each year. Given that the in-situ data is fully independent from our model results, and that the mass balance of the investigated glaciers is characterized by complex processes, we find a satisfying agreement with a RMSE of 0.45 m w.e. for both annual and winter balance (Figure 5). Whereas, the correlation is relatively high (r2 = 0.71) for annual balance, it is low (r2 = 0.24) for winter balance. This can probably be attributed to the limited skill of the gridded precipitation data set (MeteoSwiss, 2014) to reproduce year-to-year snow variability in unmeasured regions with complex topography. The overall bias in simulated winter mass balances is however small, which demonstrates that our calibrated model captures the long-term accumulation totals.
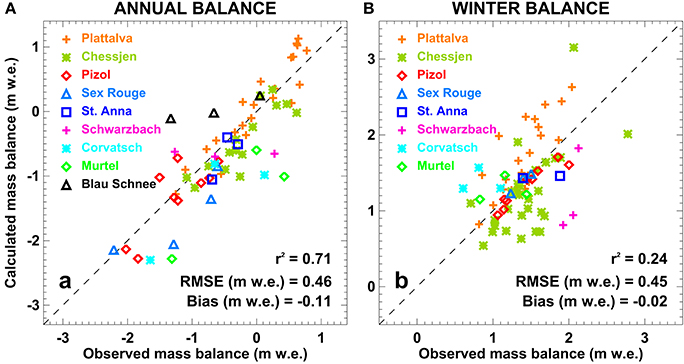
Figure 5. Observed vs. calculated glacier-wide (A) annual and (B) winter mass balance. Values for individual glaciers are coded with different colors and symbols, and the linear correlation coefficient (r2), the root-mean-square error (RMSE), and the average error (bias) is given.
Due to the sparsity of observational data on ice temperature (Figure 1) and the lacking temporal component of the measurements, the validation of the model for englacial temperature is difficult. For all locations of boreholes on very small glaciers, observed and modeled temperature at the respective depths and dates were compared. Measured and simulated englacial temperatures correlate well (r2 = 0.79). On average, the model predicts slightly too high ice temperatures (overestimate of 0.35°C). This difference can be attributed to the measurements on Vadret dal Corvatsch whose particular topographic situation (ice crest) is difficult to be captured by our one-dimensional model.
Unfortunately, available data are insufficient for thoroughly evaluating the performance of the simple models for debris-cover evolution and frontal break-off of ice. We assess the model's skill to reproduce point annual mass balance measurements on two of the surveyed glaciers that are partly debris covered. Using re-calibrated parameters for the model ignoring the effect of supraglacial debris results in an RMSE that is 2% higher and a bias with observations being 0.12 m w.e. larger compared to the model accounting for debris coverage. For justifying the many assumptions related to the modules for supraglacial debris and frontal mass loss, however, distributed measurements of debris cover thickness and its corresponding long-term spatio-temporal evolution, and continuous observations of frontal mass fluxes would be required. At present such a data basis is not at hand and highly challenging to be acquired at the mountain-range scale. By completely omitting these model components and neglecting all related feedbacks in experiments (both for calibration and scenario runs), we take a rigorous approach to assess their relevance on the final results (see Section 5.1).
4. Results
4.1. Present Ice Volume
For each glacier, the ice thickness distribution has been calculated based on the approach by Huss and Farinotti (2012). Results have been validated using to all available in-situ GPR measurements (see Section 2.2.3, Figure 1). By 2010, very small glaciers in Switzerland accounted for a total ice volume of 2.18 km3, of which almost 60% was concentrated in the size class 0.25–0.5 km2 (Table 2). The average thickness was 19 m. Combining the estimates of current ice volume with the observed volume changes since the 1960s to 1990s (Fischer et al., 2015) allows assessing recent losses relative to total ice volume. The volume of dwarf glaciers in Switzerland has declined by between 50 and 75% over the last decades, depending on the size class considered (Table 2). This demonstrates the high vulnerability of very small glaciers to an air temperature rise of roughly 1°C since the 1980s.
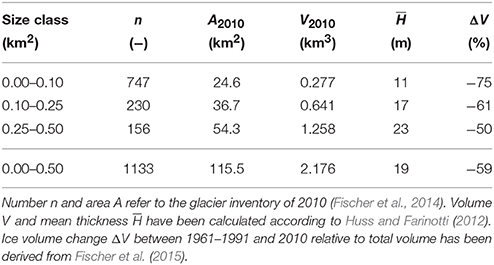
Table 2. Characteristics of very small glaciers in the Swiss Alps for three size classes.
4.2. Mass Balance Sensitivity
Several studies have assessed mass balance sensitivities to changes in air temperature and precipitation by calibrating models to glaciers with an extensive basis of direct observations (e.g., Oerlemans and Reichert, 2000; de Woul and Hock, 2005). The sensitivity of very small glaciers, however, remains largely unexplored. For all 1133 investigated glaciers, we calculated static sensitivities (constant glacier geometry) and dynamic sensitivities (changing glacier geometry until reaching a new equilibrium) for an air temperature rise of 1°C and a change in annual precipitation of +10%. Results are analyzed with respect to glacier area, average potential solar radiation, surface slope, median glacier elevation, and the degree of debris coverage.
We found average static mass balance sensitivities to temperature change of between −0.63 to −0.72 m w.e. a−1 C−1 for the individual drainage basins in Switzerland (Figure 6). The sensitivity was somewhat smaller than that reported for larger glaciers in the Swiss Alps (Oerlemans et al., 1998; Braithwaite and Zhang, 2000). For individual glaciers, sensitivities strongly varied – static sensitivities of between –0.2 to −1.4 m w.e. a−1 C−1 were found. This corresponds to almost the entire range inferred for all climatic regimes around the globe by de Woul and Hock (2005) and demonstrates the high variability in the dynamics and climate change response of very small glaciers within the same mountain range. Precipitation sensitivity was between +0.03 and +0.44 m w.e. a−1 10%−1, and was maximal in the Ticino catchment (+0.22 m w.e. a−1 10%−1) owing to more humid climate conditions compared to other regions of Switzerland (Figure 6).
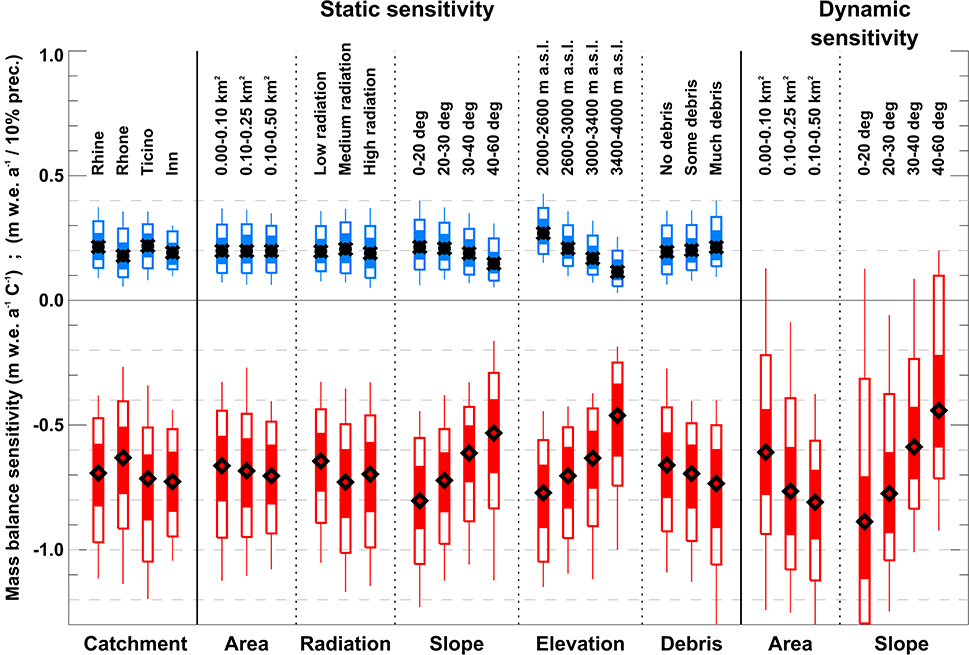
Figure 6. Calculated static and dynamic sensitivities (see text for details) of very small glaciers to temperature (+1°C, red) and precipitation change (+10%, blue). Glacier-specific sensitivities are shown for (i) the large-scale catchments, classes of (ii) area, (iii) radiation, (iv) slope, (v) elevation, and (vi) debris coverage. Diamonds show the median, shaded (light) bars the 50 (80)% quantile range of all glaciers, and lines span the 2.5 to the 97.5% quantile.
Static temperature and precipitation sensitivities of very small glaciers only varied relatively little and inconsistently for different classes of area and average potential radiation (Figure 6). Exposure (south/north) has no significant effect on the climate change response of small glaciers. In contrast, we found a strong influence of surface slope on static mass balance sensitivity, indicating that gently-sloping glaciers are most, very steep glaciers are least sensitive (Figure 6). This can be explained with a higher thickness and a longer response time of low-angle glaciers and corresponds to evidence from earlier studies (e.g., Fischer et al., 2015). Differences in mass balance sensitivity were also evident for classes of median glacier elevation: Low-lying glaciers are most sensitive, whereas high-altitude glaciers show strongly reduced sensitivities both to temperature and precipitation change. This can be attributed to their more “continental” climate conditions with less snow and limited melt during the summer season. Despite the effect of supraglacial debris coverage, which reduces the melt rates according to our model approach, we find maximal sensitivities for strongly debris-covered glaciers and smaller values for clean-ice glaciers (Figure 6). This counter-intuitive behavior can be largely attributed to the typical setting of debris-covered glaciers. They are often situated at rather low elevation and exhibit small surface slopes, both factors favoring high sensitivities.
Dynamic sensitivities involve the response of the glacier geometry on the change in climate forcing and thus more realistically describe the glaciers' actual sensitivity. In contrast to the static sensitivities we found a clear dependence on glacier size (Figure 6). The smallest size class was least sensitive as these glaciers have very short response times due to their generally small thicknesses (Table 2). The dynamic sensitivity of gently-sloping glaciers was found to be higher than the static one as they more easily disintegrate with climate change thus losing their accumulation area.
4.3. Future Area and Volume Changes
For all individual very small glaciers in Switzerland the fully distributed model was run until 2060 using nine climate scenarios (A1B, A2, RCP3PD; for each with a median, extreme, and a moderate evolution). The model was initialized with the glacier geometry of 2010. Figure 7 shows an exemplary model result, visualizing the fast decline in thickness and area that is likely to occur for most very small glaciers in Switzerland. St. Annafirn is expected to be reduced to a small ice patch in a shaded niche by 2040 according to the A1B median scenario.
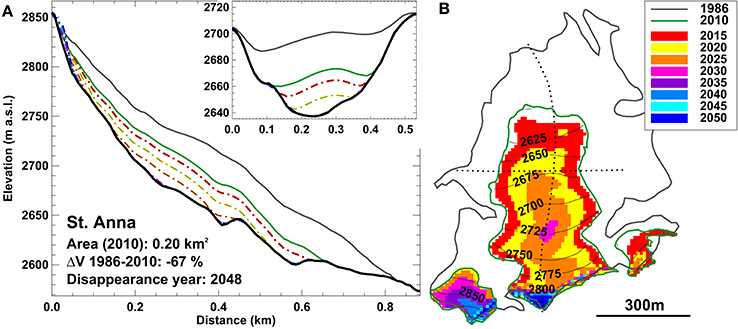
Figure 7. Calculated future evolution of St. Annafirn (Figure 3) according to the A1B median scenario. (A) A longitudinal and a transversal cross-section are shown, and (B) ice-covered areas are visualized in pentadal steps.
For all emission scenarios, the volume of very small glaciers in Switzerland is projected to tend toward zero by the end of the modeling period (Figure 8). The differences between the A1B, A2, and RCP3PD scenarios are minor as their air temperature projections only significantly diverge in the second half of the 21st century. However, glaciers are expected to lose about 80% (91, 62%) of their volume for the median (extreme, moderate) scenario between 2010 and 2030, and are, hence, not susceptible to uncertainties in future CO2 emissions. By 2060, our model predicts negligible ice volume for very small glaciers, except for the moderate scenarios with a remaining ice mass of 6–15% compared to 2010 (Figure 8).
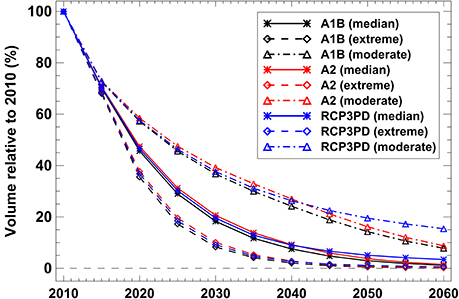
Figure 8. Calculated ice volume of all very small glaciers in Switzerland relative to 2010 for three CO2-emission pathways (A1B, A2, RCP3PD) and the median, the extreme, and the moderate scenario.
4.4. Past and Future Changes in Mass Balance
The mass budget of very small glaciers in Switzerland was balanced or slightly positive between 1965 and 1985 and has evolved into a strong disequilibrium over the last three decades (Figure 9). Between 2005 and 2015, typical mass balances were around –1.2 m w.e. a−1. The most negative years were 2003, 2006, 2011, and 2015 despite the substantial glacier area changes (i.e., a loss of the former ablation area, cf Figure 7) since the 1980s. The evolution of surface mass balance is similar for all hydrological basins of Switzerland though some subtle differences are evident: The transition from a balanced to a negative mass budget started somewhat earlier for the Inn catchment, whereas the Ticino catchment showed a more rapid mass loss than the other regions after 1985 (Figure 9).
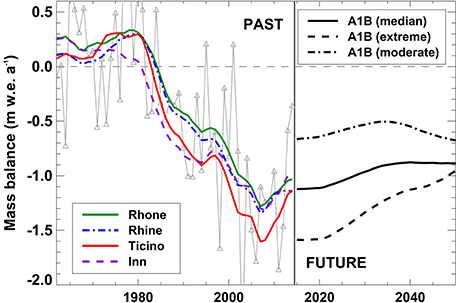
Figure 9. Average annual mass balance 1961–2014 for all very small glaciers in Switzerland (gray). Eleven-year running means for the subsets of the four large-scale catchment are shown. Future mass balances refer to the A1B scenario and the respective uncertainty ranges (extreme/moderate evolution).
The future mass balance of dwarf glaciers in Switzerland is projected to remain at around –1.0 m w.e. a−1 for the A1B median scenario with a tendency toward less negative values (Figure 9). The response time of very small glaciers is generally short (Kuhn, 1995), i.e., they quickly adapt their size to changed climatic conditions and retreat into cirques and niches with high accumulation rates and limited direct solar radiation (Figure 7). In consequence, they tend to be closer to a balanced mass budget.
4.5. Ice Temperature
The evolution of the englacial temperature profile over time was simulated with a continuous model run from 1961 to 2060 for three locations on each glacier (ablation area, equilibrium line, accumulation area) and has been averaged for all sites (Figure 10). An anticorrelation of ice temperature with air temperature is evident (see also Gilbert et al., 2012). During cold and wet periods, e.g., in the late 1970s, the glacier surface is better protected from cooling during autumn and winter due to a thick and water-saturated firn layer. With higher air temperatures, the firn layer of very small glaciers can be completely depleted within only a few years. This results in an efficient conductive cooling of the impermeable bare-ice area, which cannot be heated by refreezing processes due to the absence of crevasses and cracks. The highest englacial temperatures close to 0° were found in the accumulation area, whereas the model indicated ice at temperatures of around −1 to −2°C in the ablation areas of many very small glaciers (Figure 10). A notable drop in englacial temperatures is calculated for around 2005, following the extreme mass losses during the summer heat wave 2003. For the future, englacial temperatures are expected to slowly increase, albeit not reaching temperate conditions during the next decades (Figure 10).
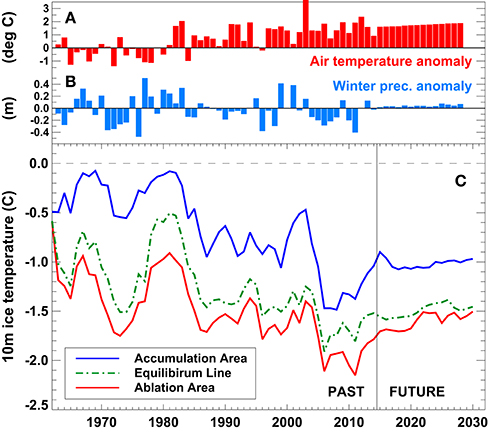
Figure 10. Anomalies of (A) summer temperature and (B) winter precipitation relative to the period 1961–1990. (C) Calculated change in englacial temperature at 10 m depth for sites in the accumulation area, at the ELA and in the ablation area. Time series represent averages of all very small glaciers >0.1 km2.
4.6. Runoff from Very Small Glaciers
Runoff from glacierized drainage basins has been reported to increase with glacier retreat and mass loss, and for several Swiss catchments, maximum glacier contribution has been projected to occur between 2020 and 2050 (e.g., Farinotti et al., 2012; Gabbi et al., 2012). For very small glaciers, however, annual runoff has, after a sharp increase in the 1980s, already reached its maximum between 1997 and 2004 (depending on the glacier size class considered, Figure 11). Peak water discharge from very small glaciers is thus already over and is expected to decline over the next decades. The decrease in runoff is especially pronounced in August, for which a reduction of more than 60% is found by 2060 compared to average discharge in 1961–1990 (Figure 11). Although the total runoff volume originating from very small glaciers is rather small given their overall area (Table 2), their imminent wastage might still remarkably affect the runoff regime of poorly glacierized alpine drainage basins.
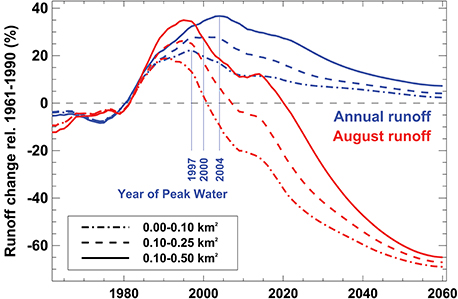
Figure 11. Changes in annual and August runoff from very small glaciers relative to the period 1961–1990. Results are shown for three size classes and the A1B median scenario. The constant hydrological catchment of each glacier refers to the perimeter ice-covered by 1973.
4.7. Disappearance Date
We define the disappearance date of very small glaciers as the year in which their area is either <3% of their extent in 2010, or <0.005 km2. 73% of all glaciers that were smaller than 0.1 km2 in the inventory of 2010 are expected to have disappeared by 2030 according to the A1B median scenario, and 97% are gone by 2060 (Figure 12). Glaciers with a current area of 0.1–0.5 km2 take longer to disintegrate: By 2030, only 11% are projected to have vanished but until 2060 about 88% are likely to have completely melted (Figure 12). Whereas, the vast majority of very small glaciers in the Swiss Alps is expected to disappear during the five coming decades, a few ice bodies, even within the smallest size class, might still survive the projected substantial warming. Furthermore, the shrinkage and disintegration of larger glaciers over the next decades is likely to continuously recharge the size class of very small glaciers. This effect is, however, not taken into account in the present study.
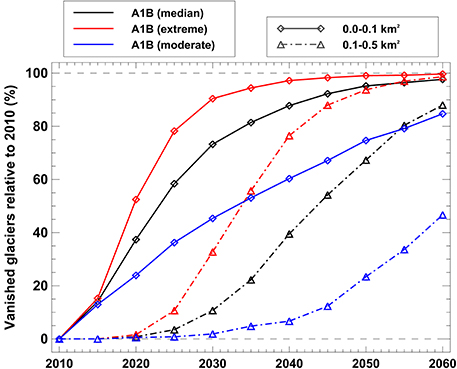
Figure 12. Percentage of glaciers expected to disappear between 2010 and 2060 for the A1B median, extreme, and moderate scenario and two glacier size classes.
5. Discussion
5.1. Model Uncertainty
We can separate several components leading to a final uncertainty in projected glacier change and modeled sensitivity: (1) Uncertainties in climate projections, (2) uncertainties in the input data (most importantly in the glacier-specific geodetic mass balances), (3) uncertainties due to assumptions during the model calibration procedure, and (4) uncertainties in model structure. In order to quantify these individual error components, dedicated experiments were performed.
The uncertainty in climatic projections is considerable and the spread in calculated small glacier volume loss, even for the same CO2-emission pathway, is large (Figure 8). By running the model with nine different scenarios, the respective uncertainties in our results were estimated and accounted for about ±10% of projected volume loss by 2040, or ±14 years regarding the disappearance date of very small glaciers.
The impact of the procedure to generate daily series of future meteorological variables (see Section 2.2.5) was assessed by computing glacier evolution using day-to-day variability from different sets of randomly chosen years. Calculated volume change for the A1B median scenario by 2030 varied by ±0.8%. When prescribing an increase in the day-to-day temperature variability of 8% by the end of the century (Farinotti, 2013), simulated glacier volume change (A1B median, 2030) increased by 1.0%.
The random uncertainty in geodetic mass balance can reach ±0.3 m w.e. a−1 for very small glaciers (Fischer et al., 2015), and thus accounts for a considerable percentage of the signal. We randomly perturbed geodetic mass changes with their stochastic uncertainty and re-calibrated the model to match the generated balances. Projected volume change was then compared to the reference result. We found a difference in cumulative calculated volume change 2010–2030 of 4%. The stochastic uncertainty in the data used for calibration can noticeably affect the projections for individual glaciers but almost cancels out for larger samples.
The calibration procedure (Section 3.2) is fully automated and involves a number of assumptions necessary to constrain the model for each individual glacier. We performed three specific sub-experiments and (i) varied the allowed parameter range for cprec, and (ii/iii) prescribed higher/lower melt factors for initializing the calibration scheme. The model was then re-calibrated resulting in alternative parameter sets. We then re-run the model with the A1B scenario and these parameters, and compared our results to the reference simulation. Although model results for individual glaciers partly differed more importantly from the reference, the cumulated total volume change 2010–2030 varied by ±4% for the individual sub-experiments, thus indicating that this source of uncertainty has a limited importance.
Evaluating the complete uncertainty due to simplifications in the glacier model is difficult. Various processes are parameterized. Describing them with a fully physically-based model is not possible due to the variety and complexity of the involved processes and the regional scope of the study. For example, glacier melt is calculated using temporally constant empirical factors of a degree-day model (Hock, 1999). It would, however, be ideal to use an energy-balance model that is able to resolve the heat exchange at the glacier surface in a process-based way and to capture non-linear effects related to, among others, snow and ice albedo variations or a change in the turbulent heat fluxes (e.g., Gabbi et al., 2014). Here, we are unable to quantify the importance of these processes for our projections.
We quantify the uncertainty stemming from the strongly simplified model components for debris-cover evolution and frontal break-off of ice by disabling these modules both for the calibration period and for the future model runs, thus capturing their overall effect on the results. Calculated volume change of all very small glaciers for the A1B median scenario is 1.1% (0.6%) higher by 2020 (2030) when not accounting for supraglacial debris coverage, and 1.2% (1.7%) higher if the model for frontal mass loss is deactivated. This indicates that the impact of assumptions in these models on the final results is rather small, and that the added model complexity is not necessary to realistically simulate the future evolution of very small glaciers at the mountain-range scale.
We note that the differences might be partly determined by error-compensation effects: Calculated mass balance distributions are likely unrealistic for debris-covered ice when ignoring the impact of debris, and for the accumulation zone (underestimation of mass fluxes) when not accounting for frontal mass loss. Nevertheless, calculated mass balances sum up to the observed volume change over the past decades due to model calibration using geodetic balances (see Section 3.2). However, as long as no detailed measurements of the temporal evolution of sub-debris melt and long-term observations of ice ablation by frontal break-off are available, we are unable to reliably constrain and/or validate a model for these processes. It is thus presently undecidable whether the yet poorly understood relationships between debris cover, frontal mass loss, and mass balance should be included in regional glacier change assessments and have the potential to reduce their uncertainties. We recommend further investigations in this field of research for better understanding the temporal change and spatial distribution of supraglacial debris and its effect on melting, as well as the feedbacks of frontal break-off of ice on long-term glacier evolution. A first and important step would be a detailed inventory of debris-covered surfaces and glaciers experiencing frontal ablation, including estimates of the magnitude of the loss. Such information is generally unavailable for most mountain ranges on Earth but is a prerequisite for the modeling of the involved processes. For very small glaciers, repeated terrestrial laser scanning (Fischer et al., 2016) has a considerable potential for monitoring small-scale variations in melt rates, as well as short-term surface elevation, volume, and geodetic mass changes.
5.2. Can Very Small Glaciers Stabilize Despite Climate Change?
Although our simulations indicated that the vast majority of very small glaciers will completely disappear throughout the coming decades and that almost no ice will be left in this glacier size class (Figures 8, 12), a few glaciers are able to temporarily resist the changed climatic conditions and will still be present in the mid-21st century according to our model. In total, we found 67 (6%) very small glaciers that will retain more than half of their present surface area according to the moderate A1B scenario by 2050. This is surprising as many medium or even large glaciers in the European Alps are expected to completely disintegrate over the next five decades (see e.g., Huss et al., 2010b; Salzmann et al., 2012).
Analyzing the characteristics of the remaining very small glaciers shows that they mainly belong to two particular types, which are least sensitive to the projected changes in air temperature and precipitation: (1) Some glaciers at very high elevation (i.e., with a median elevation considerably above the current regional ELA) are more likely to stabilize. They stop being subject to frontal mass loss due to retreat from the break-off ledge, and exhibit rather low accumulation/ablation rates and thus small precipitation/temperature sensitivities (Figure 6). (2) More interestingly, also glaciers at very low elevation (up to 600 m below the current regional ELA) are projected to survive, at least for changes in climate forcing occurring until 2050. These glaciers are mostly located in regions with steep topographic gradients and high precipitation rates. They are characterized by a high importance of winter accumulation, often strongly enhanced by avalanching and snow drift. Furthermore, direct solar radiation is extremely low, as they are situated below precipitous, north-exposed rock walls. The interaction of rather small air temperature and high winter precipitation sensitivity leads to a small overall sensitivity of these glaciers to future climate change.
We illustrate this particular behavior of very small glaciers with the example of Vadrec dal Cengal located in the Maira catchment in South-Eastern Switzerland (Figure 1). The remarkably low median elevation (2210 m a.s.l. in 2009) of this glacier is supported by high accumulation rates due to avalanching and strong shading by shear cliffs rising more than 500 m above the glacier. Over the last decades, Vadrec dal Cengal has considerably retreated and is now located in a highly protected niche (Figure 13). Since 1990, annual mass balances have become continuously less negative despite increasing air temperatures as the extent of the former ablation area has been strongly reduced. Until 2060, the glacier is expected to experience negative balances, but the mass losses are limited, resulting in a slow glacier retreat (Figure 13). Similar cases have been reported by Carrivick et al. (2015) for the Eastern Alps and Debeer and Sharp (2009) for the Canadian Rockies.
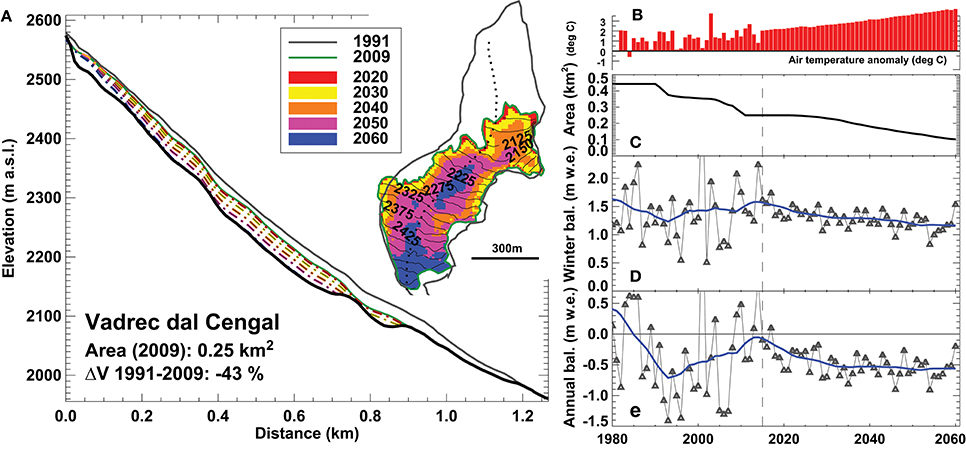
Figure 13. Simulated future evolution of Vardec dal Cengal, South-Eastern Switzerland (A1B median scenario). (A) Longitudinal profile and past, current and future glacier extents, and time series of (B) air temperature anomaly, (C) glacier area, (D) winter mass balance, and (E) annual balance.
6. Conclusion
Based on a comprehensive collection of field data and a distributed model applicable at the mountain-range scale, we have assessed the past and future climate change response of all very small glaciers in Switzerland. Glaciers smaller than 0.5 km2 according to the inventory of 2010 have lost 60% of their total volume over the last three decades and have thus been more substantially impacted by climatic changes compared to larger glaciers. However, the temporal evolution of mass balance as well as typical rates of ice thickness loss are similar to other glacier size classes in the Alps. According to our model, many very small glaciers are subject to a polythermal englacial temperature regime in their ablation area, even though being situated at relatively low elevation. This is backed up by direct measurements and can be attributed to the fast depletion of the firn cover over the last decades and limited horizontal movement of the ice. These factors favor the formation of an impermeable body of ice, which is not susceptible to water transfer and warming by latent heat exchange.
The mass balance sensitivity of very small glaciers to temperature and precipitation change is similar to that of larger ice masses. However, it is characterized by a strong variability among individual glaciers. Gently-sloping, low-elevation, and debris-covered glaciers exhibit the highest sensitivities. Forced with a probabilistic range of RCM results referring to different CO2-emission scenarios, we predict a strong volume loss of very small glaciers in the near future. Between 2010 and 2040, more than 90% of the current volume of very small glaciers is expected to have melted, and 71% of the glaciers will completely vanish according to the median climate evolution. Whereas, the ultimate demise of the vast majority of very small glaciers by the mid-21st century is likely, some avalanche-fed glaciers at extremely radiation-protected locations at low elevation might reach a quasi-equilibrium due to a high sensitivity to rising winter precipitation. Maximum water release from very small glaciers has already been reached around the year 2000 and annual runoff volumes are now decreasing. As the headwaters of many catchments in the European Alps are still characterized by the presence of small glaciers, the expected strong decline in summer runoff over the next decades might noticeably influence the hydrological regime in spite of the minor areal portion of glacierized surfaces.
Very small glaciers are omnipresent in most mountain ranges of the Earth and clearly dominate the number of individual glaciers. However, describing and capturing their response to climate change with modeling approaches is challenging. This is mostly due to their highly variable characteristics and the relevance of snow redistribution processes. Although the almost complete disappearance of glaciers presently smaller than 0.5 km2 over the next few decades is likely, a continuous recharge of the size class of very small glaciers through the disintegration of larger glaciers will occur, thus eliciting a better understanding of the processes determining their mass balance response.
Author Contributions
MH and MF gathered and prepared all data. MH developed the modeling procedure, performed all calculations and made the figures. MH and MF contributed to the discussion of results, and wrote the paper.
Funding
This study was supported by SNSF grant 200021_137586.
Conflict of Interest Statement
The authors declare that the research was conducted in the absence of any commercial or financial relationships that could be construed as a potential conflict of interest.
Acknowledgments
Swisstopo and MeteoSwiss are acknowledged for topographical and meteorological data. We thank the numerous field assistants contributing to measurements on very small glaciers over the last years. M. Hoelzle commented on an earlier version of the manuscript. Helpful comments by the reviewers and the scientific editor contributed to the final version of the paper.
References
Alean, J. (1985). Ice avalanche activity and mass balance of a high-altitude hanging glacier in the Swiss Alps. Ann. Glaciol. 6, 248–249.
Anderson, R. S. (2000). A model of ablation-dominated medial moraines and the generation of debris-mantled glacier snouts. J. Glaciol. 46, 459–469. doi: 10.3189/172756500781833025
Bahr, D. B., and Radić, V. (2012). Significant contribution to total mass from very small glaciers. Cryosphere 6, 763–770. doi: 10.5194/tc-6-763-2012
Beniston, M., Stephenson, D. B., Christensen, O. B., Ferro, C. A. T., Frei, C., Goyette, S., et al. (2007). Future extreme events in European climate: an exploration of regional climate model projections. Clim. Change 81, 71–95. doi: 10.1007/s10584-006-9226-z
Braithwaite, R., and Zhang, Y. (2000). Sensitivity of mass balance of five Swiss glaciers to temperature changes assessed by tuning a degree-day model. J. Glaciol. 46, 7–14. doi: 10.3189/172756500781833511
Brock, B. W., Mihalcea, C., Kirkbride, M. P., Diolaiuti, G., Cutler, M. E. J., and Smiraglia, C. (2010). Meteorology and surface energy fluxes in the 2005-2007 ablation seasons at the Miage debris-covered glacier, Mont Blanc Massif, Italian Alps. J. Geophys. Res. Atmos. 115:D09106. doi: 10.1029/2009JD013224
Carrivick, J. L., Berry, K., Geilhausen, M., James, W. H., Williams, C., Brown, L. E., et al. (2015). Decadal-scale changes of the ödenwinkelkees, Central Austria, suggest increasing control of topography and evolution towards steady state. Geografiska Ann. Ser. A Phys. Geogr. 97, 543–562. doi: 10.1111/geoa.12100
Carturan, L., Baldassi, G. A., Bondesan, A., Calligaro, S., Carton, A., Cazorzi, F., et al. (2013). Current behaviour and dynamics of the lowermost Italian glacier (Montasio Occidentale, Julian Alps), Geografiska Ann. Ser. A Phys. Geogr. 95, 79–96. doi: 10.1111/geoa.12002
CH2014-Impacts (2014). Toward Quantitative Scenarios of Climate Change Impacts in Switzerland. OCCR, FOEN, MeteoSwiss, C2SM, Agroscope, ProClim, Bern.
Chueca, J., Julián, A., and López-Moreno, J. I. (2007). Recent evolution (1981-2005) of the Maladeta glaciers, Pyrenees, Spain: extent and volume losses and their relation with climatic and topographic factors. J. Glaciol. 53, 547–557. doi: 10.3189/002214307784409342
Cogley, J., Hock, R., Rasmussen, L., Arendt, A., Bauder, A., Braithwaite, R., et al. (2011). Glossary of Glacier Mass Balance and Related Terms, IPH-VII technical documents in Hydrology no. 86, IACS contribution no. 2.
Colucci, R. R., Forte, E., Boccali, C., Dossi, M., Lanza, L., Pipan, M., et al. (2015). Evaluation of internal structure, volume and mass of glacial bodies by integrated LiDAR and ground penetrating radar surveys: the case study of Canin Eastern Glacieret (Julian Alps, Italy). Surv. Geophys. 36, 231–252. doi: 10.1007/s10712-014-9311-1
de Woul, M., and Hock, R. (2005). Static mass-balance sensitivity of Arctic glaciers and ice caps using a degree-day approach. Ann. Glaciol. 42, 217–224. doi: 10.3189/172756405781813096
Debeer, C. M., and Sharp, M. J. (2007). Recent changes in glacier area and volume within the southern Canadian Cordillera. Ann. Glaciol. 46, 215–221. doi: 10.3189/172756407782871710
Debeer, C. M., and Sharp, M. J. (2009). Topographic influences on recent changes of very small glaciers in the Monashee Mountains, British Columbia, Canada. J. Glaciol. 55, 691–700. doi: 10.3189/002214309789470851
Dixon, E. J., Manley, W. F., and Lee, C. M. (2005). The emerging archaeology of glaciers and ice patches: examples from Alaska's Wrangell-St. Elias National Park and Preserve. Am. Antiq. 70, 129–143. doi: 10.2307/40035272
Escher-Vetter, H., and Rentsch, H. (1995). The behaviour of the Bavarian glaciers: results from surveying and mass balance modelling. Z. Gletsch. Glazialgeol. 31, 181–187.
Faillettaz, J., Funk, M., and Vincent, C. (2015). Avalanching glacier instabilities: Review on processes and early warning perspectives. Rev. Geophys. 53, 203–224. doi: 10.1002/2014RG000466
Farinotti, D. (2013). On the effect of short-term climate variability on mountain glaciers: insights from a case study. J. Glaciol. 59, 992–1006. doi: 10.3189/2013JoG13J080
Farinotti, D., Magnusson, J., Huss, M., and Bauder, A. (2010). Snow accumulation distribution inferred from time-lapse photography and simple modelling. Hydrol. Process. 24, 2087–2097. doi: 10.1002/hyp.7629
Farinotti, D., Usselmann, S., Huss, M., Bauder, A., and Funk, M. (2012). Runoff evolution in the Swiss Alps: projections for selected high-alpine catchments based on ENSEMBLES scenarios. Hydrol. Process. 26, 1909–1924. doi: 10.1002/hyp.8276
Fischer, A., Olefs, M., and Abermann, J. (2011). Glaciers, snow and ski tourism in Austria's changing climate. Ann. Glaciol. 52, 89–96. doi: 10.3189/172756411797252338
Fischer, M., Huss, M., Barboux, C., and Hoelzle, M. (2014). The new Swiss Glacier Inventory SGI2010: relevance of using high-resolution source data in areas dominated by very small glaciers. Arct. Antarct. Alp. Res. 46, 933–945. doi: 10.1657/1938-4246-46.4.933
Fischer, M., Huss, M., and Hoelzle, M. (2013). Recent changes of very small glaciers in the Swiss Alps. Geophys. Res. Abstr. 15, EGU2013–EGU2150.
Fischer, M., Huss, M., and Hoelzle, M. (2015). Surface elevation and mass changes of all Swiss glaciers 1980-2010. Cryosphere 9, 525–540. doi: 10.5194/tc-9-525-2015
Fischer, M., Huss, M., Kummert, M., and Hoelzle, M. (2016). Use of an ultra-long-range terrestrial laser scanner to monitor the mass balance of very small glaciers in the Swiss Alps. Cryosphere Discuss. 2016, 1–27. doi: 10.5194/tc-2016-46
Frauenfelder, R. E. A. (2001). Low Altitude Ice Archives. Scientific Report from Partner 7 (GIUZ), WP3(C), in Environmental and Climatic Records from High Elevation Alpine Glaciers (ALPCLIM), Final Report.
Frei, C. (2014). Interpolation of temperature in a mountainous region using nonlinear profiles and non-Euclidean distances. Int. J. Climatol. 34, 1585–1605. doi: 10.1002/joc.3786
Gabbi, J., Carenzo, M., Pellicciotti, F., Bauder, A., and Funk, M. (2014). A comparison of empirical and physically based glacier surface melt models for long-term simulations of glacier response. J. Glaciol. 60, 1140–1154. doi: 10.3189/2014JoG14J011
Gabbi, J., Farinotti, D., Bauder, A., and Maurer, H. (2012). Ice volume distribution and implications on runoff projections in a glacierized catchment. Hydrol. Earth Syst. Sci. 16, 4543-4556. doi: 10.5194/hess-16-4543-2012
Gellatly, A. F., Smiraglia, C., Grove, J. M., and Latham, R. (1994). Recent variations of Ghiacciaio del Calderone, Abruzzi, Italy. J. Glaciol. 40, 486–490.
Gilbert, A., Vincent, C., Gagliardini, O., Krug, J., and Berthier, E. (2015). Assessment of thermal change in cold avalanching glaciers in relation to climate warming. Geophys. Res. Lett. 42, 6382–6390. doi: 10.1002/2015GL064838
Gilbert, A., Vincent, C., Wagnon, P., Thibert, E., and Rabatel, A. (2012). The influence of snow cover thickness on the thermal regime of Tête Rousse Glacier (Mont Blanc range, 3200 m a.s.l.): consequences for outburst flood hazards and glacier response to climate change. J. Geophys. Res. Earth Surf. 117:F04018. doi: 10.1029/2011JF002258
González Trueba, J. J., Martín Moreno, R., Martínez de Pisón, E., and Serrano, E. (2008). Little Ice Age glaciation and current glaciers in the Iberian Peninsula. Holocene 18, 551–568. doi: 10.1177/0959683608089209
Grunewald, K., and Scheithauer, J. (2010). Europe's southernmost glaciers: response and adaptation to climate change. J. Glaciol. 56, 129–142. doi: 10.3189/002214310791190947
Haeberli, W., Frauenfelder, R., Kääb, A., and Wagner, S. (2004). Characteristics and potential climatic significance of ”miniature ice caps” (crest- and cornice-type low-altitude ice archives). J. Glaciol. 50, 129–136. doi: 10.3189/172756504781830330
Hager, P. (2002). Glaziologische Untersuchungen am Gipfelgrat des Vadret dal Corvatsch: Thermik und Oberflächenprozesse, Diploma Thesis, University of Zurich.
Hagg, W., Mayer, C., Mayr, E., and Heilig, A. (2012). Climate and glacier fluctuations in the Bavarian Alps in the past 120 years. Erdkunde 66, 121–142. doi: 10.3112/erdkunde.2012.02.03
Hay, L. E., Wilby, R. L., and Leavesley, G. H. (2000). A comparison of Delta Change and downscaled GCM scenarios for three mountainous basins in the United States. J. Am. Water Resour. Assoc. 36, 387–397. doi: 10.1111/j.1752-1688.2000.tb04276.x
Helfricht, K., Lehning, M., Sailer, R., and Kuhn, M. (2015). Local extremes in the LiDAR-derived snow cover of alpine glaciers. Geografiska Ann. Ser. A Phys. Geogr. doi: 10.1111/geoa.12111
Hock, R. (1999). A distributed temperature-index ice- and snowmelt model including potential direct solar radiation. J. Glaciol. 45, 101–111.
Hughes, P. (2008). Response of a Montenegro glacier to extreme summer heatwaves in 2003 and 2007. Geografiska Ann. Ser. A Phys. Geogr. 90, 259–267. doi: 10.1111/j.1468-0459.2008.00344.x
Hughes, P. D. (2007). Recent behaviour of the Debeli Namet glacier, Durmitor, Montenegro. Earth Surf. Process. Land. 32, 1593–1602. doi: 10.1002/esp.1537
Hughes, P. D. (2009). Twenty-first century glaciers and climate in the Prokletije Mountains, Albania. Arct. Antarct. Alp. Res. 41, 455–459. doi: 10.1657/1938-4246-41.4.455
Huss, M. (2011). Present and future contribution of glacier storage change to runoff from macroscale drainage basins in Europe. Water Resour. Res. 47, W07511. doi: 10.1029/2007WR010299
Huss, M., Dhulst, L., and Bauder, A. (2015). New long-term mass-balance series for the swiss alps. J. Glaciol. 61, 551–562. doi: 10.3189/2015JoG15J015
Huss, M., and Farinotti, D. (2012). Distributed ice thickness and volume of all glaciers around the globe. J. Geophys. Res. 117, F04010. doi: 10.1029/2012JF002523
Huss, M., Farinotti, D., Bauder, A., and Funk, M. (2008). Modelling runoff from highly glacierized alpine drainage basins in a changing climate. Hydrol. Process. 22, 3888–3902. doi: 10.1002/hyp.7055
Huss, M., and Hock, R. (2015). A new model for global glacier change and sea-level rise. Front. Earth Sci. 3:54. doi: 10.3389/feart.2015.00054
Huss, M., Jouvet, G., Farinotti, D., and Bauder, A. (2010a). Future high-mountain hydrology: a new parameterization of glacier retreat, Hydrol. Earth Syst. Sci. 14, 815–829. doi: 10.5194/hess-14-815-2010
Huss, M., Usselmann, S., Farinotti, D., and Bauder, A. (2010b). Glacier mass balance in the south-eastern Swiss Alps since 1900 and perspectives for the future. Erdkunde 65, 119–140. doi: 10.3112/erdkunde.2010.02.02
Huss, M., Zemp, M., Joerg, P. C., and Salzmann, N. (2014). High uncertainty in 21st century runoff projections from glacierized basins. J. Hydrol. 510, 35–48. doi: 10.1016/j.jhydrol.2013.12.017
Jost, G., Moore, R. D., Menounos, B., and Wheate, R. (2012). Quantifying the contribution of glacier runoff to streamflow in the upper Columbia River Basin, Canada. Hydrol. Earth Syst. Sci. 16, 849–860. doi: 10.5194/hess-16-849-2012
Kuhn, M. (1993). Der Mieminger Schneeferner, ein Beispiel eines lawinenernährten Kargletschers. Z. Gletsch. Glazialgeol. 29, 153–171.
Marti, R., Gascoin, S., Houet, T., Ribière, O., Laffly, D., Condom, T., et al. (2015). Evolution of Ossoue Glacier (French Pyrenees) since the end of the Little Ice Age. Cryosphere 9, 1773–1795. doi: 10.5194/tc-9-1773-2015
Müller, F., Caflisch, T., and Müller, G. (1976). Firn und Eis der Schweizer Alpen: Gletscherinventar, Technical Report 57, Geographisches Institut der ETH Zürich, Zürich.
Nicholson, L., and Benn, D. I. (2006). Calculating ice melt beneath a debris layer using meteorological data. J. Glaciol. 52, 463–470. doi: 10.3189/172756506781828584
Oerlemans, J., Anderson, B., Hubbard, A., Huybrechts, P., Jóhannesson, T., and Knap, W. (1998). Modelling the response of glaciers to climate warming. Clim. Dyn. 14, 267–274.
Oerlemans, J., and Reichert, B. K. (2000). Relating glacier mass balance to meteorological data by using a seasonal sensitivity characteristic. J. Glaciol. 46, 1–6. doi: 10.3189/172756500781833269
Paul, F., Kääb, A., Maisch, M., Kellenberger, T., and Haeberli, W. (2004). Rapid disintegration of Alpine glaciers observed with satellite data. Geophys. Res. Lett. 31:L21402. doi: 10.1029/2004GL020816
Pecci, M., D'Agata, C., and Smiraglia, C. (2008). Ghiacciaio del Calderone (Apennines, Italy): the mass balance of a shrinking mediterranean glacier. Geogr. Fis. Din. Quat. 31, 55–62.
Pfeffer, W. T., Arendt, A. A., Bliss, A., Bolch, T., Cogley, J. G., Gardner, A. S., et al. (2014). The Randolph Glacier Inventory: a globally complete inventory of glaciers. J. Glaciol. 60, 537–552. doi: 10.3189/2014JoG13J176
Piermattei, L., Carturan, L., and Guarnieri, A. (2015). Use of terrestrial photogrammetry based on structure-from-motion for mass balance estimation of a small glacier in the Italian Alps. Earth Surf. Process. Land. 40, 1791–1802. doi: 10.1002/esp.3756
Pralong, A., and Funk, M. (2006). On the instability of avalanching glaciers. J. Glaciol. 52, 31–48. doi: 10.3189/172756506781828980
Rowan, A. V., Egholm, D. L., Quincey, D. J., and Glasser, N. F. (2015). Modelling the feedbacks between mass balance, ice flow and debris transport to predict the response to climate change of debris-covered glaciers in the Himalaya. Earth Planet. Sci. Lett. 430, 427–438. doi: 10.1016/j.epsl.2015.09.004
Salzmann, N., Machguth, H., and Linsbauer, A. (2012). The Swiss Alpine glaciers' response to the global '2deg C air temperature target'. Environ. Res. Lett. 7:044001. doi: 10.1088/1748-9326/7/4/044001
Sanders, J. W., Cuffey, K. M., Moore, J. R., MacGregor, K. R., and Kavanaugh, J. L. (2012). Periglacial weathering and headwall erosion in cirque glacier bergschrunds. Geology 40, 779–782. doi: 10.1130/G33330.1
Schuler, T., Fischer, U. H., Sterr, R., Hock, R., and Gudmundsson, G. H. (2002). Comparison of modeled water input and measured discharge prior to a release event: Unteraargletscher, Bernese Alps, Switzerland. Nordic Hydrol. 33, 27–46.
Seppi, R., Zanoner, T., Carton, A., Bondesan, A., Francese, R., Carturan, L., et al. (2015). Current transition from glacial to periglacial processes in the dolomites (south-eastern alps). Geomorphology 228, 71 – 86. doi: 10.1016/j.geomorph.2014.08.025
Serrano, E., González Trueba, J. J., Sanjosé, J. J., and Del Río, L. M. (2011). Ice patch origin, evolution and dynamics in a temperature high mountain environment: the Jou Negro, Picos De Europa (NW Spain), Geografiska Ann. Ser. A Phys. Geogr. 93, 57–70. doi: 10.1111/j.1468-0459.2011.00006.x
Signer, N. (2014). Analysis of Ice Temperatures of Four Selected Very Small Glaciers in the Swiss Alps by Means of Modelling and Ground Penetrating Radar, M. Sc. Thesis, University of Zurich.
Stokes, C. R., Popovnin, V., Aleynikov, A., Gurney, S. D., and Shahgedanova, M. (2007). Recent glacier retreat in the Caucasus Mountains, Russia, and associated increase in supraglacial debris cover and supra-/proglacial lake development. Ann. Glaciol. 46, 195–203. doi: 10.3189/172756407782871468
Triglav-Čekada, M., and Gabrovec, M. (2013). Documentation of Triglav glacier, Slovenia, using non-metric panoramic images. Ann. Glaciol. 54, 80–86. doi: 10.3189/2013AoG62A095
Keywords: very small glaciers, glacier mass balance, glacier retreat, snow redistribution, regional modeling, projections, climate change
Citation: Huss M and Fischer M (2016) Sensitivity of Very Small Glaciers in the Swiss Alps to Future Climate Change. Front. Earth Sci. 4:34. doi: 10.3389/feart.2016.00034
Received: 06 December 2015; Accepted: 21 March 2016;
Published: 13 April 2016.
Edited by:
Thomas Vikhamar Schuler, University of Oslo, NorwayReviewed by:
Christoph Schneider, Humboldt University Berlin, GermanyJoseph Michael Shea, International Centre for Integrated Mountain Development, Nepal
Copyright © 2016 Huss and Fischer. This is an open-access article distributed under the terms of the Creative Commons Attribution License (CC BY). The use, distribution or reproduction in other forums is permitted, provided the original author(s) or licensor are credited and that the original publication in this journal is cited, in accordance with accepted academic practice. No use, distribution or reproduction is permitted which does not comply with these terms.
*Correspondence: Matthias Huss, matthias.huss@unifr.ch