Carbon Leaching from Tropical Peat Soils and Consequences for Carbon Balances
 Tim Rixen
 Antje Baum
 Francisca Wit
 Joko Samiaji
- 1Leibniz Center for Tropical Marine Ecology, Bremen, Germany
- 2Department of Biogeochemistry, Institute of Geology, University of Hamburg, Hamburg, Germany
- 3Faculty of Fishery and Marine Science, University of Riau, Pekanbaru, Indonesia
Drainage and deforestation turned Southeast (SE) Asian peat soils into a globally important CO2 source, because both processes accelerate peat decomposition. Carbon losses through soil leaching have so far not been quantified and the underlying processes have hardly been studied. In this study, we use results derived from nine expeditions to six Sumatran rivers and a mixing model to determine leaching processes in tropical peat soils, which are heavily disturbed by drainage and deforestation. Here we show that a reduced evapotranspiration and the resulting increased freshwater discharge in addition to the supply of labile leaf litter produced by re-growing secondary forests increase leaching of carbon by ~200%. Enhanced freshwater fluxes and leaching of labile leaf litter from secondary vegetation appear to contribute 38 and 62% to the total increase, respectively. Decomposition of leached labile DOC can lead to hypoxic conditions in rivers draining disturbed peatlands. Leaching of the more refractory DOC from peat is an irrecoverable loss of soil that threatens the stability of peat-fringed coasts in SE Asia.
Introduction
Pristine peat swamp forests are rare with only circa 10% left on the islands of Borneo and Sumatra (Miettinen and Liew, 2010). The remaining disturbed peat soils are drained, covered by plantations, shrubs and secondary forests, and are characterized by a heavily altered hydrological cycle. As seen in a river catchment on Borneo, deforestation decreases evapotranspiration and thereby increases freshwater fluxes as well as the riverine export of DOC (Moore et al., 2013). Depending on the soil types in their catchments, DOC concentrations in rivers differ in their response to changes in freshwater fluxes, which are mostly linked to precipitation. In rivers draining organo-mineral soils, enhanced freshwater fluxes raise DOC concentrations, whereas DOC concentrations in high-latitude rivers draining peat soils do not respond to changing precipitation rates until flooding occurs at which point the surface runoff dilutes the DOC concentration in the river (Moore and Jackson, 1989; Clark et al., 2008).
Processes controlling carbon leaching from tropical peat soils have so far not been studied. Approximately half of all tropical peat soils are located in Indonesia (0.207 1012 m2) and mostly in the coastal plains of the islands of Irian Jaya, Borneo, and Sumatra (Page et al., 2011). This study quantifies carbon leaching from Indonesian peat soils based on data obtained during nine expeditions to the Siak and five other major rivers draining peatlands in Central Sumatra. Furthermore, we developed a mixing model in order to simulate processes responsible for carbon leaching and applied our results to Indonesian peatlands (Figure 1, Table 1, Figure S1).
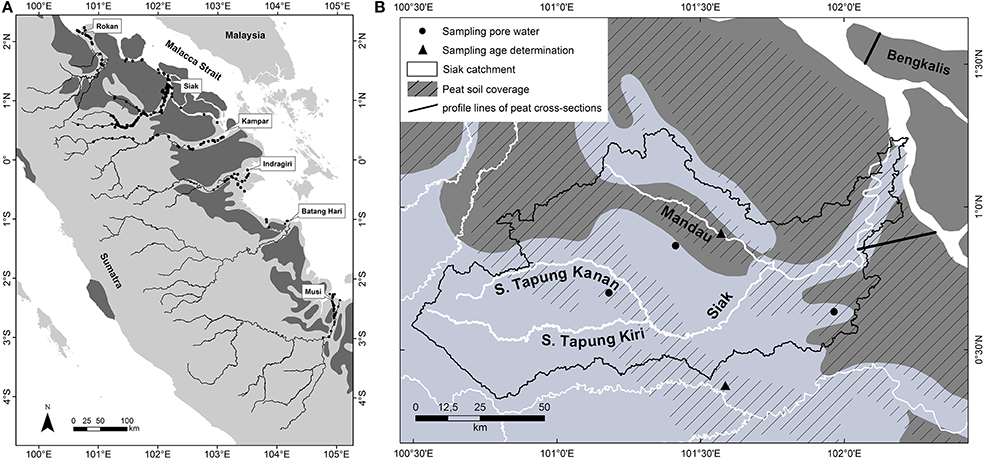
Figure 1. (A) Major rivers including sampling sites (black circles), and peatlands (dark gray) in central Sumatra according to the digital soil map of the world (FAO, 2003). (B) A scale-up showing the Siak catchment in more detail. Black circles indicate the sites at which pore water samples were taken. Triangles mark the sites where water (DOC) and soil (peat) samples for radiocarbon age determinations were taken. The black lines are profile lines of cross-sections through the Siak and Bengkalis peat domes as shown in Figure 3C. The striped areas show the peatland distribution according to reference (Laumonier, 1997) which deviates from those of the FAO (dark gray). The map and scale-up were created using ArcGIS 9.3.1 software by Esri.
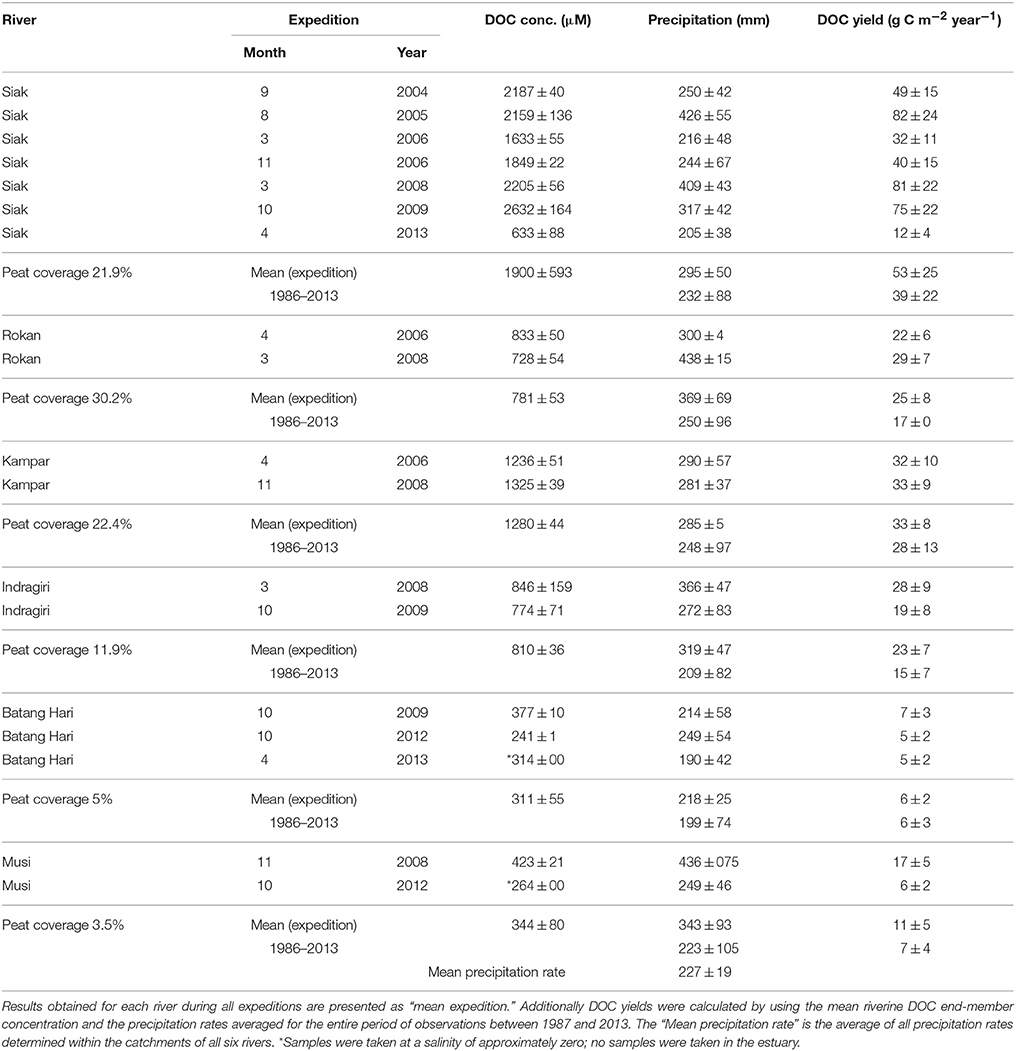
Table 1. Rivers and expeditions as well as riverine DOC end-member concentrations, monthly precipitation rates (Schneider et al., 2014) averaged for the catchment area of the respective rivers (Table S2), and the DOC yields calculated according to Equation (1).
Methods
Study Area and Expeditions
The investigated rivers were the Rokan, Siak, Kampar, Indragiri, Batang Hari, and Musi (Figure 1). All rivers originate in the Barisan mountains, pass through the Northeastern lowlands and discharge into the Malacca Strait. On their way to the ocean all rivers cut through peat soils, which are located in the coastal flat plains and cover 3.5–30.2% of their catchments (Table 1). The Siak river, which was investigated most intensively over the years, originates at the confluence of its two headstreams, S. Tapung Kanan and S. Tapung Kiri (Figure 1B). Its main tributary is the Mandau river. The S. Tapung Kiri drains non-peatlands, whereas the S. Tagung Kanan, the Mandau, and the Siak cut through peatlands covering in total 21.9% of the Siak catchment (Table 1).
DOC Sampling and Analysis
In the rivers DOC samples were taken using a Niskin bottle at a water-depth of ~1 m. After sampling DOC samples were filtered through 0.45 μm cellulose-acetate filters and immediately acidified with phosphoric acid to a pH ≤ 2 and stored cool and dark until analysis. DOC samples were analyzed by means of high temperature catalytic oxidation using a Dohrmann DC-190 and a Shimadzu TOC-VCPH total Organic Carbon Analyzer. Before injection into the furnace, the samples were decarbonated by purging with oxygen. The evolving CO2 was purified, dried and detected by a non-dispersive infrared detection system.
Groundwater samples for the determination of DOC concentrations were taken with a pore-water-lance during the expedition in March 2008. On top of the 4 mm thick pipe a syringe was attached to extract pore water from the soil. The obtained samples were preserved and analyzed as the river samples.
DOC Age Determination
The age determination of peat and water samples was conducted at the Leibniz Laboratory for Radiometric Dating and Isotope Research in Kiel, Germany, in 2007. Organic fragments of the peat sample were inspected and collected under a light microscope and pre-treated based on an acid-alkali-acid cleaning with diluted hydrochloric (1%) and sodium hydroxide (1%). The extracted organic material (humin acid fraction) was precipitated, washed, and dried. The river water was pre-treated for dating by filtering and freeze-drying the sample. River water and peat samples were combusted in evacuated, flame sealed quartz tubes containing copper oxide at 900°C. The evolved CO2 was reduced to graphite with H2 on an iron catalyst. The resulting graphite-iron powder was pressed into aluminum target holders for the ion sputter source with the help of a pneumatic press. The 14C concentration of the sample is calculated by comparing the 14C/12C ratio of each sample, determined by AMS, with those of an international standard (NIST Oxalic Acid standard 2–OxII). Radiocarbon concentrations are reported in percent Modern Carbon (pMC) with ±1-σ measurement uncertainty. 100 pMC is defined as the radiocarbon concentration of the atmosphere in 1950 AD (Stuiver and Polach, 1977).
DOC End-Members, Yields, and Exports
In order to estimate DOC exports from the rivers into the ocean, DOC end-member concentrations were determined. These DOC end-member concentrations were derived from the correlation between DOC concentrations measured in the river estuary and salinity, wherein the zero salinity y-intercept defined the riverine DOC end-member concentration (Table 1, Figure S2). As DOC respiration and its release from e.g., phytoplankton could lead to deviations from the mixing line, which affect the regression equation and thus the calculated DOC end-member concentrations, the standard deviation of the y-intercept was obtained from a least square fit in order to achieve a quantitative error estimate (Bevington and Robinon, 1992). The calculated DOC end-member concentrations were subsequently multiplied by the river discharge in order to obtain the riverine DOC exports into the ocean. The DOC export normalized to the respective catchment area is the DOC yield, which was calculated as the product of the freshwater flux (FWflux) and the DOC end-member concentration (Equation 2):.
Precipitation, Evapotranspiration, and Freshwater Flux
The 1 × 1 degree gridded GPCC-rainfall data (Global Precipitation Climatology Centre, Landsurface Monitoring Product 1.0; Schneider et al., 2011) were used to calculate the precipitation rates and their standard deviations in the river catchments during our expeditions (Table 1, Table S2). The full GPCC data covering the period between 1986 and 2013 was used to calculate the mean precipitation rate for the individual catchments. Precipitation rates and river discharges measured on the island of Borneo showed an annual mean evapotranspiration (ET) of 37.9% of disturbed and 67.7% of pristine peatlands (Moore et al., 2013). These values fall almost in the range of 41–72% determined for Indonesia (Kleinhans, 2003; Kumagai et al., 2005; Baum et al., 2007) suggesting a mean ET of 56.5 ± 15.5%. Since already 90% of all peatlands on Sumatra and Borneo were disturbed in 2008 (Miettinen and Liew, 2010) we used an evapotranspiration of 37.9% and considered an error range of 15.5% for calculating the freshwater flux.
River Catchments and Peat Coverage
An elevation model based on 30 arc-second data obtained from the shuttle radar topographic mission (SRTM, USGS, 2004) was established by using the geographical information system ArcGis with the extension ArcHydro in order to identify the individual river catchments and calculate the respective catchment areas. The peat area was obtained from the “Digital soil map of the world” (version 3.6, scale 1:5,000,000, resolution 3′ × 3′; FAO, 2003) and combined with the derived catchments to quantify the coverage in percentage (Table 1).
Mixing Model Principle
In order to better understand the processes controlling the DOC concentrations in rivers, a mixing model was produced (Figure 2). Since the majority of the available data was collected from the Siak, the mixing model was first of all developed based on data from the Siak. Later on the derived results were extrapolated and compared to data obtained from the other studied rivers.
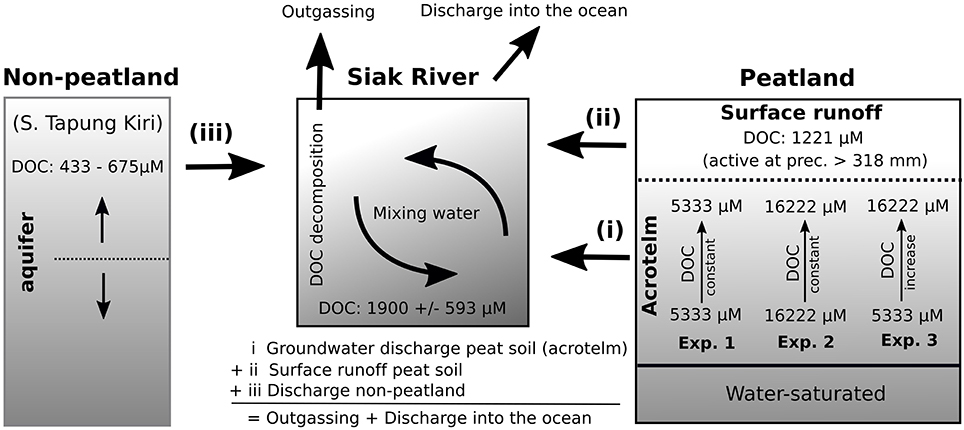
Figure 2. Schematic of the model structure with the three water types (i, ii, and iii) that mix within the Siak. The source waters originate from the non-peatlands, which are to a large extent drained by the S. Tapung Kiri (See Figure 1), and from the peatlands. In peatlands it was further distinguished between surface runoff and groundwater discharge from the acrotelm. Groundwater DOC concentrations were varied during the three experiments. Based on our observations the DOC concentration of the surface runoff was set to 1221 μM and those in S. Tapung Kiri tended to increase from 433 to 675 μM with increasing precipitation rates (Table S3 and Figure S1). DOC decomposition and outgassing in addition to DOC discharges into the ocean balance DOC inputs along with the source waters. More detailed information is given in the Supplementary Material.
In the model, the simulated DOC concentrations in the Siak were calculated as the product of mixing of three different water types: (i) groundwater from peatlands, (ii) surface runoff from peatlands, and (iii) freshwater discharges from parts of the catchment that are not covered by peatlands (non-peatlands), which are largely drained by the S. Tapung Kiri (Figures 1B, 2). Freshwater discharges were calculated separately for the peat area and non-peat area within the catchment. The freshwater discharge from the peat area was divided into groundwater discharge and surface runoff based on the water storage capacity of the acrotelm, which is the upper, partly water-saturated soil horizon in which groundwater levels respond to varying precipitation rates (Holden, 2005). Acrotelm overflow and factors influencing DOC concentrations in the groundwater, as well as the DOC concentrations for the water types will be discussed in more detail in the following sections.
Besides the mixing of the different water types, the decomposition of DOC is the second factor controlling DOC concentrations in the Siak and was studied during a DOC decomposition experiment (Rixen et al., 2008). The results of this experiment, which included the photochemical and bacterial degradation of DOC, showed that roughly 27% of the DOC was degradable within a period of 2 weeks, whereas the remaining larger fraction was refractory on that respective time scale. The obtained equation, describing the DOC decomposition as a function of DOC concentration, was implemented into a box diffusion model that satisfactorily reproduced the oxygen concentrations in the Siak river, which are mainly controlled by the respiration of the labile DOC. In addition to the DOC concentration, the DOC decomposition equation within our mixing model also depends on time. The residence time of water within the Siak was derived from freshwater discharges and a fixed river profile. Accordingly, the residence time decreased with an increasing freshwater discharge, which in turn lowers the DOC decomposition in the rivers because there was less time to decompose DOC. Simulated DOC exports into the ocean finally result from the difference between the DOC inputs from the water types and the DOC decomposition in the river. The simulated DOC concentrations were then compared to the DOC end-member concentrations obtained from the correlation between the measured DOC concentrations in the Siak estuary and the salinity.
Results
The highest so far reported DOC concentrations in the Siak catchment were measured during our expedition in March 2008 within groundwater obtained from peat soils (Figure 1). The DOC groundwater concentrations varied widely from 5333 to 16,222 μM (Table S3). The lowest DOC concentrations in peat areas were measured with 1221.6 μM in surface runoff water (Table S3).
In the Siak the DOC concentration increased from ~500 to 1300 and from 1300 to 1900 μM around the S. Tapung Kanan/Kiri and Mandau junctions because S. Tapung Kanan and the Mandau are rivers draining relatively large peat areas and thus are enriched in DOC (Baum et al., 2007; Rixen et al., 2008). During our expeditions the DOC concentrations in the S. Tapung Kiri, which drains the non-peat areas within the Siak catchment, varied between 344 and 675 μM. DOC concentrations <675 μM were only measured during expeditions at which the precipitation was < 300 mm, which might indicate that DOC concentrations decrease with decreasing precipitation rates as observed in many other rivers draining mineral soils (Figure S1). In the estuary, decreasing DOC concentrations correlating to increasing salinities indicate mixing between DOC-rich Siak water and DOC-poor ocean water (Figure S2). During our expeditions in the Siak catchment, the DOC end-member concentrations varied between 636 ± 88 and 2632 ± 164 μM and increased with increasing precipitation rates up to 318 mm (Figure 3A). After precipitation rates exceeded 318 mm the DOC concentrations dropped. The lowest DOC end-member concentrations were measured during our expedition in April 2013. Although this value is within the range of DOC end-member concentrations determined in the other studied rivers (Table 1) it represents a real exception for the Siak. The low DOC concentrations in the Siak estuary which finally lead to the low DOC end-member concentrations were assumed to be caused by enhanced DOC respiration within an senescent plankton bloom that occurred in the estuary during our expedition (Wit et al., 2015).
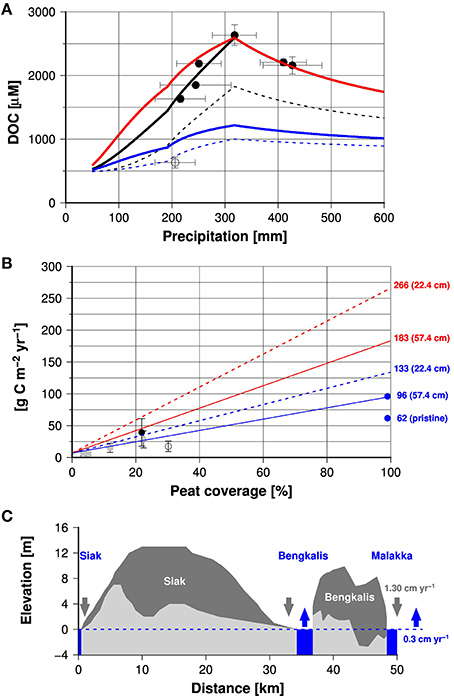
Figure 3. (A) DOC end-member concentrations obtained from data measured between 2004 and 2009 (black circles) and in 2013 (open circles) in the Siak (Table 1). Blue, red, and black lines show DOC end-member concentrations calculated by the model experiments number one (5333 μM), two (16,222 μM), and three, respectively. The broken lines show also results of the experiment number one and three but instead of an evapotranspiration rate of 37.9% for disturbed peatlands an evapotranspiration of 67.7% was used which is assumed to be characteristic for pristine peat swamps. (B) Mean DOC yields (discharge into the ocean) obtained from DOC end-member concentrations and the mean precipitation rates (1987–2013) in the respective river catchments (gray circles) vs. peatland coverage of the catchments (data are given in Table 1). The black and open circle represent Siak and Rokan data. Blue dots show data from rivers draining pristine and disturbed peatlands in Borneo (Moore et al., 2013). The red and blue lines show the area normalized DOC leaching rates and riverine DOC yields, respectively, derived from the model vs. peatland coverage of the catchments. Broken and solid lines indicate model results obtained by assuming an acrotelm depth of 22.4 and 57.4 cm, respectively. Numbers show leaching and export rates at 100% peat cover. (C) Cross-section through the Siak and Bengkalis peat domes (redrawn from Supardi and Subekty, 1993). The respective profile line is given in Figure 1B. Dark and light colored areas represent the peat and underlying subsoils. Dark and blue arrows show the reduction of peat thickness caused by peat carbon losses and global mean sea level rise (Watson et al., 2015).
Discussion
Acrotelm Thickness
Due to the low DOC concentrations in the surface runoff water, flooding with a resulting acrotelm overflow is one explanation for decreasing DOC concentrations in Siak at high precipitation rates (Figure 3A). A precipitation rate of 318 mm, beyond which the DOC concentrations decrease in the Siak, indicates accordingly the maximum water storage capacity of the acrotelm in the Siak catchment. In order to convert this maximum water storage capacity into acrotelm depth, evapotranspiration and pore volume need to be considered. The evapotranspiration of 37.9% would imply an acrotelm thickness of 19.7 cm if pore volume in peat soils would be 100% (318 * 1–0.379). Taking furthermore into account an organic matter density of 1 g cm−3 and a peat bulk density of 0.127 g cm−3 suggests a more realistic pore volume of 87.3 % (Warren et al., 2012) and results in an acrotelm thickness of 22.4 cm.
Leaching
In the Siak catchment the lower groundwater DOC concentrations of about 5333 μM (Table S3) fall in the range of DOC concentrations measured in other peat soils (5183–6658 μM; Gandois et al., 2013). DOC groundwater concentrations of up to 16,222 μM are extremely high but can be caused by leaching of leaf litter produced by secondary forest plants within a couple of days (Yule and Gomez, 2009).
Contrary to secondary plants, leaves of endemic peat plants are more resistant to degradation (Treutter, 2006; Lim et al., 2014) and therefore less DOC is leached from endemic leaf litter. In DOC pore water profiles, such a reduced leaching is reflected in the absence of a pronounced DOC gradient (Gandois et al., 2013). DOC pore water profiles in soils with secondary vegetation are expected to show a strong gradient with higher DOC concentrations in the acrotelm top due to leaching of labile leaf litter and lower DOC concentrations at the acrotelm base where peat leaching dominates. This is however an expected observation that in the future needs to be proved by data, but in order to test whether such a soil DOC gradient helps to better explain the DOC end-member concentrations in the Siak, sensitivity experiments were carried out with our mixing model.
Numerical Leaching Experiments for the Siak
Possible effects of leaf litter and peat leaching on the DOC concentrations in the Siak were studied by performing three model experiments (Figure 2) and comparing the results with the riverine DOC end-members (Figure 3A). In the first two experiments, groundwater DOC concentrations were considered to be constant as generally assumed for peatlands. With a DOC concentration of 5333 μM, the first experiment reflected leaf litter leaching from pristine peat soils, whereas the second experiment mimicked leaf litter leaching from secondary forest plants with a DOC concentration of 16,222 μM. During the third experiment, DOC concentrations increased from 5333 μM at the base to 16,222 μM at the top of the acrotelm. The resulting linear DOC concentration gradient within the acrotelm corresponds to the assumption that endemic leaf litter leaching dominates at the base and secondary leaf litter leaching controls the DOC supply at the soil surface. DOC leaching became accordingly a function of the water level within the acrotelm and therewith also of the precipitation rates.
The model experiments 1 and 2 showed increasing DOC concentrations with increasing precipitation rates prior to the acrotelm overflow at 318 mm precipitation, after which surface runoff diluted DOC concentrations (Figure 3A). In the model the increasing DOC concentrations prior to the overflow were caused by reduced DOC decomposition as a consequence of a lower residence time of water at higher precipitation rates. The first experiment (groundwater DOC concentration of 5333 μM) results in simulated DOC concentrations lower than the measured end-members, whereas the second experiment (DOC groundwater concentration of 16,222 μM) leads to simulated DOC concentrations similar to those measured in the Siak during our expeditions. This suggests that leaf litter leaching from secondary vegetation could strongly affect the DOC concentration in the Siak, which is also obvious because peat soils in the Siak catchment are heavily disturbed with hardly any endemic vegetation left (Miettinen and Liew, 2010). The consistency between simulated and end-member DOC concentrations was further improved during the third experiment, indicating that leaching of leaf litter from secondary forest plants dominates at the top of the acrotelm and leaf litter leaching from endemic peat vegetation gains importance toward the base of the acrotelm.
Considering an evapotranspiration rate of 67.7%, as assumed to be characteristic for pristine peat swamps, instead of 37.9%, would not affect the trend but the values, which means that then all simulated DOC concentrations would fall below the measured DOC end-members. This implies that the evapotranspiration rates derived from the experiments carried out on Borneo of 37.9% apply also to Sumatra.
The concept of two DOC sources (leaf litter and peat) also agrees quite well with the radiocarbon ages of peat and DOC in rivers and the results derived from our DOC decomposition experiment, which showed that DOC in the rivers consists of a labile and a more refractory fraction (Rixen et al., 2008). The radiocarbon age of a peat sample obtained at a soil depth of 5 cm (Figure 1) revealed an age of 890 ± 25 years BP. At high latitudes DOC can be younger than the surrounding peat because of vertical water movements (Clymo and Bryant, 2008), but since at our study site younger peat was already eroded a DOC age of 890 ± 25 years represents a minimum estimate. DOC ages in the Mandau, a main tributary of the Siak, were with 575 ± 30 years BP similar to those measured in the disturbed channel on Borneo (Moore et al., 2013). Assuming that the secondary leaf-litter DOC is of modern age and DOC leached from peat is as old as the peat suggests that 65 ± 5% of the DOC in the river could be derived from peat and 35 ± 5% might originate from labile leaf litter. In combination with the results from the decomposition experiments and in line with the leaching characteristics of leaf litter this furthermore implies that a major share (65–73%) of the peat-derived DOC in the Siak is old and refractory on time scales of days to weeks. The smaller remaining fraction is young, labile, and originated from leaching of leaf litter produced by secondary forest plants. Since the decomposition of labile DOC was the main factor controlling the consumption of dissolved oxygen, the hypoxic conditions in the Siak can be seen as a consequence of the re-growing secondary forest and its production of labile leaf litter.
If groundwater DOC concentrations in the Siak are controlled by two DOC sources in the acrotelm, the acrotelm thickness becomes an important factor for the leaching of carbon from soils. The deeper the acrotelm, the greater the distance between the groundwater and secondary leaf litter at the soil surface and the lower the mean DOC groundwater concentration. This reduction should be limited by the DOC groundwater concentrations of 5333 μM caused by peat leaching at the bottom of the acrotelm. However, as indicated in experiment 1, such a low DOC groundwater concentration can only explain the DOC end-member concentration measured during our last expedition in April 2013 if one assumes an evapotranspiration of 67.7% as observed in pristine peat swamps (Figure 3A). Considering however the overall status of Sumatran peat lands this appears unlikely which in turn supports the hitherto held assertion that an enhanced DOC respiration associated with the occurrence of a plankton bloom lowered the DOC concentrations in the Siak estuary in April 2013 (Wit et al., 2015).
Extrapolation of Siak Results
So far we used the mixing model to calculate DOC end-member concentrations depending on precipitation rates and varying DOC concentrations in the acrotelm wherein the best fit between simulated and measured DOC end-member concentrations in the Siak could be obtained by assuming two DOC sources in the acrotelm: peat and secondary leaf litter. The next step was to study the impact of the peat coverage on the DOC end-member concentration. Therefore, all model settings remained unchanged except the precipitation rate and the peat coverage. The precipitation rate was set at 227 mm, which is the monthly mean precipitation of all studied river catchments covering the period between 1986 and 2013 (Table 1), and instead of using the Siak peat coverage of 21.9% (Table 1) the peat coverage was set in a range from 0 to 100% (Figure 3B). The resulting simulated DOC concentrations were multiplied by the freshwater flux to obtain the DOC yields (See Equations 2, 3). Since the majority of DOC originates from peatlands, DOC yields are expected to increase with increasing peat coverage, which indeed is evident from the DOC yields obtained from the studied rivers. However, the Rokan river deviates from this trend with a lower DOC yield because coastal erosion, favored by mangrove deforestation (Butcher, 1996), increased suspended matter concentrations and DOC adsorption to suspended clay. Apart from that the simulated DOC yields agree quite well with the data-based end-members. This agreement can further be improved by using an acrotelm depth of 57.4 cm instead of 22.4 cm, which is well within the depth-range of acrotelms found in drained forests and plantations (Hooijer et al., 2012).
By increasing the acrotelm depth from 22.4 to 57.4 cm, the DOC yield was reduced from 133 to 96 g C m−2 yr−1 at a peat soil coverage of 100% (Figure 3B). This is consistent with the observed DOC yield in a channel draining disturbed peatlands in Borneo (Moore et al., 2013) and suggests that these model results are representative for disturbed SE Asian peatlands. The modeled DOC soil leaching rate associated with the riverine DOC export yield of 96 g C m−2 yr−1 at the acrotelm depth of 57.4 cm amounts to 183 g C m−2 yr−1, implying a DOC decomposition in the river of 87 g C m−2 yr−1. This estimate for DOC decomposition falls within the range of the data-based estimate on CO2 emissions from SE Asian peat lands of 105 ± 27.5 g C m−2 yr−1 (Wit et al., 2015) and further supports the reliability of the model results.
Anthropogenic Perturbations
DOC concentrations of 5661 μM measured in a channel draining pristine peat soils in Borneo (Moore et al., 2013) fall within the range of DOC pore water concentrations (Gandois et al., 2013), suggesting that DOC decomposition is of minor importance under natural conditions, as expected from the refractory characteristics of leaf litter of endemic peat plants. Under such a circumstance, the DOC yield obtained from the pristine river in Borneo of 62 g C m−2 yr−1 can be considered as the lowest estimate on DOC leaching. Compared to DOC leaching rates derived from the model of 183 g C m−2 yr−1, this implies that leaching caused by changes in the vegetation cover has risen from 62 to 183 g C m−2 yr−1 representing an increase of almost 200% (Figure 4).
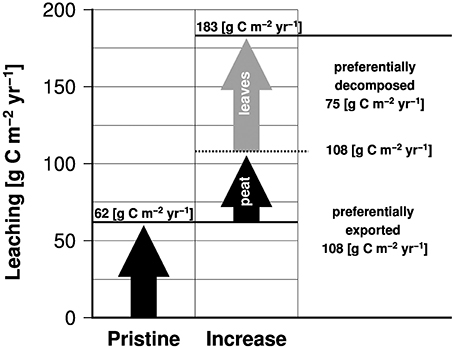
Figure 4. Leaching of organic carbon from pristine peat soils and the additional leaching caused by human impacts subdivided according to DOC sources (peat soil and leaf litter).
In Borneo, changes in vegetation cover decreased evapotranspiration from 67.7 to 37.9%. This nearly doubles the freshwater flux fraction from 0.32 to 0.62 (Moore et al., 2013), which in principle could raise the peat leaching rate from 62 to ~118 g C m−2 yr−1. Such an enhanced leaching rate is close to that of 108 g C m−2 yr−1 derived from our model by assuming a constant groundwater DOC concentration of 5333 μM at a peat coverage of 100%. However, a peat leaching rate of 108 or 118 g C m−2 yr−1 contributes ~60% to the total leaching of 183 g C m−2 yr−1 (Figure 4). If deforestation of pristine peat swamp forests and the reduced evapotranspiration raised leaching of DOC from peat from 62 to 108 g C m−2 yr−1, the increase from 108 to 183 g C m−2 yr−1 appears to be caused by leaching of leaf litter produced by secondary forest plants (Figure 4). This in turn implies that changes in the hydrological cycle and the regrowth of secondary forest plants explain 38% and 62% of the increase in DOC leaching from degraded peatlands, respectively.
Carbon Budgets
In order to emphasize the role of DOC leaching it needs to be seen in the context of CO2 losses from soils caused by aerobic peat respiration and the CO2 uptake by the re-growing vegetation, which reduces carbon losses from the ecosystem (Figure 5). Estimates of CO2 emissions from disturbed peat soils due to aerobic peat decomposition (Miettinen and Liew, 2010) and fires (van der Werf et al., 2008) of 53 and 128 Tg C yr−1, respectively, and a disturbed peatland area of 0.24 1012 m2 suggest a peat carbon loss of 744 g C m−2 yr−1. The net ecosystem carbon loss from disturbed peatlands covered by secondary forest amounts to a carbon loss of 433 g C m−2 yr−1 (Hirano et al., 2007), indicating that re-growing biomass could reduce CO2 emissions from disturbed peatlands into the atmosphere by 311 g C m−2 yr−1. A leaching rate of 183 g C m−2 yr−1 increases carbon losses from the ecosystem by 42% from 433 to 616 g C m−2 yr−1 of which 48% (87 g C m−2 yr−1) returns back into the atmosphere and 52% (96 g C m−2 yr−1) is exported to the ocean. Since the leached DOC originates from two different sources its role for the ecosystem varies: DOC leaching of labile leaf litter of 75 g C m−2 yr−1 reduces the carbon uptake by the re-growing biomass by 24% and its preferential decomposition in the river can lead to hypoxia as seen e.g., in the Siak river (Rixen et al., 2008, 2010). The leaching of DOC from peat of 108 g C m−2 yr−1 represents in turn an irrecoverable loss of soil.
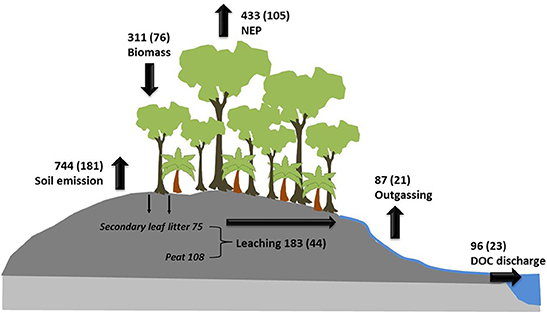
Figure 5. Carbon fluxes in disturbed peatlands. Net ecosystem carbon losses representing a negative net ecosystem production (NEP; Hirano et al., 2007), CO2 emissions from disturbed peat soils due to aerobic peat decomposition (Miettinen and Liew, 2010) and fires (van der Werf et al., 2008), carbon leaching, outgassing, and DOC discharge into the ocean. The carbon uptake by the growing biomass results from the difference between soil emission and NEP. River outgassing is the difference between leaching and DOC discharge into the ocean. The numbers and the numbers in brackets are fluxes in g C m−2 yr−1 and Tg C yr−1, respectively.
Assuming a peat carbon density of 65.35 kg m−3 (Warren et al., 2012) peat carbon losses caused by oxidation (744 g C m−2 yr−1) and leaching (108 g C m−2 yr−1) lower the peat thickness by ~1.30 cm yr−1 [(0.744+0.108)/65.35]. Such a fast shrinking of coastal peat domes, that partly even form the coast as seen on the Island of Bengkalis (Figure 3C), is a serious threat to the stability of the coastal peat plains that cover 10% of the Indonesian land mass.
Conclusion
In order to study processes controlling carbon leaching from tropical peat soils a mixing model was developed and validated by DOC concentrations measured in the groundwater, surface runoff water, and river in the Siak catchment. This model was subsequently used to quantify carbon leaching from tropical peat soils wherein the obtained results were compared with data obtained from other Sumatran rivers. Since these rivers reveal peat soil coverages of < 30.2%, also data obtained from the literature were used. Our results show that a reduced evapotranspiration and a resulting increased freshwater discharge in addition to the supply of labile leaf litter produced by re-growing secondary forests increase leaching of carbon by ~200%. Since the leached carbon originates from two different sources, namely peat and secondary vegetation, the resulting ecological consequences differ: Leached peat carbon is an irrecoverable loss of land that in addition to peat oxidation weakens the stability of peat-fringed coasts. This calls for mitigating strategies but reforestation by secondary forest plants bears an ecological threat. Leaching of their labile leaf litter supplies DOC of which the decomposition can lead to oxygen deficiencies in peat draining rivers.
Author Contributions
TR, AB, and JS conceived and led the research conducted in Sumatra. Data were collected by TR, AB, FW, and JS. AB and FW performed chemical analyses. TR and FW conducted online measurements. TR and AB designed the study; FW and JS were involved in study design. TR led the writing of the paper. All authors discussed results and commented on the manuscript.
Conflict of Interest Statement
The authors declare that the research was conducted in the absence of any commercial or financial relationships that could be construed as a potential conflict of interest.
Acknowledgments
We would like to thank the Federal German Ministry of Education, Science, Research and Technology (BMBF Bonn, grant number 03F0392C) for its financial support.
Supplementary Material
The Supplementary Material for this article can be found online at: https://www.frontiersin.org/article/10.3389/feart.2016.00074
References
Baum, A., Rixen, T., and Samiaji, J. (2007). Relevance of peat draining rivers in central Sumatra for the riverine input of dissolved organic carbon into the ocean. Estuar. Coast. Shelf Sci. 73, 563–570. doi: 10.1016/j.ecss.2007.02.012
Bevington, P. R., and Robinon, K. D. (1992). Data Reduction and Error Analysis for the Physical Sciences. New York, NY: McGraw-Hill Companies.
Butcher, J. G. (1996). The Salt Farm and the Fishing Industry of Bagan Si Api Api. Ithaca, NY: Southeast Asia Program Publications at Cornell University.
Clark, J. M., Lane, S. N., Chapman, P. J., and Adamson, J. K. (2008). Link between DOC in near surface peat and stream water in an upland catchment. Sci. Total Environ. 404, 308–315. doi: 10.1016/j.scitotenv.2007.11.002
Clymo, R. S., and Bryant, C. L. (2008). Diffusion and mass flow of dissolved carbon dioxide, methane, and dissolved organic carbon in a 7-m deep raised peat bog. Geochim. Cosmochim. Acta 72, 2048–2066. doi: 10.1016/j.gca.2008.01.032
Gandois, L., Cobb, A. R., Hei, I. C., Lim, L. B. L., Salim, K. A., and Harvey, C. F. (2013). Impact of deforestation on solid and dissolved organic matter characteristics of tropical peat forests: implications for carbon release. Biogeochemistry 114, 183–199. doi: 10.1007/s10533-012-9799-8
Hirano, T., Segah, H., Harada, T., Limin, S., June, T., Hirata, R., et al. (2007). Carbon dioxide balance of a tropical peat swamp forest in Kalimantan, Indonesia. Glob. Chang. Biol. 13, 412–425. doi: 10.1111/j.1365-2486.2006.01301.x
Holden, J. (2005). Peat land hydrology and carbon release: why small-scale process matters. Philos. Trans. R. Soc. 363, 2891–2913. doi: 10.1098/rsta.2005.1671
Hooijer, A., Page, S., Jauhiainen, J., Lee, W. A., Lu, X. X., Idris, A., et al. (2012). Subsidence and carbon loss in drained tropical peatlands. Biogeosciences 9, 1053–1071. doi: 10.5194/bg-9-1053-2012
Kleinhans, A. (2003). Einfluss der Waldkonversion auf den Wasserhaushalt Eines Tropischen Regenwaldeinzugsgebietes in Zentral Sulawesi (Indonesien);(Influence of Forest Conversion on the Water Balance of a Tropical Rainforest Catchment in Central Sulawesi (Indonesia)). Göttingen: Georg-August-Universität Göttingen.
Kumagai, T. O., Saitoh, T. M., Sato, Y., Takahashi, H., Manfroi, O. J., Morooka, T., et al. (2005). Annual water balance and seasonality of evapotranspiration in a Bornean tropical rainforest. Agricultural and forest. Meteorology 128, 81–92. doi: 10.1016/j.agrformet.2004.08.006
Laumonier, Y. (1997). The Vegetation and Physiography of Sumatra. Dordrecht: Kluwer Academic Publishers.
Lim, T. Y., Lim, Y. Y., and Yule, C. M. (2014). Bioactivity of leaves of Macaranga species in tropical peat swamp and non-peat swamp environments. J. Trop. For. Sci. 26, 134–141. Available online at: http://www.jstor.org/stable/23617022
Miettinen, J., and Liew, S. C. (2010). Degradation and development of peatlands in peninsular Malaysia and in the islands of Sumatra and Borneo since 1990. Land Degradation Dev. 21, 285–296. doi: 10.1002/ldr.976
Moore, S., Evans, C. D., Page, S. E., Garnett, M. H., Jones, T. G., Freeman, C., et al. (2013). Deep instability of deforested tropical peatlands revealed by fluvial organic carbon fluxes. Nature 493, 660–663. doi: 10.1038/nature11818
Moore, T. R., and Jackson, R. J. (1989). Dynamics of dissolved organic carbon in forested and disturbed catchments, Westland, New Zealnd 2. Larry River. Water Resour. Res. 25, 1331–1339. doi: 10.1029/WR025i006p01331
Page, S. E., Rieley, J. O., and Banks, C. J. (2011). Global and regional importance of the tropical peatland carbon pool. Glob. Chang. Biol. 17, 798–818. doi: 10.1111/j.1365-2486.2010.02279.x
Rixen, T., Baum, A., Pohlmann, T., Balzer, W., Samiaji, J., and Jose, C. (2008). The Siak, a tropical black water river in central Sumatra on the verge of anoxia. Biogeochemistry 90, 129–140. doi: 10.1007/s10533-008-9239-y
Rixen, T., Baum, A., Sepryani, H., Pohlmann, T., Jose, C., and Samiaji, J. (2010). Dissolved oxygen and its response to eutrophication in a tropical black water river. J. Environ. Manage. 91, 1730–1737. doi: 10.1016/j.jenvman.2010.03.009
Schneider, U., Becker, A., Finger, P., Meyer-Christoffer, A., Rudolf, B., and Ziese, M. (2011). “GPCC monitoring product: near real-time monthly land-surface precipitation from rain-gauges based on SYNOP and CLIMAT data,” in Global Precipitation Climatology Centre (GPCC), Deutscher Wetterdienst. Available online at: http://gpcc.dwd.de/
Schneider, U., Becker, A., Finger, P., Meyer-Christoffer, A., Rudolf, B., and Ziese, M. (2014). GPCC Monitoring Product: Near Real-Time Monthly Land-Surface Precipitation from Rain-Gauges Based on SYNOP and CLIMAT Data. Offenbach: Deutscher Wetterdienst.
Supardi and Subekty, A. D. (1993). General geology and peat resources oh the Siak Kanan and Bengkalis Island peat deposits, Sumatra, Indonesia. Geol. Soc. Am. Special Paper 286, 45–61.
Treutter, D. (2006). Significance of flavonoids in plant resistance: a review. Environ. Chem. Lett. 4, 147–157. doi: 10.1007/s10311-006-0068-8
USGS (2004). Global Land Cover Facility (GLCF) 30 Arc Second SRTM Elevation Data. Maryland, MD: University of Maryland.
van der Werf, G. R., Dempewolf, J., Trigg, S. N., Randerson, J. T., Kasibhatla, P. S., Giglio, L., et al. (2008). Climate regulation of fire emissions and deforestation in equatorial Asia. Proc. Natl. Acad. Sci. U.S.A. 105, 20350–20355. doi: 10.1073/pnas.0803375105
Warren, M. W., Kauffman, J. B., Murdiyarso, D., Anshari, G., Hergoualc'h, K., Kurnianto, S., et al. (2012). A cost-efficient method to assess carbon stocks in tropical peat soil. Biogeosciences 9, 4477–4485. doi: 10.5194/bg-9-4477-2012
Watson, C. S., White, N. J., Church, J. A., King, M. A., Burgette, R. J., and Legresy, B. (2015). Unabated global mean sea-level rise over the satellite altimeter era. Nat. Clim. Change 5, 565–568. doi: 10.1038/nclimate2635
Wit, F., Muller, D., Baum, A., Warneke, T., Pranowo, W. S., Muller, M., et al. (2015). The impact of disturbed peatlands on river outgassing in Southeast Asia. Nat. Commun. 6:10155. doi: 10.1038/ncomms10155
Keywords: tropical peat soil, degradation, secondary vegetation, carbon loss, Sumatra, Indonesia
Citation: Rixen T, Baum A, Wit F and Samiaji J (2016) Carbon Leaching from Tropical Peat Soils and Consequences for Carbon Balances. Front. Earth Sci. 4:74. doi: 10.3389/feart.2016.00074
Received: 01 March 2016; Accepted: 27 June 2016;
Published: 13 July 2016.
Edited by:
Francien Peterse, Universiteit Utrecht, NetherlandsReviewed by:
William Patrick Gilhooly III, Indiana University Purdue University Indianapolis, USAChris Evans, Centre for Ecology and Hydrology, UK
Copyright © 2016 Rixen, Baum, Wit and Samiaji. This is an open-access article distributed under the terms of the Creative Commons Attribution License (CC BY). The use, distribution or reproduction in other forums is permitted, provided the original author(s) or licensor are credited and that the original publication in this journal is cited, in accordance with accepted academic practice. No use, distribution or reproduction is permitted which does not comply with these terms.
*Correspondence: Tim Rixen, tim.rixen@leibniz-zmt.de