Arctic Deltaic Lake Sediments As Recorders of Fluvial Organic Matter Deposition
 Jorien E. Vonk1,2*
  Angela F. Dickens3,4
  Liviu Giosan5
  Zainab A. Hussain3 Bokyung Kim3
  Samuel C. Zipper5,6 Robert M. Holmes7 Daniel B. Montlucon1,4 Valier Galy4
  Timothy I. Eglinton1,4
- 1Department of Earth Sciences, Geological Institute, ETH Zürich, Zurich, Switzerland
- 2Department of Earth Sciences, VU University Amsterdam, Amsterdam, Netherlands
- 3Chemistry Department, Mount Holyoke College, South Hadley, MA, USA
- 4Marine Chemistry and Geochemistry Department, Woods Hole Oceanographic Institution, Woods Hole, MA, USA
- 5Geology and Geophysics, Woods Hole Oceanographic Institution, Woods Hole, MA, USA
- 6Freshwater and Marine Sciences Program, Department of Civil and Environmental Engineering, University of Wisconsin-Madison, Madison, WI, USA
- 7Woods Hole Research Center, Falmouth, MA, USA
Arctic deltas are dynamic and vulnerable regions that play a key role in land-ocean interactions and the global carbon cycle. Delta lakes may provide valuable historical records of the quality and quantity of fluvial fluxes, parameters that are challenging to investigate in these remote regions. Here we study lakes from across the Mackenzie Delta, Arctic Canada, that receive fluvial sediments from the Mackenzie River when spring flood water levels rise above natural levees. We compare downcore lake sediments with suspended sediments collected during the spring flood, using bulk (% organic carbon, % total nitrogen, δ13C, Δ14C) and molecular organic geochemistry (lignin, leaf waxes). High-resolution age models (137Cs, 210Pb) of downcore lake sediment records (n = 11) along with lamina counting on high-resolution radiographs show sediment deposition frequencies ranging between annually to every 15 years. Down-core geochemical variability in a representative delta lake sediment core is consistent with historical variability in spring flood hydrology (variability in peak discharge, ice jamming, peak water levels). Comparison with earlier published Mackenzie River depth profiles shows that (i) lake sediments reflect the riverine surface suspended load, and (ii) hydrodynamic sorting patterns related to spring flood characteristics are reflected in the lake sediments. Bulk and molecular geochemistry of suspended particulate matter from the spring flood peak and lake sediments are relatively similar showing a mixture of modern higher-plant derived material, older terrestrial permafrost material, and old rock-derived material. This suggests that deltaic lake sedimentary records hold great promise as recorders of past (century-scale) riverine fluxes and may prove instrumental in shedding light on past behavior of arctic rivers, as well as how they respond to a changing climate.
Introduction
Deltas are vulnerable natural environments (Syvitski et al., 2009; Giosan et al., 2014) that record environmental changes such as climate warming in their deltaic sediment deposits (Bianchi and Allison, 2009). With arctic temperatures increasing an average of 0.6°C per decade, two to three times faster than other regions on Earth (IPCC, 2007; McGuire et al., 2009), arctic deltas are particularly vulnerable to future change. For example, destabilization of frozen soils (permafrost) may enhance the thaw of organic matter and its release into arctic streams and rivers (Vonk and Gustafsson, 2013; Schuur et al., 2015).
Arctic rivers are logistically difficult to study, being by nature remote and snow- and ice-covered for much of the year. Most previous work focuses on the summer period when ice has cleared and sampling conditions are reasonable. The bulk of sediment and organic matter transport, however, is released during the brief spring freshet (Holmes et al., 2002; Rachold et al., 2004; Raymond et al., 2007), when high discharge, ice break-up and ice jams pose additional sampling challenges. Measurements from the spring flood period are critical for developing accurate constraints on discharge and constituent fluxes (Holmes et al., 2012). Additionally, while studies based on recent sampling of modern rivers can provide essential understanding of how rivers are behaving now, they cannot tell us anything about how the rivers behaved in the past. It is therefore desirable to develop long-term (centuries to millennia) records of past riverine organic matter fluxes and properties in order to provide context for the present behavior of rivers and to detect any anomalies or trajectory shifts (Holmes et al., 2012).
Laminated cores from around the Arctic have frequently been used for palaeoclimatic studies, with applications ranging from temperature and precipitation reconstruction (Bird et al., 2009) to modern depositional processes (Francus et al., 2008). Previous studies from the Mackenzie Delta have primarily focused on documenting the active hydrologic processes in the delta (Marsh and Hey, 1989; Rouse et al., 1997; Emmerton et al., 2007; Lesack and Marsh, 2007) and changes in the lacustrine ecosystems, often using diatom records (Hay et al., 1997; Michelutti et al., 2001; Perren et al., 2003). Some attention has been directed toward sedimentary processes, but primarily with a focus on anthropogenic contaminant deposition (Graf Pannatier, 1997). This study aims to use detailed sedimentological data typical for previous lacustrine studies to a fluvially-dominated environment to link hydrological processes and depositional patterns. Through detailed analysis of the characteristics of fluvial OC transported by the river during the spring flood, as well as the characteristics of OC deposited in a deltaic lake, we further aim to constrain the sources of fluvial OC and how these sources have changed over time. This will provide us with further insights into the question of whether deltaic lake sediments can be used as recorders of the biogeochemical and hydrological history of arctic watersheds.
We present analyses on delta lake sedimentary records (26 cores from 20 lakes) in combination with riverine suspended particulate matter (2-week period during freshet) from the Mackenzie Delta and Mackenzie River, respectively. Detailed core descriptions were developed for each site and analyzed in conjunction with radioisotopic dating, X-radiographic density profiles, and bulk density measurements in order to develop a coherent picture of the historical sedimentology and hydrology of the Mackenzie River. Detailed bulk and molecular geochemical analyses were performed on one selected lake, as well as on riverine suspended sediments that were collected during peak flow. We aim to show the utility of deltaic lakes as hydrological recorders of their watersheds, and to bridge the gap between hydrological processes and depositional patterns in sedimentology and biogeochemistry.
Study Site
The Mackenzie River (Figure 1) contributes the fourth largest amount of freshwater to the Arctic Ocean (330 km3/year) and is by far the largest source of fluvial sediments (124 Mt/year; Carson et al., 1998). Organic carbon fluxes from this river are also high, with TOC and POC fluxes of 4.1 Tg C and 2.6 Tg C/year, respectively (McGuire et al., 2009; Hilton et al., 2015). As with most northern rivers, the Mackenzie is characterized by a strong seasonal hydrograph (Figure 2) where ~20% of the annual discharge is delivered during a 30 day period in the spring—the freshet (Emmerton et al., 2008b). Sediment transport is even more strongly seasonal, with the river delivering roughly 63% of its annual sediment load to the delta during the months of May and June (Carson et al., 1998).
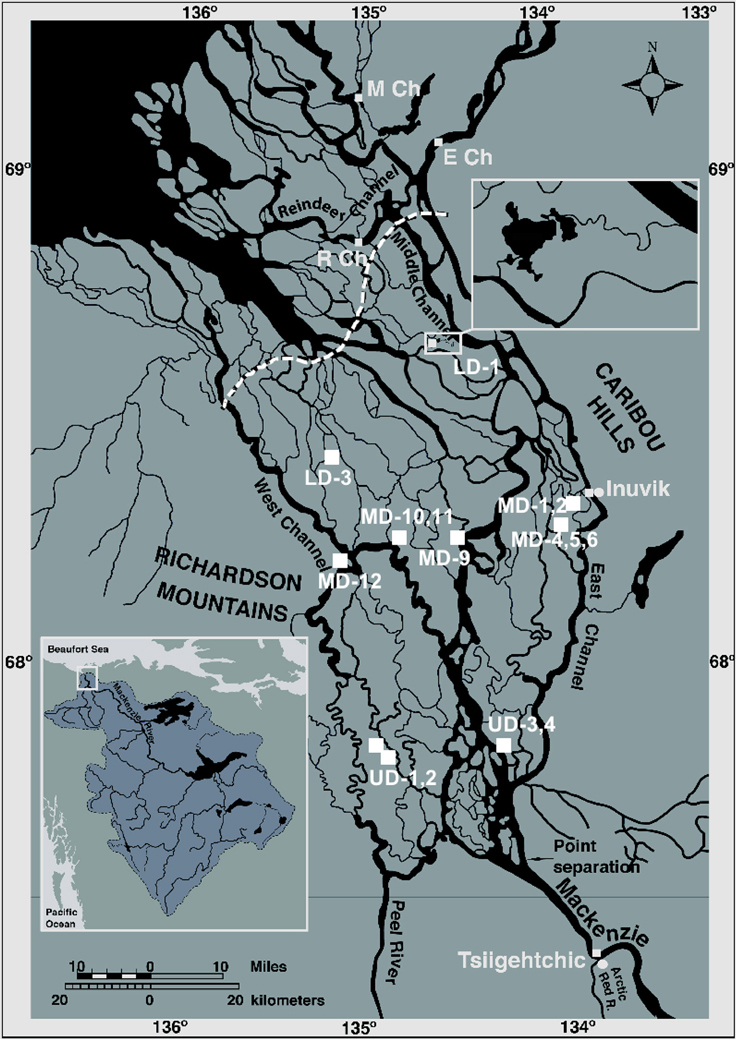
Figure 1. Map of the Mackenzie River delta with the major tributaries, distributary channels and geographic features labeled. Sampling locations are indicated with white squares. The three outer delta sites (Reindeer Channel, R Ch; Middle Channel, M Ch; East Channel, E Ch) were analyzed by Goñi et al. (2000, 2005) and are included in this paper for comparison. The dashed white line indicates the treeline (MacKay, 1963). The inset in the upper right-hand corner shows an expansion of the region around the Lake LD-1 sampling site to show how this lake is connected to the river channels. The inset in the lower left-hand corner shows the Mackenzie River watershed, with a white box drawn around the delta.
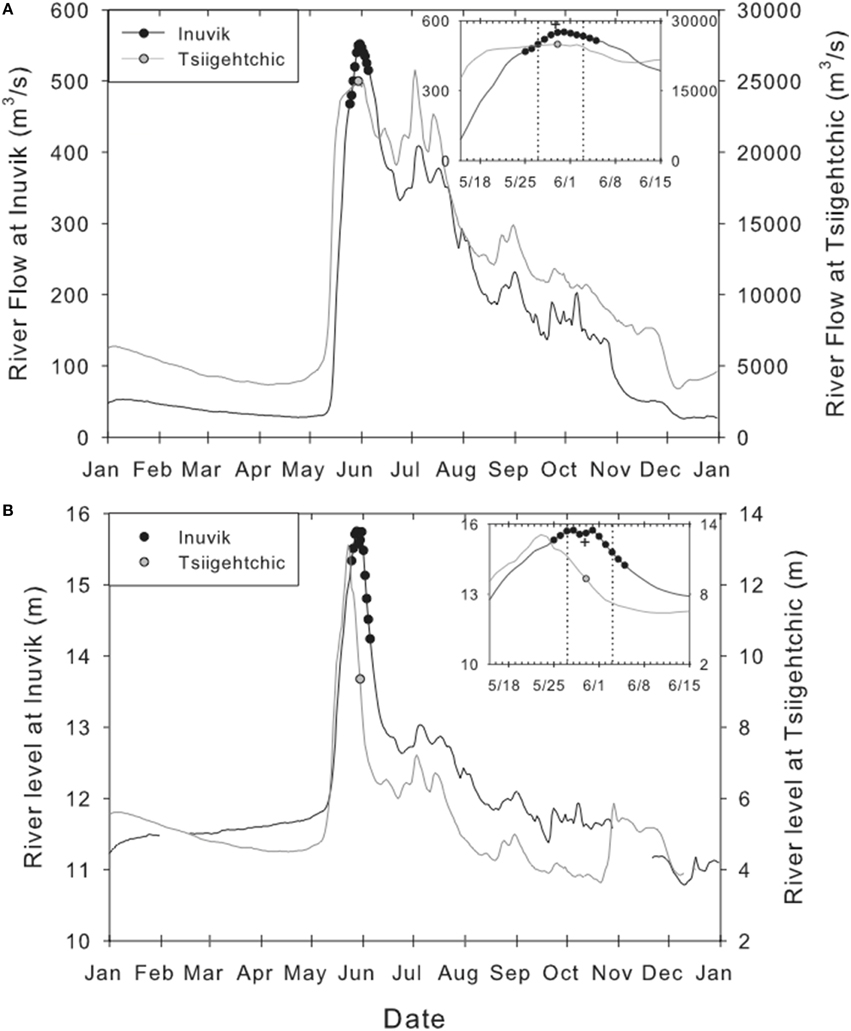
Figure 2. Plots of (A) river flow and (B) river level at Inuvik (East Channel) and Tsiigehtchic (Main Channel) for the year 2008, with sampling dates shown as circles. The insets show expansions of the data from mid-May to mid-June. The two dashed lines indicate the day the ice broke up and flowed, and the day the river was ice-free at Inuvik, and the plus sign (+) marks the day we observed large amounts of coarse woody debris floating in the channel at Inuvik. Hydrographic data are from Environment Canada, Water Survey of Canada (http://wateroffice.ec.gc.ca).
The Mackenzie watershed is 1,787,000 km2 (Rachold et al., 2004) and consists of boreal forests, wetlands and tundra. Nearly half of the catchment is underlain by permafrost (16% continuous, 29% discontinuous; Holmes et al., 2013). As the Great Slave Lake serves as a very efficient sediment trap, most of the sediment delivered to the delta in fact originates from the area north of this lake. This reduces the watershed size to about 1,000,000 km2 and increases the permafrost coverage. Air temperature records in the region show an average warming of ca. 1.5°C between 1950 and 1998 (Zhang et al., 2000). However, this increase was not uniform across the basin, and the Mackenzie delta region was 2.5°C warmer in the mid-2000s than it was in 1970 (Burn and Kokelj, 2009). The active layer of permafrost in the watershed has been reported to have deepened by 0.47 cm/year between 1980 and 2002 (Oelke et al., 2004). Permafrost thaw has led to an increase in dissolved organic carbon flux at the Mackenzie River mouth by about 40% since the early 1970s (Tank et al., 2016). Additionally, a decrease in average monthly snow depth (January-March, 1946-1995) has been observed for the Mackenzie basin, one of the most prominent decreases in Canada (Serreze et al., 2000). Despite these changes, annual river discharge seems to appear fairly stable over the last decades (Peterson et al., 2002; Woo and Thorne, 2003).
The sub-aerial Mackenzie delta extends over 13,100 km2, making it the second-largest arctic delta after the Lena River delta (Emmerton et al., 2007). Nearly all of the water in the delta (83–90%) is delivered by the Mackenzie River at Point Separation (Figure 1) with minor contributions from the Peel River (~8%) and other tributaries to the delta (Carson et al., 1998; Emmerton et al., 2007). The Peel River, however, delivers relatively high amounts of sediments, estimated to be 20 Mt or about 16% of the annual load (Carson et al., 1999). The delta contains a vast number (>45,000; Emmerton et al., 2007) of small and shallow lakes, typically < 10 ha in area and < 4 m deep. These lakes play an important role in water and sediment storage, as they hold ca. 47% of spring flood water during peak discharge (Emmerton et al., 2007). The lakes are typically categorized based on their frequency of fluvial input: no-closure (ca. 60% of total lake area), low-closure (ca. 25%) and high-closure lakes (ca. 15%), (MacKay, 1963; Lesack and Marsh, 2007). No-closure lakes are always connected to a river channel, low-closure lakes are annually flooded but only during peak discharge, whereas high-closure lakes are only inundated during extreme spring floods.
Sedimentation rates decrease within the delta from an average of 3.5 mm/year in the upper delta to an average of 2.6 mm/year in the lower delta, with high-closure lakes having the lowest and no-closure lakes the highest sedimentation rates (Marsh et al., 1999). The delta lakes most likely receive sediment input from both within the delta (from channel bank erosion) and from the upstream Mackenzie River. Carson et al. (1999) estimated within-delta erosion to be about half of the estimated fluvial sediment flux delivered from upstream. During the spring flood, most sediment and associated terrestrial organic material (dissolved and particulate material) probably originates from bank erosion along the river, shallow soils and surface run-off associated with snowmelt. Later in the summer, permafrost thaw allows additional release of terrestrial organic matter from deeper soils in the active layer (Frey and McClelland, 2009; Feng et al., 2013b). Sediments from some of these lakes show thick annual laminations, indicating that flood layers are well-preserved (Graf Pannatier, 1997). These laminations typically contain a darker, coarse layer deposited during the spring freshet and a finer, lighter layer made up of grains settling out of suspension during the summer months. Productivity within the lakes increases later in the season, adding input of fresh, autotrophic carbon to lake sediments (Tank et al., 2011). When lakes then become ice covered in October/November, a condition which typically persists for 7–8 months of the year (Emmerton et al., 2007), oxygen drawdown in bottom waters associated with organic matter respiration can result in anoxic conditions that limit bioturbation and promote formation of laminated sediment layers (Ingall et al., 1993). The Mackenzie River is also known to carry considerable amounts of rock-derived OC (Goñi et al., 2005; Hilton et al., 2015). Delta lake sediments will therefore contain a mixture of sediments and OC from local and regional, and from modern to ancient, sources.
Materials and Methods
Sampling
All sampling was performed with a Northwest Territories Scientific Research License, issued by the Aurora Research Institute in Inuvik, Northwest Territories.
Sediment Core Sampling
Following a promising reconnaissance mission in 2007, 26 piston cores, ranging from 0.35 to 2.06 m in length, were retrieved from 20 different lakes in the upper, middle and lower delta in late March and early April of 2009 with a piston corer (system built in-house at Geology and Geophysics, Woods Hole Oceanographic Institution (WHOI), core diameter 2 and 3 inch). We selected 15 cores for further analyses (Figure 1; Table 1). Satellite images and previous studies were first used to target particular lakes, and then specific coring locations were chosen using ground penetrating radar surveys. Generally, lakes with water depths greater than 3 m were chosen as coring sites, as they are expected to be unfrozen at the bottom and have a deep talik (underlying unfrozen ground). Furthermore, coring sites were located away from lacustrine deltas when present. These deeper lakes were also less likely to be disturbed via sedimentary reworking (Graf Pannatier, 1997). Low-closure lakes were sampled along a rough east-west transect to provide a breadth of high-resolution sediment records. To examine changes in flood intensity, sets of neighboring no-closure, low-closure, and high-closure lakes were usually sampled together. For consistency, we will use the lake name terminology according to Vonk et al. (2015) with LD indicating lower-delta lakes, MD indicating middle-delta lakes and UD indicating upper delta lakes (Figure 1; Table 1).
Table 1. Descriptions of 15 cores in the Mackenzie River delta.
Suspended Sediment Sampling
Surface water suspended sediment samples were collected daily from the Inuvik town boat launch (68.3571 °N, 133.7391 °W) on the East Channel of the Mackenzie River during the 2008 spring flood and once at the eastern side of the Mackenzie River main stem at the Tsiigehtchic ferry launch (67.4568 °N, 133.7599 °W). Hydrographic data from Environment Canada (http://wateroffice.ec.gc.ca) show that for the 2008 freshet (shown in Figure 2), both discharge and water level were near their long-term (1972–2010) average. Beltaos (2012) classified the 2008 freshet as a moderately severe mechanical breakup that involved some ice jamming, particularly in the Middle Channel. Because of broken ice cover at our East Channel sampling location for most of the sampling period, 1-L bottles of river water samples were collected from near the surface (< 1 m depth) of the river about 4–5 m from shore (using hip waders and long sampling sticks), and transferred into pre-leached PET bottles. The East Channel sampling location during freshet would have been roughly 12–13 m deep at its deepest point and roughly 170 m wide based on data collected in August of 2008 by the Geological Survey of Canada using a SwathPlus Interferometric sidescan (data provided by Dustin Whalen) and the hydrographic data from Environment Canada cited above. Due to sorting of sediments vertically and horizontally within the river (e.g., Bouchez et al., 2011; Hilton et al., 2015), the surface samples collected during the freshet may not be representative of the entire riverine suspended sediment load. However, since deltaic lakes receive predominantly near-surface water from the river, surface samples are likely representative of the sediment pool that will be deposited in lake sediments. Suspended sediments were recovered from the water by filtration (100–350 mL water per 47 mm diameter filter depending on sediment concentrations) through pre-combusted Whatman GF/F filters (nominal pore size 0.7 μm) using a peristaltic pump while shaking to keep the particles in suspension. Filters were frozen and transported back to the laboratory for analysis.
Sample Processing and Analysis
Sediment Core Processing
The cores were shipped from Inuvik to WHOI. During transport, cores were placed intact in their polycarbonate liners in insulated boxes to prevent freezing of the water in the sedimentary pore spaces. The cores were split in two using metal cutting shears. Once split, disturbed core faces were removed and cores photographed, wrapped in plastic film to maintain water content, and put into refrigerated, dark storage. One half was preserved for archival records, and the other half subjected to a variety of tests. The lithology, texture, structures, color, and organic fragments of each core were logged, along with any other notable features.
Sedimentological Analyses
Bulk density measurements were performed for 11 cores (Table 1) at 5 cm intervals. A known volume of sediment was taken from each core using a syringe, weighed, dried overnight at 85°C, and weighed again. Bulk density was calculated in g/cm3 as the mass of the dry sediment divided by the volume of the sample.
The samples used for bulk density calculations were subsequently powdered for radioisotopic dating using a mortar and pestle. Four additional samples were analyzed for each of the cores LD-1 (lower delta 1), MD-2 (middle delta 2), and UD-4 (upper delta 4) to improve sampling resolution near the 137Cs peak and onset. Passive radioisotopic measurements (210Pb, 214Pb, and 137Cs) were conducted using two Canberra GL2020RS high-purity germanium gamma detectors. Samples were counted for at least 1 day. Completed counts were then converted and plotted as disintegrations per minute (dpm) per gram. Plotted cores were dated using the year 1951 AD and 1964 AD as the onset and peak of 137Cs, respectively (Rember et al., 1993). Using the 137Cs peak and onset, sedimentation rates were calculated using the equation:
where rs is the rate of sedimentation in cm per year, dcs is the interval over which sediment accumulated (the depth of the 137Cs peak or the distance between peak and onset), and t is the number of years covered in the interval (45 in the case of peak-modern record, and 13 in the case of onset-peak). This value was taken as the sedimentation rate and multiplied by the total length of the core when it appeared to be in a no-closure or low-closure state (i.e., without peat-rich layers) to provide an estimate of the duration of the sedimentary record within the current sedimentary regime. Organic fragment samples (foliar material and charcoal) were collected from nine different cores (Table 1) for radiocarbon dating (see Section Bulk Geochemical Analyses for details on pre-treatment and analysis). These organic fragments were taken at the upper boundary of major organic-rich layers (peat), which are taken to mark the transition from a complete or partial wetland phase to a lacustrine phase. This technique was employed for obtaining long-term chronologies.
X-radiographic profiles were measured using an Itrax Core Scanner, manufactured by Cox Analytical Systems. From 11 cores (Table 1) slab subsamples were taken ~1 cm thick and 2.5 cm wide from the center of a core (U-channels) for lamination counts. These cores were chosen as targets because the presence of lamina in visual core descriptions indicated that they were likely from no-closure or low-closure lakes. Scans were conducted at a resolution of 0.2 mm. Additionally, lamina counts were conducted on the high-resolution radiographs for which 137Cs dating was conducted to determine the frequency of sedimentary input on recent timescales. This was done using the equation:
where rd is defined as the rate of deposition in years per lamina, LCs the number of lamina couplets counted between points, and t is the same as in Equation (1). This value was then taken as the resolution of the sedimentary record, and multiplied by the total number of couplets to determine the approximate length of the lamina-based sedimentary record.
To determine the temporal range covered by entire cores, rs (Equation 1) and rd (Equation 2) were multiplied by the total core length and total lamina couplets counted, respectively. For the section of the core above the 137Cs peak, rs and rd calculated from 1964 to 2009 were used; below this section, rs and rd calculated using the 1951-1964 interval were used. Where sampling resolution was insufficient to differentiate between peak and onset, the 1964–2009 rate was used for the entire core. These rates were extrapolated downwards to the depth at which an organic layer showed up and lamina were no longer present, as this was taken as evidence that the lake was entering a new hydrologic regime and therefore modern deposition patterns could no longer be reliably used.
Geochemical Analyses
Bulk and molecular geochemical analyses were done on the sediment core from lake LD-1 collected in 2007 as well as on the suspended particulate matter (SPM) sampled during the freshet in 2008. The filters were analyzed for OC and N (in mg) and normalized to volume water by using the known filtered volumes. The sediment core was sub-sectioned into 1-cm horizons, and frozen until analysis. Then they were freeze-dried and ground with a mortar and pestle. The samples were analyzed randomly from different depths, so the trends presented in Section Results and Discussion do not reflect instrument drift or other analytical artifacts.
Bulk Geochemical Analyses
Carbon elemental and stable isotopic analyses were performed after acidification using the method outlined in Whiteside et al. (2010). Nitrogen concentrations were determined following the same method but without the acidification steps. Briefly, samples underwent vapor phase acidification with concentrated HCl at 60–65°C for 60–72 h to completely remove any inorganic carbon and were dried at the same temperature for ~24 h. Samples were analyzed using a Carlo Erba 1108 elemental analyser (EA) interfaced via a Finnigan-MAT Conflo-II open split device to a DeltaPlus isotope-ratio-monitoring MS and compared to a reference (NBS-19; limestone from National Bureau of Standards, now NIST, with δ13C = 1.95%0 vs. PDB) and a glycine in-house standard (δ13C of −34.1‰).
Bulk OC 14C data of lake LD-1 and SPM were acquired at the National Ocean Sciences Accelerator Mass Spectrometry (NOSAMS) facility at WHOI following established procedures (McNichol et al., 1994). Briefly, sediments were acidified at NOSAMS via liquid-phase acidification to remove inorganic carbon, and the remaining OC was combusted to CO2, which was then converted to graphite that was pressed into targets and analyzed on the AMS instrument. Radiocarbon values of OC are reported as Δ14C (‰) relative to NBS Oxalic Acid I standard. Radiocarbon data on organic fragment samples was also performed at NOSAMS following a similar acidification pre-treatment as the lake and SPM samples. The 14C ages of the organic fragment samples were calibrated with Calib 5.0.1 software (Stuiver and Reimer, 1993) with the terrestrial IntCal04 calibration dataset (Reimer et al., 2009) and reported as year BP.
Molecular Geochemical Analyses
Lignin phenol concentrations were determined using cupric oxide oxidation (Hedges and Ertel, 1982). Suspended sediments were oxidized in a Microwave Accelerated Reaction System (MARS) from CEM using the method of Goñi and Montgomery (2000). For suspended sediments, a whole filter was added to a Teflon vessel, to which 20 mL of deoxygenated 2N NaOH along with CuO and ferrous ammonium sulfate were added. The reaction ran at 150°C for 90 min under a positive pressure of N2 gas. The lake sediments were oxidized using the more traditional method outlined in Goñi and Hedges (1992). Briefly, sediment samples were combined with CuO, ferrous ammonium sulfate and deoxygenated 2N NaOH in 3.2 mL reaction bombs made of Monel-400 and purged with nitrogen. The reaction bombs were then heated at 150°C for 3 h in a modified GC oven. All further processing was the same for both sets of samples. After reaction, an internal standard of trans-cinnamic acid and ethylvanillin, was added to the samples, the supernatants were decanted and acidified to pH 1 using 6N HCl. The reaction products were extracted with ethyl acetate, dewatered with sodium sulfate and dried completely under N2 gas. The extracts were redissolved in pyridine and derivatised with N,O-bis (trimethylsilyl) trifluoroacetamide (BSTFA) with 1% trimethylchlorosilane (TMCS) for 20 min at 70°C to convert reaction products to their trimethylsilyl (TMS) counterparts. The TMS derivatives were quantified using a Hewlett-Packard 6890N gas chromatograph run in splitless mode and fitted with a flame ionization detector and a fused silica capillary column coated with Rxi-1MS stationary phase (Restek 30 m × 0.25 mm i.d. × 0.25 μm stationary phase). The injector and detector were held at 300°C, with H2 as the carrier gas. The oven temperature started at 100°C and was ramped at 4°C/min to 270°C and held at that temperature for 16 min. Reaction product concentrations were quantified relative to an external standard containing all of the compounds. To verify peak assignments and check for co-elutions, eight suspended sediment samples and four lake sediments were also analyzed with a Hewlett-Packard 6890 Plus GC coupled to an HP 5973 MS following separation on a Rxi-1MS capillary column (Restek 30 m × 0.25 mm i.d. × 0.25 μm stationary phase). Analytical uncertainties were estimated to be 15%.
The GF/F filters and sediment core slices for lipid analysis were freeze dried and extracted in 10–15 mL dichloromethane:methanol (DCM:MeOH 9:1 v/v) using a MARS unit from CEM operated at 1600 W and 100°C for 20 min. The total lipid extracts were separated into neutral, polar and acid fractions using ca. 0.5 g amino-propyl silica (Fluka Analytical, 15–35 μm particle size, ~9 nm pore size) and eluting with 4 mL hexane, 4 mL DCM:MeOH (1:1 v/v) and 4 mL 5% acetic acid in diethyl ether, respectively. The acid fraction was methylated using BF3-MeOH prior to analysis. Quantification was performed by means of gas chromatography with flame-ionization detection (GC-FID) using an external standard (even fatty acid methyl esters C16 to C30). The GC-FID (7890A, Agilent Technologies) was equipped with a DB-5MS column (Agilent J&W, 122-0132, 30 m, i.d. 250 μm, film thickness 0.25 μm) using H2 as a carrier gas. The GC oven temperature was programmed from 40°C (hold 1.5 min) to 130°C with 40°C/min, then to 320°C with 6°C/min where it was kept isothermally for 5 min. Analytical uncertainties were in the range of 15–16%.
Results
Sedimentological Characteristics
Visual Descriptions
A significant number of the split cores were visually obscured by monosulfide staining. Monosulfides were more common on the upper parts of cores where the sediment was less consolidated and often appeared to be accompanied by increased organic matter content. Overall, 10 cores had clear laminations (Figure 3), and some others showed hints of laminae, often in the form of differential surface staining. Laminations were present both in lakes that were classified in the field as low-closure and high-closure.
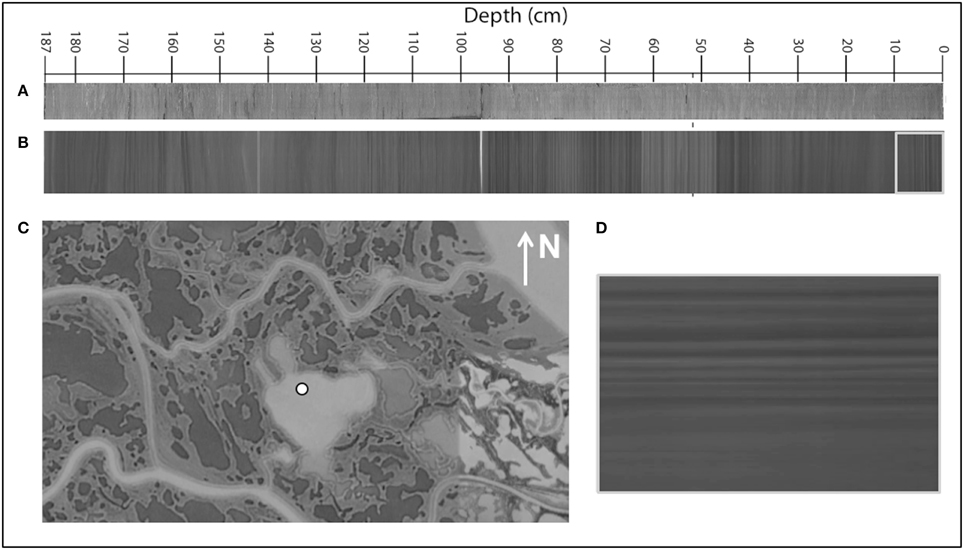
Figure 3. Sediment core (A) optical image and (B) radiograph, and (C) aerial photograph of Lake LD-1 (Google Earth, 2010). The sediment core shown was collected in 2009. The white point in (C) shows the coring location. The gray box (D) shows a close-up of the radiograph in (B) (rotated 90°), which is 10 cm in height. It clearly shows thick, fully-developed dense lamina (dark layers) overlain by less dense layers (light layers) containing thin denser sub-lamina.
Three dominant facies were commonly found in the cores. The first and most common facies is a fine-grained laminated sediment in the form of alternating clay-rich (lightly colored) and silt-rich (darker) mud beds, ranging from ~0.1 to 16 cm in thickness. Typically, the coarse-grained layers were thicker than the finer layers. The second common facies is massive clayey to silty mud with no evident structure and occasional organic fragments smaller than 1 cm in size. The third common facies is organic-rich beds, which ranged from a mud matrix containing organic fragments to cohesive peat beds. Organic fragments ranged from millimeter-scale to ~48 cm2 in surface area. These organic-rich layers contacted the mud above and below both gradationally and sharply. While organic-rich beds ranged in thickness up to 44 cm, the thickest peat bed was only 11 cm (Lake MD-5).
Bulk Density
Bulk density values typically ranged from 1 to 2 g/cm3, though less consolidated samples from the upper parts of sediment cores were often less than 1 g/cm3. There were no trends in bulk density values when the cores were looked at collectively, or within smaller delta sub-regions.
X-Radiography
High-resolution radiographic scans were completed for 11 cores (Table 1) and showed measurable laminae. In most cores, the laminations appeared in positive radiographs as a thicker dark layer (denser sediment) capped by a thin light layer (less dense sediment). This is in agreement with the sedimentological observations of the cores, and consistent with the spring sedimentary input, summer sedimentary settling model of lake deposition (Graf Pannatier, 1997). Organic layers in cores were characterized by a much lower density, and therefore lighter color, in radiographic images.
Radioisotopic Dating
Passive radioisotopic dating using 210Pb and 137Cs was completed on 11 cores via gamma counting. The 210Pb profiles for the cores showed no decay over the >50 cm length measured, an interval that is expected to significantly exceed five half-lives of 210Pb in many of the cores. However, 10 cores showed distinct 137Cs peaks (Figure S1). Peak depths ranged from 4.5 to 5.5 cm to 52–53 cm. As these peaks all represent the same year (1964 AD) this indicates a variety of sedimentation rates throughout the study area between 1964 and 2009 (0.11–1.17 cm/year). Sedimentation rates from 1951 to 1964 were also calculated using the onset of 137Cs in the core. This was possible for four cores (LD-1, LD-3, MD-2, and UD-4). Sedimentation rates were comparable in the case of LD-3 and UD-4 between the two time intervals, and approximately half as much in the 1951-1964 interval for LD-1 and MD-2. Depositional frequency was comparable in the case of LD-1, but approximately half as frequent in both MD-2 and UD-4 in the 1951-1964 interval. For LD-3, depositional frequency could not be calculated due to the absence of distinct lamina. Radiocarbon samples dated from nine cores at the tops of organic layers show great variety throughout the study area (300–1800 years BP; Table 1; Table S2).
When using 137Cs dating to extrapolate down-core and determine the total sedimentary record available, the sedimentation-rate and depositional-frequency techniques are in close agreement for short sedimentary lengths, but results differ for the cores with shallowest 137Cs peaks such as UD-1, UD-2, and MD-11 (Table 1, Figure S1). While these two techniques can provide an upper and lower bound to age models, a short interval of sediment above the 137Cs peak cannot be used to reliably predict long-term accumulation rates.
Lake LD-1
The Lake LD-1 sediment core showed laminations containing alternating light-colored, clay-rich beds and darker, silt-rich mud beds. The coarser layers were typically thicker than the finer layers, and the laminations were between 0.5 and 1.5 cm thick. Cores collected in 2007 (during the reconnaissance mission) and in 2009 closely resembled each other indicating homogenous deposition in the lake. The age model based on the 137Cs peak (also performed for the 2007 core) gave sedimentation rates of 1.04 cm/year and 1.17 cm/year for the 2007 and 2009 cores, respectively. This matches the 0.93–0.90 years/lamina we found (Table 1) quite closely, particularly taking into account the uncertainty in defining the 137Cs peaks.
River Hydrology during Sample Collection
Hydrographic data for the Mackenzie River at Inuvik and Tsiigehtchic are plotted in Figure 2. Tsiigehtchic is located just upstream of the delta, where the river divides into a number of distributaries. One of these distributaries is the Mackenzie East Channel. We sampled the East Channel near Inuvik, about 100 km downstream of Tsiigehtchic (Figure 1). Peak flow at Tsiigehtchic is roughly 50 times as large as that at Inuvik, and both river discharge and water level rose several days earlier at Tsiigehtchic than at Inuvik (Figure 2). River flow (Figure 2A) at Inuvik had a clear peak on May 31, whereas discharge at Tsiigehtchic was fairly steady for roughly 2 weeks. In contrast, river level (Figure 2B) peaked May 23 at Tsiigehtchic, whereas Inuvik experienced two peaks on May 28 and 31. The differences between river flow and level represent in part the effects of ice damming and other ice effects on the river (Goulding et al., 2009). These effects are present during spring melt but absent during the rest of the high-flow period and can partially explain why the high flow events at the beginning of July did not raise river level nearly as much as the May-June flood.
The 12 suspended sediment samples collected from Inuvik encompassed the period of peak flow and peak water level at this site, including periods of rising and falling water (Figures 2A,B). The one sample from Tsiigehtchic was collected during the broad peak in river flow at this location, but during a period when river level was falling.
Bulk Geochemical Properties
Lake LD-1 Sediments
The bulk organic geochemical properties of Lake LD-1 sediments collected from the middle delta were relatively homogenous (Figure 4; Table S5). Lake sediment OC concentrations ranged between 1.1 and 1.4% (n = 84; Figure 4A), with a mean value of 1.3%. Sedimentary C/N ratios ranged from 10.4 to 12.3 (mean, 11.3; Figure 4B), and δ13C values were very uniform, ranging from −26.2 to −26.5‰ (mean −26.4‰ Figure 4C). Of the bulk properties, lake sediment Δ14C values showed the most variability, ranging between −738 to −821‰ (mean −786‰ n = 33; Figure 4D). These values correspond to conventional 14C ages of 10,700 to 13,800 years BP (mean 12,300 years; Figure 4E).
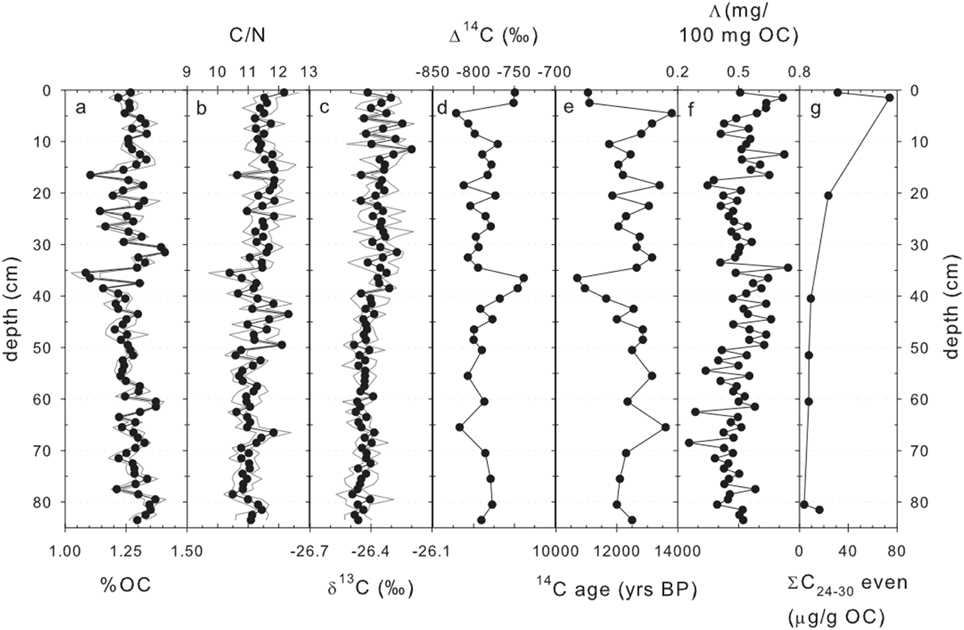
Figure 4. Organic geochemical data for lake LD-1 down-core sediment horizons, with (A) %OC, (B) atomic C/N ratios, (C) stable carbon isotopic (δ13C) ratios, (D) radiocarbon (Δ14C) signature, (E) radiocarbon age (years BP), (F) total lignin yield per mass OC, and (G) sum of even long-chain (C24–C30) fatty acids per mass OC. The gray lines in plots a-c show ± 1 standard deviation. The analytical uncertainty for Δ14C and 14C-age are smaller than the data points.
Riverine Suspended Sediments
The suspended sediment samples collected from Inuvik show bulk organic geochemical properties that vary over the sampling period (Figure 5; Table S3). Riverine POC concentration at Inuvik was fairly steady between 4.5 and 6.4 mg/L up for the first 7 days we measured, with the exception of May 27 (Figure 5A). On that particular day we used a different method to measure filtration volume which was likely less accurate. While POC concentration is less certain on this day, the isotope ratios and molecular properties will be unaffected by this issue. After both flow and discharge peaked (on May 31), POC concentrations dropped to between 1.6 and 2.4 mg/L. The highest POC concentration was observed on May 30, and on this day we observed a lot of woody debris floating down the river.
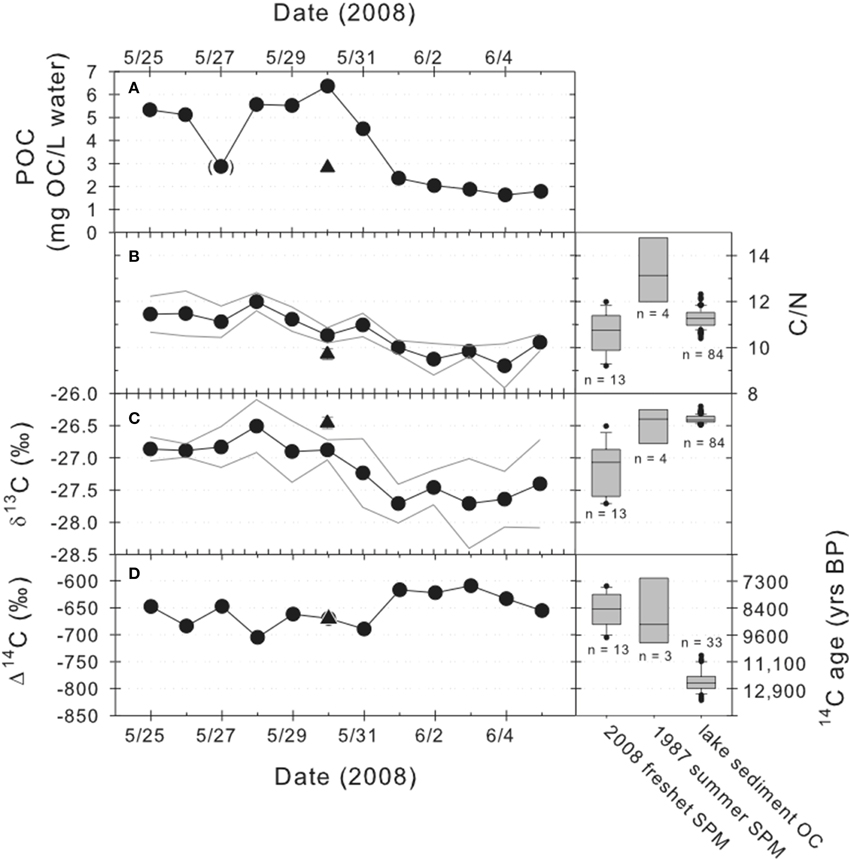
Figure 5. Bulk organic geochemical data for the Mackenzie River suspended sediment samples plotted by date, showing (A) POC concentration, (B) atomic C/N ratio, (C) stable carbon isotopic ratio, and (D) radiocarbon signature and age (14C years). Samples from Inuvik are indicated using circles whereas those for Tsiigehtchic are shown with a triangle. The gray lines in plots b and c show ± 1 standard deviation. The uncertainty for Δ14C is smaller than the data points. The data point shown in parentheses (POC on May 27) is more uncertain than the others because a less accurate method was used to measure filtration volume on this day. For comparison, box-and-whisker plots are shown on the right for the 2008 freshet samples, summer suspended sediment samples from 1987 (from Goñi et al., 2000, 2005) and lake sediments (0–84 cm). The box indicates the 25 and 75% values, and the line in the box indicates the median value. The whiskers extend to 10 and 90% values, and outlying points are shown as circles.
Elemental C/N ratios for particulate matter collected at Inuvik range between 9.2 and 12 and show a gradual decreasing trend (Figure 5B). Inorganic nitrogen contributions are less than 10% (estimated from the intercept in TOC-TN plot, not shown). The stable carbon isotopic composition of the POC shows a slight shift from relatively more 13C-enriched values of −26.9 to −26.5‰ during the first 6 days to more depleted values of −27.4 to −27.7‰ (Figure 5C). Radiocarbon POC values all are highly 14C-depleted, with Δ14C values ranging between −609 and −705‰, corresponding to conventional radiocarbon ages of 7490–9750 14C-years BP (Figures 5D, 6). The POC samples collected between June 1 and 4 show the youngest 14C values and the most depleted 13C values.
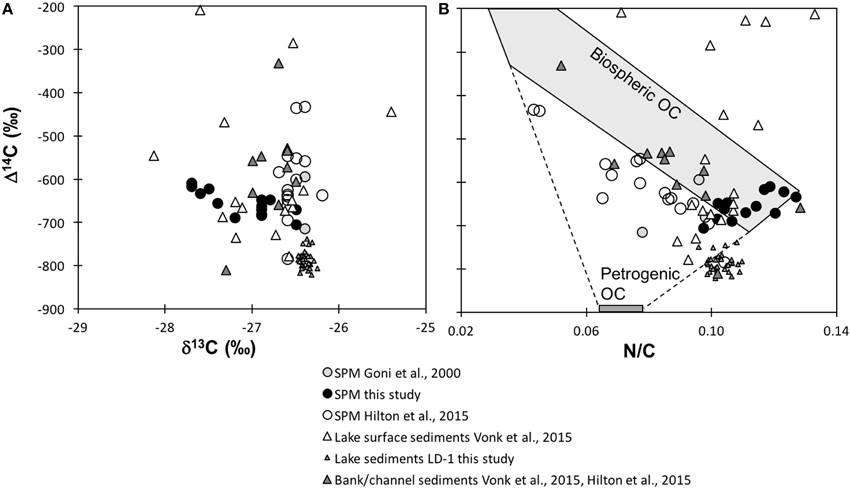
Figure 6. Δ14C values for suspended, lake, bank and channel sediments against (A) δ13C and (B) N/C ratios. Gray squares represent suspended sediments from the summer of 1987 (Goñi et al., 2000, 2005), black circles represent the 2008 freshet suspended sediment samples, white squares represent suspended sediments from 2009 to 2011 (Hilton et al., 2015), white diamonds represent delta-wide lake surface sediments from 1994, 2007 to 2009 (Vonk et al., 2015), small gray circles represent the sediment samples from lake core LD-1, and gray triangles represent bank and channel sediments from 2009 to 2011(Hilton et al., 2015; Vonk et al., 2015). Shaded shapes in (B) represent the petrogenic and biospheric end-member values from Hilton et al. (2015).
We only collected one particulate matter sample from the Mackenzie main stem at Tsiigehtchic, on May 30. Here, the POC concentration was 2.8 mg/L, which is similar to the POC values we observed a few days later at Inuvik (Figure 5A). Similarly, the corresponding C/N ratio, 9.7, falls in the range of values observed for the latter part of the sampling period at Inuvik. In contrast, both the stable carbon (−26.5‰) and radiocarbon (−670‰) isotopic values for the Tsiigehtchic sample more closely match those for the first half of the sampling period at Inuvik.
Lignin Phenol Properties
Lake Sediments
The sum of the eight main lignin phenols normalized to organic carbon content, Λ, from the lake sediments averaged 0.50 mg/100 mg OC (range: 0.26–0.74 mg/100 mg OC; n = 84; Figure 4F). The ratio of syringyl-to-vanillyl phenols (S/V) and the cinnamyl-to-vanillyl phenol ratio (C/V) for these samples averaged 0.39 and 0.10, respectively (ranges: 0.25–0.51 and 0.06–0.12, respectively; Figures 7A,C; Figure S3). The ratio of p-hydroxy-to-vanillyl phenols (P/V) averaged 0.20 (range: 0.14–0.26), similar to the values observed for the suspended sediments (Figure 8E). Acid-to-aldehyde ratios from the lake sediments averaged 0.51 for vanillyl phenols and 0.30 for syringyl phenols (ranges: 0.40–0.66 and 0.21–0.49, respectively; Figures 7B, 8D). The ratio of 3,5-dihydroxybenzoic acid to vanillyl phenols (3,5Bd/V) averaged 0.18 (range 0.12–0.23; Figure 8E).
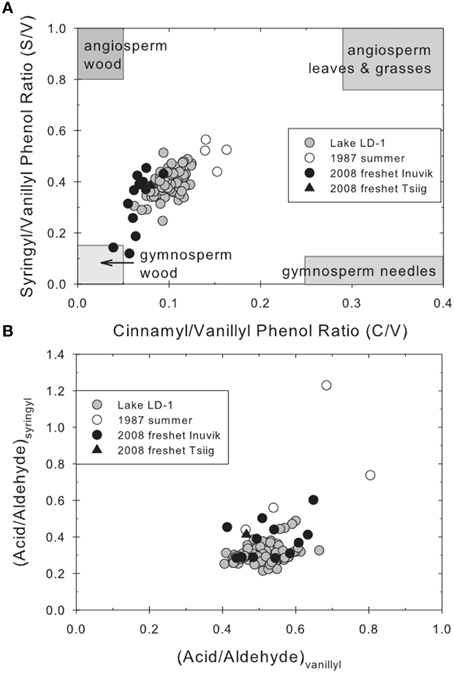
Figure 7. Plots of lignin parameters, including (A) S/V vs. C/V ratios for all samples, with boxes drawn from the literature depicting accepted ranges for common sources of OC, and (B) acid-to-aldehyde ratios for syringyl vs. vanillyl phenols for all samples.
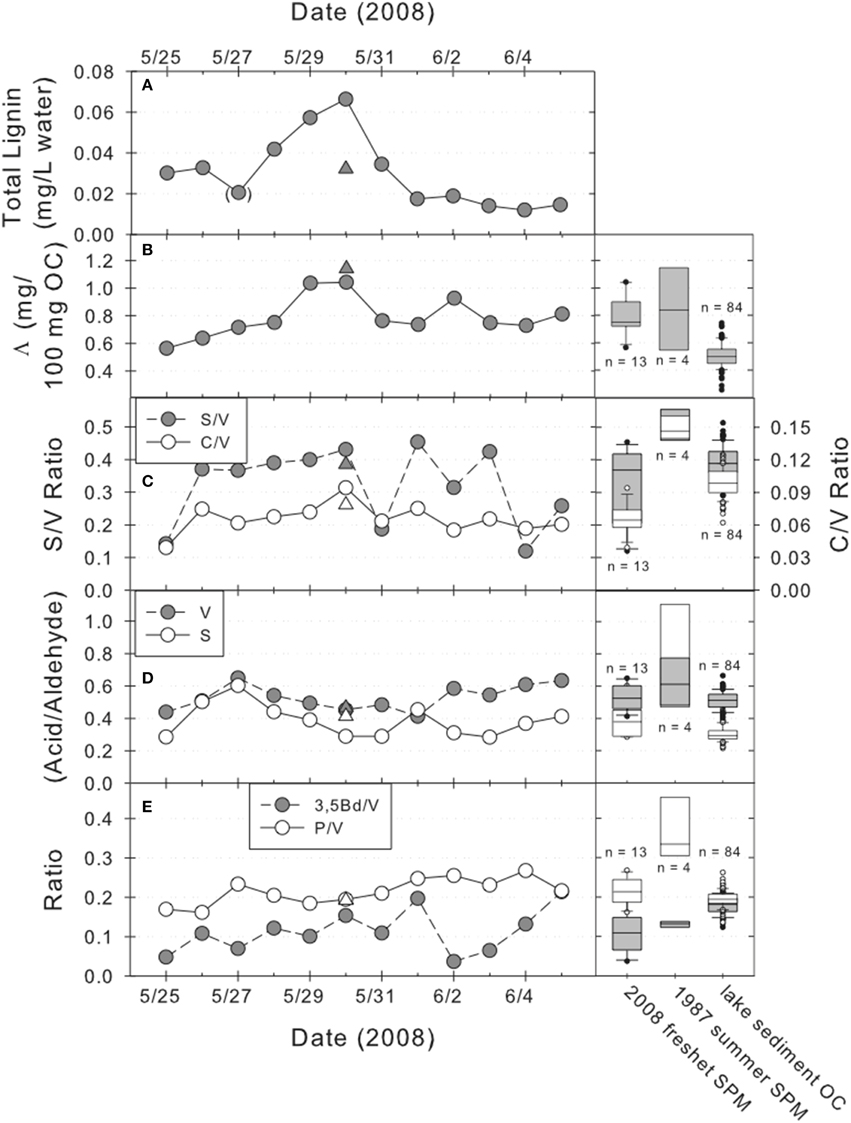
Figure 8. Lignin parameters for the suspended sediments, showing (A) total lignin concentration per liter water, (B) total lignin yield per mass OC (Λ), (C) syringyl/vanillyl (S/V) and cinnamyl/vanillyl (C/V) molecular ratios, (D) acid-to-aldehyde ratios for vanillyl (V) and syringyl (S) phenols, and (E) p-hydroxy/vanillyl (P/V) and 3,5-dihydroxybenzoic acid/vanillyl (3,5Bd/V) molecular ratios. Inuvik samples are plotted as circles and the Tsiigehtchic sample is shown by triangles. The data point shown in parentheses (lignin on May 27) is more uncertain than the others because a less accurate method was used to measure filtration volume on this day. Note the different vertical scales for the S/V and C/V ratios. For comparison, box-and-whisker plots (described in Figure 5) are shown on the right for the 2008 freshet samples, summer suspended sediment samples from 1987 (from Goñi et al., 2000, 2005) and lake sediments (0–84 cm).
Riverine Suspended Sediments
The concentration of sedimentary lignin phenols increased during the first 6 days from 0.03 to nearly 0.07 total lignin/L (again, the sum of eight lignin phenols) and then decreased to values around 0.02 (Figure 8A; Table S4). Λ gradually increased during the sampling period from 0.56 to 0.81 mg/100 mg OC with some higher values up to 1.04 mg/100 mg OC in between (Figure 7B). The S/V ratios ranged from 0.12 to 0.45 (mean, 0.32), and C/V ratios fell between 0.04 and 0.09 (mean, 0.07; Figure 8C; Table S3). Both ratios were lowest on the first day then generally increased up to May 30, and fluctuated afterwards, particularly the S/V ratio. Acid-to-aldehyde ratios for vanillyl phenols from the suspended sediments were between 0.41 and 0.65 (mean 0.53), whereas those for syringyl phenols ranged from 0.28 and 0.60 (mean 0.39; Figure 8D). The P/V values ranged between 0.16 and 0.27, and the 3,5Bd/V ratio, ranged from 0.04 to 0.21 (mean 0.11; Figure 8E).
The total lignin phenol yield was approximately the same in the Tsiigehtchic sediment as in the Inuvik sediments with the highest yields (1.14 mg/100 mg OC; Figure 8B). However, all of the molecular ratios from the Tsiigehtchic sample were similar to those collected at Inuvik, suggesting no significant difference in lignin composition in suspended particulate matter between these two sites during the freshet.
Fatty Acid Composition
Lake Sediments
The lake sediments yielded concentrations of even chain length, long-chain fatty acids (ΣC24–30 even) ranging from 3.9 to 74 μg/g OC (or 0.05 to 0.9 μg/g sediment Figure 4G). The average chain length was 24 (the C24 fatty acid was the most abundant), and short-to-long chain (C16 + C18/C24 + C26 + C28 + C30) ratios varied between 0.72 and 2.8 (mean 1.7).
Riverine Suspended Sediments
The suspended sediment samples showed higher OC-normalized concentrations of even chain length, long-chain acids than did the lake sediments, with values between 69 and 151 μg/g OC (or between 0.18 and 0.98 μg/L, Figures 9A,B; Figure S2; Table S6). Short-to-long chain ratios were somewhat higher than Lake LD-1 sediments, with values between 1.9 and 6.2 (Figure 9C). Concentrations of long-chain fatty acids per unit water (i.e., not OC-normalized) peaked on May 30 and showed the lowest values on the last 6 days of sampling (Figure 9A). The OC-normalized values were more stable during the sampling period (Figure 9B). The ratio of short-to-long-chain fatty acids ranged from 2.0 to 6.8 with the lowest value at May 30 (Figure 9C) and the average chain length 25 (C26 fatty acid was the most abundant long-chain fatty acid in most samples).
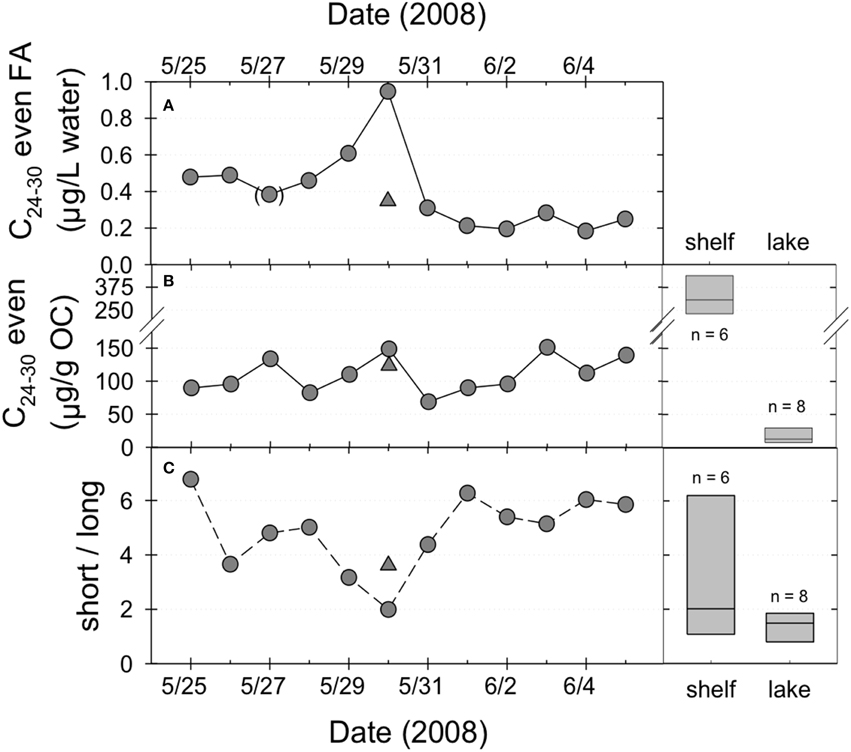
Figure 9. Fatty acid composition data, including (A) long-chain (even) plant wax fatty acid concentration per liter water, (B) yields of long-chain (even) plant wax fatty acids from suspended sediments normalized per mass OC, and (C) the ratio of short (C16 and C18) to long (C24, C26, C28, and C30) fatty acids, plotted by date, with Inuvik samples indicated by circles and the Tsiigehtchic sample marked by a triangle. The data point shown in parentheses (lipids on May 27) is more uncertain than the others because a less accurate method was used to measure filtration volume on this day. Data for continental shelf sediments (from Drenzek et al., 2007) and lake sediments are shown on the right. Box-and-whisker plot details as described in the caption for Figure 5.
The long-chain fatty acid concentration at Tsiigehtchic was 123 μg/g OC, which is in the same range as the Inuvik samples (Figure 9B). Additionally, the average chain length (25), and the short-to-long chain ratio (3.5) fell within the Inuvik sample values (Figure 9C).
Discussion
Sediment Deposition across the Delta
Factors Controlling Sediment Deposition
The three observed dominant facies (fine-grained laminated, massive mud without structure, and organic-rich beds) are indicative for different depositional regimes. The fine-grained laminated sediments of alternating dark layers (clay) and light layers (silt) represent spring flood sediments followed by finer sediment settling out of suspension during the summer, respectively (Graf Pannatier, 1997). The facies with massive mud without evident structure occurred in small sections of otherwise laminated cores (e.g., UD-3) to the entirety of cores (e.g., MD-3) and is typical for high-closure lakes where the main mode of sediment deposition is settling out of suspension. Finally, the organic-rich beds are likely indicative for lakes that are exposed to cycles of wetting and desiccation. The lack of 210Pb decay over the core lengths suggests that there were very limited amounts of unsupported 210Pb, likely due to the very large ancient detrital load contribution, as illustrated by the 14C ages of the OC (Figure 4D).
Not unexpectedly, cores throughout the delta showed a great deal of diversity but several general statements can be made about the different regions of the delta. Generally, deposition is controlled by three factors: (i) the degree of closure, (ii) distance from the sediment source, and (iii) the number and character of intermediate settling basins (Graf Pannatier, 1997). For example, the three low-closure cores from the upper delta (UD-1, UD-2, and UD-4) showed a relatively shallow 137Cs peak (Figure S1). This is consistent with the observations of Hill et al. (2001) that levee height controls flooding for lakes with closure leading to low sedimentation rates.
The sediment records of no-closure lakes such as MD-2, MD-6, and MD-11 also clearly show the influence of the three factors described above. The sediment in Lake MD-11, for example, is affected by intermediate settling basins and overbank flooding. Its sediment showed thick less-dense sediments interbedded with thin, dense layers. Sediment enters lake MD-11 through a distributary channel that first passes through three other lakes, delivering only fine-grained sediments that have remained in suspension, explaining the thicker, less-dense sediments. The thin, dense layers are likely due to occasional overbank flooding that provides higher-energy sediment input. Another example is the sediment in Lake MD-2, which is affected by past changes in the degree of closure. Lake MD-2 shows thin, denser sub-laminae within the less-dense cap layer, especially prevalent in the upper sections of the core (115 cm). While the core shows just 114 fully-developed couplets in the radiograph, when these sub-laminae are included the total count of couplets increases to 315. Modern sedimentation (1964-2009) rates are 1.1 cm/year, with deposition occurring on an annual basis. Between 1964 and 1951, however, deposition slows down to approximately every other year and the sedimentation rate decreases to 0.62 cm/year (Table 1). While the latter change can be partially explained by compaction, decreasing depositional-frequency is likely due to a change in closure. Currently, Lake MD-2 is a no-closure lake; it is connected to the Mackenzie River main channel by a distributary channel and has a small yet evident lacustrine delta, indicating that the river channel is the lake's primary sediment source. Based on sedimentation-rate (depositional-frequency) down-core extrapolation, we derive that Lake MD-2 has been no-closure for the past 150 years (171 years), low-closure for the previous 63 years (39 years), and dry prior to this. Wolfe et al. (2006) caution against the use of laminae to determine flood frequency in the past; however, by using characteristic sedimentary facies of each state of closure, we can determine the quantity of flood-sourced sediment when Lake MD-2 was at different closure levels. Thus, Lake MD-2 provides a record of both flood frequency (based on the presence of these thin laminae) and intensity (based on the thickness of thin laminae) on an annual basis for the past >150 years. A last example is Lake MD-6, which is affected by both sediment source distance and intermediate settling basins. This lake contains a large lacustrine delta and is a so-called “flow-through lake” (Marsh and Hey, 1989); it is fed by a short offshoot of the fairly large distributary channel that connects the Mackenzie River main channel to Lake MD-2 and also has an exit flow channel. Sedimentation-rate and deposition-frequency methods produced a >200% difference in predicted total sediment record (133 and 64 years, respectively) for core MD-6 (Table 1), likely explained by a change in dynamics of channel hydrology. While the frequency of flooding remained constant, the amount of sediment deposited during each flood decreased at some point above the 1964 137Cs peak. Growth of this lacustrine delta within the intervening 46 years could have easily intercepted a sizeable percentage of the sediment coming into Lake MD-6, thus starving the center of the lake of sediment while still allowing for the same frequency of deposition.
Historical Changes in Sediment Deposition
Overall, our data show that the Mackenzie delta lakes evolve on millennial and shorter timescales. Peat layers may reflect past periods when lakes transformed into wetlands, either caused by changing lake connectivity to the main channel or a changing climate (Marsh, 1990). Radiocarbon ages of sampled peat layers (from 38 to 157 cm depth) in the Mackenzie delta cores showed calibrated ages ranging between 363 ± 65 and 1755 ± 56 BP (Table 1), indicating that these organic layers have been consistently developing over a long time period. Within our data set of sample of nine radiocarbon dates, we see a slight clustering of dates in the interval 1700 ± 100 years BP but no clear trend. Importantly, however, in several cores we see peat layers in between lacustrine sedimentary deposits suggesting that lakes can dry up and be reactivated over relatively short timescales. For example, a peat layer at 157 cm depth in Lake MD-2 highlights that even a lake larger than seven km2 can shift from a wetland to a lake and back within a timespan of about 200 years.
Modern geomorphic studies based on satellite imagery also suggest that these shifts can happen rather rapidly. For example, Marsh and Hey (1989) investigated a number of lakes including Lake MD-1 in the late 1980s. They described Lake MD-1 at the time of their study as a no-closure lake with a connecting channel but satellite imagery from 2004, however, shows vegetation in this former channel site, indicating that Lake MD-1 has thus transitioned from no-closure to low-closure in just 20 years. A lake drying and then being reactivated could occur for a number of reasons, such as a river channel changing course and cutting off a lake's water supply, a delta-wide decrease in average flood stage, or a changing climate increasing net precipitation; regardless of the mechanism, shifts in closure over time offer a valuable tool for investigating past hydrological regimes. For a past record of fluvial biogeochemistry, however, a lake with a stable past hydrological regime is beneficial. For Lake LD-1, the 1951-1964 and 1964-2009 sedimentation rates are similar, implying that the hydrological regime of Lake LD-1 has been relatively consistent over the past >60 years. This was one of the reasons why we chose to select Lake LD-1 for additional biogeochemical analyses. Also, Graf Pannatier identified this lake (designated as “Lake 7” in her study) as a location with high-sedimentation rates and laminated sediments (Graf Pannatier, 1997). Furthermore, LD-1 is a low-closure lake located in the lower delta, indicating that it receives frequent sedimentary input and thus has a high potential as a hydrological and biogeochemical recorder. This is supported by both the high sedimentation rate and consistent age agreement between 137Cs and lamina count dating techniques. The depositional frequency for Lake LD-1 is highest of all cores, with 0.90–0.93 years/lamina (Table 1) providing sufficient material for detailed, molecular, organic geochemical analysis. Finally, complementary cores collected from LD-1 in 2007 and 2009 had similar sedimentation rates, which suggests that sampling locations were representative of whole-lake deposition due to flooding, rather than local features (e.g., lacustrine deltas or bank erosion). Lake LD-1 provides a record of fluvial laminae extending back nearly 200 years. The core collected in 2007 was selected for in-depth molecular/geochemical analysis.
Sources of OC to Suspended and Lower Delta (Lake LD-1) Lake Sediments
Bulk geochemical composition of lake and SPM sediments suggest a mixture of modern higher-plant derived material with older material, from pre-aged permafrost soil and/or rock-derived “petrogenic” matter. The C/N ratio for both sample types (Figure 5B) falls within the range observed for soils (Baldock et al., 1992) and intermediate between that found for terrestrial higher plants, which typically have values >20, and algae, which have C/N values between 4 and 10 (Meyers, 1994). The C/N ratios of other lake surface sediments and bank/channel sediments across the delta are 11 ± 1.5 (n = 20) and 13 ± 1.9 (n = 9), respectively (Vonk et al., 2015), which is in the same range as our data. The stable carbon isotopic signatures for suspended (Figure 5C) and lake sediments (Figure 4C) fall within the range observed for C3 plants and soil OC developed from C3 plants, although soil OC tends to be 13C-enriched relative to its plant origin (Ehleringer et al., 2000). We argue that a planktonic or algal source is unlikely or very minor, as freshwater plankton δ13C values are likely −31‰ or lower in this system (inorganic carbon is around −8‰ in the Mackenzie River, Hitchon and Krouse, 1972; combined with a fractionation factor of at least 23‰, Mook and Tan, 1991). Also, high sediment yields limit algal production. Suspended sediments show a larger δ13C variation than lake sediments (Figures 4C, 5C, 6A), which could be related to small shifts in the type of OC input over time, which is less obvious in lake sediments that integrate over longer, annual, timescales. The radiocarbon content of all samples (Figures 4D, 5D) is very depleted. A number of other studies of the Mackenzie River system (on sediment and suspended OC) have reported similarly low radiocarbon contents (Figure 6A; Goñi et al., 2005; Drenzek et al., 2007; Hilton et al., 2015; Vonk et al., 2015). This evidence, combined with low carbon preference index values (CPI) for n-alkanes extracted from Mackenzie River sediments (Yunker et al., 2002; Drenzek et al., 2009) suggests that the river carries significant amounts of sedimentary rock-derived “petrogenic” OC as well as pre-aged terrestrial (permafrost) OC that mixes with more modern plant- and minor contributions of algal-derived OC (Goñi et al., 2005; Drenzek et al., 2007; Hilton et al., 2015). The presence of such ancient OC likely at least partially accounts for the old age of the POC we sampled.
Analysis of lignin phenols can provide additional insights into sources of OC to sediments. Lignin is a structural component of vascular land plant cell walls, and the concentration and composition of lignin-derived phenols is commonly used to trace higher plant-derived OC in the environment (e.g., Hedges and Mann, 1979a). The values (OC-normalized) observed in the suspended and lake sediments (Figure 8B) are similar to those observed in a number of Siberian rivers (Lobbes et al., 2000), with the exception of the Ob' and Yenisey, which drain large extents of peatlands and thus have higher values (Lobbes et al., 2000; Dickens et al., 2011). The lignin content in the Mackenzie suspended sediments is also lower than most values observed from temperate (Mississippi; Bianchi et al., 2002) and tropical (Fly-Strickland and Amazon; Hedges et al., 2000; Alin et al., 2008; Feng et al., 2016) rivers.
The ratios of different compound classes of phenolic monomers (e.g., S/V, C/V, and P/V) are frequently used to infer the types of plant precursors. For example, high S/V ratios (>0.75) tend to indicate the presence of angiosperm tissues, whereas high C/V ratios (>0.25) suggest the presence of non-woody tissues (Hedges and Mann, 1979b; Goñi and Hedges, 1992). Plotting these two ratios against each other shows that OC in the freshet SPM contains somewhat more woody tissue than lake sediments (lower C/V and S/V ratios for SPM compared to lake sediments; Figure 7A), which fits with our observations of woody debris in the river while sampling, and the water-logged woody SPM near the river bed (Hilton et al., 2015). Lake sediment OC appears to derive largely from gymnosperm woody tissue combined with lesser proportions of non-woody angiosperm material (Figure 7A).
The sources of p-hydroxy phenols are more ambiguous, and P/V ratios have been used less frequently than S/V and C/V ratios as source indicators. However, because mosses yield very high amounts of p-hydroxy phenols (Williams et al., 1998; Williams and Yavitt, 2003), this ratio may provide insight into the presence of moss- or peat-derived OC in environments where this is a major source (Dickens et al., 2011; Feng et al., 2013b). The P/V values for both suspended and lake sediments (Figure 8E) are similar to or lower than those observed in tropical (Alin et al., 2008; Feng et al., 2016) and temperate (Gordon and Goñi, 2003) rivers and (much) lower than the values of 1.0–1.4 observed in the Ob' River (Dickens et al., 2011) or 0.4–1.3 in the Lena River in Siberia (Winterfeld et al., 2015). This suggests that peat/moss-derived OC is not a major source of carbon to the Mackenzie River, at least during our sampling period.
The ratio of the acid-to-aldehyde component of vanillyl and syringyl phenols provides information about the extent of oxidation of lignin in a sample, with higher acid-to-aldehyde ratios indicating more highly oxidized OC (Hedges et al., 1988; Opsahl and Benner, 1995). These ratios from the Mackenzie freshet and lake sediments (Figures 7B, 8C) were similar to the values observed in many other polar, temperate and tropical rivers (Hedges et al., 1986; Lobbes et al., 2000; Farella et al., 2001; Gordon and Goñi, 2003; Aufdenkampe et al., 2007; Alin et al., 2008; Dickens et al., 2011) and are higher than those from fresh plant tissue (Goñi and Hedges, 1992). This indicates that the lignin in these sediments had been subject to some degree of oxidative degradation, most likely during storage in soils prior to entering the river system. In contrast, the values of another degradation indicator, the ratio of 3,5-dihydroxybenzoic acid to vanillyl phenols (3,5Bd/V) ranged from very low (0.04) to moderate (0.23) in the suspended and lake sediments (mean 0.11; Figure 8E). This ratio is often used as a tracer of soil-derived OC, and values less than 0.1 are assumed to indicate undegraded plant tissue whereas (low latitude) soils and other environmental samples tend to have values ranging between 0.1 and 0.4, indicating that they have undergone degradation (Gordon and Goñi, 2003). The very low values of this ratio in many of the suspended sediment samples (Figure 8E) suggest the presence of considerable proportions of undegraded and/or partially degraded plant-derived tissue in these samples. Alternatively, high latitude/permafrost soils may also be relatively undegraded and could contain rather low ratios of 3,5Bd/V.
Long-chain fatty acids with even numbers of carbons (C24–C30) are components of leaf waxes almost exclusively produced by higher plants (Eglinton and Hamilton, 1967), and rarely found in aquatic organisms (Schouten et al., 1998). These compounds are frequently used as vascular plant biomarkers, similar to lignin phenols (e.g., Eglinton and Eglinton, 2008). However, these biomarkers derive from different parts of the plant (lignin is found in the cell wall, whereas these fatty acids are primarily on the surface of the leaves) and have a different affinity for the inorganic matrix (i.e., leaf waxes tend to be bound to clay minerals in organo-mineral aggregates). Given their loci of production as well as their different physicochemical properties, these two suites of compounds may trace different fractions of plant-derived OC in the environment, and may be transported, stored and distributed differently, although relatively few studies have explored these differences (e.g., Prahl et al., 1994; Feng et al., 2013a,b). Short-chain fatty acids, C16 and C18,are produced from virtually all types of life and are abundant in both soils and aquatic environments. With average chain lengths of around 24 to 25, short-to-long fatty acid chain ratios of 0.72–6.8 (Figure 9C), and concentrations of even chain length, long-chain fatty acids (ΣC24–30) between 3.9 and 151 μg/g OC (Figure 9B, Table S3), it seems the Mackenzie Delta samples contain clear contributions of plant-derived OC. Total fatty acid concentrations observed in suspended and lake sediments in this study are relatively low; a study by Drenzek et al. (2007) on sediments on the Mackenzie shelf and studies on suspended and shelf sediments in Siberian coastal systems (Vonk et al., 2010; Karlsson et al., 2011) all showed higher concentrations.
Temporal and Spatial Variation in SPM Geochemistry
The surface suspended sediment samples, collected during a 2-week time period in 2008 from the side of the East Channel at Inuvik, do present some limitations. First of all, surface suspended sediment sampling was performed instead of the [more desirable] width- and depth-integrated sampling due to logistical constraints imposed by conditions associated with ice breakup. While surface water sampling may be fairly representative of the water and sediment entering the lakes (see Section Variation of Lake Sediment Geochemistry with Hydrology), a more comprehensive sampling approach would have been optimal. Secondly, we only sampled during a limited time period at the peak of the freshet, while the period of higher discharge and river level lasts much longer (Figure 2). Lake-river connection times vary spatially and annually, but can be up to several months (Lesack and Marsh, 2007), and the lakes will receive river sediments during this entire period. However, sediment concentrations peak during the onset of the freshet and therefore we consider our period of sampling is reasonably representative for the bulk of the lake sediment deposition, and certainly capture a crucial period of the annual cycle of sediment supply. Thirdly, we only sampled during a single year, whereas suspended sediment flux is likely to vary from year to year (Holmes et al., 2002). Finally, for logistical reasons, we sampled almost exclusively from the East Channel, close to Inuvik. Lake LD-1, however, derives most of its water and sediments from the Middle Channel, which we were unable to access. Despite these limitations, the current sample suite provides an important window on properties of the suspended POC during the spring freshet.
From Figure 5, it appears that a shift in the geochemical composition of POC carried by the Mackenzie River at Inuvik occurred concurrent with a change in the amount of POC in the water column. The POC concentration shifted from high (>5 mg/L) to lower values (~2 mg/L) midway through the sampling period, with May 31 displaying transitional amounts. The shifts could either be due to changes in OC concentration or to changes in suspended sediment concentration. Unfortunately, we did not measure the latter, so the cause of the shift remains unknown. At this same time of the POC shift, the C/N ratio decreased from between 11 and 12 to values of 10 or lower (Figure 5B), mostly driven by changes in the POC concentration, and δ13C values shifted from a mean value of −26.8‰ to slightly more negative values (mean −27.6‰ Figure 5C). The radiocarbon signature also increased by about 50‰ from mean Δ14C −675‰ (14C age ~9000 years BP) to around −625‰ (~8000 years BP; Figure 5D). Lower POC concentrations at Inuvik may reflect receding water levels and reduction in discharge at Inuvik that caused settling of much of the suspended load. The changes in POC composition may result from additional inputs of detrital POC, potentially from more buoyant fresh vegetation debris or year-old POC from aquatic production that has been flushed from the lakes (Emmerton et al., 2008a). Lower C/N values could point toward detrital aquatic production, whereas more negative δ13C values can be explained by both (fresh or old) vegetation debris or aquatic sources (e.g., Tank et al., 2011), depending on the signature of the dissolved inorganic carbon used for photosynthesis. Both sources could be enriched in 14C (i.e., younger). Figures 7A,B, however, may suggest that the POC from the freshet in 2008 is a mixture of a petrogenic source and a source with high N/C, and relatively enriched Δ14C and δ13C. It is unlikely that the latter source is aquatic due to the old age and high N/C values. Perhaps the input of pre-aged permafrost OC plays a role here, but this remains speculative at this stage.
Lignin concentrations (normalized to both volume of water and mass OC) increased fairly steadily over the first half of the sampling period at Inuvik, to a peak on May 30 (Figures 8A,B). This day we observed large amounts of coarse woody debris in the river at Inuvik. Lignin concentrations decreased and remained fairly steady during the rest of the sampling period. Long-chain fatty acid concentrations (normalized to mass OC) remain fairly stable throughout the sampling period (Figure 9B). The ratio of short-to-long, even-carbon-numbered fatty acids decreases up to May 30, suggesting increasing proportions of plant-derived (long-chain) fatty acids (Figure 9C), followed by a shift to higher ratios later. The ratio remains fairly high for the last 5 days, suggesting significant contributions from non-plant sources, or shifts in the degradation status of plant-derived fatty acids. Lignin composition during the 2-week sampling period was somewhat variable but did not show distinct trends (Figures 8C–E). The S/V ratios (Figures 7A, 8C) are most variable suggesting the contribution of woody debris to the SPM on a few occasions during the sampling period. The sample collected at Tsiigehtchic, just upstream of the delta, showed geochemical concentrations and properties that fell within the range measured at Inuvik (Figures 5, 8). All lignin and lipid parameters suggest common vascular plant sources at Tsiigehtchic and Inuvik during the sampling period (Figures 8, 9).
Samples collected in late June and July of 1987 from sites located in the outer delta on the East, Middle, and Reindeer Channels (Figure 1) have been extensively characterized (e.g., Yunker et al., 1991, 2002; Goñi et al., 2000, 2005). They were collected from 1 m water depth using continuous flow centrifugation, and represent a period later in the summer when discharge is more stable. The bulk organic geochemical properties of these summer samples are fairly similar to those of our freshet samples, with C/N ratios and δ13C values that fall on the high end of our observations, and Δ14C values that overlap with the freshet values (Figures 5B–D; Goñi et al., 2000, 2005). The summer C/N ratios of 12–15 were lower than those observed in a different study for a similar time and region (16.5–18; Emmerton et al., 2008a). Suspended matter samples collected in June 2011 and September 2010 (Hilton et al., 2015) also show δ13C values that are more enriched than our 2008 samples, but the Δ14C values are of a similar range.
Lignin analyses reveal that values for the 1987 summer samples overlap with those from the freshet (Figure 8B), whereas the summer samples yield higher S/V, C/V, and P/V ratios (Figures 8C,D). These higher ratios imply that the summer samples contain relatively more non-woody material (Figure 7A) than the freshet samples, and also relatively more angiosperm material. These differences might be explained by differences in local vegetation sources at the sampling locations, with boreal forest dominating in the upper/middle delta samples and tundra in the outer delta samples. This would imply that OC is added to the river throughout its reach and may replace or augment pre-existing OC. However, the higher S/V, C/V and P/V ratios could also have a hydrodynamic explanation. These ratios are measured in the summer samples (Figures 8C,D) that are located in the outer delta (Goñi et al., 2000, 2005) where finer material preferentially settles as coarser, more silty material has already accumulated further south (upstream). Comparison of the acid-to-aldehyde ratios shows that the two late-July 1987 samples have experienced more degradation as suggested by slightly higher ratios (Figures 7B, 8D). The 3,5Bd/V ratio of the summer samples falls within the range of values observed for the freshet samples, suggesting a similar input of soil-derived OC.
Temporal Variation in Lake Sediment Geochemistry
Based on the age model presented above, the 84-cm sediment core analyzed represents roughly 100 years of deposition in Lake LD-1 (core collected in 2009), with sediments deposited in annual laminations derived from both freshet and off-peak deposition. Graf Pannatier (1997) found that the coarser sediment layers in this lake were deposited during the spring freshet and the finer layers settled out of suspension during the summer months (off-peak deposition). We defined each layer with an evident density contrast from that underlying it, obtained from a radiograph scan, as a lamination; and the yearly pairing of two laminae a couplet. With little sedimentary input during non-flood times, each flood layer is deposited almost directly on top of sediment from the previous flood.
Overall, bulk and molecular profiles within Lake LD-1 sediments are fairly homogenous (Figure 4 and Figures S3, S4). The %OC profile shows that most horizons have %OC values between 1.20 and 1.35%, with some horizons having higher or lower OC concentrations, which could be related to hydrological characteristics of the freshet (see Section Variation of Lake Sediment Geochemistry with Hydrology). Middle Channel %OC values are similar with values between 1.0 and 1.5% (Hilton et al., 2015). There are no clear correlations between the %OC profile and other chemical profiles. The %OC profile also appears to become more variable above 40 cm. Most changes are rather small and sometimes approach the analytical uncertainty of the measurements, but there seems to be a small but discernable increase in C/N ratios and δ13C values that could imply a gradual change in carbon inputs to the lake or a shift in the inputs at 40 cm depth (Figures 4B,C). The radiocarbon signature shows the greatest variability, with the most enriched/youngest values in the upper 5 cm, as well as in the 36–37 cm and 37–38 cm horizons (Figure 4D). The most depleted/oldest values were in the 4–5 cm and 65–66 cm horizons.
In a parallel study of delta lake surface sediment properties across the Mackenzie Delta (Vonk et al., 2015) we found that low-closure lakes show a relatively large range in %OC, δ13C and Δ14C values reflecting their variability related to factors such as the length of lake-river connections and distance to sediment source. Vonk et al. (2015) reported a %OC average of 1.9 ± 1.0% (range 0.92–4.8%) and δ13C of −26.9 ± 1.3‰ (range −30.7 to −24.7‰) for 15 low-closure lakes (see also Figure 6A). The Lake LD-1 downcore data fall near the middle of this range for both parameters. Radiocarbon values from Vonk et al. (2015) were on average −552 ± 190‰ and ranged between −230 to −780‰ (Figure 6A), with lower values for sediments with low %OC content, consistent with our relatively depleted downcore radiocarbon values.
The OC-normalized lignin phenol concentration L profile (Figure 4F) of sediments from Lake LD-1 shows some subtle variations, and there appears to be a subtle increase in lignin phenols from the bottom of the profile to the 34–35 cm horizon, followed by significantly lower concentrations from 34 to 17 cm and another shift to higher concentrations above 17 cm. Profiles of the lignin phenol ratios show some variability but no clear trends (Figure S3).
Concentration of long-chain, even-carbon-numbered fatty acids were only measured in eight downcore samples (Figure S4). Their concentrations were highest in the 1–2 cm horizon, and decrease with increasing depth, potentially reflecting diagenetic processes, i.e., degradation with depth. These changes in concentration appear to be accompanied by variations in the ratio of short-to -long-chain fatty acids (Figure S4). Comparison of the 40–41 cm and 42–43 cm horizons, as well as the 80–81 cm and 81–82 cm horizons, however, highlights that the variability could be relatively large between adjacent horizons.
Variation of Lake Sediment Geochemistry with Hydrology
We compared the geochemical properties of sediments with the hydrologic conditions of the spring freshet (Goulding et al., 2009) for the year we estimate that horizon was deposited (as determined using our age model assuming the uncertainty is < 1 year; Table S1). We found that %OC contents in lake sediments from 1974 to 2006 generally were lowest with higher peak discharge (Qmax; Figure 10A), higher backwater levels (ΔH; Figure 10B) and higher maximum peak water level during break-up (Hm; Figure 10C; for details on calculations of hydrological proxies see Goulding et al., 2009). The lowest %OC occurred in sediments deposited in years with high peak discharge but moderate to low backwater and maximum peak water levels (black circles in Figures 10A–C). The backwater level indicates the difference in height between ice-affected stage and height at equivalent discharge under open water conditions, and high backwater levels suggest that ice jamming is the main driver for increasing water levels (Goulding et al., 2009). It is interesting to note that the %OC in suspended sediments (deposited in delta lakes) apparently vary with the strength of landscape “flushing”; where high peak discharge carries more mineral sediments with lower OC contents. Furthermore, the 14C age of sediments also showed some trends with hydrological characteristics (Figures 10D–F). The data suggest that in years with high discharge and low ice jamming, relatively young but mineral-rich sediments (low %OC) are delivered to delta lakes, whereas in years with more ice jamming, high peak water levels but moderate discharge, sediments with moderate %OC content and also relatively young 14C age are transported to the delta lakes. Years with low discharge seem to deliver sediments with relatively old 14C-OC age.
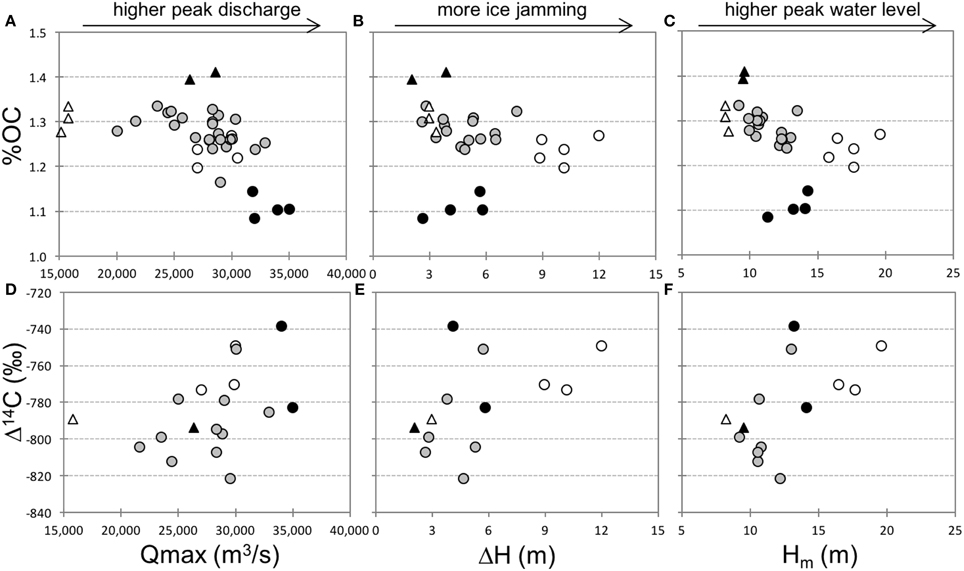
Figure 10. Hydrological controls on bulk %OC and 14C-OC content of lake LD-1 downcore sediments, using hydrological data from 1974 to 2009 from Goulding et al. (2009), including (upper): %OC plotted against (A) Qmax, (B) ΔH, (C) Hm, and (lower) Δ14C (%¸) plotted against (D) Qmax, (E) ΔH, and (F) Hm. Qmax is defined as the maximum break-up discharge (m3/s), ΔH as the backwater level, indicating the difference in height between ice-affected stage and height at equivalent discharge under open water conditions (m), and Hm is the maximum peak water level during break-up (m). Years with high discharge and moderate ΔH and Hm are plotted as black circles, years with moderate discharge but high ΔH and Hm are plotted as white circles, years with low discharge, low ΔH, and low Hm are plotted as white triangles, and year(s) with moderate discharge, and low ΔH and Hm are plotted as black triangles. The gray circles show all other years. Note that (D–F) have fewer data points as we do not have 14C data for all samples.
These patterns may be explained by hydrodynamic sorting processes that affect the suspended load of the Mackenzie River with depth, and, consequently, the type of material that is transferred to delta lakes. Hilton et al. (2015) show that Mackenzie River surface suspended material is relatively old, fine (high Al/Si) and degraded (high N/C) whereas suspended material close to the river bed is relatively young, coarse (low Al/Si) and fresh (low N/C). Our data suggest that the delta lake sediments are biased toward the surface suspended load as seen in Figure 6B where lake LD-1 sediments show some of the most 14C-depleted samples with relatively high N/C ratios. The hydrological characteristics of the spring flood in a given year will generate variability in flow height, leading to a variability in the amount of surface SPM that can be transferred to the lakes. This will cause variability in the type of POC supplied to lakes as illustrated clearly in Figures 10D–F showing (i) youngest lake sediment OC in years with high peak discharge and high river water level (abundant, high flooding), as well as (ii) older lake sediment OC for years with low peak discharge and low river water level (gentle, low flooding). Even though the delta lakes are most likely only receiving the top few meters of the Mackenzie River suspended sediment load, we still observe hydrodynamic sorting effects in the lake sediments reflecting the flood characteristics.
Evaluating the Use of Lake Sediments to Reconstruct Fluvial SPM Input
In order to evaluate whether the sedimentary records from lakes in the Mackenzie River delta can be used to reconstruct past riverine SPM sources and dynamics it is essential to compare the properties of riverine POC during the spring freshet, when high water levels in the delta cause low-closure lakes to be flooded with river water and sediments (Marsh et al., 1999), to those of the lake sediments themselves. Lake LD-1 is a representative lake for studying riverine sediment and OC deposition as it is a flow-through lake located near the Mackenzie River main channel. This lake has been accumulating laminae of fluvial input for nearly 200 years, which has been demonstrated to be on an annual scale at least since the 1960s (Table S1).
Comparison of the Mackenzie river SPM samples (Hilton et al., 2015; and this study) to the Lake LD-1 sediments reveals that the lake sediments reflect the surface suspended matter load (Figure 6B). The organic geochemical properties of riverine suspended sediments at the freshet are similar to lake sediment properties, with particularly close correspondence to the riverine sediments collected during rising water. For example, C/N ratios of the lake sediments overlap with those from the first half of the sampling period (Figure 5B), and the δ13C signatures of lake sediment bulk OC are similar to those of the most 13C-enriched POC sample at Inuvik (collected during rising water) and the single sample from Tsiigehtchic (Figure 5C). Bulk OC radiocarbon signatures and plant wax biomarker concentrations showed the greatest deviations from suspended POC, with lake sediments being significantly more 14C-depleted (“older”) than suspended sediments (Figure 5D) and having considerably lower plant wax lipid concentrations (Figure 9B).
As OC in lake sediments is up to a few thousand years older than POC, one explanation is that aged mineral-associated OC is preferentially deposited in the lakes. This could involve ancient kerogen (14C-dead) intimately associated with (relatively dense) mineral particles derived from sedimentary rocks or coal-deposits (Cameron and Beaton, 2000). Another likely source, however, could be pre-aged soil-derived OC that is likely also closely associated with minerals. In contrast, much of the younger, plant- and potentially algal-derived OC could be free of minerals or associated in less dense aggregates or associations. At the same time, preferential degradation of the younger, more labile POC could play a role in explaining the age difference between lake sediment and POC. Furthermore, sorting of different size or density particles could also explain the discrepancy in plant wax lipid concentrations between suspended sediments and lake sediments (Figure 9B). Prahl et al. (1994) suggested that wax lipids are bound to a relatively fine sediment fraction, in contrast with, e.g., lignin. Feng et al. (2013b) inferred different mobilization pathways for lignin and plant waxes in Siberian river watersheds, with the latter inferred to exhibit stronger mineral associations. Relative to the bulk sediment, fine-grained sediments enriched in lipids would be likely to remain in suspension and be carried through the delta to the ocean. Drenzek et al. (2007) extracted and analyzed fatty acids from shelf sediments offshore of the Mackenzie River mouth and found concentrations that were much higher than we observed in either the suspended or the lake sediments, with values for ΣC24−30 even homologs ranging from 230 to 600 μg/g OC (Figure 9B). These differences suggest that higher plant wax lipids could be associated with fine sediments that are preferentially transported through the delta to be deposited on the Mackenzie shelf, and likely farther offshore in the Beaufort Sea. In contrast, lignin concentrations are similar or slightly lower on the continental shelf (Goñi et al., 2000), suggesting that lignin-containing particles are not as prone to selective sedimentation processes. Nevertheless, lipid distribution patterns are similar in the suspended sediments, lake and shelf sediments, except for a slight shift to longer chain lengths in the lake and shelf sediments.
Lignin concentrations and intrinsic properties in lake and SPM sediments are also generally similar (Figures 8A,B; Figure S3), except from the C/V ratios. The latter are higher for most lake sediments than for the 2008 suspended sediments, indicating that the lake records greater amounts of non-woody angiosperm tissue (Figure 7A). In fact, the lake sediments cluster in between the freshet and summer suspended sediments in Figure 7A. Grain size-associated shifts in S/V and C/V ratios (e.g., more non-woody tissue with smaller grain size; Goñi et al., 1997; Keil et al., 1998) could, however, also play a role here. Alternatively, it may be due to a long interval of connection of the lake to the main channel that allows organic material derived from a broader period of the freshet to be deposited in the lake. For all other lignin parameters, including the acid-to-aldehyde ratio, the lake and riverine suspended sediments are virtually indistinguishable.
Overall, the potential of sediments in Mackenzie River deltaic lakes to yield high-resolution records of drainage basin processes appears promising. Many of these lakes display regular, thick, annual laminations, aiding in the development of detailed chronologies (Graf Pannatier, 1997). The organic geochemical properties of the lake sediments closely resemble those of the upper few meters of surface suspended sediments collected at peak flow from Inuvik and Tsiigehtchic, suggesting that the chemical signatures of the finer, surface suspended sediments are faithfully preserved in these sedimentary deposits. Differences in the fatty acid concentration, lignin composition and radiocarbon content, show that discrepancies do exist, however these may either reflect differences between sampling interval (suspended sediments at freshet vs. annually integrated signals) or processes that do not interfere with reconstruction of past behavior of the river system. For example, preferential settling of 14C-dead kerogen OC would have no influence on biomolecular OC signals emanating from terrestrial vegetation and soils (e.g., plant waxes, lignin). Similarly, preferential settling of coarser/denser sediments should have little impact on leaf wax lipid signals that are associated with finer-grained components of the riverine suspended sediments.
Summary and Conclusions
The Mackenzie delta lakes are characterized by different sediment depositional regimes that are reflected in the properties of the lake sediments (dominant facies, presence and thickness of laminae, sub-laminae, organic-rich layers). Our data show that the sediment depositional regimes of Mackenzie delta lakes can shift on relatively short timescales (decades, centuries) causing lakes to dry up and be reactivated depending on, e.g., a change in a river channel course or changing flood stages.
Bulk geochemical composition of both lake and SPM sediments suggest a mixture of modern higher-plant derived OC with pre-aged terrestrial (permafrost) OC and rock-derived “petrogenic” OC. Freshet suspended sediments occasionally contain considerable proportions of undegraded and/or partially degraded plant-derived tissue originating from woody debris. The age of lake sediment OC is older than freshet SPM which we explain by preferential deposition (or preservation) of aged mineral-associated OC in lakes which has shown to be preferentially enriched in surface waters of the Mackenzie River. Comparison with river depth profiles (Hilton et al., 2015) also shows that delta lake sediments reflect the upper few meters of the Mackenzie river suspended sediment load. Hydrodynamic sorting processes initiated by spring flood characteristics affect the geochemical composition of lake sediments. Whereas lipid properties are similar between lake and SPM sediments, concentrations are higher in the latter, likely due to binding of lipids to the finer sediment fraction.
Lake sediments of the Mackenzie Delta hold records of deposited POC stretching back decades, centuries, and possibly millennia, offering the possibility of examining how this major river system has behaved in the past and is changing in the present. Interpreting the signals embedded in these deltaic lake sediments in terms of drainage basin properties and riverine POC concentrations over time will require careful evaluation. Investigation of a range of high-, low- and no-closure lakes from the upper, middle and lower delta, as well as utilization of a range of proxies will provide additional valuable information on provenance and characteristics of sedimentary signatures. Clearly, however, these deltaic lake sediment records hold great promise for addressing many important questions, including whether there is a historical precedent for recent and on-going changes in the Arctic.
Author Contributions
AD, ZH, BK, DM, SZ, and LG performed the fieldwork. JV, AD, SZ, LG performed laboratory analysis. Graphics and tables were made by SZ, AD, and JV. TE, AD, and LG designed the work. VG and RH helped with interpretation of the data. JV, SZ, and AD wrote the manuscript with the help of all co-authors.
Conflict of Interest Statement
The authors declare that the research was conducted in the absence of any commercial or financial relationships that could be construed as a potential conflict of interest.
Acknowledgments
The authors thank William Hurst, Tommy Smith, Dennis Felix, the Aurora Research Institute, the Inuvialuit Land Administration and the Gwich'in Renewable Resource Board as all assisted with sampling the lake sediments. We also thank Les Kutney and Kate Irvin who assisted with sampling the spring freshet, and Sarah Brody, David Griffith, Marshall Moore, Skye Moret, Michaelene Nelson, Camilo Ponton, and Rebecca Sorrell, who all were of great help with the sediment core sampling and methodology. The authors also acknowledge Carl Johnson and the National Ocean Sciences Accelerator Mass Spectrometry (NOSAMS) Facility, who performed the organic elemental, stable isotopic and radiocarbon analyses. Funding was provided by the WHOI Arctic Research Initiative, a Clare Boothe Luce Faculty Fellowship, the Howard Hughes Medical Institute Summer Program at Mount Holyoke College, the Summer Student Fellowship program of WHOI, and the Mount Holyoke Chemistry Department. Furthermore, funding was provided by the US National Science Foundation as part of the Arctic Great Rivers Observatory (NSF-0732522 and NSF-1107774), as well as the Netherlands Organization for Scientific Research (Rubicon #825.10.022, and Veni #863.12.004). Additional funding for the lake coring was provided from WHOI through its Ocean and Climate Change Institute.
Supplementary Material
The Supplementary Material for this article can be found online at: https://www.frontiersin.org/article/10.3389/feart.2016.00077
References
Alin, S. R., Aalto, R., Goni, M. A., Richey, J. E., and Dietrich, W. E. (2008). Biogeochemical characterization of carbon sources in the Strickland and Fly Rivers, Papua New Guinea. J. Geophys. Res. Earth 113:F01S05. doi: 10.1029/2006jf000625
Aufdenkampe, A. K., Mayorga, E., Hedges, J. I., Llerena, C., Quay, P. D., Gudeman, J., et al. (2007). Organic matter in the Peruvian headwaters of the Amazon: compositional evolution from the Andes to the lowland Amazon mainstem. Org. Geochem. 38, 337–364. doi: 10.1016/j.orggeochem.2006.06.003
Baldock, J. A., Oades, J. M., Waters, A. G., Peng, X., Vassallo, A. M., and Wilson, M. A. (1992). Aspects of the chemical-structure of soil organic materials as revealed by solid-state C-13 NMR-spectroscopy. Biogeochemistry 16, 1–42. doi: 10.1007/BF02402261
Beltaos, S. (2012). Mackenzie Delta flow during spring breakup: uncertainties and potential improvements. Can. J. Civil Eng. 39, 579–588. doi: 10.1139/l2012-033
Bianchi, T. S., and Allison, M. A. (2009). Large-river delta-front estuaries as natural “recorders” of global environmental change. Proc. Natl. Acad. Sci. U.S.A. 106, 8085–8092. doi: 10.1073/pnas.0812878106
Bianchi, T. S., Mitra, S., and McKee, B. A. (2002). Sources of terrestrially-derived organic carbon in lower Mississippi River and Louisiana shelf sediments: implications for differential sedimentation and transport at the coastal margin. Mar. Chem. 77, 211–223. doi: 10.1016/S0304-4203(01)00088-3
Bird, B. W., Abbott, M. B., Finney, B. P., and Kutchko, B. (2009). A 2000 year varve-based climate record from the central Brooks Range, Alaska. J. Paleolimnol. 41, 25–41. doi: 10.1007/s10933-008-9262-y
Bouchez, J., Lupker, M., Gaillardet, J., France-Lanord, C., and Maurice, L. (2011). How important is it to integrate riverine suspended sediment chemical composition with depth? Clues from Amazon River depth-profiles. Geochim. Cosmochim. Acta 75, 6955–6970. doi: 10.1016/j.gca.2011.08.038
Burn, C. R., and Kokelj, S. V. (2009). The environment and permafrost of the mackenzie delta area. Permafrost Periglac. Process. 20, 83–105. doi: 10.1002/ppp.655
Cameron, A. R., and Beaton, A. P. (2000). Coal resources of Northern Canada with emphasis on Whitehorse Trough, Bonnet Plume Basin and Brackett Basin. Int. J. Coal Geol. 43, 187–210. doi: 10.1016/S0166-5162(99)00059-2
Carson, M. A., Conly, F. M., and Jasper, J. N. (1999). Riverine sediment balance of the Mackenzie Delta, Northwest Territories, Canada. Hydrol. Process. 13, 2499–2518.
Carson, M. A., Jasper, J. N., and Conly, F. M. (1998). Magnitude and sources of sediment input to the Mackenzie Delta, Northwest Territories. Arctic 1974–94. 51, 116–124. doi: 10.14430/arctic1053
Dickens, A. F., Baldock, J. A., Kenna, T. C., and Eglinton, T. I. (2011). A depositional history of particulate organic carbon in a floodplain lake from the lower Ob' River, Siberia. Geochim. Cosmochim. Acta 75, 4796–4815. doi: 10.1016/j.gca.2011.05.032
Drenzek, N. J., Hughen, K. A., Montlucon, D. B., Southon, J. R., dos Santos, G. M., Druffel, E. R. M., et al. (2009). A new look at old carbon in active margin sediments. Geology 37, 239–242. doi: 10.1130/G25351A.1
Drenzek, N. J., Montlucon, D. B., Yunker, M. B., Macdonald, R. W., and Eglinton, T. I. (2007). Constraints on the origin of sedimentary organic carbon in the Beaufort Sea from coupled molecular 13C and 14C measurements. Mar. Chem. 103, 146–162. doi: 10.1016/j.marchem.2006.06.017
Eglinton, G., and Hamilton, R. J. (1967). Leaf epicuticular waxes. Science 156, 1322–1335. doi: 10.1126/science.156.3780.1322
Eglinton, T. I., and Eglinton, G. (2008). Molecular proxies for paleoclimatology. Earth Planet. Sci. Lett. 275, 1–16. doi: 10.1016/j.epsl.2008.07.012
Ehleringer, J. R., Buchmann, N., and Flanagan, L. B. (2000). Carbon isotope ratios in belowground carbon cycle processes. Ecol. Appl. 10, 412–422. doi: 10.1890/1051-0761(2000)010[0412:CIRIBC]2.0.CO;2
Emmerton, C. A., Lesack, L. F. W., and Marsh, P. (2007). Lake abundance, potential water storage, and habitat distribution in the Mackenzie River Delta, western Canadian Arctic. Water Resour. Res. 43:W05419. doi: 10.1029/2006WR005139
Emmerton, C. A., Lesack, L. F. W., and Vincent, W. F. (2008a). Mackenzie River nutrient delivery to the Arctic Ocean and effects of the Mackenzie Delta during open water conditions. Glob. Biogeochem. Cycles 22:GB1024. doi: 10.1029/2006GB002856
Emmerton, C. A., Lesack, L. F. W., and Vincent, W. F. (2008b). Nutrient and organic matter patterns across the Mackenzie River, estuary and shelf during the seasonal recession of sea-ice. J. Mar. Syst. 74, 741–755. doi: 10.1016/j.jmarsys.2007.10.001
Farella, N., Lucotte, M., Louchouarn, P., and Roulet, M. (2001). Deforestation modifying terrestrial organic transport in the Rio Tapajos, Brazilian Amazon. Org. Geochem. 32, 1443–1458. doi: 10.1016/S0146-6380(01)00103-6
Feng, X., Benitez-Nelson, B. C., Montluçon, D. B., Prahl, F. G., McNichol, A. P., Xu, L., et al. (2013a). C-14 and C-13 characteristics of higher plant biomarkers in Washington margin surface sediments. Geochim. Cosmochim. Acta 105, 14–30. doi: 10.1016/j.gca.2012.11.034
Feng, X., Feakins, S. J., Liu, Z., Ponton, C., Wang, R. Z., Karkabi, A., et al. (2016). Source to sink: evolution of lignin composition in the Madre de Dios River system with connection to the Amazon basin and offshore. J. Geophys. Res. Biogeosci. 121, 1316–1338. doi: 10.1002/2016JG003323
Feng, X., Vonk, J. E., van Dongen, B. E., Gustafsson, Ö., Semiletov, I. P., Dudarev, O. V., et al. (2013b). Differential mobilization of terrestrial carbon pools in Eurasian Arctic river basins. Proc. Natl. Acad. Sci. U.S.A. 110, 14168–14173. doi: 10.1073/pnas.1307031110
Francus, P., Bradley, R. S., Lewis, T., Abbott, M., Retelle, M., and Stoner, J. S. (2008). Limnological and sedimentary processes at Sawtooth Lake, Canadian High Arctic, and their influence on varve formation. J. Paleolimnol. 40, 963–985. doi: 10.1007/s10933-008-9210-x
Frey, K. E., and McClelland, J. W. (2009). Impacts of permafrost degradation on arctic river biogeochemistry. Hydrol. Process. 23, 169–182. doi: 10.1002/hyp.7196
Giosan, L., Syvitski, J., Constantinescu, S., and Day, J. (2014). Climate change: Protect the world's deltas. Nature 516, 31–33. doi: 10.1038/516031a
Goñi, M. A., and Hedges, J. I. (1992). Lignin dimers: structures, distribution, and potential geochemical applications. Geochim. Cosmochim. Acta 56, 4025–4043.
Goñi, M. A., and Montgomery, S. (2000). Alkaline CuO oxidation with a microwave digestion system: lignin analyses of geochemical samples. Anal. Chem. 72, 3116–3121. doi: 10.1021/ac991316w
Goñi, M. A., Ruttenberg, K. C., and Eglinton, T. I. (1997). Sources and contribution of terrigenous organic carbon to surface sediments in the Gulf of Mexico. Nature 389, 275–278.
Goñi, M. A., Yunker, M. B., Macdonald, R. W., and Eglinton, T. I. (2000). Distribution and sources of organic biomarkers in arctic sediments from the Mackenzie River and Beaufort Shelf. Mar. Chem. 71, 23–51. doi: 10.1016/S0304-4203(00)00037-2
Goñi, M. A., Yunker, M. B., Macdonald, R. W., and Eglinton, T. I. (2005). The supply and preservation of ancient and modem components of organic carbon in the Canadian Beaufort Shelf of the Arctic Ocean. Mar. Chem. 93, 53–73. doi: 10.1016/j.marchem.2004.08.001
Gordon, E. S., and Goñi, M. A. (2003). Sources and distribution of terrigenous organic matter delivered by the Atchafalaya River to sediments in the northern Gulf of Mexico. Geochim. Cosmochim. Acta 67, 2359–2375. doi: 10.1016/S0016-7037(02)01412-6
Goulding, H. L., Prowse, T. D., and Beltaos, S. (2009). Spatial and temporal patterns of break-up and ice-jam flooding in the Mackenzie Delta, NWT. Hydrol. Process. 23, 2654–2670. doi: 10.1002/hyp.7251
Graf Pannatier, E. (1997). Sediment Accumulation and Historical Deposition of Trace Metals and Trace Organic Compounds in the Mackenzie Delta (Northwest Territories, Canada). Ph.D. thesis, Université de Genève.
Hay, M. B., Smol, J. P., Pipke, K. J., and Lesack, L. F. W. (1997). A diatom-based paleohydrological model for the Mackenzie Delta, Northwest Territories, Canada. Arctic Alpine Res. 29, 430–444. doi: 10.2307/1551991
Hedges, J. I., Blanchette, R. A., Weliky, K., and Devol, A. H. (1988). Effects of fungal degradation on the CuO oxidation products of lignin: a controlled laboratory study. Geochim. Cosmochim. Acta 52, 2717–2726. doi: 10.1016/0016-7037(88)90040-3
Hedges, J. I., Clark, W. A., Quay, P. D., Richey, J. E., Devol, A. H., and de Santos, U. M. (1986). Compositions and fluxes of particulate organic material in the Amazon River. Limnol. Oceanogr. 31, 717–738. doi: 10.4319/lo.1986.31.4.0717
Hedges, J. I., and Ertel, J. R. (1982). Characterization of lignin by gas capillary chromatography of cupric oxide oxidation products. Anal. Chem. 54, 174–178. doi: 10.1021/ac00239a007
Hedges, J. I., and Mann, D. C. (1979a). Characterization of plant-tissues by their lignin oxidation-products. Geochim. Cosmochim. Acta 43, 1803–1807. doi: 10.1016/0016-7037(79)90028-0
Hedges, J. I., and Mann, D. C. (1979b). The lignin geochemistry of marine sediments from the southern Washington coast. Geochim. Cosmochim. Acta 43, 1809–1818. doi: 10.1016/0016-7037(79)90029-2
Hedges, J. I., Mayorga, E., Tsamakis, E., McClain, M. E., Aufdenkampe, A., Quay, P., et al. (2000). Organic matter in Bolivian tributaries to the Amazon River: a comparison to the lower mainstream. Limnol. Oceanogr. 45, 1449–1466. doi: 10.4319/lo.2000.45.7.1449
Hill, P. R., Lewis, C. P., Desmarais, S., Kauppaymuthoo, V., and Rais, H. (2001). The Mackenzie Delta: sedimentary processes and facies of a high-latitude, fine-grained delta. Sedimentology 48, 1047–1078. doi: 10.1046/j.1365-3091.2001.00408.x
Hilton, R. G., Galy, V., Gaillardet, J., Dellinger, M., Bryant, C., O'Regan, M., et al. (2015). Erosion of organic carbon in the Arctic as a geological carbon dioxide sink. Nature 524, 84–87. doi: 10.1038/nature14653
Hitchon, B., and Krouse, H. R. (1972). Hydrogeochemistry of the surface waters of the Mackenzie River drainage basin, Canada—III. Stable isotopes of oxygen, carbon and sulphur. Geochim. Cosmochim. Acta 36, 1337–1357. doi: 10.1016/0016-7037(72)90066-X
Holmes, R. M., Coe, M. T., Fiske, G. J., Gurtovaya, T., McClelland, J. W., Shiklomanov, A. I., et al. (2013). “Climate change impacts on the hydrology and biogeochemistry of arctic rivers,” in Climatic Change and Global Warming of Inland Waters: Impacts and Mitigation for Ecosystems and Societies, eds C. R. Goldman, M. Kumagai, and R. D. Robarts (New York, NY: John Wiley & Sons, Ltd).
Holmes, R. M., McClelland, J. W., Peterson, B. J., Shiklomanov, I. A., Shiklomanov, A. I., Zhulidov, A. V., et al. (2002). A circumpolar perspective on fluvial sediment flux to the Arctic Ocean. Glob. Biogeochem. Cycles 16:1098. doi: 10.1029/2001gb001849
Holmes, R. M., McClelland, J. W., Peterson, B. J., Tank, S. E., Bulygina, E., Eglinton, T. I., et al. (2012). Seasonal and annual fluxes of nutrients and organic matter from large rivers to the Arctic Ocean and surrounding seas. Estuar. Coast. 35, 369–382. doi: 10.1007/s12237-011-9386-6
Ingall, E. D., Bustin, R. M., and van Cappellen, P. (1993). Influence of water-column anoxia on the burial and preservation of carbon and phosphorus in marine shales. Geochem. Cosmochim. Acta 57, 303–316. doi: 10.1016/0016-7037(93)90433-W
IPCC (2007). “Chapter 3: observations: surface and atmospheric climate change,” in Climate Change 2007: The Physical Science Basis: Contribution of Working Group I to the Fourth Assessment Report of the Intergovernmental Panel on Climate Change, eds S. Solomon, D. Qin, M. Manning, Z. Chen, M. Marquis, K. B. Averyt, et al. (Cambridge: C.U. Press). 237–336.
Karlsson, E. S., Charkin, A., Dudarev, O., Semiletov, I., Vonk, J. E., Sanchez-Garcia, L., et al. (2011). Carbon isotopes and lipid biomarker investigation of sources, transport and degradation of terrestrial organic matter in the Buor-Khaya Bay, SE Laptev Sea. Biogeosciences 8, 1865–1879. doi: 10.5194/bg-8-1865-2011
Keil, R. G., Tsamakis, E., Giddings, J. C., and Hedges, J. I. (1998). Biochemical distributions (amino acids, neutral sugars, and lignin phenols) among size-classes of modern marine sediments. Geochim. Cosmochim. Acta 62, 1347–1364. doi: 10.1016/S0016-7037(98)00080-5
Lesack, L. F. W., and Marsh, P. (2007). Lengthening plus shortening of river-to-lake connection times in the Mackenzie River Delta respectively via two global change mechanisms along the arctic coast. Geophys. Res. Lett. 34:L23404. doi: 10.1029/2007gl031656
Lobbes, J. M., Fitznar, H. P., and Kattner, G. (2000). Biogeochemical characteristics of dissolved and particulate organic matter in Russian rivers entering the Arctic Ocean. Geochim. Cosmochim. Acta 64, 2973–2983. doi: 10.1016/S0016-7037(00)00409-9
MacKay, J. R. (1963). The Mackenzie Delta Area, N.W.T. Ottawa, ON: Geological Survey of Canada, Mines and Technical Surveys.
Marsh, P. (1990). “Permafrost and lakes in the Mackenzie Delta,” in Proceedings of the Fifth Canadian Permafrost Conference, Collection Nordicana (Québec: Université Laval), 54, 131–136.
Marsh, P., and Hey, M. (1989). The flooding hydrology of Mackenzie Delta lakes near Inuvik, N.W.T. Canada. Arctic 42, 41–49. doi: 10.14430/arctic1638
Marsh, P., Lesack, L. F. W., and Roberts, A. (1999). Lake sedimentation in the Mackenzie Delta, NWT. Hydrol. Process. 13, 2519–2536.
McGuire, A. D., Anderson, L. G., Christensen, T. R., Dallimore, S., Guo, L. D., Hayes, D. J., et al. (2009). Sensitivity of the carbon cycle in the Arctic to climate change. Ecol. Monogr. 79, 523–555. doi: 10.1890/08-2025.1
McNichol, A. P., Osborne, E. A., Gagnon, A. R., Fry, B., and Jones, G. A. (1994). TIC, TOC, DIC, DOC, PIC, POC - unique aspects in the preparation of oceanographic samples for C-14 AMS. Nucl. Instrum. Meth. B 92, 162–165. doi: 10.1016/0168-583X(94)95998-6
Meyers, P. A. (1994). Preservation of elemental and isotopic source identification of sedimentary organic matter. Chem. Geol. 114, 289–302. doi: 10.1016/0009-2541(94)90059-0
Michelutti, N., Hay, M. B., Marsh, P., Lesack, L. F. W., and Smol, J. P. (2001). Diatom changes in lake sediments from the Mackenzie Delta, N.W.T., Canada: paleohydrological applications. Arct. Antarct. Alp. Res. 33, 1–12. doi: 10.2307/1552271
Mook, W. G., and Tan, F. C. (1991). “Stable carbon isotopes in rivers and estuaries,” in Biogeochemistry of Major World Rivers, eds E. T. Degens, S. Kempe, and J. E. Richey (Chichester: John Wiley & Sons Ltd), 245–264.
Oelke, C., Zhang, T., and Serreze, M. C. (2004). Modeling evidence for recent warming of the Arctic soil thermal regime. Geophys. Res. Lett. 31:L07208. doi: 10.1029/2003gl019300
Opsahl, S., and Benner, R. (1995). Early diagenesis of vascular plant-tissues - lignin and cutin decomposition and biogeochemical implications. Geochim. Cosmochim. Acta 59, 4889–4904. doi: 10.1016/0016-7037(95)00348-7
Perren, B. B., Bradley, E. S., and Francus, P. (2003). Rapid lacustrine response to recent high Arctic warming: a diatom record from Sawtooth lake, Ellesmere Island, Nunavut, Arct. Antarct. Alp. Res. 35, 271–278. doi: 10.1657/1523-0430(2003)035[0271:RLRTRH]2.0.CO;2
Peterson, B. J., Holmes, R. M., McClelland, J. W., Vörösmarty, C. J., Lammers, R. B., Shiklomanov, A. I., et al. (2002). Increasing river discharge to the Arctic Ocean. Science 298, 2171–2173. doi: 10.1126/science.1077445
Prahl, F. G., Ertel, J. R., Goñi, M. A., Sparrow, M. A., and Eversmeyer, B. (1994). Terrestrial organic carbon contributions to sediments on the Washington Margin. Geochim. Cosmochim. Acta 58, 3035–3048.
Rachold, V., Eicken, H., Gordeev, V. V., Grigoriev, M. N., Hubberten, H.-W., Lisitzin, A. P., et al. (2004). “Modern terrigenous organic carbon input to the Arctic Ocean,” in The Organic Carbon Cycle in the Arctic Ocean, eds R. Stein and R. W. Macdonald (Berlin: Springer), 33–55.
Raymond, P. A., McClelland, J. W., Holmes, R. M., Zhulidov, A. V., Mull, K., Peterson, B. J., et al. (2007). Flux and age of dissolved organic carbon exported to the Arctic Ocean: a carbon isotopic study of the five largest arctic rivers. Glob. Biogeochem. Cycles 21:GB4011. doi: 10.1029/2007gb002934
Reimer, P. J., Baillie, M. G. L., Bard, E., Bayliss, A., Beck, J. W., Blackwell, P. G., et al. (2009). IntCal09 and Marine09 radiocarbon age calibration curves, 0-50,000 years cal BP. Radiocarbon 51, 1111–1150. doi: 10.1017/S0033822200034202
Rember, W. C., Erdman, R. W., Hoffman, M. L., Chamberlane, V. E., and Sprenke, K. F. (1993). Dating of mine waste in lacustrine sediments using cesium-137. Environ. Geol. 22, 242–245. doi: 10.1007/BF00767409
Rouse, W. R., Douglas, M. S. W., Hecky, R. E., Hershey, A. E., Kling, G. W., Lesack, L. F. W., et al. (1997). Effects of climate change on the frshwaters of Arctic and Subarctic North America. Hydrol. Process. 11, 873–902.
Schouten, S., Klein Breteler, W. C. M., Blokker, P., Schogt, N., Rijpstra, W. I. C., Grice, K., et al. (1998). Biosynthetic effects on the stable carbon isotopic compositions of algal lipids: implications for deciphering the carbon isotopic biomarker record. Geochim. Cosmochim. Acta 62, 1397–1406. doi: 10.1016/S0016-7037(98)00076-3
Schuur, E. A. G., McGuire, A. D., Schädel, C., Grosse, G., Harden, J. W., Hayes, J. D., et al. (2015). Climate change and the permafrost carbon feedback. Nature 520, 171–179. doi: 10.1038/nature14338
Serreze, M. C., Walsh, J. E., Chapin, F. S., Osterkamp, T., Dyurgerov, M., Romanovsky, V., et al. (2000). Observational evidence of recent change in the northern high-latitude environment. Clim. Change 46, 159–207. doi: 10.1023/A:1005504031923
Stuiver, M., and Reimer, P. J. (1993). Extended 14C database and revised CALIB radiocarbon calibration program. Radiocarbon 35, 215–230. doi: 10.1017/S0033822200013904
Syvitski, J., Kettner, A. J., Overeem, I., Hutton, E., Hannon, M. T., Brakenridge, R., et al. (2009). Sinking deltas due to human activities. Nat. Geosc. 2, 681–686. doi: 10.1038/ngeo629
Tank, S. E., Lesack, L. F. W., Gareis, J. A. L., Osburn, C. L., and Hessleind, R. H. (2011). Multiple tracers demonstrate distinct sources of dissolved organic matter to lakes of the Mackenzie Delta, western Canadian Arctic. Limnol. Oceanogr. 56, 1297–1309. doi: 10.4319/lo.2011.56.4.1297
Tank, S. E., Striegl, R. G., McClelland, J. W., and Kokelj, S. V. (2016). Multi-decadal increases in dissolved organic carbon and alkalinity flux from the Mackenzie drainage basin to the Arctic Ocean. Environ. Res. Lett. 11:054015. doi: 10.1088/1748-9326/11/5/054015
Vonk, J. E., Giosan, L., Blusztajn, J., Montlucon, D., Graf Pannatier, E., McIntyre, C., et al. (2015). Spatial variations in geochemical characteristics of the modern Mackenzie delta sedimentary system. Geochim. Cosmochim. Acta 171, 100–120. doi: 10.1016/j.gca.2015.08.005
Vonk, J. E., and Gustafsson, Ö. (2013). Permafrost-carbon complexities. Nat. Geosci. 6, 675–676. doi: 10.1038/ngeo1937
Vonk, J. E., Sanchez-Garcia, L., Semiletov, I., Dudarev, O., Eglinton, T., Andersson, A., et al. (2010). Molecular and radiocarbon constraints on sources and degradation of terrestrial organic carbon along the Kolyma paleoriver transect, East Siberian Sea. Biogeosciences 7, 3153–3166. doi: 10.5194/bg-7-3153-2010
Whiteside, J. H., Olsen, P. E., Eglinton, T., Brookfield, M. E., and Sambrotto, R. N. (2010). Compound-specific carbon isotopes from Earth's largest flood basalt eruptions directly linked to the end-Triassic mass extinction. Proc. Natl. Acad. Sci. U.S.A. 107, 6721–6725. doi: 10.1073/pnas.1001706107
Williams, C. J., and Yavitt, J. B. (2003). Botanical composition of peat and degree of peat decomposition in three temperate peatlands. Ecoscience 10, 85–95. doi: 10.1080/11956860.2003.11682755
Williams, C. J., Yavitt, J. B., Wieder, R. K., and Cleavitt, N. L. (1998). Cupric oxide oxidation products of northern peat and peat-forming plants. Can. J. Bot. 76, 51–62. doi: 10.1139/b97-150
Winterfeld, M., Goni, M. A., Just, J., Hefter, J., and Mollenhauer, G. (2015). Characterization of particulate organic matter in the Lena River delta and adjacent nearshore zone, NE Siberia - Part 2: lignin-derived phenol compositions. Biogeosciences 12, 2261–2283. doi: 10.5194/bg-12-2261-2015
Wolfe, B. B., Hall, R. I., Last, W. M., Edwards, T. W. D., English, M. C., Karst-Riddoch, T. L., et al. (2006). Reconstruction of multi-century flood histories from oxbow lake sediments, Peace-Athabasca Delta, Canada. Hydrol. Process. 20, 4131–4153. doi: 10.1002/hyp.6423
Woo, M.-K., and Thorne, R. (2003). Streamflow in the Mackenzie Basin, Canada. Arctic 56, 328–340. doi: 10.14430/arctic630
Yunker, M. B., Backus, S. M., Graf Pannatier, E., Jeffries, D. S., and Macdonald, R. W. (2002). Sources and significance of alkane and PAH hydrocarbons in Canadian arctic rivers. Estuar. Coast. Shelf Sci. 55, 1–31. doi: 10.1006/ecss.2001.0880
Yunker, M. B., Macdonald, R. W., Fowler, B. R., Cretney, W. J., Dallimore, S. R., and McLaughlin, F. A. (1991). Geochemistry and fluxes of hydrocarbons to the Beaufort Sea shelf: a multivariate comparison of fluvial inputs and coastal erosion of peat using principle components analysis. Geochim. Cosmochim. Acta 55, 255–273. doi: 10.1016/0016-7037(91)90416-3
Keywords: lignin, biomarkers, Mackenzie River, carbon isotopes, lake sediments
Citation: Vonk JE, Dickens AF, Giosan L, Hussain ZA, Kim B, Zipper SC, Holmes RM, Montlucon DB, Galy V and Eglinton TI (2016) Arctic Deltaic Lake Sediments As Recorders of Fluvial Organic Matter Deposition. Front. Earth Sci. 4:77. doi: 10.3389/feart.2016.00077
Received: 23 May 2016; Accepted: 02 August 2016;
Published: 17 August 2016.
Edited by:
Moritz Felix Lehmann, University of Basel, SwitzerlandCopyright © 2016 Vonk, Dickens, Giosan, Hussain, Kim, Zipper, Holmes, Montlucon, Galy and Eglinton. This is an open-access article distributed under the terms of the Creative Commons Attribution License (CC BY). The use, distribution or reproduction in other forums is permitted, provided the original author(s) or licensor are credited and that the original publication in this journal is cited, in accordance with accepted academic practice. No use, distribution or reproduction is permitted which does not comply with these terms.
*Correspondence: Jorien E. Vonk, j.e.vonk@vu.nl