Pyrogenic Carbon in Soils: A Literature-Based Inventory and a Global Estimation of Its Content in Soil Organic Carbon and Stocks
 Moritz Reisser
 Ross S. Purves
 Michael W. I. Schmidt
 Samuel Abiven
- Department of Geography, University of Zurich, Zurich, Switzerland
Pyrogenic carbon (PyC) is considered one of the most stable components in soil and can represent more than 30% of total soil organic carbon (SOC). However, few estimates of global PyC stock or distribution exist and thus PyC is not included in any global carbon cycle models, despite its potential major relevance for the soil pool. To obtain a global picture, we reviewed the literature for published PyC content in SOC data. We generated the first PyC database including more than 560 measurements from 55 studies. Despite limitations due to heterogeneous distribution of the studied locations and gaps in the database, we were able to produce a worldwide PyC inventory. We found that global PyC represent on average 13.7% of the SOC and can be even up to 60%, making it one of the largest groups of identifiable compounds in soil, together with polysaccharides. We observed a consistent range of PyC content in SOC, despite the diverse methods of quantification. We tested the PyC content against different environmental explanatory variables: fire and land use (fire characteristics, land use, net primary productivity), climate (temperature, precipitation, climatic zones, altitude), and pedogenic properties (clay content, pH, SOC content). Surprisingly, soil properties explain PyC content the most. Soils with clay content higher than 50% contain significantly more PyC (>30% of the SOC) than with clay content lower than 5% (<6% of the SOC). Alkaline soils contain at least 50% more PyC than acidic soils. Furthermore, climatic conditions, represented by climatic zone or mean temperature or precipitation, correlate significantly with the PyC content. By contrast, fire characteristics could only explain PyC content, if site-specific information was available. Datasets derived from remote sensing did not explain the PyC content. To show the potential of this database, we used it in combination with other global datasets to create a global worldwide PyC content and a stock estimation, which resulted in around 200 Pg PyC for the uppermost 2 m. These modeled estimates indicated a clear mismatch between the location of the current PyC studies and the geographical zones where we expect high PyC stocks.
Introduction
Fires affect about 4.64 million km2 of biomass per year, corresponding to about 4% of the earth's vegetated surface (Randerson et al., 2012). A major part of the carbon involved in these vegetation fires is emitted as CO2 into the atmosphere, yet recent studies suggest up to 15% of fire affected biomass (Santín et al., 2015) is converted into pyrogenic organic carbon (PyC; also known as fire-derived organic matter, charcoal or black carbon, Hammes and Abiven, 2013). This PyC has particular features: high relative carbon content, high chemical aromaticity, a comparably long mean residence time in the soil ranging from decades to millennia (Singh et al., 2012) and, under certain circumstances, it may have a variety of positive effects on soil properties e.g., increasing pH, water retention capacity, or nutrient availability and the retention of pollutants (Biederman and Harpole, 2013; Crane-Droesch et al., 2013). Due to these positive effects, PyC has been intentionally produced and deployed as a soil amendment, better known as biochar.
PyC is found ubiquitously in the environment (Preston and Schmidt, 2006) and soils play a key role in the PyC cycle since PyC is first deposited at the soil surface. From there, it may either physically erode, get transported by wind or water and leave the soil system or fragment into smaller pieces (Pignatello et al., 2015) and move down the soil profile where it can age, react and alter chemically and physically before being transferred to other potential pools including rivers, oceans, or sediments (Bird et al., 2015; Santín et al., 2016).
PyC content in the SOC has been approximated to represent between 0 and 35% of the total soil organic carbon (SOC; Forbes et al., 2006), but up to now, there have been few attempts to estimate complete global PyC stocks in soil. Bird et al. (2015) calculated a pool of 54–109 Pg of PyC in soil (0–100 cm depth), based on a series of assumptions regarding the PyC content in the total SOC depending on ecosystem. Santín et al. (2016) calculated a pool of 71–212 Pg of C, based on the assumption that PyC represents 5–15% of the SOC, multiplied by global SOC stocks. In both cases, the calculated amount of PyC is very sensitive to the percentage of PyC to SOC. This proportion is however unknown, and may vary as a function of not only ecosystem type (Bird et al., 2015), but also soil properties, fire characteristics, type of biomass, or climatic conditions. To date PyC distribution across ecosystems or types of soil remains unknown and furthermore we have limited knowledge as to the main parameters controlling the content of PyC in SOC.
Nonetheless, it is possible to distinguish three main groups of parameters likely to influence the PyC content in a given soil: (i) fire and land use: the inputs to the soil, which may vary, based on the amount and type of burning biomass, or the frequency, return interval and intensity of fires—this might further depend on the climatic zones and available feedstock but also on the land use; (ii) climatic: the climatic conditions, such as average temperature and moisture, which may influence decomposition or preservation patterns of PyC; (iii) pedogenic: the inherent physical and chemical soil parameters, including clay content and pH, play a role on the decomposition and the stabilization processes of PyC as well as the topography, which has impact on erosion rates or accumulation of PyC.
In this study, we reviewed the literature reporting content of PyC in SOC and analyzed these values as functions of these three drivers (fire and land use, climatic, and pedogenic). Our aims were: (1) to calculate the PyC stocks in soils based on published data, (2) to investigate which of the three main drivers has the largest influence on the PyC content in SOC, and (3) to show a possible application of our database, by using it in combination with other global datasets to create a global estimation of PyC contents and stocks.
Materials and Methods
Data Collection
The database was extracted from articles selected using the keywords “black carbon,” “charcoal,” “pyrogenic organic matter,” “fire-derived carbon” associated to “soil” in Google scholar and Web of Science (last search June 2015). Since our focus was on natural fire-derived organic matter, we excluded obvious cases where PyOM was added as a soil amendment (e.g., biochar) or was found as archaeological residue (e.g., hearths). We also discarded datasets where the sampling procedure was not described, the raw data not given or PyC only qualitatively described but not quantitatively. Using these criteria, we were able to collect 569 individual values, from 55 articles.
Values of PyC were reported as PyC mass % of the total SOC. When the stocks were reported, we calculated the concentration from the SOC and bulk density data. We chose to report the PyC content in SOC instead of stocks, because only 31% of the studies we collected reported PyC stock data or the bulk density values, which would be needed for stock estimations (Table 1).
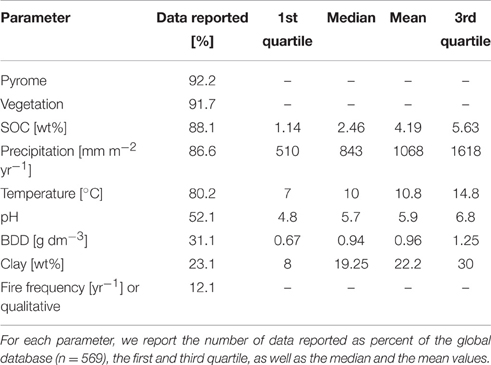
Table 1. Literature extracted database description.
In addition to the PyC content, we collected information corresponding to the three main drivers (fire and land use, climatic, and pedogenic). These drivers-related data were extracted directly from the articles or, if not reported, derived from other sources. Table 2 summarizes datasets, references, and assumptions used to complete the database.
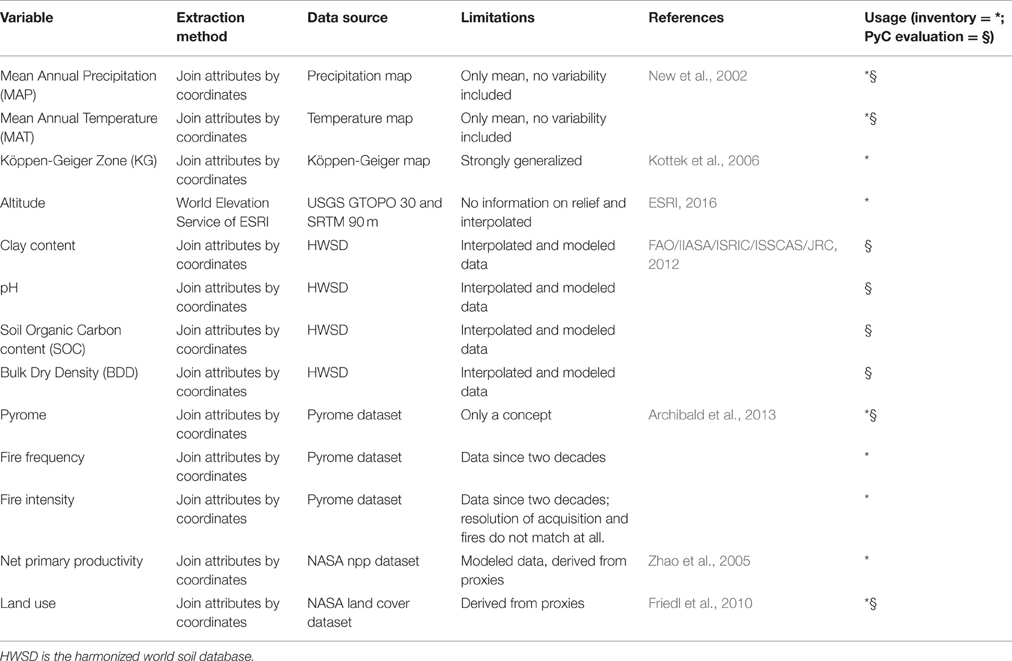
Table 2. Datasets used to fill missing values or add additional investigated variables.
We included the altitude using the World Elevation Service of ESRI© (ESRI, 2016), which is derived from the GMTED2010 data set (Danielson and Gesch, 2011). Remote sensing data were used to associate Köppen-Geiger climate zone (KG; Rubel and Kottek, 2010), net primary productivity (from the NASA NPP dataset) and the fire regime, based on the concept of pyromes, as proposed by Archibald et al. (2013), including also the raw fire return interval (FRI) and fire-frequency data to our dataset. According to this pyrome concept, the terrestrial ecosystems are divided into five different zones characterized by fire intensity and return interval: frequent intense large (FIL), frequent cool small (FCS), rare intense large (RIL), rare cool small (RCS), and intermediate cool small (ICS). Frequent occurrence corresponds to annual fires, while rare occurrence corresponds to a return period of more than 50 years. The intensity is based on the fire radiative power. Small fires correspond to areas smaller than 25 km2, while large fires correspond to areas larger than 100 km2. When existing in the article, we also added the on-site fire frequency, but fire history was not consistently reported in the literature. In some cases, only qualitative information was given (e.g., “high” or “low”). All data were transformed to these nominal categories as follow: less than every 10 years = high; 10–100 years = medium; less fires than every 1000 years = low.
We also included the land use (forest, grassland, agriculture, peatland, urban, shrubland) from the NASA MODIS land cover product, the mean annual precipitation (MAP) and mean annual air temperature (MAT), soil type, bulk density, sampling depth, SOC the clay content, and soil pH. All these parameters were extracted directly from the articles, or from reference datasets (Table 2).
Soil depth was distinguished into top- and subsoil, where topsoil was defined as the uppermost 10 cm and subsoil as soil horizon below this limit. There was no significant difference (95% confidence interval) between these two soil depths so the data set was analyzed considering the whole soil profile. In order to compare continuous and discrete variables, parameters were categorized into 5–7 groups according their initial distribution.
Representativeness of the Dataset
The percentage of data available in the database as well as the median, average and the quartile values for continuous data are given for each parameter in Table 1. The vegetation related parameters are well represented in the database, while soil parameters were present in <50% of the studies. Local fire history was indicated in only 12% of studies. Interpretation of patterns can be strongly limited, depending on this availability of local data.
The distribution of each parameter in the dataset was compared to its worldwide distribution extracted from a reference database [i.e., soil parameters like pH, clay content, and SOC content from the harmonized world soil database (FAO/IIASA/ISRIC/ISSCAS/JRC, 2012) and the pyromes from Archibald et al. (2013)]. The distribution histograms are present in Figures 5, 6.
Quantification of PyC
A wide variety of methods exist to quantify the PyC in soil. It has been shown in the past that these methods do not always yield the same results for a given sample (Schmidt et al., 2001; Hammes et al., 2007). In this work, we considered six major different methods:
(i) Physical method: simple visual assessment (charcoal pieces counting), generally done with the naked eye or under microscope und mostly preceded by a physical separation step (for example flotation);
(ii) Chemo-thermal oxidation method (CTO 375; Gustafsson et al., 1997, 2001): the soil sample is exposed to strong oxidants, mainly trifluoroacetic acid and HCl and heated up to 375°C in an oven. This method includes a decarbonization step, which can be conducted after (Gustafsson et al., 1997) or before (Gustafsson et al., 2001; Bucheli et al., 2004) the thermal treatment. Both versions of the methods were accepted in this work. Quantification of the PyC residual is usually done by elemental analysis.
(iii) Dichromate oxidation method: the soil is treated with K2Cr207, a very strong oxidant, which is supposed to oxidize all labile organic carbon and the residual is considered oxidation resistant elemental carbon (OREC; Bird et al., 1999). These OREC values are also quantified with an elemental analyser and are multiplied by 2.36, using the factor proposed by Knicker et al. (2008);
(iv) Benzenepolycarboxylic acid (BPCA) molecular marker method, initially developed by Glaser et al. (1998). In this method, PyC is broken down with help of HNO3 into specific BPCAs, which can be quantified with either gas or liquid chromatography (Schneider et al., 2011; Wiedemeier et al., 2013) using a standard. The conversion factor of 2.27 (Glaser et al., 1998) was used to calculate the actual PyC;
(v) UV oxidation: PyC is considered as the organic residues after a strong UV irradiation treatment. Quantification is achieved by comparison of the material before and after treatment, using solid-state 13C nuclear magnetic resonance (NMR) spectroscopy (Skjemstad et al., 1996).
(vi) NMR method: the PyC content in SOC is estimated directly from the NMR spectrum, using a mixing model (Nelson and Baldock, 2005), without any chemical or physical separation step.
Any other reported methods were grouped under the label “others.”
Statistical Analysis
All continuous variables, except MAP and MAT, were grouped into five to seven groups, in order to allow the comparison of the database with to global distributions. Grouping was done according to relevant physical thresholds for each parameter and aiming for a balanced grouping, i.e., roughly the same number of points in each group. Data were log transformed to conform them to normality. These variables were tested with a One-Way ANOVA using R statistics (R Core Team, 2015) against the PyC concentration as a percentage of SOC. We conducted Student-Newman-Keuls post-hoc tests in order to compare groups with each other (difference tested for p < 0.05). MAT and MAP were tested with Spearman's rank correlation ρ.
Case Study: Global Evaluation of the PyC Content and Stocks
In order to show the potential of our database, we created a linear model in combination with other existing global datasets for a global evaluation of PyC content in SOC and stocks. First, we filled the missing values in the dataset with values from the global datasets by joining the attributes in QGIS© (QGIS Development Team, 2015): clay, pH, and SOC with the harmonized world soil database (FAO/IIASA/ISRIC/ISSCAS/JRC, 2012), a temperature and precipitation dataset (New et al., 2002), the land cover dataset from NASA (Friedl et al., 2010), and the fire-frequency dataset of Archibald et al. (2013). Dataset description and related assumptions are compiled in Table 2.
A linear model was then fitted on this extended database using R. After simplification, the model corresponded to the Equation (1):
Where PyC is the PyC content as % of SOC, clay the % of clay in soils, pH the pH of the soil, MAP the mean annual precipitation from the database, extracted as described above, MAT the mean annual temperature from the database, extracted as described above, land use the different categories of land use in the database and ε the error term, which accounts for the variability which can't be explained by the considered variables.
Together, the variables explained 33% of the total variance in the dataset (more detailed statistics are shown in Table 3). We then applied this model to predict the PyC content in SOC at a resolution of 20 km to produce a global map. PyC stocks were calculated by multiplying the values with the bulk dry density (BDD) and SOC content. As the maximum depth of the used soil parameters was 200 cm, the model does not predict anything deeper than these 200 cm.
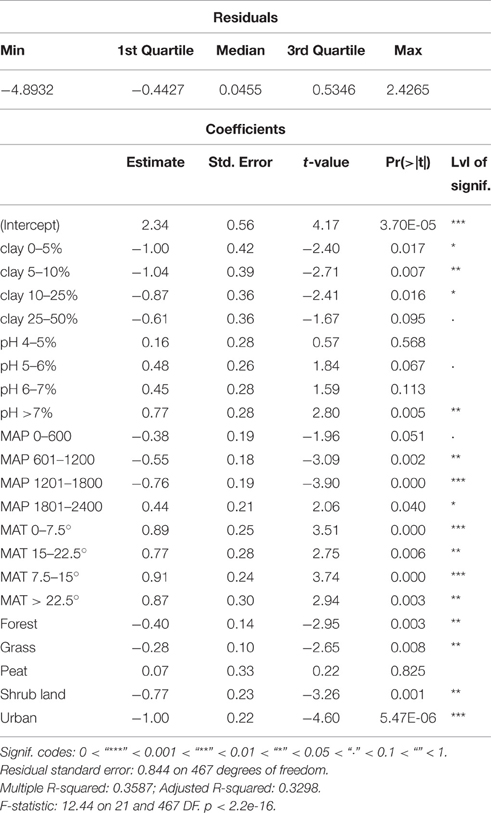
Table 3. Summary of the model statistics used for the global evaluation.
Results
PyC Content in the SOC
Figure 1 presents the PyC content distribution histogram from our literature database. Values range between 0 and 50% with one outlier above 60% (Caria et al., 2011): first quartile at 5.2%, median 12.3%, third quartile 18.6%, and the arithmetic mean at 13.7%.
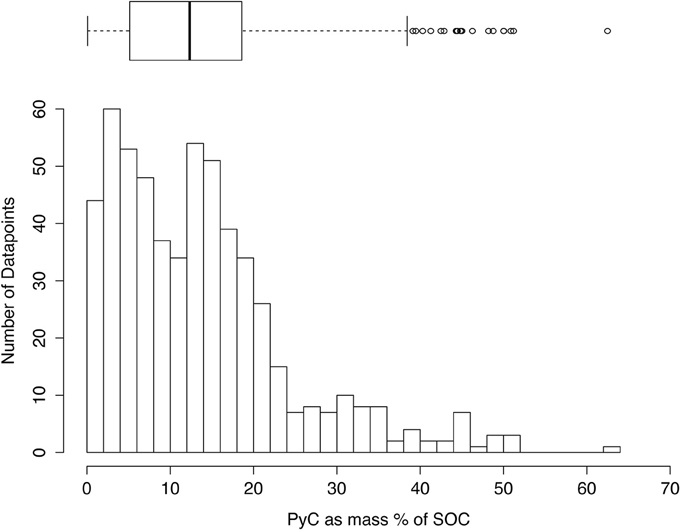
Figure 1. Frequency histogram of PyC content as mass % of the total SOC for the entire database (n = 569). Each column represents an increment of 2% of the PyC content.
Method Comparison and Data Representativeness
As described above, the diversity of quantification methods existing in the literature may induce bias in the collected data on PyC content in SOC. Figure 2 presents the PyC values according to the analytical method used to determine the PyC content in the soil samples. The K2Cr2O7 oxidation, the NMR, and the UV oxidation methods present significantly higher values (16.9, 17.6, and 17.6% in average, respectively; p < 0.001) than the BPCA (11.3%), CTO 375 (12.5%), and the physical approaches (10.1%). These differences are in line with the literature focussing on method comparisons (Hammes et al., 2007; Bird, 2014), with however, much smaller variations in than in these systematic comparison. In these previous studies, content of PyC in SOC varied by several factors of magnitude depending on the type of sample analyzed. Here the differences, observed for different samples, are on average only of few per cent. For all the methods except NMR, the range of PyC measured is large, from about 0 to more than 30% in all cases, meaning that all the methods are able to detect very low and very high levels of PyC. So, despite small variations, we consider that the choice of the quantifying method does not play a major role in the database analysis.
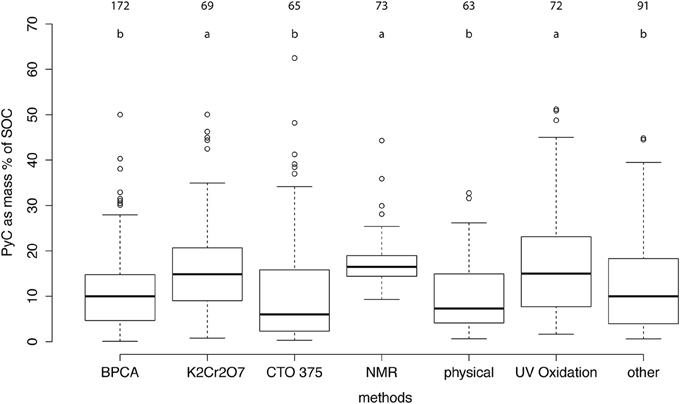
Figure 2. PyC content as mass % of the total SOC as a function of the methods used in the literature database and their respective PyC content distribution as mass % of total SOC. One-Way-ANOVA for the methods results in a p < 0.001. The different letters on the top indicate significant differences (p < 0.05 TukeyHSD test) between the methods.
Another issue concerns the spatial representativity of the database. Figure 3 presents the world wide geographical distribution of the sites from which the literature data were collected. Africa, central Russia, high latitudes, and southwest Asia are almost absent of the database, while Europe and North America are heavily represented. The PyC content does not seem to be related to large-scale spatial patterns: for example within Europe a very large range of PyC values can be observed (data not shown). This heterogeneity is a clear weakness of this database and more generally of the literature related to PyC in soils.
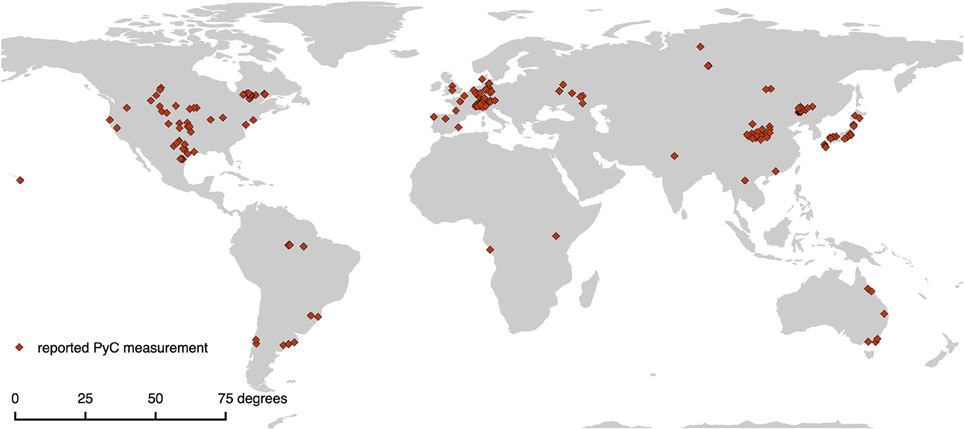
Figure 3. Spatial distribution of the PyC values which were published and taken into account in our database.
PyC Content in the SOC As a Function of Fire Characteristics
Figure 4 presents the content of PyC in SOC as a function of the fire intensity and -frequency, defined by the pyrome concept (a), the global FRI dataset (b), or the local fire frequency, for a subset of samples where this information was available (n = 64, less than 12% of the whole dataset) (c).
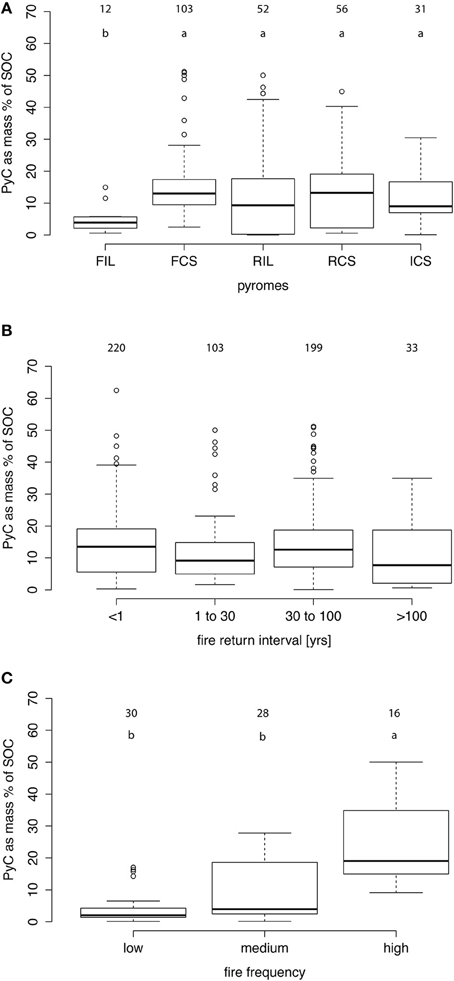
Figure 4. PyC content as mass % of the total SOC described by fire parameters: the pyromes of Archibald et al. (2013) (A); global fire return interval (B); on-site fire-frequency information (C). One-Way-ANOVA results in p < 0.001, < 0.001, and 0.19 for the pyromes, the global fire return interval, and on-site fire frequency, respectively. The different letters on the top indicate significant differences (p < 0.05) within the datasets.
Surprisingly, almost no difference was observed between pyromes. Despite clear fire characteristic differences in terms of fire return period and intensity, the resulting PyC contents in SOC were very similar between the different pyromes. The only difference was observed for the zone with frequent, large and intense fires (FIL), where lower PyC contents were observed (4.8%).
The PyC content in SOC is also not related to the global FRI. Values range from 12.1% in regions with very long FRIs to 14.3% in regions with very frequent fires. This may be due to the resolution (1 km) of the FRI dataset, which may not capture local fire properties.
When the site has a clear reported fire history, the fire frequency has a significant effect (p < 0.001%) on the PyC content (Figure 4C). Sites with high frequency contain about twice the PyC, 24.4%, compared to values of 9.2 and 4.5% respectively for medium and low fire frequencies.
PyC Content in the SOC As a Function of Land Use
The highest content of PyC in SOC was found in soils used for agriculture (16.0%; Figure 5). The corresponding samples were not only collected on sites where traditional slash and burn-like techniques are still in use, but also in Europe and North America, where this specific technique has not been widely used as an agricultural practice for at least a century (Peters and Neuenschwander, 1988; Wiedner and Glaser, 2015). The PyC content is lower in grasslands and forests than in agricultural land, with forests presenting the lowest content of PyC in SOC of all the land use types (9.7%). Grassland PyC content was slightly higher with a mean of 12.1%. Peatland and urban land uses had values of 12.3 and 10.8% respectively.
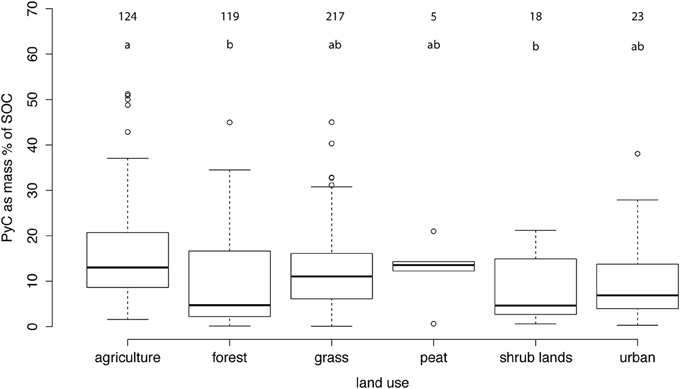
Figure 5. PyC content in % as mass of the total SOC described by different land use types. One-Way-ANOVA results in p < 0.001. The different letters on the top indicate the significant differences (p < 0.05) between the different land uses.
PyC Content in the SOC As a Function of the Climatic Conditions
Content of PyC in SOC does not follow a consistent trend when compared to the annual precipitation (Figure 6A). Dry and wet sites show similar PyC content in the SOC. Spearman's correlation coefficient was very low (ρ = −0.02). We observe a clearer trend for mean annual temperatures (Figure 6B). Colder sites (especially below 0°C) present lower PyC content than warmer sites with a maximum around 10°C, even slightly decreasing toward warmer temperatures. Here, a clear correlation could be found (ρ = 0.33; p < 0.0001). This positive temperature effect can be related to different factors: biomass productivity promoted by higher temperature, higher probability of fires starting under warmer conditions or/and higher decomposition rate of PyC in the soil in warmer climate zones, compared to colder zones.
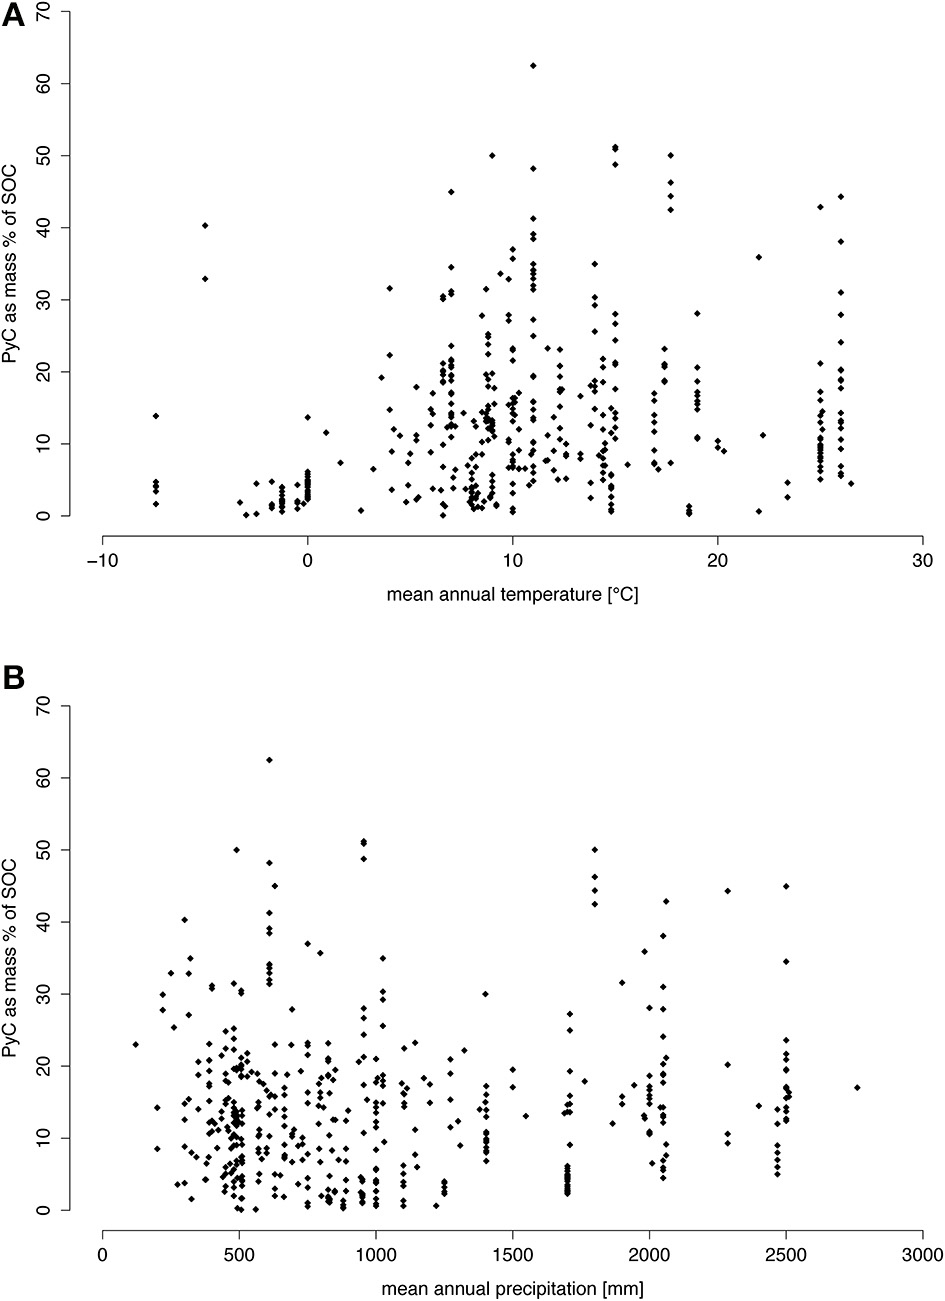
Figure 6. PyC content as mass % of the total SOC plotted against climatic variables: mean annual precipitation (A) and mean annual temperature (B). Spearman's rank correlation yielded a p-value of 0.66 and a rho of −0.02 for the precipitation and a p < 0.001 with a rho of 0.33 for the temperature.
Figure 7 shows the content of PyC in SOC as a function of the KG climate zone. The highest PyC content is found in the equatorial (16.8%) temperate (15.5%) and desertic zones (12.7%). These three systems are significantly richer in PyC (p < 0.001%) than the continental (8.9%) and the polar zones (4.4%), respectively and mirror the trends observed in the temperature data, above all for the polar sites, where low PyC content coincides with very little fire, slow decomposition and possible break down, due to freeze-thawing. The database has generally a representative distribution in the KG zones, except for the temperate zone (over-represented) and the polar zone (under-represented).
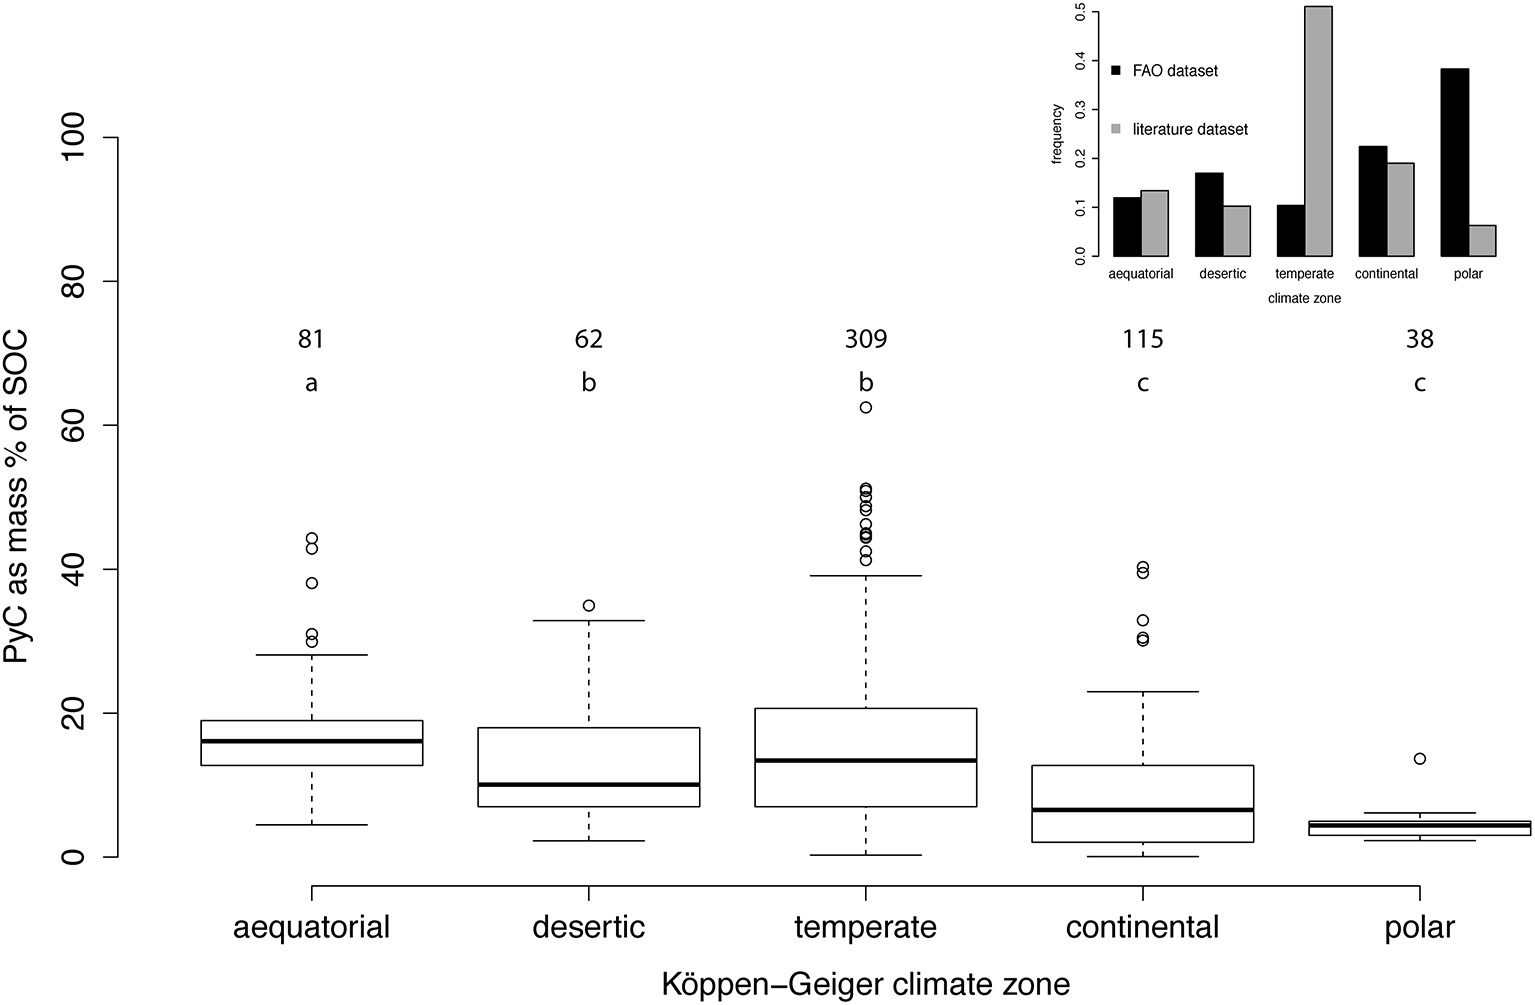
Figure 7. PyC content as mass % of the total SOC as a function of the climatic zone. Only the five KG supergroups were used. Equatorial relates to all groups starting with a A in the KG classification, desertic with a B, temperate with a C, continental with a D and polar with a E. The One-Way-ANOVA resulted in a p < 0.001. The different letters on the top indicate the significant differences (p < 0.05) between the different KG zones.
PyC Content in the SOC As a Function of the Soil Characteristics
The content of PyC in SOC seems to be more directly related to the soil properties. First, PyC content in the SOC is significantly related (p < 0.001%) to the clay content (Figure 8A). When the clay content is higher than 50%, the PyC content was on average more than twice that of lower clay contents (32.7% compared to 12–14%). When the clay content of the soil was between 0 and 5%, then the PyC content was much lower (5.7%). Our database represents relatively well the clay content distribution worldwide (as described by the harmonized world soil database), with the notable exception of an underrepresentation of low clay content soils.
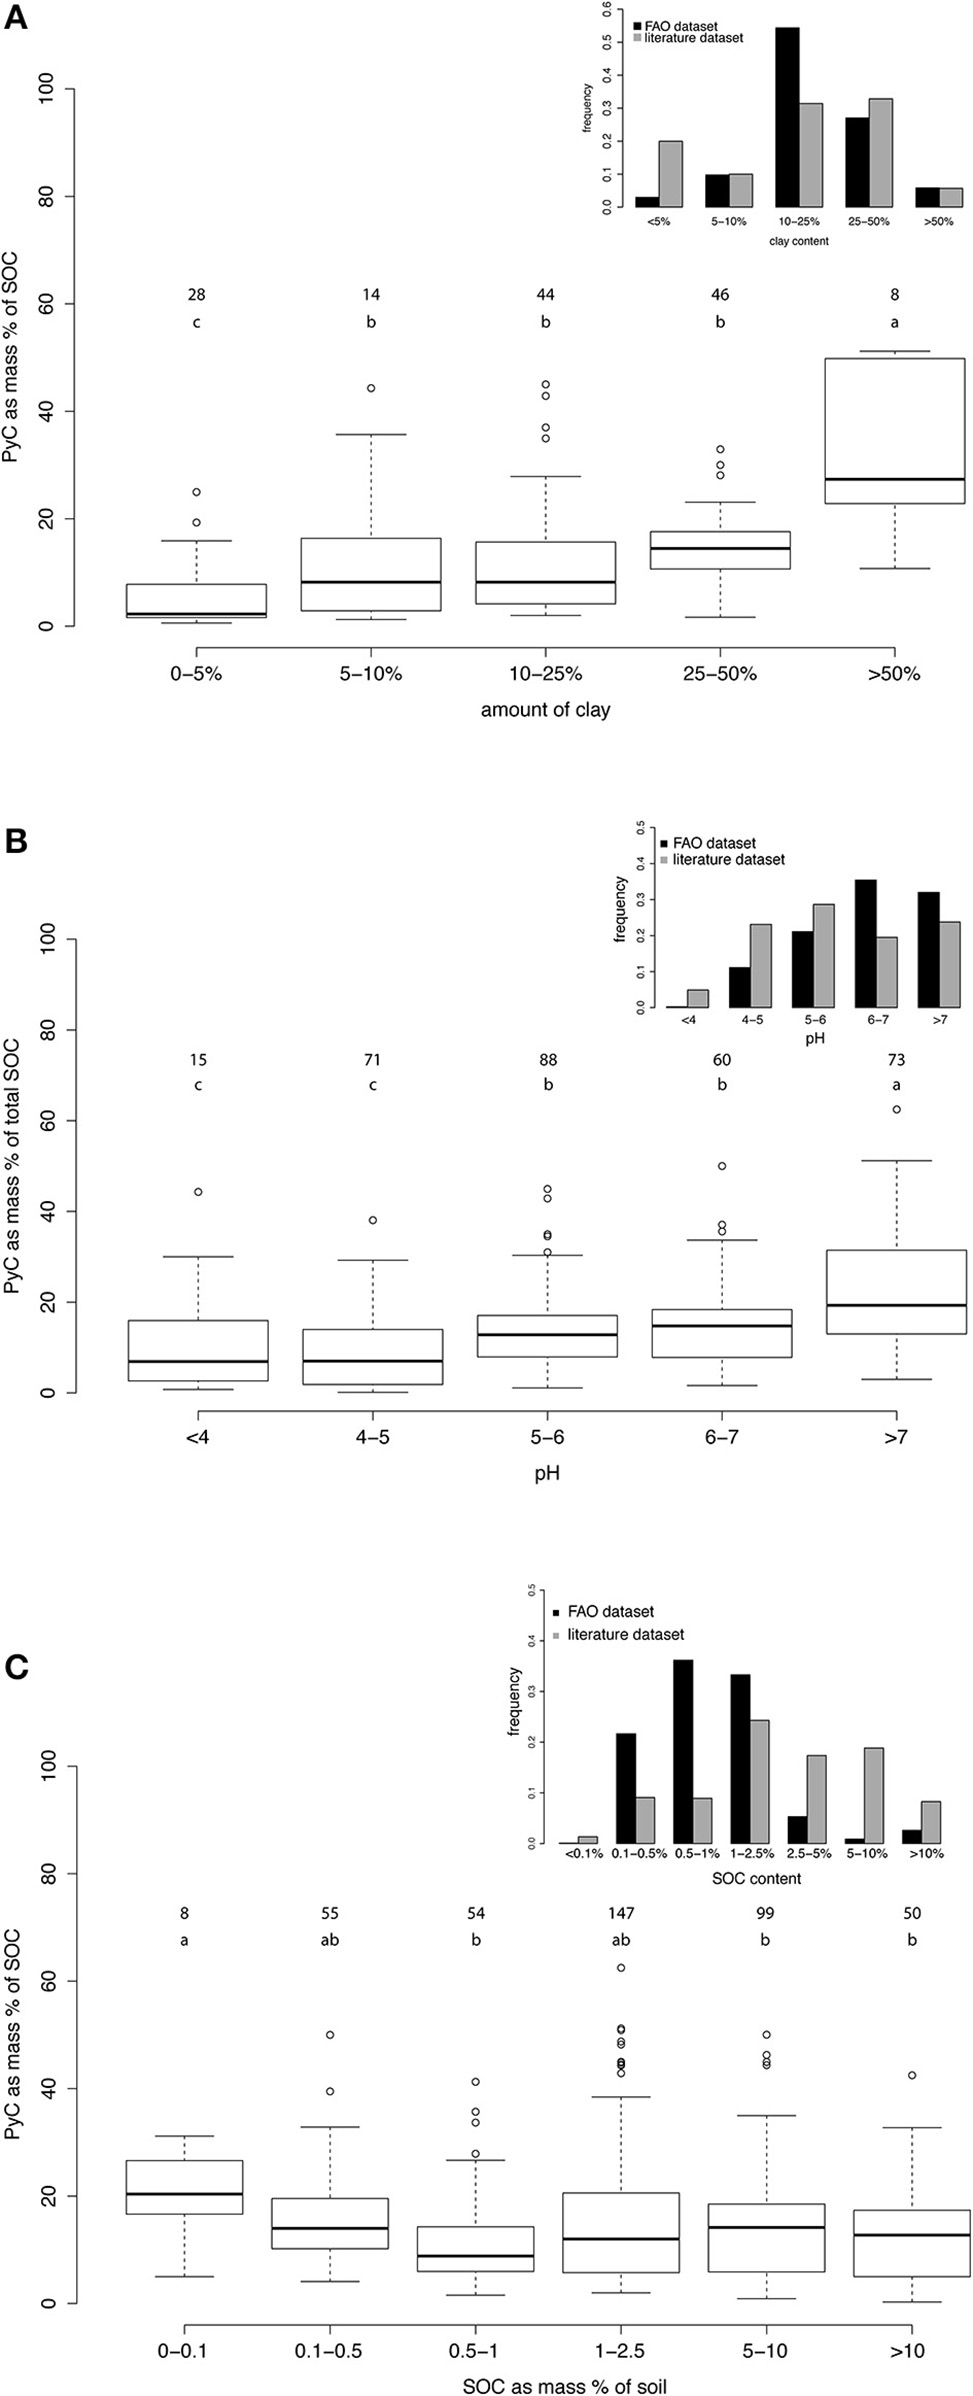
Figure 8. PyC content as mass % of the total SOC described by different soil parameters: The clay content (A); pH (B); total SOC content (C). The One-Way-ANOVA resulted in p < 0.001 for the clay content, <0.001 for the pH, and <0.01 for the SOC content. The different letters on the top indicate the significant differences (p < 0.05) within each dataset.
Soil pH also has a statistically significant (p < 0.001%) and large effect on the PyC content in SOC (Figure 8B): a pH above 7 translates into larger PyC content than between 6 and 7 (21 vs. 14.9%), and acid soils (below 5) contained much less PyC (8.6–11.7%).
The overall SOC content seems to have also an influence on its relative PyC proportion (Figure 8C). Soils with low SOC content (0–0.1% and to a lesser extent 0.1–0.5%) have a significantly (p < 0.01%) higher PyC content in its SOC than SOC-rich soils. However, the distribution of our database favors high SOC content and the number of samples with low SOC content is relatively low compared to the global distribution.
Discussion
PyC Content in the SOC
Our large collection of data is globally in line with previous estimations of the content of PyC in the SOC. We observed a mean of 13.7% of the SOC, ranging from 0 to 60%, while previous estimations ranged from 0 to 35% (Forbes et al., 2006; Bird et al., 2015; Santín et al., 2016).
Compared to other specific identified compounds in soils, PyC seems to be a major contributor to the SOC: lignin content ranges only between 0 and 6%, with an average around 1.5% of the SOC (review of 27 studies by Thevenot et al., 2010); soil lipids rarely exceed 2% of the SOC (Dinel et al., 1990); carbohydrates have a comparable distribution (5–20%; Lowe, 1978), however very few recent estimates exist for the latter two groups of compounds.
In comparison to the above mentioned compounds, fire-derived organic matter enters the soil usually only sporadically and in relative small quantities (the biomass transformation rate to PyC is estimated to be around 1–26% during a fire; Czimczik et al., 2003; Forbes et al., 2006; Eckmeier et al., 2007; Santín et al., 2015), compared to lignin which represents a continuous or seasonal input of >20% of the litter (Thevenot et al., 2010) to the SOC.
Drivers Explaining PyC Content in the SOC
Our analysis of the content of PyC in SOC drivers leads to an unexpected new picture on PyC distribution in soils. Fire characteristics as reported here do not seem to play a major role in the constitution of a PyC stock. Neither pyromes nor the FRI can explain the PyC content patterns. The only significant factor corresponds to very intense fires at a local scale, indicating, that fire impacts can be seen only very locally. Land use also gives an interesting picture: higher contents of PyC in the SOC in agricultural soils than in grassland and forests, respectively. On the other hand, the PyC content variations correlated very well with soil properties, i.e., higher clay and pH lead to high PyC%.
Soil properties clearly define conditions for stabilization of PyC. Higher clay content might lead to more organo-mineral interactions (Sørensen, 1972; Merckx et al., 1985; Hassink, 1997; Six et al., 2002) and higher pH to less decomposition of PyC in general. Archaeologists usually use the pH as a parameter to identify sites where charcoal remains may be found (Braadbaart et al., 2009), well in accordance with our observations. Fresh organic matter decomposes slower at low (5.0) and high (8.0) pH (DeLaune et al., 1981). However, soil respiration tends to be higher at high pH than at low pH (Kemmitt et al., 2006; Aciego Pietri and Brookes, 2008), indicating that alkaline conditions do not always imply a lower microbial activity. In a manipulative experiment, Braadbaart et al. (2009) observed an increase in the charcoal fragmentation in alkaline solutions, probably because of the cation (Ca2+ and K+) transfer inside the graphitic structure of the charcoal pieces. These smaller particles may be easier to stabilize on the long term, since they can bind more directly to minerals in finer fractions of the soil (Nocentini et al., 2010).
However, the three types of drivers we identified earlier cannot be exactly compared. Both spatial and temporal scales are problematic for information related to land use, fire characteristics, or even climate. These parameters may vary greatly over the time, particularly at the time scale we are considering here. Several authors reviewed the literature related to PyC turnover in soil and the estimates vary between 100 and 1000 years (Preston and Schmidt, 2006; Lehmann et al., 2008; Liang et al., 2008; Singh et al., 2012). At this time scale, information on fire frequency and intensity, land use or climate may vary greatly, while PyC in the soils remains relatively unchanged over long timescales. This all indicates, that we may see a temporal mismatch between our measured PyC and its predictors with which we try to explain it. For example, the higher content of PyC in the SOC in agricultural land might not be explained by the recent land use, but could be linked to stubble burning in the last century, or even much older agricultural practices from the Middle Ages or earlier, which may have included much more common use of fire. Another explanation might be the relative preservation of PyC due to increased SOC turnover by tillage and generally agricultural practices. Yet, one might also speculate that PyC-rich soils, being more fertile, have been turned into agricultural land more often than other lands, and thus that we would observe a feedback between PyC stocks and land-use over long time scales.
Fire frequency derived from remotely sensed satellite data cannot cover more than the last two decades, due to the availability of data (Dwyer et al., 2000; Archibald et al., 2013; Bowman et al., 2014). Furthermore, the spatial resolution of the data does most often not mirror the natural heterogeneity of fires very well. Even if only parts of a pixel burn, it is stated that this specific pixel burnt. However, one might still find places in this pixel, which were not affected by fire at all.
When the history of fire is known for a given place, the fire frequency is more relevant.
Compared to fire characteristics, land use or even climate, soil properties are relatively constant and are more integrative of the time where PyC effectively spent in the soil. It may be a reason why soil parameters appear particularly relevant for the PyC content.
Case Study: Global Evaluation of the PyC Contents in the SOC and Stocks
Observations
Modeled PyC values are slightly lower than the literature dataset (Figure 1). The mean is 8.7%, the median is 7.5% with the first quartile at 5.8% and the third quartile at 10.5%. This is unexpected, since the five parameters in the model are relatively well distributed in the initial database, so we expected modeled values closer to the literature. One consequence might be that either the model underestimates the total content of PyC in the SOC or the database rather overestimates it.
Figure 9 shows the maps for the global PyC content in total SOC and Figure 10 for the stocks. Highest PyC contents are found mostly in the large steppe regions of between around 23° and 50° north, as well as in Patagonia and in tropical rainforests. These high values could be explained for a large part by the pH and clay content of the soils, two of the five parameters of the model. Lowest concentrations are above all situated in boreal regions on the northern hemisphere.
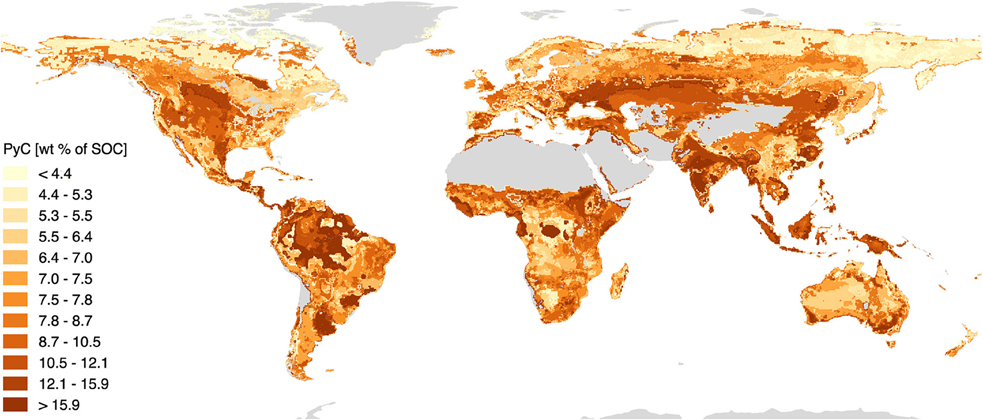
Figure 9. Global predicted PyC content as mass % of the total SOC. Explained variance by the used linear model is 33%. Variables used were clay content, pH, mean annual precipitation, mean annual temperature, and land use. Land mass is colored in gray.
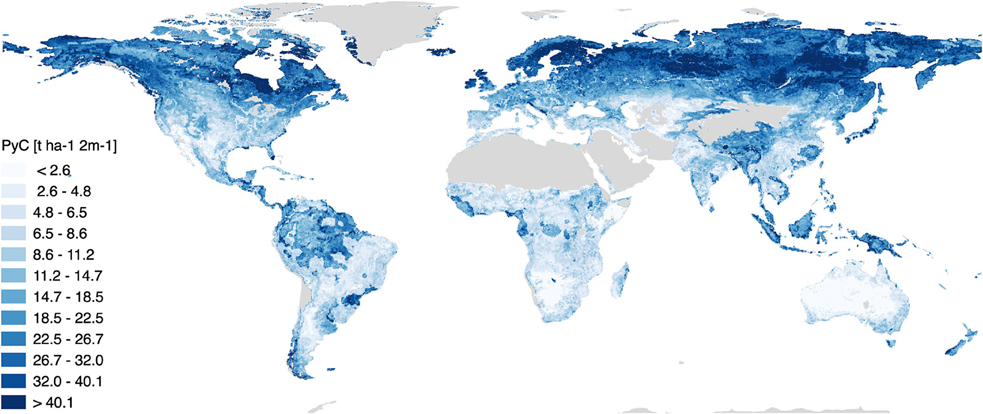
Figure 10. Global predicted PyC stocks as t ha−1 for the first 2 m soil depth. Explained variance by the used linear model is 33%. BDD and total SOC content from the global dataset were used to calculate the stocks from the PyC content in SOC data. Land mass is colored in gray.
The picture changes radically in most regions when it comes to stocks. Very high PyC stocks are found in the boreal zones. PyC contents in the SOC are low in boreal areas but SOC stocks are very important, while in some other regions PyC contents are high, for example in Australia, Africa, and the Indian sub-continent, but the SOC stocks are much lower and thus the PyC stocks are also low. In tropical regions, both the content of PyC in the SOC as well as the SOC stocks are high. Global PyC stock is estimated, based on the integration of all values to be roughly around 200 Pg.
Limitations and Perspectives
Based on a large data collection from the literature, we propose here the first global estimation of PyC content as a function of SOC in soils. Based on this estimation, we are able to identify hotspots of PyC presence. Some of these locations are not surprising, for example where chernozems or mollisols can be found. More unexpected are locations such as tropical forests, which seem to yield high contents of PyC in SOC as well. The high clay and low SOC contents would explain these patterns. It does not seem that one simple rule can explain high levels of PyC in soils, but rather a conjunction of soil properties (pH or clay, both parameters do not need to be met) and ecosystem properties (large biomass in tropical forests, frequent fires on easy fragmentable grass material in central Asia). This would also indicate that the qualitative properties related to this PyC (chemical functions, physical structure) might also vary greatly with the region. On the other hand, we can identify zones where in absolute numbers only very little PyC can be found, despite frequent fires or apparent other favorable conditions for high PyC content. This is the case for large parts of Australia, where stocks are largely limited through the small overall SOC stocks, or boreal forests. Both regions were used frequently in previous studies. As for the hotspots, it is difficult to identify a unified explanation for these low values. There is a need to selectively identify the main missing drivers at a regional scale. The example of boreal forests is particularly interesting. This ecosystem is prone to fire, and decomposition rate should be highly reduced by low temperature and high moisture content. From this point of view, it is comparable to high latitude soils. However, the literature dataset and the global evaluation indicate rather low PyC contents in the SOC, compared to other climatic zones. This can only be explained by parameters we did not take into account in our analysis, such as lateral transport in the landscape, the combustion of the PyC by successive fires (although estimated to have only small influence; Santín et al., 2013; Saiz et al., 2014; Tinkham et al., 2016) or higher degradability of PyC which is produced at lower temperature (Schneider et al., 2010; Ascough et al., 2011; McBeath et al., 2015).
Since the variation range of SOC is much larger than the PyC one (in particular, our estimation tends to reduce this range), the largest projected PyC stocks appear in zones that are not directly related to fire or PyC stabilization parameters. The largest stocks are in high latitude soils where it is probable that little PyC content is present per unit of SOC, but where large stocks of SOC are stored. Tropical forests would be the location where both content and stocks are within the highest on the planet.
Our model has also a series of limitations. First, it explains only 33% of the total variance. This rather low power can be explained by different reasons: the time and space scale mismatch between the parameters and the PyC content dynamics (see above), the location of the sampling places or the method multiplicity. There are important differences in the location of the original sites from the literature and the global evaluation of PyC by our model. Most of our data come from Europe, East Australia and Northern America, while larger contents in the SOC are expected in boreal forest and central Asian steppes and larger stocks in high latitude soils. A direct consequence of this bias is that our evaluation rather tends to underestimate the content of PyC in SOC overall. Some zones are not explored at all, including for example most of Africa, southern Asia or central Russia, locations where high PyC contents in the SOC would be expected.
The diversity of methodological approaches may also be an issue. Hammes et al. (2007) and more recently Bird (2014) showed that a large range of PyC contents could be measured on a given sample depending on the method used. In this study, we considered seven methods, surprisingly giving consistent and comparable results. If we consider that there is no potential systematic bias that would associate a method to samples with intrinsic lower or higher PyC samples, this relative comparability around the same average value rather contradicts the existing literature. One explanation would be that when studies compare different methods to detect PyC, they use mainly PyC rich material (chernozem, pure charcoals, soot samples, etc.) and so artificially increase the range of values detected. In our case, since all types of soils are included, the differences between the values produced are not that important anymore. As a conclusion, we expect the different methods to have only a minor impact on the complete picture.
Conclusion and Perspectives
Based on a large literature database, we assessed the content of PyC in SOC, investigated a variety of drivers related to PyC production and ecosystem properties to explain these contents. Then we used these in combination with several other datasets to model the distribution of PyC on a global scale. Our key achievements and findings are as follows:
• We have produced the first unified database of published PyC measurements;
• PyC represents on average around 14% of the SOC, corresponding to one of the largest identified groups of chemical compounds in soil;
• High soil pH and clay content are the most significant parameters explaining a high PyC content in the SOC;
• PyC production parameters, such as fire or land use, do not well explain PyC content patterns.
• There is a temporal mismatch between the time scales over which PyC is expected to vary and the time scales over which it (and its related variables) are observed.
• There is a spatial mismatch between the regions with expected high PyC stocks and those, which are actually studied.
• There are still many limitations to overcome, if we want to improve our global picture of PyC, for example data scarcity in remote locations, resolution and derivation of global datasets or quantification method comparability.
The database is available in the Supplementary Material and can be used for other studies. We want to encourage scientists to improve the database, expand it with other variables or find new ways of filling the gaps and missing values.
Author Contributions
MR and SA conceived the paper structure. MR collected the database. MR, SA, and RP contributed to the data analysis. MR and SA wrote the manuscript and all authors contributed to the writing of the manuscript.
Conflict of Interest Statement
The authors declare that the research was conducted in the absence of any commercial or financial relationships that could be construed as a potential conflict of interest.
Acknowledgments
We thank S. Archibald for providing the fire dataset. We also thank the reviewers for their valuable comments. This research is supported by the University of Zurich, through the URPP GCB (University Research Priority Program Global Change and Biodiversity).
Supplementary Material
The Supplementary Material for this article can be found online at: https://www.frontiersin.org/article/10.3389/feart.2016.00080
References
Aciego Pietri, J. C., and Brookes, P. C. (2008). Relationships between soil pH and microbial properties in a UK arable soil. Soil Biol. Biochem. 40, 1856–1861. doi: 10.1016/j.soilbio.2008.03.020
Archibald, S., Lehmann, C. E. R., Gómez-Dans, J. L., and Bradstock, R. A. (2013). Defining pyromes and global syndromes of fire regimes. Proc. Natl. Acad. Sci. U.S.A. 110, 6442–6447. doi: 10.1073/pnas.1211466110
Ascough, P. L., Bird, M. I., Francis, S. M., Thornton, B., Midwood, A. J., Scott, A. C., et al. (2011). Variability in oxidative degradation of charcoal: influence of production conditions and environmental exposure. Geochim. Cosmochim. Acta 75, 2361–2378. doi: 10.1016/j.gca.2011.02.002
Biederman, L. A., and Harpole, W. S. (2013). Biochar and its effects on plant productivity and nutrient cycling: a meta-analysis. GCB Bioenergy 5, 202–214. doi: 10.1111/gcbb.12037
Bird, M. (2014). “Test procedures for biochar analysis in soils,” in Biochar for Environmental Management - Science, Technology and Implementation, eds J. Lehmann and S. Joseph (London: Routledge), 677–714.
Bird, M. I., Moyo, C., Veenendaal, E. M., Lloyd, J., and Frost, P. (1999). Stability of elemental carbon in a savanna soil. Geoderma 13, 923–932. doi: 10.1029/1999gb900067
Bird, M. I., Wynn, J. G., Saiz, G., Wurster, C. M., and McBeath, A. (2015). The pyrogenic carbon cycle. Annu. Rev. Earth Planet. Sci. 43, 273–298. doi: 10.1146/annurev-earth-060614-105038
Bowman, D. M. J. S., Murphy, B. P., Williamson, G. J., and Cochrane, M. A. (2014). Pyrogeographic models, feedbacks and the future of global fire regimes. Glob. Ecol. Biogeogr. 23, 821–824. doi: 10.1111/geb.12180
Braadbaart, F., Poole, I., and van Brussel, A. A. (2009). Preservation potential of charcoal in alkaline environments: an experimental approach and implications for the archaeological record. J. Archaeol. Sci. 36, 1672–1679. doi: 10.1016/j.jas.2009.03.006
Bucheli, T. D., Blum, F., Desaules, A., and Gustafsson, O. (2004). Polycyclic aromatic hydrocarbons, black carbon, and molecular markers in soils of Switzerland. Chemosphere 56, 1061–1076. doi: 10.1016/j.chemosphere.2004.06.002
Caria, G., Arrouays, D., Dubromel, E., Jolivet, C., Ratié, C., Bernoux, M., et al. (2011). Black carbon estimation in French calcareous soils using chemo-thermal oxidation method. Soil Use Manag. 27, 333–339. doi: 10.1111/j.1475-2743.2011.00349.x
Crane-Droesch, A., Abiven, S., Jeffery, S., and Torn, M. S. (2013). Heterogeneous global crop yield response to biochar: a meta-regression analysis. Environ. Res. Lett. 8:044049. doi: 10.1088/1748-9326/8/4/044049
Czimczik, C. I., Preston, C. M., Schmidt, M. W. I., and Schulze, E.-D. (2003). How surface fire in Siberian Scots pine forests affects soil organic carbon in the forest floor: stocks, molecular structure, and conversion to black carbon (charcoal). Global Biogeochem. Cycles 17, 1–14. doi: 10.1029/2002GB001956
Danielson, J. J., and Gesch, D. B. (2011). Global Multi-Resolution Terrain Elevation Data 2010 (GMTED2010). U.S. Geological Survey Open-File Report 2011–1073, 26. Available online at: http://pubs.usgs.gov/of/2011/1073
DeLaune, R. D., Patrick, J. W. H., and Casselman, M. E. (1981). Effect of sediment pH and redox conditions on degradation of benzo(a)pyrene. Mar. Pollut. Bull. 12, 251–253. doi: 10.1016/0025-326X(81)90366-0
Dinel, H., Schnitzer, M., and Meyhuys, G. R. (1990). “Soil lipids: origin, nature, content, decomposition, and effect on soil physical properties,” in Soil Biochemistry, 6th Edn., eds J. M. Bollag and G. Stotzky (New York, NY: Marcel Dekker Inc.), 397–429.
Dwyer, E., Pinnock, S., Gregoire, J.-M., and Pereira, J. M. C. (2000). Global spatial and temporal distribution of vegetation fire as determined from satellite observations. Int. J. Remote Sens. 21, 1289–1302. doi: 10.1080/014311600210182
Eckmeier, E., Rosch, M., Ehrmann, O., Schmidt, M. W. I., Schier, W., and Gerlach, R. (2007). Conversion of biomass to charcoal and the carbon mass balance from a slash-and-burn experiment in a temperate deciduous forest. Holocene 17, 539–542. doi: 10.1177/0959683607077041
ESRI (2016). ArcGIS Online. Available online at: www.arcgis.com
FAO/IIASA/ISRIC/ISSCAS/JRC (2012). Harmonized World Soil Database (Version 1.2). Rome; Laxenburg: FAO; IIASA.
Forbes, M. S., Raison, R. J., and Skjemstad, J. O. (2006). Formation, transformation and transport of black carbon (charcoal) in terrestrial and aquatic ecosystems. Sci. Total Environ. 370, 190–206. doi: 10.1016/j.scitotenv.2006.06.007
Friedl, M. A., Sulla-Menashe, D., Tan, B., Schneider, A., Ramankutty, N., Sibley, A., et al. (2010). MODIS Collection 5 global land cover: algorithm refinements and characterization of new datasets. Remote Sens. Environ. 114, 168–182. doi: 10.1016/j.rse.2009.08.016
Glaser, B., Haumaier, L., Guggenberger, G., and Zech, W. (1998). Black carbon in soils : the use of benzenecarboxylic acids as specific markers. Org. Geochem. 29, 811–819. doi: 10.1016/S0146-6380(98)00194-6
Gustafsson, O., Bucheli, D., Kukulska, Z., Andersson, M., Largeau, C., Rouzaud, J.-N., et al. (2001). Evaluation of a protocol for the quantification of black carbon in sediments. Global Biogeochem. Cycles 15, 881–890. doi: 10.1029/2000GB001380
Gustafsson, O., Haghseta, F., Chan, C., Macfarlane, J., and Gschwend, P. M. (1997). Quantification of the dilute sedimentary soot phase: implications for PAH speciation and bioavailability. Environ. Sci. Technol. 31, 203–209. doi: 10.1021/es960317s
Hammes, K., and Abiven, S. (2013). “Identification of black carbon in the earth system,” in Fire Phenomena and the Earth System, ed C. M. Belcher (Chichester, UK: John Wiley & Sons), 157–176.
Hammes, K., Schmidt, M. W. I., Smernik, R. J., Currie, L. A., Ball, W. P., Nguyen, T. H., et al. (2007). Comparison of quantification methods to measure fire-derived (black/elemental) carbon in soils and sediments using reference materials from soil, water, sediment and the atmosphere. Global Biogeochem. Cycles 21, 1–18. doi: 10.1029/2006GB002914
Hassink, J. (1997). The capacity of soils to preserve organic C and N by their association with clay and silt particles. Plant Soil 191, 77–87. doi: 10.1023/A:1004213929699
Kemmitt, S. J., Wright, D., Goulding, K. W. T., and Jones, D. L. (2006). pH regulation of carbon and nitrogen dynamics in two agricultural soils. Soil Biol. Biochem. 38, 898–911. doi: 10.1016/j.soilbio.2005.08.006
Knicker, H., Wiesmeier, M., and Dick, D. P. (2008). A simplified method for the quantification of pyrogenic organic matter in grassland soils via chemical oxidation. Geoderma 147, 69–74. doi: 10.1016/j.geoderma.2008.07.008
Kottek, M., Grieser, J., Beck, C., Rudolf, B., and Rubel, F. (2006). World map of the Köppen-Geiger climate classification updated. Meteorol. Zeitschrift 15, 259–263. doi: 10.1127/0941-2948/2006/0130
Lehmann, J., Skjemstad, J., Sohi, S., Carter, J., Barson, M., Falloon, P., et al. (2008). Australian climate–carbon cycle feedback reduced by soil black carbon. Nat. Geosci. 1, 832–835. doi: 10.1038/ngeo358
Liang, B., Lehmann, J., Solomon, D., Sohi, S., Thies, J. E., Skjemstad, J. O., et al. (2008). Stability of biomass-derived black carbon in soils. Geochim. Cosmochim. Acta 72, 6069–6078. doi: 10.1016/j.gca.2008.09.028
Lowe, L. E. (1978). “Carbohydrates distribution in soil,” in Soil Organic Matter, eds M. Schnitzer and S. U. Khan (Amsterdam: Elsevier), 67–74.
McBeath, A. V., Wurster, C. M., and Bird, M. I. (2015). Influence of feedstock properties and pyrolysis conditions on biochar carbon stability as determined by hydrogen pyrolysis. Biomass Bioenergy 73, 155–173. doi: 10.1016/j.biombioe.2014.12.022
Merckx, R., den Hartog, A., and van Veen, J. A. (1985). Turnover of root-derived material and related microbial biomass formation in soils of different texture. Soil Biol. Biochem. 17, 565–569. doi: 10.1016/0038-0717(85)90026-4
Nelson, P. N., and Baldock, J. A. (2005). Estimating the molecular composition of a diverse range of natural organic materials from solid-state 13C NMR and elemental analyses. Biogeochemistry 72, 1–34. doi: 10.1007/s10533-004-0076-3
New, M., Lister, D., Hulme, M., and Makin, I. (2002). A high-resolution data set of surface climate over global land areas. Clim. Res. 21, 1–25. doi: 10.3354/cr021001
Nocentini, C., Certini, G., Knicker, H., Francioso, O., and Rumpel, C. (2010). Nature and reactivity of charcoal produced and added to soil during wildfire are particle-size dependent. Org. Geochem. 41, 682–689. doi: 10.1016/j.orggeochem.2010.03.010
Peters, W. J., and Neuenschwander, L. F. (1988). Slash and Burn. Farming in the Third World Forest. Moscow, ID: University of Idaho Press.
Pignatello, J. J., Uchimiya, M., Abiven, S., and Schmidt, M. W. I. (2015). “Evolution of biochar properties in soil,” in Biochar for Environmental Management - Science, Technology and Implementation, eds J. Lehmann and S. Joseph (London: Routledge), 195–233.
Preston, C. M., and Schmidt, M. W. I. (2006). Black (pyrogenic) carbon: a synthesis of current knowledge and uncertainties with special consideration of boreal regions. Biogeosciences 3, 397–420. doi: 10.5194/bg,-3-397-2006
QGIS Development Team (2015). QGIS Geographic Information System. Available online at: http://qgis.osgeo.org
Randerson, J. T., Chen, Y., van der Werf, G. R., Rogers, B. M., and Morton, D. C. (2012). Global burned area and biomass burning emissions from small fires. J. Geophys. Res. 117, G04012. doi: 10.1029/2012JG002128
R Core Team (2015). R: A Language and Environment for Statistical Computing. Available online at: https://www.r-project.org
Rubel, F., and Kottek, M. (2010). Observed and projected climate shifts 1901-2100 depicted by world maps of the Köppen-Geiger climate classification. Meteorol. Zeitschrift 19, 135–141. doi: 10.1127/0941-2948/2010/0430
Saiz, G., Goodrick, I., Wurster, C. M., Zimmermann, M., Nelson, P. N., and Bird, M. I. (2014). Charcoal re-combustion efficiency in tropical savannas. Geoderma 219–220, 40–45. doi: 10.1016/j.geoderma.2013.12.019
Santín, C., Doerr, S. H., Kane, E. S., Masiello, C. A., Ohlson, M., de la Rosa, J. M., et al. (2016). Towards a global assessment of pyrogenic carbon from vegetation fires. Glob. Chang. Biol. 22, 76–91. doi: 10.1111/gcb.12985
Santín, C., Doerr, S. H., Preston, C., and Bryant, R. (2013). Consumption of residual pyrogenic carbon by wildfire. Int. J. Wildl. Fire 22, 1072–1077. doi: 10.1071/WF12190
Santín, C., Doerr, S. H., Preston, C. M., and González-Rodríguez, G. (2015). Pyrogenic organic matter production from wildfires: a missing sink in the global carbon cycle. Glob. Chang. Biol. 21, 1621–1633. doi: 10.1111/gcb.12800
Schmidt, M. W. I., Skjemstad, J. O., Czimczik, C. I., Glaser, B., Prentice, K. M., Gelinas, Y., et al. (2001). Comparative analysis of black carbon in soils. Global Biogeochem. Cycles 15, 163–167. doi: 10.1029/2000GB001284
Schneider, M. P. W., Hilf, M., Vogt, U. F., and Schmidt, M. W. I. (2010). The benzene polycarboxylic acid (BPCA) pattern of wood pyrolyzed between 200°C and 1000°C. Org. Geochem. 41, 1082–1088. doi: 10.1016/j.orggeochem.2010.07.001
Schneider, M. P. W., Smittenberg, R. H., Dittmar, T., and Schmidt, M. W. I. (2011). Comparison of gas with liquid chromatography for the determination of benzenepolycarboxylic acids as molecular tracers of black carbon. Org. Geochem. 42, 275–282. doi: 10.1016/j.orggeochem.2011.01.003
Singh, N., Abiven, S., Torn, M. S., and Schmidt, M. W. I. (2012). Fire-derived organic carbon in soil turns over on a centennial scale. Biogeosciences 9, 2847–2857. doi: 10.5194/bg-9-2847-2012
Six, J., Conant, R. T., Paul, E. A., and Paustian, K. (2002). Stabilization mechanisms of soil organic matter: implications for C-saturatin of soils. Plant Soil 241, 155–176. doi: 10.1023/A:1016125726789
Skjemstad, J. O., Clarke, P., Taylor, J. A., Oades, J. M., and McClure, S. G. (1996). The chemistry and nature of protected carbon in soil. Aust. J. Soil Res. 34, 251–271. doi: 10.1071/SR9960251
Sørensen, L. H. (1972). Stabilization of newly formed amino acid metabolites in soil by clay minerals. Soil Sci. 114, 5–11. doi: 10.1097/00010694-197207000-00002
Thevenot, M., Dignac, M. F., and Rumpel, C. (2010). Fate of lignins in soils: a review. Soil Biol. Biochem. 42, 1200–1211. doi: 10.1016/j.soilbio.2010.03.017
Tinkham, W. T., Smith, A. M. S., Higuera, P. E., Hatten, J. A., Brewer, N. W., and Doerr, S. H. (2016). Replacing time with space: using laboratory fires to explore the effects of repeated burning on black carbon degradation. Int. J. Wildl. Fire 25, 242–248. doi: 10.1071/WF15131
Wiedemeier, D. B., Hilf, M. D., Smittenberg, R. H., Haberle, S. G., and Schmidt, M. W. I. (2013). Improved assessment of pyrogenic carbon quantity and quality in environmental samples by high-performance liquid chromatography. J. Chromatogr. A 1304, 246–250. doi: 10.1016/j.chroma.2013.06.012
Wiedner, K., and Glaser, B. (2015). “Traditional use of biochar,” in BIochar for Environmental Management - Science and Technology, eds J. Lehmann and S. Joseph (London: Routledge), 15–37.
Keywords: fire derived organic matter, pyrogenic carbon, soil organic matter stabilization processes, database, global distribution, soil organic carbon, global carbon cycle
Citation: Reisser M, Purves RS, Schmidt MWI and Abiven S (2016) Pyrogenic Carbon in Soils: A Literature-Based Inventory and a Global Estimation of Its Content in Soil Organic Carbon and Stocks. Front. Earth Sci. 4:80. doi: 10.3389/feart.2016.00080
Received: 30 May 2016; Accepted: 08 August 2016;
Published: 31 August 2016.
Edited by:
Francien Peterse, Utrecht University, NetherlandsReviewed by:
Philippa Louise Ascough, Scottish Universities Environmental Research Centre, UKStefan Doerr, Swansea University, UK
Copyright © 2016 Reisser, Purves, Schmidt and Abiven. This is an open-access article distributed under the terms of the Creative Commons Attribution License (CC BY). The use, distribution or reproduction in other forums is permitted, provided the original author(s) or licensor are credited and that the original publication in this journal is cited, in accordance with accepted academic practice. No use, distribution or reproduction is permitted which does not comply with these terms.
*Correspondence: Samuel Abiven, samuel.abiven@geo.uzh.ch