Variations in Sr and Nd Isotopic Ratios of Mineral Particles in Cryoconite in Western Greenland
 Naoko Nagatsuka1*
  Nozomu Takeuchi2
  Jun Uetake1
  Rigen Shimada3
  Yukihiko Onuma2 Sota Tanaka2 Takanori Nakano4
- 1National Institute of Polar Research, Tokyo, Japan
- 2Department of Earth Sciences, Graduate School of Science, Chiba University, Chiba, Japan
- 3Earth Observation Research Center, Japan Aerospace Exploration Agency, Ibaraki, Japan
- 4Research Institute for Humanity and Nature, Kyoto, Japan
In order to better understand the source of minerals on the dark-colored ice, located in the Greenland ice sheet ablation zone, we analyzed the Sr and Nd isotopic ratios of minerals in cryoconite, which were collected from glaciers in northwest and southwest Greenland. We focused on the following: (i) comparison of the isotopes of minerals in cyroconite with those in sediments from local and distant areas, (ii) regional variations in western Greenland, and (iii) spatial variations across an individual a glacier. The mineral components of the cryoconite showed variable Sr and Nd isotopic ratios (87Sr/86Sr: 0.711335 to 0.742406, εNd (0): −33.1 to −22.9), which corresponded to those of the englacial dust and moraine on and around the glaciers but were significantly different from those of the distant deserts that have been considered to be primary sources of mineral dust on the Greenland Ice Sheet. This suggests that the minerals within the cryoconites were mainly derived from local sediments, rather than from distant areas. The Sr ratios in the northwestern region were significantly higher than those in the southwestern region. This is probably due to geological differences in the source areas, such as the surrounding glaciers in each region. The isotopic ratios further varied spatially within a glacier (Qaanaaq and Kangerlussuaq areas), indicating that the silicate minerals on the glaciers were derived not from a single source but from multiple sources, such as englacial dust and wind-blown minerals from the moraine surrounding the glaciers.
Introduction
Cryoconite is a dark colored surface dust, which is deposited on the surface of glacier ice and is commonly found on glaciers worldwide. It is a mixture and/or aggregate of insoluble particles, such as black carbon, mineral dust, and organic matter. Black carbon originates from natural or anthropogenic forest fires and incomplete fuel combustion (e.g., Chýlek et al., 1995). Mineral dust is transported by wind from local or distant arid terrestrial surfaces (e.g., Bøggild et al., 2010). Organic matter is produced by microbes, such as cyanobacteria and green algae, living on glaciers (e.g., Takeuchi et al., 2014). Cryoconite can act to reduce the surface albedo of the ice because of its dark coloration and thus accelerates glacier melting in many parts of the world. The influence of cyroconites on ice melt has been reported in the ablation area of the northwestern and southwestern Greenland Ice Sheet and has been studied since the 1950s (e.g., Gajda, 1958; Gerdel and Drouset, 1960; Gribbon, 1979).
Recently, the area of dark-colored ice covered by cryoconites has expanded on the Greenland Ice Sheet. During summer, the dark ice appeared at the surface of ablation area, particularly along the western side of Greenland (e.g., Wientjes et al., 2011; Takeuchi et al., 2014). Analyses of satellite images revealed that the dark area varies annually and has generally been expanding over the last 15 years (Shimada et al., 2016). Studies have shown that cryoconite causes the dark-colored ice and substantially reduces the albedo of the surface. For example, the albedo of a cryoconite-rich dark ice surface is ~0.10 (Knap and Oerlemans, 1996; Chandler et al., 2015), whereas the value for a clean ice surface, without cryoconite, is 0.46–0.64 (Knap and Oerlemans, 1996; Moustafa et al., 2015). The expansion of the dark region is thought to be responsible for the recent albedo reduction of the Greenland Ice Sheet and to contribute to recent melt increases (e.g., Wientjes et al., 2011; Takeuchi et al., 2014). The albedo reduction has been observed since 2000 and is likely have contributed to recent high ice loss rates observed in Greenland (e.g., Tedesco et al., 2011, 2016; Box et al., 2012; Dumont et al., 2014). Therefore, it is important to understand the process of dark ice expansion in Greenland.
One of the possible causes of dark ice expansion is an increase in cryoconite abundance on the ice surface. Because mineral dust is the major constituent of cryoconite (Takeuchi et al., 2014), it is important to know its sources and the processes by which it accumulates on the ice sheet. The minerals in cryoconite may also affect the microbial production on the glacial surface, which is another contributor to the cryoconite mass. Because glacial microbes are likely to incorporate nutrients from mineral dust and dissolved components in snow and ice (Fjerdingstad, 1973; Nagatsuka et al., 2010; Wientjes et al., 2011), the minerals on an ice sheet and/or glacier could affect their biomass by supplying nutrients. Recent studies have focused on the mineralogical characteristics of cryoconite, as well as their physical, chemical, and biological characteristics, including: abundance (Uetake et al., 2010; Takeuchi et al., 2014); composition (Bøggild et al., 2010; Wientjes et al., 2011; Nagatsuka et al., 2014a); reflectance (Tedesco et al., 2013); and elemental composition (Tepe and Bau, 2015). However, the sources and transportation process of cryoconite are still unknown.
There are different possible sources of the mineral dust in the cryoconite on the Greenland Ice Sheet. The mineral dust in ice cores from Greenland originated mainly in Asian deserts, with very minor contributions from the Sahara in Africa (e.g., Biscaye et al., 1997; Svensson et al., 2000; Bory et al., 2003; Lupker et al., 2010). On the other hand, the dust deposited on the ablation area was locally derived from wind-blown sediments and/or englacial melt-out debris (e.g., Bøggild et al., 2010; Wientjes et al., 2011). Tepe and Bau (2015) analyzed trace elements of size-separated mineral dust in cryoconites from southwestern Greenland and suggested that only fine minerals (<0.2 μm) originated from eastern Asia, whereas the coarser (>0.2 μm) minerals were derived from eroded local bedrock. Kurosaki and Mikami (2003) showed that a remarkable increase in dust outbreaks occurred in East Asian deserts, which are vast source areas of eolian dust, between 2000 and 2002, compared with the previous seven years (1993–1999). These frequent dust outbreaks could therefore increase eolian dust deposits on the Greenland Ice Sheet, leading to an increase of cryoconite abundance. Bullard and Austin (2011) also suggest that reworking of the proglacial floodplain in western Greenland, during ice retreat, may provide more material for eolian transport. However, there is still a lack of direct evidence to link the minerals found in the cryoconite to their source, and thus it is difficult to differentiate between local and distant sources. Furthermore, the spatial variation in the mineral sources of cryoconite is also unclear. Previous studies have shown that the mineral composition of cryoconite in northwestern Greenland shows regional variation (Nagatsuka et al., 2014a), suggesting that the sources also differ. The mineral sources of cryoconite can also vary across individual glaciers, due to differences in exposed ice age, for example, where there is a transition between Pleistocene and Holocene ice (Reeh et al., 2002; Petrenko et al., 2005). Hence, the abundance and characteristics of mineral dust originated from englacial ice may vary spatially on the ice surface.
Stable isotopic ratios of strontium (87Sr/86Sr) and neodymium (143Nd/144Nd or εNd (0)) can reveal the source and transport process of mineral dust in cryoconite. Sr and Nd are commonly contained in trace amounts in natural materials such as rocks and water as well as in organisms. Their isotopic ratios vary greatly, depending on their geological origin and the ratios rarely change during transportation in the atmosphere or after deposition as sediment (e.g., Biscaye et al., 1997; Capo et al., 1998). Sr and Nd isotopic ratios have been widely used in studies of loess and sediment, to determine their geological sources and have revealed that there are large geographical variations in the isotopic ratios of globally collected sediments, such as desert sand, soil, loess, volcanic ash, and ocean core dust (e.g., Goldstein et al., 1984; Nakai et al., 1993; Nakano et al., 2004; Grousset and Biscaye, 2005; Chen et al., 2007; Colville et al., 2011; Reyes et al., 2014). Nagatsuka et al. (2010) first documented these isotopic ratios for minerals in cryoconite collected from different elevations on a glacier in western China. The isotopic ratios showed no significant variation between the sites, suggesting that the mineral dust was derived from a single source and deposited uniformly across the ice surface. Nagatsuka et al. (2014b) also showed geographical variation in the isotopic ratios of cryoconites on Asian glaciers, which revealed that the sources of minerals differ among the northern, central, and southern regions in Asia. Therefore, the Sr and Nd isotopic ratios of the minerals in cryoconite could reveal geographical, regional, and altitudinal variation in the mineral sources on the Greenland Ice Sheet.
This paper aims to understand the source of minerals in cryoconite in the dark region of the Greenland Ice Sheet, using samples collected from multiple locations in western Greenland. Sr and Nd isotopic ratios and mineral compositions of cryoconite collected from seven glaciers in geographically separated regions in northwest and southwest Greenland are analyzed. We focus on the following: (i) comparison of the isotopes of minerals in cryoconite with those in sediments from local and distant sites; (ii) regional variation in western Greenland; and (iii) spatial variation across individual glaciers. The variations in the isotopic ratios and compositions are discussed in terms of the sources of the silicate minerals found on the glaciers.
Samples and Analytical Method
We analyzed cryoconite samples collected in the summers of 2011 to 2014 from six glaciers in northwestern Greenland and from outlet glaciers in the Kangerlussuaq area of southwestern Greenland (Table 1). The glaciers in northwestern Greenland included Qaanaaq Glacier (QA), Qaqortaq Glacier (QQ), Tugto Glacier (TG), Bowdoin Glacier (BD), Sun Glacier (SN), and Thule Ramp (TL). The Qaanaaq and Qaqortaq Glaciers are outlet glaciers that flow out from the Qaanaaq Ice Cap, which is on a small peninsula of northwest Greenland (Figure 1). The Tugto, Bowdoin, and Sun Glaciers are outlet glaciers of the Greenland Ice Sheet, located around the Qaanaaq Ice Cap. The Thule Ramp flows down from the Greenland Ice Sheet in the Thule area, which is located 120 km south of the Qaanaaq Ice Cap. The outlet glaciers in the Kangerlussuaq area in southwestern Greenland (KA) include the Russell and Isunnguata Sermia Glaciers.
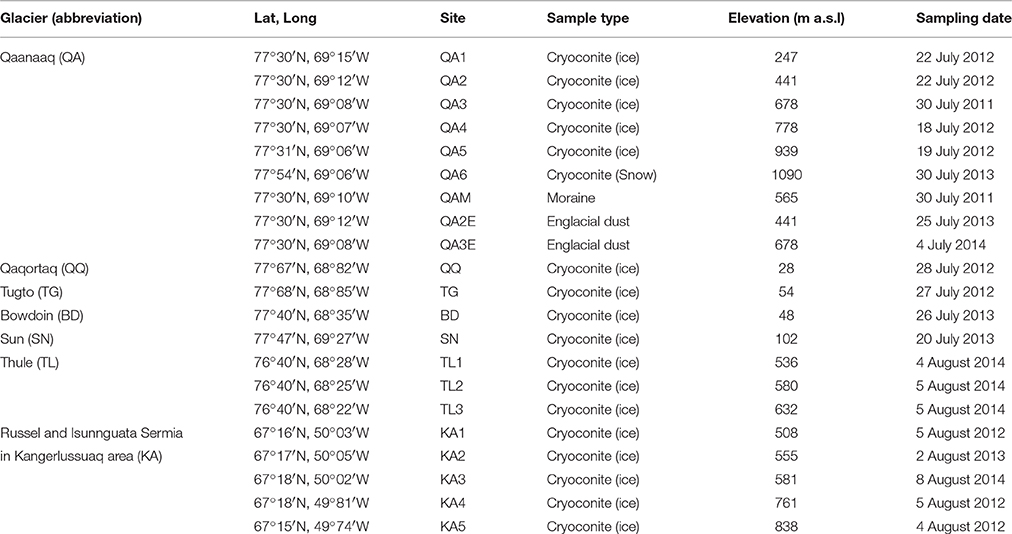
Table 1. Description of sample of cryoconite, moraine, and englacial dust on and around the glaciers in northwestern and southwestern Greenland.
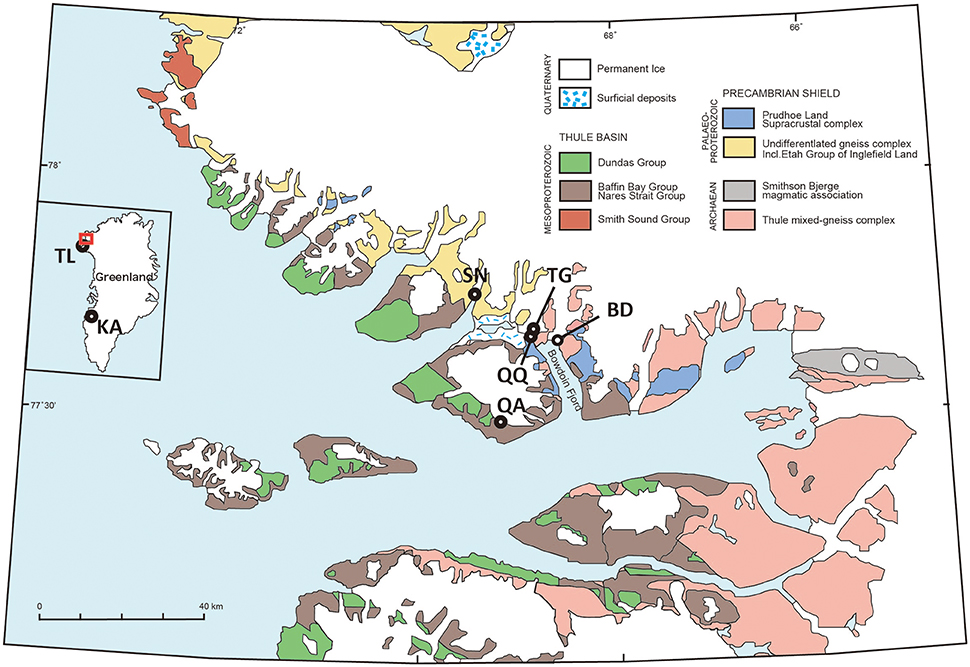
Figure 1. Geological map of northwestern Greenland modified from Thomassen et al. (2002) showing the glaciers where cryoconite samples were collected. (QA, Qaanaaq Glacier; QQ, Qaqortaq Glacier; TG, Tugto Glacier; BD, Bowdoin Glacier; SN, Sun Glacier; TL, Thule Ramp; KA, Kangerlussuaq area included Russell and Isunnguata Sermia glaciers).
The samples were collected from the surface at different elevations in the ablation area of each glacier (Figure 2). The samples from the Qaanaaq Glacier were collected at six different elevation sites ranging from 247 m (QA1) to 1090 m (QA6). The lower five sites had a bare ice surface and were located in the ablation area (QA1-QA5), whereas the highest site was snow-covered and situated in the accumulation area (QA6). The lowest site (QA1) had a relatively clean ice surface and the areal coverage of the cryoconite holes was less than 5% (Takeuchi et al., 2014). In contrast, the middle sites (QA2-QA5) had dirty ice surfaces with fewer cryoconite holes. The abundance of cryoconite on the Qaanaaq Glacier has been reported to range from 1.24 to 32.7 gm−2 (dry weight, average 14.3 ± 10.1 gm−2, Takeuchi et al., 2014) and is greatest at the middle site (QA4). The samples from the Thule Ramp were collected at three different sites from 536 m (TL1) to 632 m (TL3). The surface at the lower two sites (TL1 and TL2) was dirty ice with a few shallow cryoconite holes, while that of the highest site (TL3) was relatively clean ice with cryoconite holes. The samples from the Kangerlussuaq area were collected at five different sites ranging from 508 m (KA1) to 838 m (KA5). The surface at the lowest and highest sites (KA1 and KA5) was dirty ice covered with abundant cryoconite with a few shallow cryoconite holes. The cryoconite samples were collected from the dirty ice surface. The middle and higher sites (KA2-KA4) had relatively clean ice and a number of cryoconite holes. The cryoconite samples were collected from the bottom of the cryoconite holes. The abundance of cryoconite on the ice surface in this area has been reported to range from 4.75 to 143.85 gm−2 and to be greatest in the lowest site KA1 (dry weight, average 35.73 ± 37.1 gm−2, Uetake et al., 2010). The samples from the other glaciers were collected only at one site for each glacier. All of the sites were located at the dark ice surface near the terminus at elevations ranging from 28 to 102 m (Figure 2). The samples of cryoconite were collected with a stainless steel scoop or a pipetted and stored in clean 30 mL polyethylene bottles. Because cryoconite on the glaciers is likely to be well mixed by ice movement and running meltwater on the surface, we assumed that the composition was uniform within each site. A moraine sample was collected from a site located at ridge of debris deposited along the sides of a glacier between site QA2 and QA3. Subsurface dust samples (QA2E and QA3E) were collected from two sites (QA2 and QA3, respectively) on the Qaanaaq Glacier. The sample at QA2E was collected from several centimeters below the surface, with a stainless steel scoop, in 2013 and those at QA3E were collected 0.3 m below the surface with a hand auger in 2014.
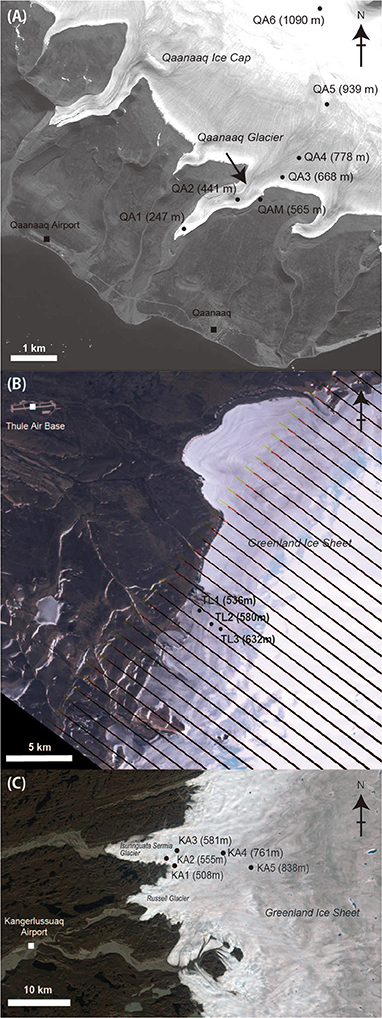
Figure 2. Satellite images of (A) Qaanaaq Glacier, (B) Thule Ramp, and (C) Kangerlussuaq area showing sampling sites on the glacier surface. Images of (A) and (B) were taken in 15 July, 2012 by the Landsat-7 (ETM+), whereas that of (C) was taken in 30 July 2012 by the QuickBird.
The Sr and Nd isotopic ratios for the bulk components (minerals and organic matter) of the cryoconite were measured in the samples from the Thule Ramp and the Kangerlussuaq area. Before the measurement, approximately 0.5 g of the samples was digested with 38% hydrofluoric acid, 70% perchloric acid, and 68% nitric acid. The isotopic ratios for the silicate mineral component of the cryoconite were measured for the Qaanaaq (except for QA3), Qaqortaq, Tugto, Bowdoin, and Sun Glaciers, a part of the Kangerlussuaq area (KA5). The silicate minerals in the samples were obtained after sequential extraction using four different acid solutions because there were sufficient amounts of the samples. The solutions used were ultra-pure water (H2O), 10% hydrogen peroxide solution (H2O2), 5% acetic acid (HOAc), and 20% hydrochloric acid (HCl). The following five fractions were obtained by the extraction: (1) H2O, (2) H2O2, (3) HOAc, and (4) HCl extracted fractions as well as the (5) HCl residual fraction. According to Yokoo (2000), these fractions can be assumed to correspond to (1) saline minerals, (2) organic matter, (3) carbonate minerals, (4) phosphate minerals, and (5) silicate minerals, respectively. These extractions were performed in a Class 100 clean laboratory at the Research Institute for Humanity and Nature (RIHN) in Japan. Details of the extraction method are described by Nagatsuka et al. (2010). We then analyzed the Sr and Nd isotopic ratios of each fraction. Because the silicate mineral fraction was the most dominant component in the fractions (68–98%, Table 2), we used its isotopic ratio to identify the source of the minerals in the cryoconite in this study. Although, the isotopic ratios for the samples varied among the fractions (e.g., H2O−, , HOAc, and HCl extracted fractions and HCl residual fraction: 0.715573–0.742101, 0.720807–0.757979, 0.720311–0.744930, 0.722372–1.021618, 0.716873–0.742246), we assumed that those of bulk components were not significantly different from those of the silicate mineral fractions because silicate is the most dominant mineral in mass of the cryoconite and is the only the mineral that appeared in the x-ray diffraction analysis (XRD) spectra of the samples.
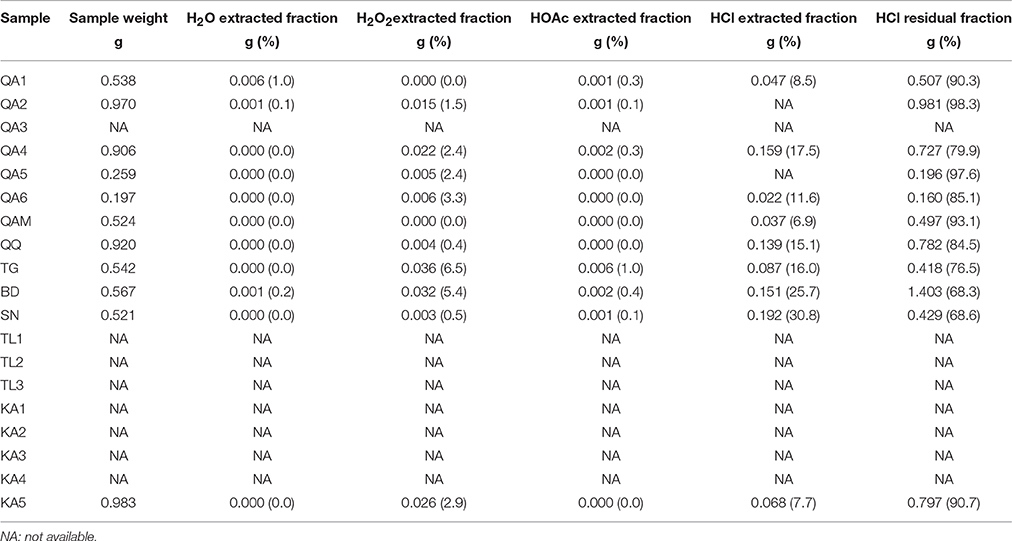
Table 2. Sample weight (dry weight), amounts of extracted fraction and weight percent of extracted fraction to analyzed weight of cryoconite and moraine.
The Sr and Nd ratios were determined with a thermal ionization mass spectrometer (TRITON, Thermo Fisher Scientific) at RIHN, following the same analytical method as that used by Nagatsuka et al. (2010). The measured 87Sr/86Sr and 143Nd/144Nd values were normalized to an 86Sr/88Sr value of 0.1194 and a 146Nd/144Nd value of 0.7219, respectively. The mean ± SD of the 87Sr/86Sr ratios of NIST-SRM987 and the mean143Nd/144Nd ratios of JNdi-1 (the international standard specimen for Sr and Nd isotopes determined during this study) were 0.710247 ± 0.000007 (n = 51) and 0.512107 ± 0.000004 (n = 13), respectively. The measured Sr and Nd isotopic ratios of each standard specimen and sample were determined by repeated measurements (100 times and 140 times, respectively). The internal precisions of the Sr and Nd isotope ratios were better than 0.000005 in this study. For convenience, the 143Nd/144Nd ratios are normalized and denoted as εNd(0) = [(143Nd/144Nd)/0.512636 − 1] × 104.
The mineralogical composition in the cryoconite was analyzed by XRD using a RIGAKU Geigerflex RAD 11B at Chiba University, Japan. The x-ray target was Cu Kv, the tube voltage was 40 kV, and the tube current was 25 mA. Scans were performed from 2.0° to 60° (2θ) at a rate of 2° min−1. The amount of sample used for the XRD analysis was about 100−500 mg dry weight. Moreover, quantitative analyses were also performed following the method described by Chung (1974). The peak height ratio of each mineral to that of quartz was compared with those from reference minerals, after which the semi-quantitative proportion of each sample was obtained. These analyses followed the method reported by Nagatsuka et al. (2010). Some of the XRD results (those for Qaanaaq, Qaqortaq, Tugto, Bowdoin, and Sun Glaciers) have already been published elsewhere (Nagatsuka et al., 2014a) and the data is cited for comparison.
Results
Sr and Nd Isotopic Ratios of Cryoconite
The 87Sr/86Sr and εNd (0) ratios of minerals in cryoconite analyzed in this study ranged from 0.711335 to 0.742406, and from −33.1 to −22.9, respectively (Table 3, Figure 3). The isotopic ratios were particularly distinct between the sites in northwest (Qaanaaq) and southwest Greenland (Kangerlussuaq area). The isotopic ratios in the Qaanaaq Glacier were significantly higher than those in the Kangerlussuaq area, especially the Sr values (Sr: 0.738570 vs. 0.714924, student t-test, t = 10.613, P = 0.000 <0.01; Nd: 0.511230 vs. 0.511062; t = 2.577, P = 0.030 <0.05). The isotope ratios for the other five northwestern glaciers (Qaqortaq, Tugto, Bowdoin, Sun, and Thule Ramp) were intermediate, ranging from 0.718673 to 0.732128 (mean: 0.725947) for Sr and from 0.511063 to 0.511464 (mean: 0.511211) for Nd.
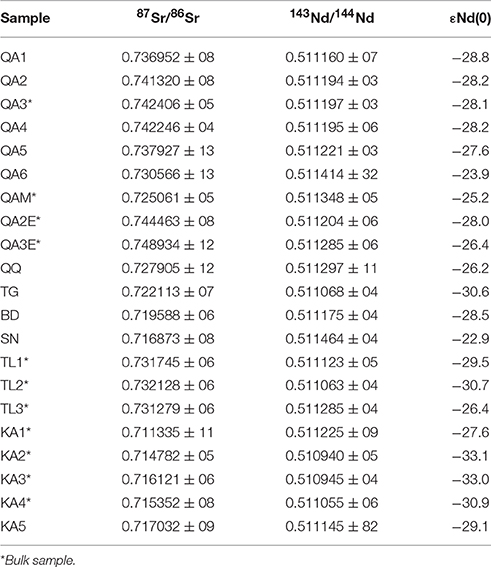
Table 3. Sr and Nd isotopic ratio (87Sr/86Sr, 143Nd/144Nd and εNd (0), mean ± SD × 106) of cryoconites, moraine, and englacial dust on and around the glaciers in northwestern and southwestern Greenland.
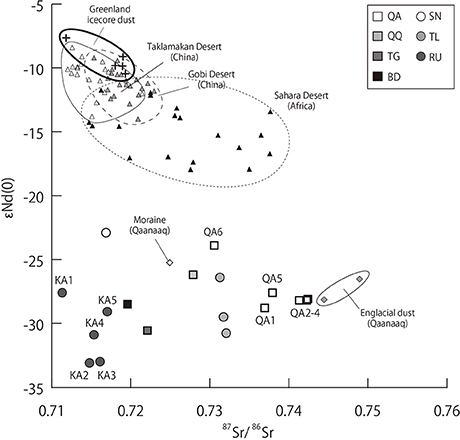
Figure 3. Sr – Nd isotopic ratios of silicate minerals in cryoconites and those of moraine and englacial dust on and around the Qaanaaq Glacier, and loess and sand reported in the Asian and African regions.
There were also spatial variations in the Sr and Nd isotopic ratios within a glacier. On the Qaanaaq Glacier, the isotopic ratios showed lowest Sr and highest Nd values at the highest site (QA6: 0.730566 and −23.9, respectively) but showed higher Sr and lower Nd values at the middle part of the glacier (QA2–QA4: 0.741320 to 0.742406 and −28.2 to −28.1, respectively). The other two sites showed intermediate isotope ratios, which were 0.736952 for Sr and −28.8 for Nd at site QA1 and 0.737927 for Sr and −27.6 for Nd at site QA5 (Table 3, Figure 3). The Sr and Nd ratios of englacial dust of the Qaanaaq Glacier were 0.744463 to 0.748934 and −28.0 to −26.4 (QA2E–QA3E), respectively. These values were close to those of the cryoconite collected from the middle parts of the glacier (QA2–QA4). The isotope ratios of the moraine samples of the glacier were 0.725061 and −25.2, respectively (QAM). These values were similar to those of the dust in the snow surface (QA6) of the glacier.
The isotope ratios on the Thule Ramp and in the Kangerlussuaq area also spatially varied (Table 3, Figure 3). The Nd isotopic ratio at the highest site in the Thule Ramp was higher than those of the lower two sites (−26.4 at TL3 vs. −30.7 and −29.5 at TL1 and TL2). Furthermore, the Sr and Nd isotope ratios at the lowest site in the Kangerlussuaq area (KA1) were lower and higher, respectively, than those from the other upper four sites (Sr: 0.711335 vs. 0.714782 to 0.717032 and Nd: −27.6 vs. −33.1 to −29.1, respectively).
Mineralogical Composition
The XRD spectra of the cryoconite samples showed peaks for several silicate minerals. The peaks observed in the spectra of all cryoconite samples were identified as hornblende (10.5°), quartz (26.7°), potassium feldspar (27.2°), plagioclase (28.2°), and clay minerals such as chlorite (6.0°, 12.5°, 18.9°) and kaolinite (12.5°, 25.2°). Although, there were alternative possible minerals for the peaks at 12.5° and 25.2° (i.e., vermiculite or smectite), we excluded them, as previous studies have shown that minerals in ice or cryoconite in Greenland rarely contain vermiculite or smectite (Svensson et al., 2000; Wientjes et al., 2011). The distinctive peak at 8.9° that appeared only in the spectra of the lower two sites of the Thule Ramp (TL1 and TL2) and the lowest site of the Kangerlussuaq area (KA1), was identified as illite. Peaks for saline, carbonate, and phosphate minerals did not appear, indicating low amounts of these minerals in the cryoconite.
The semi-quantitative composition of the minerals in the cryoconite showed spatial variation among the collection sites on the glaciers. The mineral proportion from the lowest site in the Kangerlussuaq area (KA1) was distinctive from those from the upper sites (KA4 and KA5). KA1 had a higher hornblende and lower clay mineral content than those at the other sites (Table 4, Figure 4). Furthermore, the composition on the Thule Ramp also showed spatial variation: higher quartz and lower hornblende contents at the upper site compared with those at the lower site.
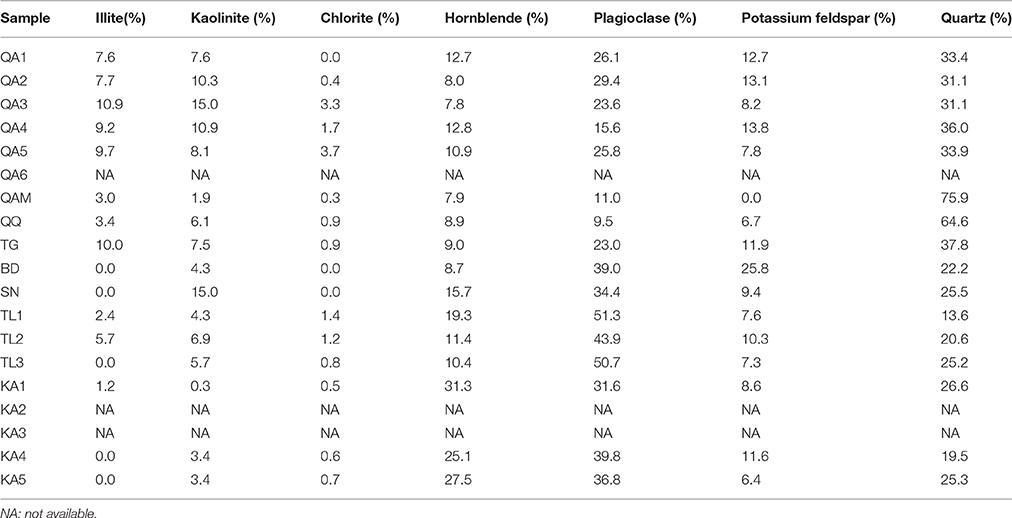
Table 4. Mineral proportions in cryoconite and moraine on and around the glaciers in northwestern and southwestern Greenland.
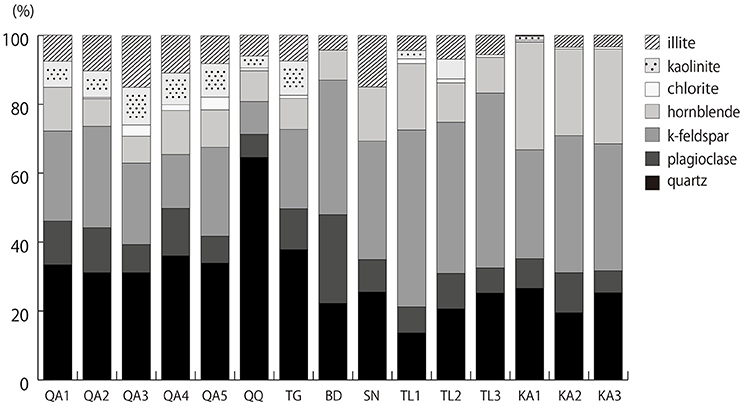
Figure 4. Silicate mineral compositions of cryoconites on glaciers in northwestern and southwestern Greenland.
Discussion
Identification of Possible Source Areas of Minerals in Cryoconite on Greenland Glaciers Based on Isotopic Ratios
According to previous studies, there are three possible sources of minerals in cryoconites on the Greenland Ice Sheet: (1) dust transported by wind from the local area, probably the nearby tundra; (2) englacial dust that was deposited in the past in the accumulation area, traveled through the ice sheet, and outcropped again in the ablation zone; or (3) long-range transported dust from distant deserts. (Bøggild et al., 2010; Wientjes and Oerlemans, 2010; Wientjes et al., 2011; Takeuchi et al., 2014; Tepe and Bau, 2015). The minerals in the cryoconite are likely to be a mixture of those from the three different sources. Biscaye et al. (1997) analyzed the Sr and Nd isotopic ratios of dust in the GISP2 ice core drilled from the inland Greenland Ice Sheet, which indicated that dust from eastern Asian deserts was transported to the Greenland Ice Sheet across the ocean [source (3)]. In addition, Lupker et al. (2010) measured the Hf isotope ratios of dust in the Dye 3 ice core from Greenland, which suggested that the Sahara Desert could be an additional source of the ice core dust. However, the Nd isotopic ratios of the cryoconites analyzed in this study were significantly lower than those of the distant deserts (Sr: 0.72782 vs. 0.72015, student t-test, t = 1.938, P = 0.08 > 0.01; Nd: 0.511155 vs. 0.512001; t = 19.429, P = 0.000 <0.01, Taklamakan and Gobi: Honda et al., 2004; Nakano et al., 2004; Sahara: Grousset et al., 1998) but were close to those of the moraine and englacial dust on and around the glaciers (Figure 3). This suggests that the silicate minerals in the cryoconites are probably not derived from Asian and African deserts [source (3)] but mainly from the area surrounding the glaciers [sources (1) and (2)].
The mineralogical composition of the cryoconites also supports the predominance of local dust on the glaciers. Nagatsuka et al. (2014a) revealed that cryoconites on the Qaanaaq, Qaqortaq, Tugto, Bowdoin, and Sun Glaciers contained much lower amounts of clay minerals (<15%) compared to Asian desert sand (50–75%). The mineral composition on the Thule Ramp and Kangerlussuaq area analyzed in this study also showed a low clay mineral content (<15%, Table 4, Figure 4). Low clay minerals content has also been reported in the cryoconite collected in other regions of the Greenland Ice Sheet (e.g., Bøggild et al., 2010; Tedesco et al., 2011). Because a change in mineral particle size from coarser to finer due to eolian sorting increases the amount of clay minerals (Honda et al., 2004; Kanayama et al., 2005), the low clay mineral content of the cryoconites indicates that the minerals on the glaciers in Greenland are mainly derived from local sources, rather than from distant areas. These results are consistent with those of Bøggild et al. (2010), Wientjes et al. (2011), and Tedesco et al. (2013).
Regional Variation in Sr and Nd Isotopic Ratios of Minerals in Cryoconite
The Sr and Nd isotopic ratios of cryoconite samples were distinct between the northwestern and southwestern regions of Greenland (Table 3, Figure 3), indicating that the mineral source was not common but rather the local ground surface of each region. The Sr isotope ratios in the northwestern region, including the Qaanaaq, Qaqortaq, Tugto, Bowdoin, and Sun Glaciers and the Thule Ramp, were significantly higher than those in the southwestern region (the Kangerlussuaq area). The distinct Sr isotope ratios are likely due to different geology in the regions. Previous studies have reported that there is a large regional difference in the geology between northwest and southwest Greenland (Thomassen et al., 2002; Henriksen et al., 2009, Figure 1). For example, the geology of the bedrock in the Kangerlussuaq area is mainly made up of granite and gneisses that formed in the late Archaean, whereas that in the Qaanaaq area is made up of shallow water sedimentary rocks that formed in the Mesoproterozoic (Henriksen et al., 2009). The distinct Sr isotope ratios of cryoconite minerals probably reflect these regional differences in bedrock geology.
The isotope ratios further varied among the glaciers in the northwestern region, indicating that the source of dust differs among the glaciers and is probably in the area around the glacier margins. As shown in the geological map of the Qaanaaq Peninsula (Thomassen et al., 2002, Figure 1), the geology is not uniform but greatly variable, even in the area. The variations in the isotope ratios of minerals on the glaciers are probably explained by the geological differences of each glacier.
Based on XRD analysis, the mineral compositions in the cryoconite also varied consistently with the Sr and Nd isotopic ratios (Table 4, Figure 4). The silicate minerals in the northwestern region showed greater contents of clay minerals (Qaanaaq, Qaqortaq, Tugto, Bowdoin, Sun, and Thule: 4.3–29.2%) than those in the southwestern region (Kangerlussuaq area: 2.0–4.1%). The regional trend in the relative abundance of illite, which is a clay mineral rich in K and Rb, is consistent with that of the Sr isotopic ratios. The mineral compositions in the cryoconite on the Qaanaaq Glacier showed a greater illite content (7.6–10.9%) than those on the glaciers in Kangerlussuaq area (0.0–1.2%). Furthermore, mineral compositions on the other five glaciers in the northwestern region showed intermediate abundance of illite (Qaqortaq, Tugto, Bowdoin, Sun, and Thule: 0.0–10.0%). According to previous studies, Rb, including radioactive isotope 87Rb, which is the parent element of 87Sr, is most commonly present as a substitute for K in minerals; therefore, high 87Sr/86Sr ratios are typically associated with a high abundance of K-bearing minerals, such as illite and potassium feldspar (e.g., Biscaye et al., 1997; Svensson et al., 2000; Kanayama et al., 2005). In contrast, the Nd isotopic ratios do not vary with this mineral content (e.g., Goldstein et al., 1984; Grousset et al., 1988). Thus, the variations in the Sr isotopic ratios among the glaciers probably reflect the abundance of illite in the cryoconite. A previous study revealed that illite, a typical clay mineral originating from cold regions, is dominant in shelf sediment from northern Greenland (Stein, 2008). The cryoconite from the Qaanaaq Glacier may contain such sediments because the area around the glacier is mainly composed of shallow water sedimentary rocks and may have higher Sr values. Although, there are still some uncertainties regarding the mineral composition in cryoconite on each glacier because the samples were collected in a limited area, the variations in the isotopic ratios are likely to reflect those of the geology in the source areas of the silicate minerals in the cryoconites.
Spatial Variations of the Isotopic Ratios within a Glacier
Spatial variations of the Sr and Nd isotope ratios on the Qaanaaq Glacier suggest that the minerals on the glacier were not derived from a single source but rather from multiple sources. The minerals in the upper snow area (QA6) showed lower Sr and higher Nd ratios, which were close to those of the moraine located downstream of the glacier (Table 3, Figure 3). In contrast, the minerals in the middle part of the glacier (QA2–QA4) showed higher Sr and lower Nd ratios, which approximated those of the englacial dust (QA2E and QA3E). These facts indicate that the minerals on the upper snow surface were mainly supplied by wind from the moraine surrounding the glacier [source (1)], whereas those on the ice surface in the middle part of the glacier was derived from englacial dust of the glacier ice (source (2)). The isotopic variation among the sites probably reflects the mixing ratio of the minerals derived from the two different sources depending on the location on the glacier surface. For example, the minerals at the lowest site (QA1) and upper site (QA5) were intermediate isotope ratios for both Sr and Nd, showing that they contain both the windblown and englacial minerals. This result supports the thought that the abundant surface dust in the middle part of the glacier (QA2–QA4) was mainly composed of englacial dust, as suggested by Takeuchi et al. (2014). This ice-derived mineral dust formed dark stripes several meters wide and several kilometers long on the surface, corresponding to a surface with low albedo in a satellite image (Figure 2). Thus, mineral-rich layers in the glacier ice appear to be important for forming the dark ice surface of the Qaanaaq Glacier.
Although, the englacial dust in the middle part of the glacier appears to originally be windblown dust deposited on the glacier in the past, the distinct isotope ratio of the englacial dust compared to the moraine indicates that the source of the englacial dust was not the moraine around the glacier. The source of the windblown dust in the past is uncertain. The darker and dustier ice that appeared several 100 m from the margin of the Greenland Ice Sheet has been suggested to originate from a colder glacial period (i.e., Pleistocene; Reeh et al., 2002; Petrenko et al., 2005). However, according to previous studies, the Pleistocene ice is missing in the Thule area of northwest Greenland because the ice disappeared once during the Holocene Climatic Optimum, and thus the present glacier ice comprises ice from the middle to late Holocene (Reeh et al., 1990, 2002; Young and Briner, 2015). The Qaanaaq Glacier is also likely comprised of Holocene ice because it is located in northwest Greenland near the Thule area and is a part of the Qaanaaq Ice Cap, which may have a shorter retention time for ice than the main ice sheet. Thus, we assume that the dust in the dark region of the glacier originates from a colder glacial periods in the Holocene when more dust settled in the accumulation zone of the ice sheet, which probably corresponds to the age of englacial dust in the southwestern Greenland Ice Sheet (Wientjes et al., 2011). Englacial dust may be derived from more distant areas than the surrounding moraine, for example, possibly from the eastern Canada Shield, where the bedrock has high Sr and low Nd isotope ratios (Wadleigh et al., 1985; Sinko, 1994).
Spatial variations of the isotope ratios in the Kangerlussuaq area also suggest that the minerals are not derived from a unique source but likely from some of the englacial dust layers in the ablation ice. According to the analysis of oxygen isotopes for the ablation ice of the Greenland Ice Sheet, the ice near the margin is the Pleistocene ice, while that located on the more inland side is Holocene ice (e.g., Reeh et al., 1987; Wientjes et al., 2011). Based on the age of ice in the Kangerlussuaq area, the minerals at site KA1 may have been deposited during the Pleistocene, but those at the upper sites KA2–KA5 may have been deposited during the Holocene. Thus, the distinct isotopic ratios of the minerals at KA1 with respect to the other sites indicate that the source of the minerals deposited on the ice sheet differed between the Pleistocene and Holocene. The mineral source during the Pleistocene is uncertain, but one of possible sources is the continental shelf, which would have been exposed around Greenland during the Pleistocene because sea level was lower during the Pleistocene glaciation than during the Holocene (e.g., Lambeck et al., 2014). Thus, minerals from different sources deposited on the ice sheet during different historical eras may be responsible for the spatial variation of the isotope ratios in cryoconite. An understanding of the distribution of mineral dust in the englacial ice is important for evaluating the formation of cryoconite and the dark ice surface on the ice sheet.
Conclusions
Analysis of the Sr and Nd isotopic ratios of the minerals in cryoconite in northwestern and southwestern Greenland revealed that the isotopic ratios varied greatly among regions, among glaciers, and spatially within a glacier. However, the isotopic ratios were substantially different from those of Asian and African deserts. This finding suggests that the minerals on the glaciers are mainly derived from local sources, rather than from distant areas. The Sr isotopic ratios were particularly distinct between northwestern and southwestern Greenland; they also varied among the glaciers in northwestern Greenland. This indicates that the source of dust differs among the glaciers and is probably the limited area around each glacier. Variations in the isotope ratio of minerals among regions and among glaciers can be explained by the differing geology at each glacier.
Spatial variations in the isotopic ratios of the minerals on the Qaanaaq Glacier indicate that the minerals were not derived from a single source but rather from multiple sources. The isotopic ratios of minerals in the upper snow area were close to those of the moraine, whereas those on the ice surface in the middle parts of the glacier were close to those of the englacial dust. This suggests that the minerals on the snow are mainly supplied by wind from the moraine, and those on the ice surface are derived from englacial dust. A major contributor to the dark ice surface of the glacier is likely to be outcroppings of mineral-rich layers of glacier ice.
Spatial variations of the isotopic ratios in southwest Greenland are probably due to englacial dust layers formed during different historical eras. Based on the age of ice in this area, the minerals at the lowest site may have been deposited during the Pleistocene, while those at the upper sites may have been deposited during the Holocene. Thus, the distinct isotopic ratios of the minerals among sites indicate that the source of minerals deposited on the ice sheet differed between the Pleistocene and Holocene.
Our study demonstrates that the mineral particles in cryoconites on the glaciers and ice sheet margin in western Greenland are mainly derived from local sediments, such as the moraine around each glacier and the englacial dust deposited historically. Although, further analyses are necessary to identify the original source of the englacial mineral dust and to understand the depositional process of the dusts on the dark ice surface, our results suggest that an understanding of englacial mineral dust is important for evaluating the formation of cryoconite and the dark ice surface on the Greenland Ice Sheet.
Author Contributions
NN: Designed research, conducted laboratory analyses, and wrote the paper; NT: gave conceptual advice and wrote the paper; NN, NT, JU, RS, YO, and ST: Conducted field investigations and collected samples; TN: Gave technical support and conceptual advice.
Conflict of Interest Statement
The authors declare that the research was conducted in the absence of any commercial or financial relationships that could be construed as a potential conflict of interest.
Acknowledgments
We would like to thank the staff of the Research Institute of Humanity and Nature for their generous support. We would also like to thank Teruo Aoki for leading the Snow Impurity and Glacial Microbe effects on abrupt warming in the Arctic (SIGMA) project. We also would thank to members of the SIGMA and GRENE projects for their support in the field campaign of 2012 and 2013. We also thank two reviewers (Horst Machguth and Martyn Tranter) and an editor (Paul Vallelonga) for valuable suggestions, which substantially improved this manuscript. This study was financially supported by Grant-in-Aid for JSPS Fellows, by JSPS KAKENHI Grant Numbers 23221004, 26247078, 26241020, 15K16120, 16J08380, and 16H01772, Green Network of Excellence (GRENE) Arctic Climate Change Research Project, and an NIPR publication subsidy.
References
Biscaye, P. E., Grousset, F. E., Revel, M., Van der Gaast, S., Zielinski, G. A., Vaars, A., et al. (1997). Asian provenance of glacial dust (stage2) in the Greenland Ice Sheet project 2 ice core, summit Greenland. J. Geophys. Res. 102, 26765–26781. doi: 10.1029/97JC01249
Bøggild, C. E., Brandt, R., Brown, K., and Warren, S. G. (2010). The ablation zone in northeast Greenland: ice types, albedos and impurities. J. Glaciol. 56, 101–113. doi: 10.3189/002214310791190776
Bory, A. J.-M., Biscaye, P. E., and Grousset, F. E. (2003). Two distinct seasonal Asian source regions for mineral dust deposited in Greenland (NorthGRIP). Geophys. Res. Lett. 30:1167. doi: 10.1029/2002gl016446
Box, J. E., Fettweis, X., Stroeve, J. C., Tedesco, M., Hall, D. K., and Steffen, K. (2012). Greenland ice sheet albedo feedback: thermodynamics and atmospheric drivers. Cryosphere 6, 821–839. doi: 10.5194/tc-6-821-2012
Bullard, J. E., and Austin, M. J. (2011). Dust generation on a proglacial floodplain, West Greenland. Aeolian Res. 3, 43–54. doi: 10.1016/j.aeolia.2011.01.002
Capo, R. C., Stewart, B. W., and Chadwick, O. A. (1998). Strontium isotopes as tracers of ecosystem processes: theory and methods. Geoderma 82, 197–225. doi: 10.1016/S0016-7061(97)00102-X
Chandler, D. M., Alcock, J. D., Wadham, J. L., Mackie, S. L., and Telling, J. (2015). Seasonal changes of ice surface characteristics and productivity in the ablation zone of the Greenland Ice Sheet. Cryosphere 9, 487–504. doi: 10.5194/tc-9-487-2015
Chen, J., Li, G., Yang, J., Rao, W., Lu, H., Balsam, W., et al. (2007). Nd and Sr isotopic characteristics of chinese deserts: Implications for the provenances of asian dust. Geochim. Cosmochim. Acta 71, 3904–3914. doi: 10.1016/j.gca.2007.04.033
Chung, F. H. (1974). Quantitative interpretation of X-ray diffraction patterns. I. Matrix-flushing method of quantitative multicomponent analysis. J. Appl. Cryst. 7, 519–525. doi: 10.1107/S0021889874010375
Chýlek, P., Johnson, B., Damiano, P. A., Taylor, K. C., and Clement, P. (1995). Biomass burning record and black carbon in the GISP2 Ice Core. Geophys. Res. Let. 22, 89–92. doi: 10.1029/94GL02841
Colville, E. J., Carlson, A. E., Beard, B. L., Hatfield, R. G., Stoner, J. S., Reyes, A. V., et al. (2011). Sr-Nd-Pb Isotope evidence for Ice-Sheet presence on Southern Greenland during the last interglacial. Science 333, 620–623. doi: 10.1126/science.1204673
Dumont, M., Brun, E., Picard, G., Michou, M., Libois, Q., Petit, J., et al. (2014). Contribution of lightabsorbing impurities in snow to Greenland's darkening since 2009. Nat. Geosci. 7, 509–512. doi: 10.1038/ngeo2180
Fjerdingstad, E. (1973). Accumulated concentrations of heavy metals in red snow algae in Greenland. Schweizerische Z. Hydrol. 35, 247–251. doi: 10.1007/bf02502920
Gajda, R. T. (1958). Cryoconite phenomena on the Greenland Ice Cap in the Thule area, The Canad. Geograph 3, 35–44.
Gerdel, R. W., and Drouset, F. (1960). The cryoconite of the Thule area, Greenland. Transect. Am. Microscop. Soc. 79, 256–272. doi: 10.2307/3223732
Goldstein, S. L., O'Nions, R. K., and Hamilton, P. J. (1984). A Sm–Nd isotopic study of atmospheric dusts and particulates from major river systems. Earth Planet. Sci. Lett. 70, 221–236. doi: 10.1016/0012-821X(84)90007-4
Grousset, F. E., and Biscaye, P. E. (2005). Tracing dust sources and transport patterns using Sr, Nd and Pb isotopes. Chem. Geol. 222, 149–167. doi: 10.1016/j.chemgeo.2005.05.006
Grousset, F. E., Biscaye, P. E., Zindler, A., Prospero, J., and Chester, R. (1988). Neodymium isotopes as tracers in marine sediments and aerosols: North Atlantic. Earth Planet. Sci. Lett. 87, 367–378. doi: 10.1016/0012-821X(88)90001-5
Grousset, F. E., Parra, M., Bory, A., Martinez, P., Bertrand, P., Shimmield, G., et al. (1998). Saharan wind regimes traced by the Sr–Nd isotopic composition of subtropical Atlantic sediments: last Glacial Maximum vs today, Quatern. Sci. Rev. 17, 395–409. doi: 10.1016/S0277-3791(97)00048-6
Henriksen, N., Higgins, A. K., Kalsbeek, F., and Pulvertaft, T. C. R. (2009). Greenland from Archaean to Quaternary. Descriptive Text to the Geological Map of Greenland, 1: 250000, 2nd Edn. Copenhagen: Geological Survey of Denmark and Greenland Bulletin.
Honda, M., Yabuki, S., and Shimizu, H. (2004). Geochemical and isotopic studies of aeolian sediments in China, Sedimentology 51, 211–230. doi: 10.1111/j.1365-3091.2004.00618.x
Kanayama, S., Yabuki, S., Liu, M., Shen, Z., Liu, L., Yanagisawa, F., et al. (2005). Size-dependent geochemical characteristics of asian dust — Sr and Nd isotope compositions as tracers for source identification. J. Meteorol. Soc. Jpn. 83A, 107–120. doi: 10.2151/jmsj.83A.107
Knap, W. H., and Oerlemans, J. (1996). The surface albedo of the Greenland Ice Sheet: satellite-derived and in situ measurements in the Søndre Strømfjord area during the 1991 melt season. J. Glaciol. 42, 364–374.
Kurosaki, Y., and Mikami, M. (2003). Recent frequent dust events and their relation to surface wind in East Asia. Geophys. Res. Lett. 30, 1736. doi: 10.1029/2003GL017261
Lambeck, K., Rouby, H., Purcell, A., Sun, Y., and Sambridge, M. (2014). Sea level and global ice volumes from the Last Glacial Maximum to the Holocene. Proc. Natl. Acad. Sci. U.S.A. 111, 15296–15303. doi: 10.1073/pnas.1411762111
Lupker, M., Aciego, S. M., Bourdon, B., Schwander, J., and Stocker, T. F. (2010). Isotopic tracing (Sr, Nd, U and Hf) of continental and marine aerosols in an 18th century section of the Dye-3 ice core (Greenland). Earth Planet. Sci. Lett. 295, 277–286. doi: 10.1016/j.epsl.2010.04.010
Moustafa, S., Rennermalm, A., Smith, L., Miller, M., Mioduszewski, J., Koenig, L., et al. (2015). Multi-modal albedo distributions in the ablation area of the southwestern Greenland Ice Sheet. Cryosphere 9, 905–923. doi: 10.5194/tc-9-905-2015
Nagatsuka, N., Takeuchi, N., Nakano, T., Kokado, E., and Li, Z. (2010). Sr, Nd, and Pb stable isotopes of surface dust on Urumqi glacier No.1 in western China. Ann. Glaciol. 51, 95–105. doi: 10.3189/172756411795931895
Nagatsuka, N., Takeuchi, N., Nakano, T., Shin, K., and Kokado, E. (2014b). Geographical variations in Sr and Nd isotopic ratios of cryoconite on Asian glaciers. Bull. Glaciol. Res. 32, 107–114. doi: 10.1088/1748-9326/9/4/045007
Nagatsuka, N., Takeuchi, N., Uetake, J., and Shimada, R. (2014a). Mineralogical composition of cryoconite on glaciers in northwest Greenland. Bull. Glaciol. Res. 32, 107–114. doi: 10.5331/bgr.32.107
Nakai, S., Halliday, A. N., and Rea, D. K. (1993). Provenance of dust in the Pacific Ocean. Earth Planet. Sci. Lett. 119, 143–157. doi: 10.1016/0012-821X(93)90012-X
Nakano, T., Yokoo, Y., Nishikawa, M., and Koyanagi, H. (2004). Regional Sr—Nd isotopic ratio of soil minerals in nothern China as Asian dust fingerprints. Atmos. Environ. 38, 3061–3067. doi: 10.1016/j.atmosenv.2004.02.016
Petrenko, V. V., Severinghaus, J. P., Brook, E. J., Reeh, N., and Schaefer, H. (2005). Gas records from the West Greenland ice margin covering the Last Glacial Termination: a horizontal ice core. Quat. Sci. Rev. 25, 865–875. doi: 10.1016/j.quascirev.2005.09.005
Reeh, N., Oerter, H., and Thomsen, H. H. (2002). Comparison between Greenland ice-margin and ice-core oxygen-18 records. Ann. Glaciol. 35, 136–144. doi: 10.3189/172756402781817365
Reeh, N., Thomsen, H. H., and Clausen, H. B. (1987). The Greenland icesheet margin – a mine of ice for paleo-environmental studies. Palaeogeogr. Palaeoclimatol. Palaeocol. 58, 229–234. doi: 10.1016/0031-0182(87)90062-9
Reeh, N., Thomsen, H. H., Frich, P., and Clausen, H. B. (1990). Stable isotope studies on ice margins in the Thule area. Medd. Grønl. Geosci. 22, 47–56.
Reyes, A. V., Carlson, A. E., Beard, B. L., Hatfield, R. G., Stoner, J. S., Winsor, K., et al. (2014). South Greenland Ice-Sheet collapse during Marine Isotope Stage 11. Nature 510, 525–528. doi: 10.1038/nature13456
Shimada, R., Takeuchi, N., and Aoki, T. (2016). Inter-annual and geographical variations in the extent of bare ice and dark ice on the Greenland Ice Sheet derived from MODIS satellite images. Front. Earth. Sci. 4:43. doi: 10.3389/feart.2016.00043
Sinko, J. A. (1994). Les flux de Particules Issues des Eaux de Surface de l'Atlantique-nord Depuis 250.000 ans: Variabilité et Implications Paléo-Climatiques. Ph.D's. thesis, Univ of BordeauxI, Talence.
Stein, R. (2008). Arctic Ocean Sediments: Processes, Proxies, and Paleoenvironment, Developments in Marine Geology, 2. Amsterdam: Elsevier.
Svensson, A., Biscaye, P. E., and Grousset, F. E. (2000). Characterization of late glacial continental dust in the greenland ice core project ice core. J. Geophys. Res. 105, 4637–4656. doi: 10.1029/1999JD901093
Takeuchi, N., Nagatsuka, N., Uetake, J., and Shimada, R. (2014). Spatial variations in impurities (cryoconite) on glaciers in northwest Greenland. Bull. Glaciol. Res. 32, 85–94. doi: 10.5331/bgr.32.85
Tedesco, M., Doherty, S., Fettweis, X., Alexander, P., Jeyaratnam, J., and Stroeve, J. (2016). The darkening of the Greenland Ice Sheet: trends, drivers and projections (1981-2100). Cryosphere 10, 477–496. doi: 10.5194/tc-10-477-2016
Tedesco, M., Fettweis, X., Mote, T., Wahr, J., Alexander, P., Box, J. E., et al. (2013). Evidence and analysis of 2012 Greenland records from spaceborne observations, a regional climate model and reanalysis data. Cryosphere 7, 615–630. doi: 10.5194/tc-7-615-2013
Tedesco, M., Fettweis, X., van den Broeke, M. R., van de Wal, R. S. W., Smeets, C. J. P. P., van de Berg, W. J., et al. (2011). The role of albedo and accumulation in the 2010 melting record in Greenland. Environ. Res. Lett. 6:014005. doi: 10.1088/1748-9326/6/1/014005
Tepe, N., and Bau, M. (2015). Distribution of rare earth elements and other high field strength elements in glacial meltwaters and sediments from the western Greenland Ice Sheet: evidence for different sources of particles and nanoparticles. Chem. Geol. 412, 59–68. doi: 10.1016/j.chemgeo.2015.07.026
Thomassen, B., Dawes, R. B., Steenfelt, A., and Krebs, D. J. (2002). Qaanaaq 2001: mineral exploration reconnaissance in North-West Greenland. Geol. Greenland Surv. Bull. 191, 133–143.
Uetake, J., Naganuma, T., Hebsgaard, M. B., and Kanda, H. (2010). Communities of algae and cyanobacteria on glaciers in west Greenland. Polar Sci. 4, 71–80. doi: 10.1016/j.polar.2010.03.002
Wadleigh, M. A., Veizer, J., and Brooks, C. (1985). Strontium and its isotopes in Canadian rivers: fluxes and global implications. Geochim. Cosmochim. Acta 49, 1727–1736. doi: 10.1016/0016-7037(85)90143-7
Wientjes, I. G. M., and Oerlemans, J. (2010). An explanation for the dark region in the western melt zone of the Greenland Ice Sheet. Cryosphere 4, 261–268. doi: 10.5194/tc-4-261-2010
Wientjes, I. G. M., Van de Wal, R. S. W., Reichart, G. J., Sluijs, A., and Oerlemans, J. (2011). Dust from the dark region in the western ablation zone of the Greenland Ice Sheet. Cryosphere 5, 589–601. doi: 10.5194/tc-5-589-2011
Yokoo, Y. (2000). Geochemical Study of Desert Sand and Loess in China: Implications for the Provenance and Formation of Japanese Soil. PhD. thesis, University of Tsukuba, Tsukuba.
Keywords: Greenland, cryoconite, dark ice, Sr and Nd isotopic ratios, mineral source
Citation: Nagatsuka N, Takeuchi N, Uetake J, Shimada R, Onuma Y, Tanaka S and Nakano T (2016) Variations in Sr and Nd Isotopic Ratios of Mineral Particles in Cryoconite in Western Greenland. Front. Earth Sci. 4:93. doi: 10.3389/feart.2016.00093
Received: 26 June 2016; Accepted: 13 October 2016;
Published: 03 November 2016.
Edited by:
Paul Vallelonga, Niels Bohr Institute, DenmarkReviewed by:
Horst Machguth, University of Zurich, SwitzerlandMartyn Tranter, University of Bristol, UK
Copyright © 2016 Nagatsuka, Takeuchi, Uetake, Shimada, Onuma, Tanaka and Nakano. This is an open-access article distributed under the terms of the Creative Commons Attribution License (CC BY). The use, distribution or reproduction in other forums is permitted, provided the original author(s) or licensor are credited and that the original publication in this journal is cited, in accordance with accepted academic practice. No use, distribution or reproduction is permitted which does not comply with these terms.
*Correspondence: Naoko Nagatsuka, nagatsuka.naoko@nipr.ac.jp