Energy sharing and energy feedback: affective and behavioral reactions to communal energy displays
 Caroline Leygue
 Eamonn Ferguson2
 Anya Skatova
- 1Horizon Digital Economy Research, University of Nottingham, Nottingham, UK
- 2School of Psychology, University of Nottingham, Nottingham, UK
Smart meters and energy displays are being rolled out in many countries to help individuals monitor and reduce their energy usage. However, to date, there is little in depth understanding of how they may change behavior. While there is currently a great deal of technical research into developing smart metering, little research has been conducted on how this affects the energy user. This research addresses this gap and explores the user perspective of energy displays when energy is considered as a shared resource. We report an online experiment conducted across the UK examining affective and behavioral responses to energy sharing situations incorporating different types of energy displays. Reactions differed depending on the type of display. In a situation where one person used more than their fair share of energy, displays showing the average amount of usage in the house were associated with feelings of guilt and fear and a decrease in intention to use energy. Displays that identified the person who overused the resource were associated with anger, and direct sanction intentions on those who were overusing energy. Findings are discussed in terms of the smart meter rollout and the potential utility of detailed energy monitoring technologies for behavior change.
Introduction
Reducing energy consumption in buildings is a key way to help reduce carbon emissions. Between 2009 and 2010, for example, it was estimated that carbon dioxide (CO2) emissions in the UK increased by 3.8% (DECC, 2011). In particular, CO2 emissions from the residential sector increased by 13.4% and domestic electricity consumption increased by almost 27% by 2010 compared to 1990 (DECC, 2011). Furthermore, energy use in buildings accounts for a large proportion of carbon emitted (e.g., in the UK, emissions from buildings accounted for 37% of total UK greenhouse gas emissions in 2012) (CCC, 2013). Of this, non-residential buildings account for 34% (CCC, 2013) and are now a target for national and international legislation on carbon reduction. In 2012, emissions from public and commercial buildings have increased of almost 10%. People’s behavior in buildings is crucial in determining energy use, often accounting for large variations in energy consumption across buildings with similar characteristics (Janda, 2011). The UK government has committed to rolling out smart meters and energy displays to all UK households and small businesses by 2020 (DECC, 2013), in part to encourage a reduction in energy use. Smart meters and energy displays are also being rolled out in homes and businesses in many other western countries. The penetration rate already exceeds 70% in Italy and Nordic countries of Europe and is expected to attain at least 50% in the US, France, and Spain by 2016 (Berg-Insight, 2011a,b).
Energy displays (that is, little screens that show how much energy is used in the house) are being rolled out in the UK and most other countries commonly provide overall electricity usage data. However, there is a growing ability to disaggregate electricity usage (Froehlich et al., 2011) and use smart plugs (e.g., AlertMe or eSight) to provide more detail of where and what is using electricity. While this data is important for facilitating efficiency measures, there is little evidence on how feeding back this information may influence the user (Hutton et al., 1986; Brandon and Lewis, 1999; Abrahamse et al., 2005). In shared houses, as well as in the workplace, energy displays can be communal: that is, the energy used by everyone is displayed to everyone. Given that in the UK, less than 30% of households are composed of only one person, and there are 4.5 million private sector businesses, these circumstances are common (Department of Communities and Local Government, 2009). Nonetheless, research so far has focused on the impact of energy displays on the individual and not on the group. We propose that the interaction between members of a group is important in determining engagement and behavioral responses.
Simply presenting information about energy use may not be the best way to encourage behavior change (Darby, 2006a). Furthermore, in the case of communal displays, we think it is likely to have specific consequences on affect and social behavior (Anderson and White, 2009). For example, seeing other people using too much energy may make people angry and lead to conflict (Small and Loewenstein, 2005). Also, knowing that other people can see when you use too much energy may leave people fearful of being punished or disliked (Nowak and Sigmund, 1998; Milinski et al., 2002b; Haley and Fessler, 2005). Indeed, energy use in the house is a matter of interaction between the occupants, where one’s behavior is influenced by the others’ behavior and vice-versa (e.g., cooperation behaviors around shared appliances) (Heiskanen et al., 2010). The current research uses experimental scenarios to explore how people may interact around different types of energy display and ultimately how these displays may encourage intentions to change behavior.
Typical energy displays provide the user with direct feedback on current total electricity consumption, with, in some cases, cost per hour at the current rate (Darby, 2006a). Sometimes they also provide data on current usage and previous daily or weekly usage (Darby, 2006a). However, a growing amount of research into energy monitoring now allows for electricity data to be collected and displayed at a finer level (Norman, 2000; Darby, 2006a; Broms et al., 2010; Strengers, 2011). Products range from fully integrated smart appliances to portable plugs that can monitor individual existing appliances (Norman, 2000; Fischer, 2008; Hargreaves et al., 2010). With the provision of a disaggregated feedback, it is now increasingly possible to identify individual energy usage even in shared spaces. More detailed displays of energy use are expected to increase consumers’ engagement and lower their usage. Although, it is possible that too much complexity could decrease the efficacy of monitoring systems (see Norman, 2000; Hargreaves et al., 2010).
Research examining engagement with an energy displays found that the displays can reduce an individual’s energy use between 5 and 15% (Darby, 2006b; Faruqui et al., 2010). A more recent review has found a range between 0 and 11% depending on the type of fuel and consumer group, with a mean of 3% (Ofgem, 2011, Raw and Ross, 2011). Nonetheless, little is known on the potential moderating effect of the type of displays on their efficacy and when the information is shared by a group rather than just presented to an individual (Hargreaves et al., 2013). Froehlich (2009) lists 10 display variables that could affect the utility of energy displays. Of particular relevance, here is the social comparison of energy use (e.g., you are using more than person X) and social sharing of energy use (e.g., on social networking sites) that are important for communal situations. According to Froehlich (2009), sharing one’s energy use with others may increase accountability and pressure to be energy efficient, whereas social comparisons might be counterproductive. There is currently, to our knowledge, no evidence linking people’s interactions around energy displays and their behavior changes in energy use. However, research in psychology on cooperation and the broader environmental literature has addressed these issues of knowing about other people’s behaviors and how this can influence one’s own behaviors. Within the broader environmental psychology literature, the positive influence of social or group norms on behavior is often noted (Cialdini et al., 1991; Cialdini, 2003; Thogersen, 2006). People are more likely to undertake sustainable behavior when encouraged by peers and when this behavior is visible to peers (Cialdini, 2003). For this reason, interaction and communication between people around energy may have benefits in encouraging energy conservation: if an individual can see others reducing their energy use, then they are more likely to do the same (Olli et al., 2001; Schultz et al., 2007; Heiskanen et al., 2010). Energy use feedback that illustrates energy conservation by others may therefore be particularly useful in encouraging others to do the same. However, this may not always be the case: research comparing energy use between households has found that this can be unpopular (IEA, 2005) or inefficient (Harries et al., 2013). Furthermore, people who already have a low consumption and a higher comparator level may actually increase their usage as a result (Brandon and Lewis, 1999; Fischer, 2008).
Energy sharing contexts (e.g., in a shared house or workplace) can imply cooperation around energy resources and thus, can add a further layer of complexity to these kinds of social influences. It is common that while energy is shared between users, the cost of this resource is often split equally or allocated on the basis of some other indicator (e.g., floor space). In such a context where several users are interacting, divergent motivations exist, where individual and social benefits differ for people to contribute less to, or to take more from the common good than others (Dawes, 1980; Komorita and Parks, 1995; Weber et al., 2004; Biel and Thogersen, 2007; Carlsson-Kanyama and Lindén, 2007). At a macro (world) level, energy resources can be thought of as a resource dilemma, where everyone takes from the common resource – energy – but it will be depleted if everyone takes too much too quickly (Komorita and Parks, 1995). At a micro, individual level, however, energy is usually not perceived as finite and use by one individual does not reduce availability to others. However, it may raise costs. Indeed, if people decide to share the costs equally, collective interests are to limit one’s use of energy to one’s fair share of it, whereas individual interests are to use more than one’s share and free-ride (Dawes, 1980; Balliet et al., 2011). Free-riding in this case is to use more energy than others, while still paying the same costs as others. Energy use in a shared situation, where costs are not charged on the basis of actual use, can therefore be considered a social dilemma (Dawes, 1980; Gächter and Herrmann, 2009). Importantly, a lack of cooperation is often felt as a barrier to conserving energy (EPRI, 2011) and individuals are likely to feel discouraged in their sustainability efforts if they feel like they are the only ones contributing (cf. the “drop in the ocean” feeling; Lorenzoni et al., 2007).
Indeed, evidence from behavioral economics and psychology shows that people often free-ride when resources are shared (Marwell and Ames, 1979; Dawes, 1980; Fehr and Fischbacher, 2003). A way to overcome free-riding effects is to give individuals an opportunity to monitor each other’s behavior by making actions more visible (Milinski et al., 2002a; Bateson et al., 2006; Hardy and Van Vugt, 2006; Iredale et al., 2008; Engel, 2011). Cooperation decreases as group size and anonymity increase (Hamburger et al., 1975) and conversely being able to identify or be identified as a free-rider can increase cooperation (Haley and Fessler, 2005) as it reassures individuals of fairness. Using more detailed displays of energy use provides an opportunity for people to monitor each other to maintain an optimal level in energy expenditure, potentially reducing overall energy use.
Strong reciprocity theory (SRT) predicts that people will reinforce fair, and punish unfair, behavior even if it implies sacrifice for themselves, in the hope that others will stop free-riding in the future (Gintis, 2000; Fehr et al., 2002; Gächter and Herrmann, 2009). Research has shown that individuals are willing to pay a cost (financial) to punish free-riders and that this use of punishment indeed increases cooperation levels (Fehr and Gächter, 2002; Fehr and Rockenbach, 2003). While such altruistic punishment behavior is reliably observed in the laboratory, criticisms of the SRT model are whether financial sanctions are applicable to real world dilemmas (Guala, 2012). In a “real world” situation, other types of high cost punishment are possible: for example, a direct confrontation comes at a high individual cost as one puts oneself in an uncomfortable situation. In fact, people have a range of sanction options and reactions: gossip and reputation damaging actions, institutionalized sanctions (police, taxes, etc.) (Balliet et al., 2011). The critics of the SRT have suggested that people might prefer indirect organizational sanctions over direct and costly personal sanctions (Guala, 2012). We suggest, it is important to consider ecologically valid reactions to a shared energy resource situation, where people can directly or indirectly sanction an individual for their uncooperative actions.
In addition, people’s emotional response to a non-cooperative situation may be a useful indicator of their likely reactions, both toward the free-rider and with regards to their own future behavior. Indeed, SRT highlights negative emotions toward a free-rider as one potential explanation for altruistic punishment responses (Fehr and Gächter, 2002). In the context of non-cooperation around energy use, potential emotional reactions could include anger or sadness, or even guilt, depending on how people interpret the situation and particularly how they perceive their coping possibilities (Scherer, 1997). For example, an individual may anticipate being accused of overusing energy and feel guilty even if they are not the individual who did overuse. Such emotional reactions were previously associated with different behavioral responses. For example, anger is linked with approach tendencies and, therefore, it may encourage people to confront the free-rider, whereas sadness and fear are characterized as avoidance emotions, and are more likely to deter people from confrontation (Carver, 2001; Carver and Harmon-Jones, 2009). Indeed, some evidence indicates that situations perceived as unfair trigger feelings of anger (Pillutla and Murnighan, 1996; Tabibnia et al., 2008), and in turn that anger is indeed associated with punishment of free-riders (Fehr and Gächter, 2002). Furthermore, in the context of energy sharing if people are not sure of how much energy they used themselves they may feel negative emotions such as fear or guilt, and are likely to reduce how much energy they will subsequently use (Elgaaied, 2012).
In the current study, we investigated, using scenarios, people’s reactions to energy sharing and how this was affected by information fed back on different types of energy display. We wanted to establish whether increasing the detail of information provided on the displays would affect people’s cooperation intentions around energy. Given previous research suggesting that the more anonymous the energy display is, the less people cooperate (Schuessler, 1989), we predicted that (1) with energy displays that provide less detailed information about individual energy use, people would be likely to intend to use more than their fair share of energy. Also, we hypothesized that (2) the type of energy displays viewed would affect some emotional reaction: in a situation where the display does not give enough information to identify the free-rider, people are likely to feel less angry toward the free-rider than if the display provides clear evidence that one person free rode. Finally, we expected that (3) the less information provided on an energy display, the less information people have on a potential free-rider, and therefore, the less likely they would want to punish a free-rider.
Materials and Methods
Design
We employed an experimental design using a series of scenarios in a large-scale survey to simulate different situations where electricity is shared between several people. We chose a common scenario in the UK: a situation in which the individual shares a house with other people and in which the cost of electricity is divided equally regardless of use. In each scenario, they have access to an energy display that provides information on either the overall electricity used by the house (average), similar to current displays being rolled out, or information on electricity used per individual, where individuals are either named (named) or kept anonymous (anonymous). These alternative displays were considered because they correspond to the current technological developments into finer grained monitoring of energy use, and represent a continuum of privacy. Half of all scenarios described a cooperative situation where people each used a similar amount of electricity (control). The other half described a non-cooperative situation where one person used more than their fair share of energy (free-riding). We measured emotional reactions to the situation, preferences for sanctions toward other users, and subsequent behavioral intentions for energy use.
Procedure
Participants were recruited via email advertisements sent to staff and postgraduate students in a range of departments of 28 universities across the United Kingdom (three departments declined to send the advertisement to their mailing list). We gained a final sample of 519, including 324 women and 195 men (Mage = 33.31, SD = 10.03). We obtained informed consent from all our participants. As a compensation for participation, email addresses were entered in a prize draw to win £50 in shopping vouchers. The study was run on Qualtrics Software. Participants were randomly assigned to one of six conditions in a 2 (situation: control vs. free-riding) × 3 (display: average vs. named vs. anonymous) between participants design. Participants first had to read a scenario describing a situation where they share the cost of domestic energy and where either one person uses more than their fair share (free-riding) or all use an equal amount (control). Within the scenarios, they were also shown one of three types of energy usage displays that, to varying degree, could identify who were free-riding. They then had to answer a series of questions about their understanding of the scenarios, their reactions to this situation, and how much energy they are likely to use in the future (see Ferguson et al., 2012 for a similar methodology). At the end of the questionnaire, participants were directed to a webpage that debriefed them on the procedure and aims of the study. The procedure and material of the present study were approved by the Ethics Committee of the School of Psychology, University of Nottingham, UK.
Materials
Scenarios and displays
All scenarios depicted a situation where the participant shared a house with three other people, he/she did not know before they moved in (a common situation in the UK). The average electricity use of the house was the same in all scenarios and the scenarios explained that the monthly bill was split equally (£20 each). In the control situation, the electricity bill showed that the same amount of electricity as the previous month was used and the bill was split fairly (£20 each). In the free-riding situation, more energy than average was used in the current month compared to the previous month, despite the efforts of the participant, so the display showed that one or more people had used more than their fair share of electricity over this period and the equally divided electricity costs were therefore unfair (£35 pounds).
Scenarios explained that the house was equipped with an energy monitor and display and the type of display differed between scenarios. In the average display conditions, the energy monitor placed in the house showed how much electricity was used in total in the whole house, so people could not see how much each housemate was using. In the anonymous display conditions, the energy monitor showed each individual’s usage, but the display was anonymized; that is, each name was replaced by a letter: A, B, C, or D, so participants did not know who was overusing or not, but were aware whether it was one or more people. In the named display conditions, the energy monitor showed each individual’s usage, providing their name under each amount (Figure 1).
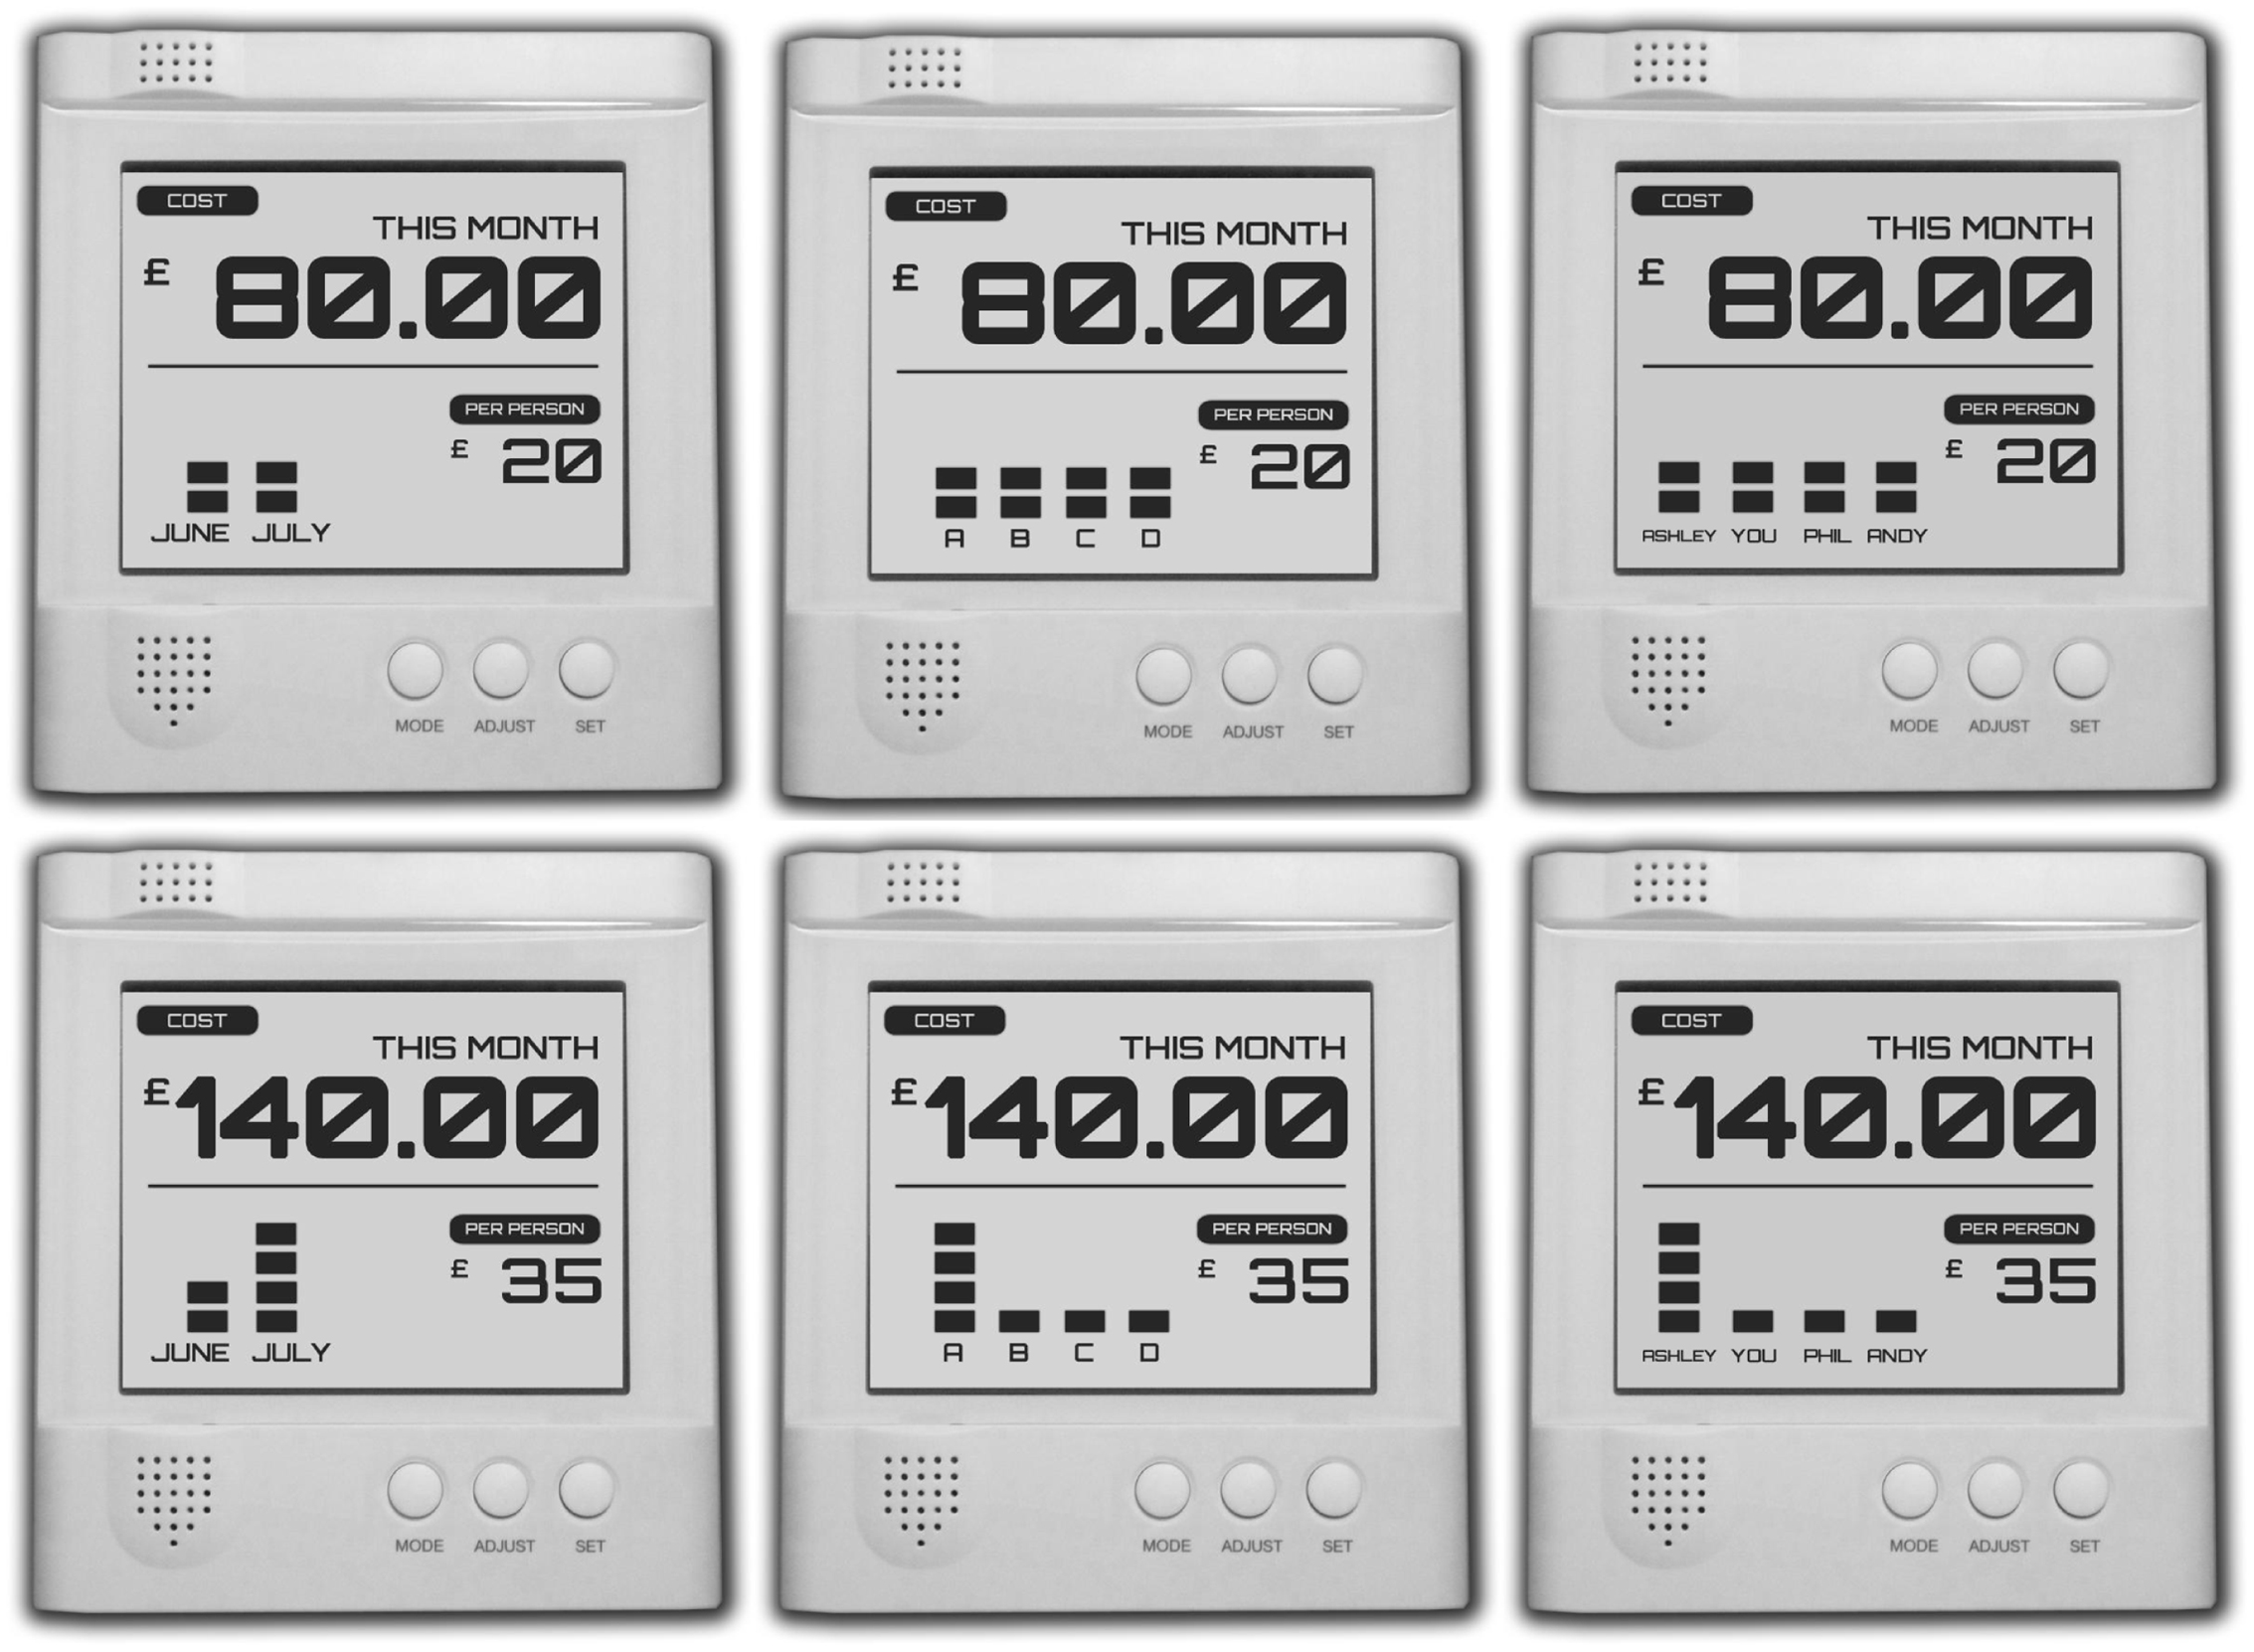
Figure 1. Energy displays used in the scenarios. On the upper line are the displays in the no free-riding conditions, on the lower line the displays in the free-riding conditions. And, from left to right on both lines: average displays, anonymous displays, and nominal displays.
Questionnaire
Questionnaire items included demographic measures (including gender, age, location, and socio-economic status), manipulation checks on the scenario read (including memory and understanding of the scenario), measures of reactions to the scenario presented and free-rider within the scenario, and amount of energy planned to be used the following month.
Emotional reactions. Emotional reactions to the scenario presented were measured among all participants with seven point Likert-type scales, which asked them to indicate their “feelings in this situation.” In addition, in the free-riding situations, they indicated on similar scales what their “feelings would be toward the person who used more electricity than everyone else, if (they) knew/know who they were/are.” Emotions examined were anger, gratitude, guilt, happiness, irritation, shame, surprise, annoyance, disappointment, fear, and hope. These items were selected from the Positive and Negative Affect Scale (PANAS, Watson et al., 1988) as representing possible reactions to free-riding and cooperation (Pillutla and Murnighan, 1996; Fehr and Gächter, 2002; Tabibnia et al., 2008). Note that, we did include positive reactions within the list, primarily to examine whether these would be higher within a cooperative situation compared to a free-riding situation.
Sanctions against free-riding. In the free-riding conditions only, participants were also asked to rate a list of nine possible sanctions and reactions in the situation. They were also asked to choose the one reaction, among these nine, that they would be most likely to use. The possible reactions were selected by a panel of four experts including two experts in behavioral economics, and two experts in energy research. These listed reactions that were negative toward the free-rider (e.g., “how likely would you be to gossip to your other housemates about them”) and some aimed at reducing the energy bill without sanctioning the free-rider per se (e.g., “would you investigate how much energy the different appliances in the house use and inform your housemates about it?”), see full list of potential reactions in Table 1. If participants wanted to add another reaction that was most likely, they could add it to the list.
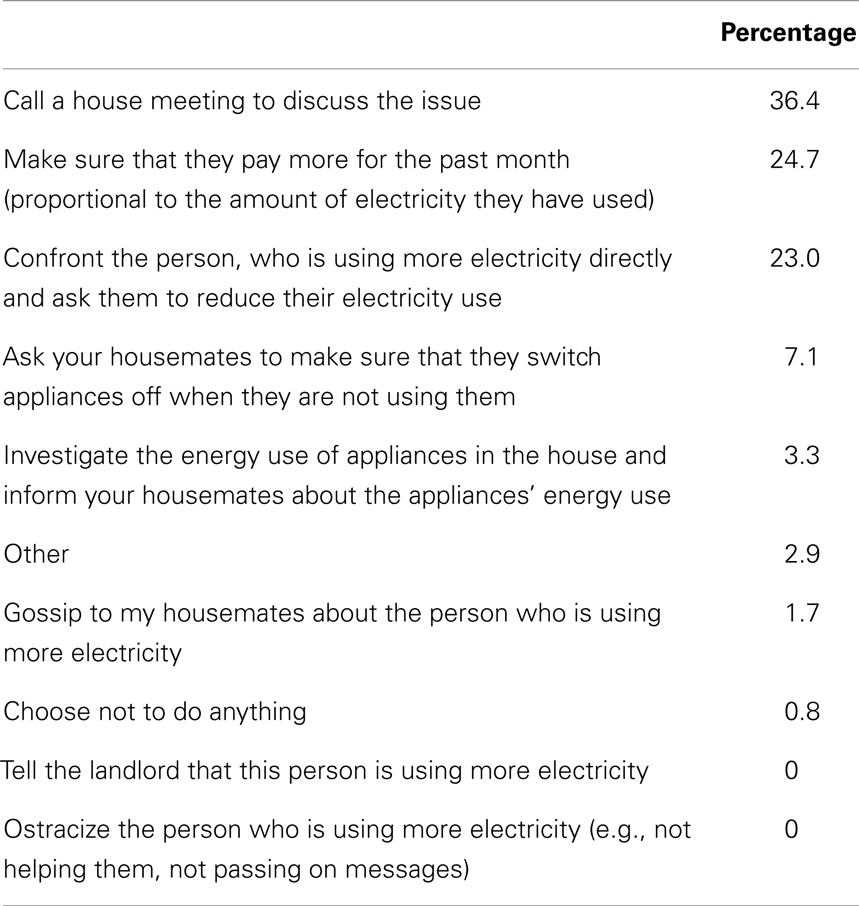
Table 1. Percentage of preference for each reaction to free-riding, across energy display type (N = 239).
Energy behavior. Finally, we asked participants whether they would decrease or increase their energy use in the following month. We used a five-point scale, with the following labels: “decrease your electricity use by a substantial amount,” “slightly decrease your electricity use,” “do not change your electricity use (keep at 180 kWh),” “slightly increase your electricity use,” and “increase your electricity use by a substantial amount.”
Results
Preliminary Analysis
For analyses, here we used participant data only for those who correctly answered manipulation check questions on understanding and remembering the scenario. Twenty-one participants were excluded from our sample leaving a final sample of 498 participants, of which 312 were women and 186 were men, with an age range of 20–65 (median age = 30; mean age = 33.4, SD = 10.09). Neither the gender, age, SES, nor the concern for energy use influenced the dependent variables nor the mechanisms described in the present research. Hence, they will not be further discussed in the present paper. Eighty-two percent of our sample had experienced sharing a house with non-family members.
Emotional Responses
To study the emotional reactions to free-riding, we conducted a between MANOVA with scenario (2: control or free-riding) as a fixed factor on the 11 emotional responses (anger, gratitude, guilt, happiness, irritation, shame, surprise, annoyance, disappointment, fear, and hope). The type of scenario significantly affected measures of emotions, F(11, 486) = 217.41, p < 0.001, . Notably, between participants ANOVAs show that in the free-riding scenario, people felt significantly less happy, F(1, 496) = 348.99, p < 0.001, , more angry, F(1, 496) = 1263, p < 0.001, , and more fearful, F(1, 496) = 115.67, p < 0.001, , than in the control scenario (Figure 2).
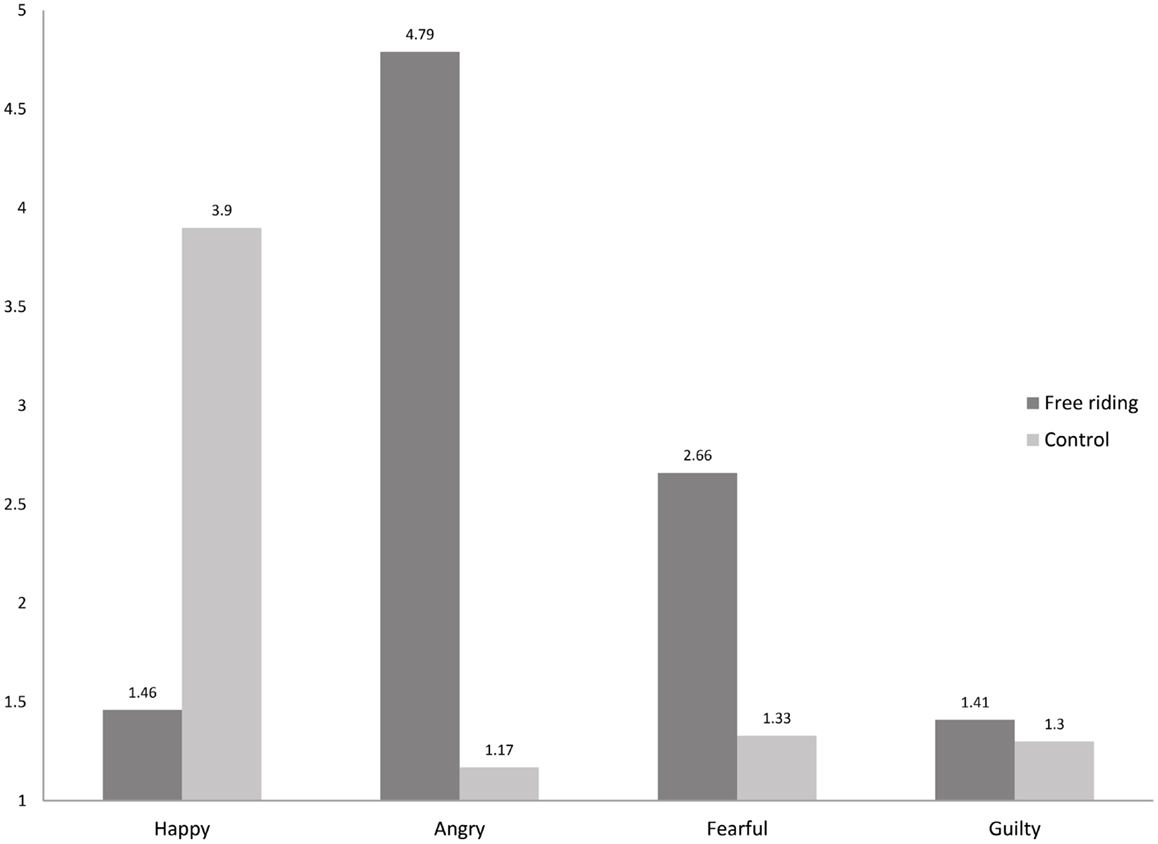
Figure 2. Means of positive and negative emotions in the free-riding and the control (no free-riding) conditions.
To study the effects of energy displays on people’s emotional reactions in the situation, we conducted a 2 × 3 between MANOVA with scenario type (2: control or free-riding) and display type (3: average, named or anonymous) as fixed factors on the 11 emotional responses. Results reveal an interaction effect between scenario type and display type on emotional reactions, F(11, 483) = 3.38, p < 0.001, . Notably, between participants effects reveal that people reacted with more anger to the free-riding situation the more details, they had about the free-rider (the less anonymous it was), F(2, 492) = 3.37, p < 0.05, . Interestingly, participants felt more guilty and fearful in the free-riding situation, the less details they had about the free-rider, F(2, 492) = 3.68, p < 0.05, and F(2, 492) = 5.38, p < 0.01, , respectively. Simple effects analyses revealed that the type of displays affected how guilty and fearful people felt when there was a free-rider only [F(2, 493) = 8.20, p < 0.001 and F(2, 493) = 8.99, p < 0.001, respectively]: people felt more guilty and fearful when there was a free-rider and the energy display was average. Finally, post hoc comparisons on feelings of fear and guilt (using Bonferroni corrections) reveal that the average display was significantly different from both anonymous (p < 0.001) and named (p < 0.01) displays but that anonymous and named displays were not significantly different from each other (Figure 3).
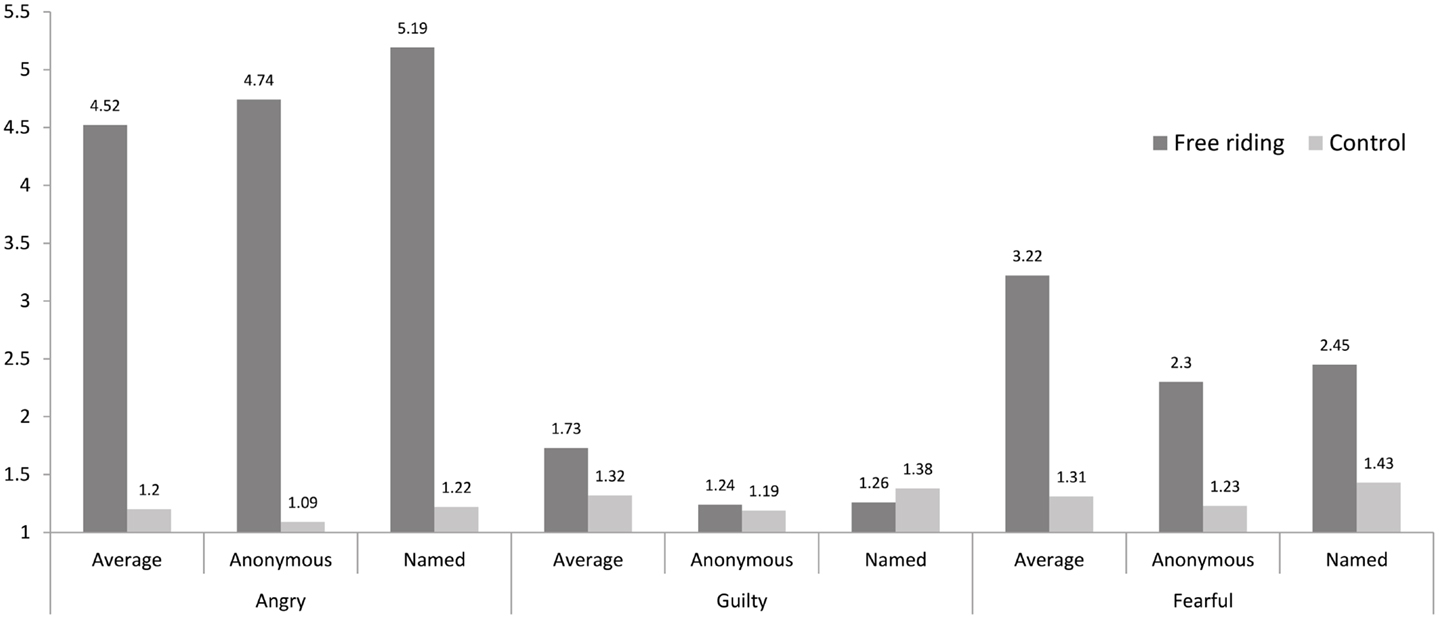
Figure 3. Effects of scenarios and display types on feelings of anger, guilt, and fear.
Reactions and Sanctions toward the Free-Rider
We also explored participants’ reactions in the free-riding situation (Table 1). The most common was to call for a house meeting; this was chosen by 36.4% of the sample. Making sure that the free-rider pays more for their share of electricity in the past month (24.7%) and confronting the person directly to ask them to reduce their electricity use (23%) was also chosen most frequently. Asking housemates to make sure that they switch appliances off when they are not using them was endorsed by 7.1%. Ostracizing was never chosen as the most likely reaction, and gossiping only by 1.8% of the sample. Interestingly, only 0.8% of the sample said that they would not do anything.
The type of electricity display participants viewed had a marginal influence on how people were likely to react and whether they wanted to sanction the free-rider, χ2 = 23.25 p = 0.056 (Figure 4). With the average display, people tended to be less likely to ask the free-rider to pay more (14.8%) than if they had been provided with information that only one person used too much energy (28.1 and 31.9% for anonymous and name displays, respectively). They were also more likely to choose reactions that were not punishing for the free-rider with an average display, such as asking people to make sure that they switch off the appliances (12.3%) compared to people who saw the anonymous or named displays (4.5 and 4.3%, respectively). Such results make intuitive sense given that in the average display scenarios the free-rider was less able to be identified.
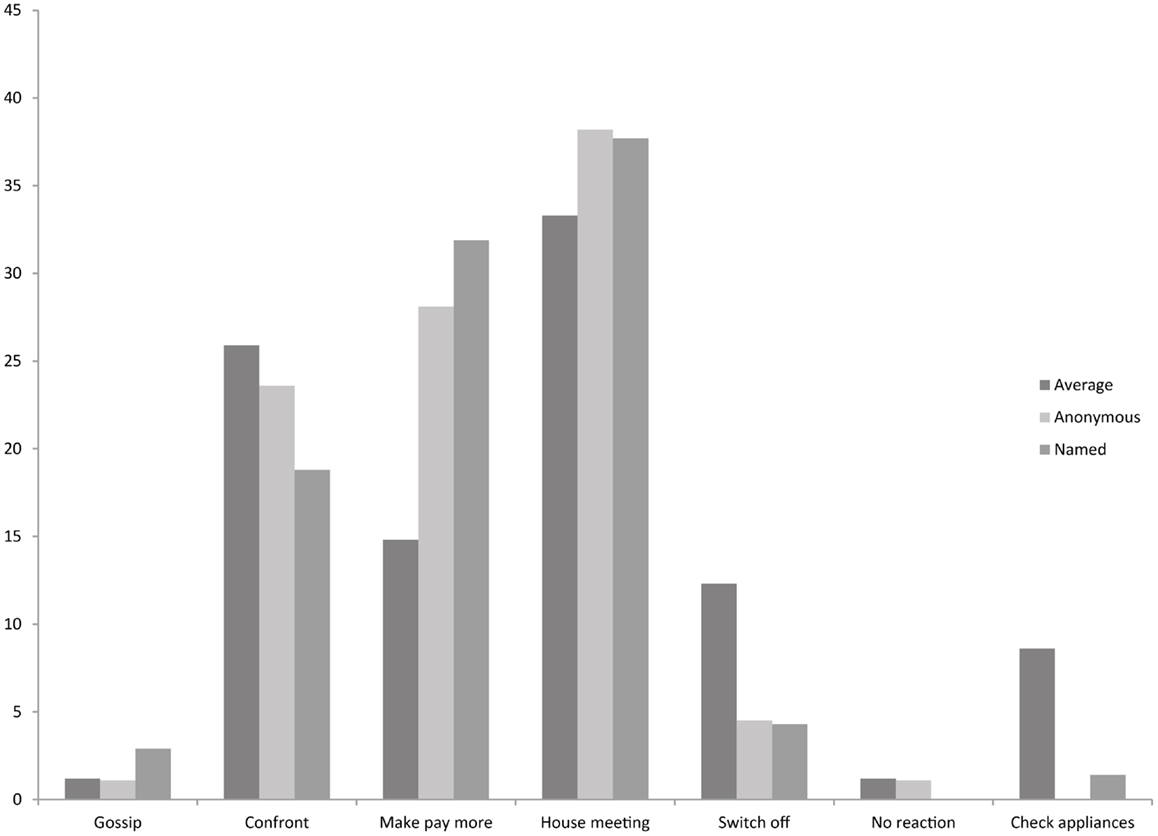
Figure 4. Percentage of preference for each reaction to free-riding as a function of type of display (the reactions that are not displayed were never chosen by participants).
Effects of Display on Energy Use Intentions
Participants, across all conditions, on average wanted to reduce their energy use for the following month [Muse = 2.56, SD = 0.6, t(497) = −16.37, p < 0.001; Cohen’s d = 1.47 for the difference to the midpoint of the scale]. To study the effects of engaging with different energy displays within different scenarios on people’s subsequent energy use intentions, we conducted a 2 (scenario: control or free-riding) × 3 (energy display: average, named or anonymous) between participants ANOVA. Results reveal a main effect of type of display, F(2, 492) = 3.66, p < 0.05, . Post hoc test using Bonferroni corrections reveal that people intended to reduce their energy usage more during the following month when engaging with an average display (Muse = 2.45, SD = 0.65) than with the two other types of display: anonymous (Muse = 2.60, SD = 0.58) and named (Muse = 2.62, SD = 0.57). Scenario type had no main or interaction effect on subsequent energy use intentions: the average display resulted in greater intentions to reduce energy use than other types of display in both free-riding and control scenarios.
Mediation of Emotional Reactions
We further investigated the processes underlying the effects of free-riding and of type of display on how much energy people want to use the following month and whether these effects only occurred in a free-riding situation (moderation by situation). Specifically, we investigated the role of emotional responses in the situation. To do this, we combined moderation and mediation analyses. Mediation analyses posit how independent variables (free-riding and energy displays) affect a dependent variable (energy use) through one or more potential intervening variables, or mediators (emotional responses), and multiple mediation is the simultaneous mediation by multiple variables. Moderation analysis focuses on factors that affect the strength or direction of the relation between the independent and dependent variables (Muller et al., 2005). We conducted a multiple moderated mediation analysis using the product of coefficient method recommended by Hayes (2013), with the type of energy display (average, anonymous, or named) as an independent variable, situation (free-riding vs. control) as a moderating variable, energy use as the dependent variable, and feelings of guilt and fear as mediators, see Figure 5. The situation variable was coded as follows: 0.5 when there was a free-rider and −0.5 in the control condition. The display variable was coded as follows: the average display −0.5, the anonymized display 0, and the named display 0.5. The mediating variables, fear and guilt, were mean centered.
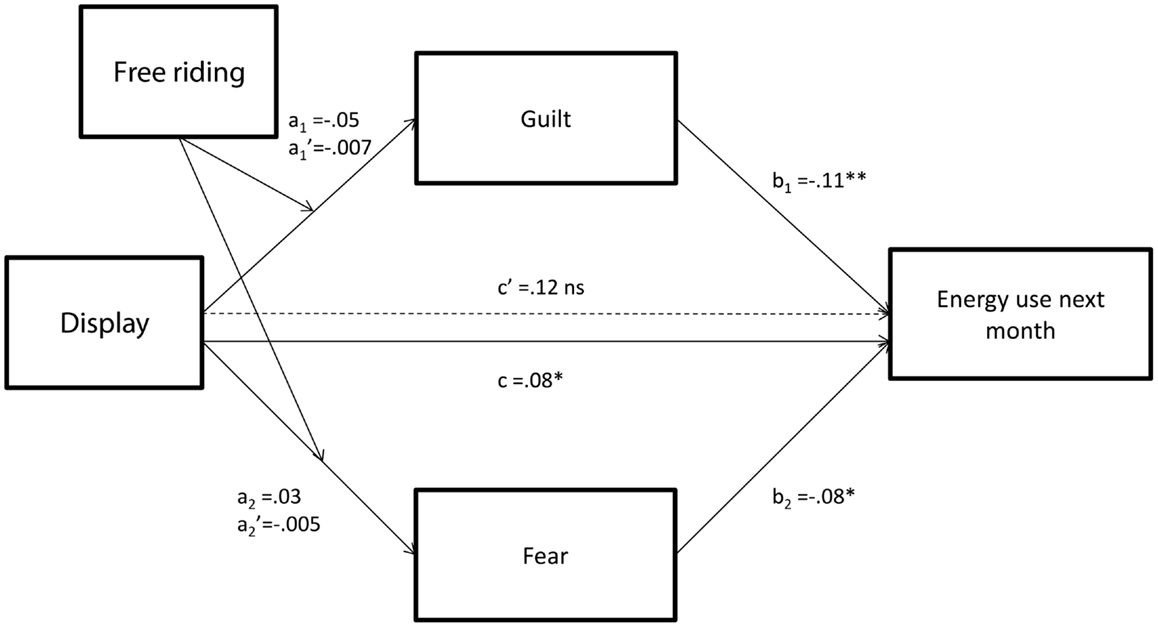
Figure 5. Direct and indirect effects of the type of display on energy use intention the following month. Unstandardized coefficients are presented. Displays were coded as: average = −0.5, anonymized = 0, and named = 0.5. Situation was coded as: free-rider = 0.5 and control = −0.5. a1 and a2 represent the effects of the type of display on emotions when there is a free-rider, and , its effects in the control condition. b1 and b2 represent the direct effects of emotions on the amount of energy people want to use the following month, and c and c′, respectively the direct effects and residual effects of the type of display on energy use intention the following month. *p < 0.05, **p < 0.01.
We have already showed that display and situation affected feelings of fear and guilt, so that people felt more fear and guilt when they saw the average display. This analysis reveals that guilt, B = −0.11, t(496) = −3.55, p < 0.01 and fear, B = −0.08, t(496) = −2.32, p < 0.05 mediate the effects of the displays on energy use intention, R2 = 0.06, F(3, 494) = 9.98, p < 0.001 for the indirect effects. The residual effect of displays on energy use is non-significant, B = 0.12, t(496) = 1.88, p = 0.06. The effect of the type of display on emotions of fear and guilt is moderated by the situation: details on the display reduce fear and guilt more when there is a free-rider than in the control condition, B = −0.93, t(494) = −3.07, p < 0.01 and B = −0.55, t(494) = −2.81, p < 0.01, respectively for the interaction effects on fear and guilt. So overall, the mediation effect is moderated by the situation, so that the effects of energy display on energy use are more strongly mediated by negative feelings of fear and guilt when there is a free-rider, B = 0.03 (CI0.95 = 0.005–0.09) and B = 0.05 (CI0.95 = 0.02–0.11), respectively for fear and guilt, than in the control condition, B = −0.005 (CI0.95 = −0.02–0.004) ns, and B = −0.007 (CI0.95 = −0.05–0.03) ns, respectively for fear and guilt (see Figure 5). This pattern of results show that the type of energy display affected intentions of energy use through its effects on emotional responses: it is through increased feelings of guilt and fear that the average display encouraged people to decrease their intention to use energy the following month (more than with other types of display). It also shows that this indirect effect is more important when there is a free-rider than when there is no free-rider.
Discussion
Our research is one of few studies that systematically compare how different kinds of energy information on monitors may affect users and energy behavior intentions. This research is also the first of its kind (to our knowledge) to consider the ways that individuals interact around energy as a shared resource. Furthermore, the role of emotional reactions in this context and their effects on decision making had not been investigated until now. We find that the way people intend to use energy depends critically on how they think others use energy, which is in line with research on social norms (Cialdini et al., 1991; Cialdini, 2003) highlighting the importance of social context in energy use. More specifically, our research shows that in a shared energy situation, a typical energy display (which displays overall energy usage) seems to lead to the greatest reductions in energy use intentions due to emotional reactions of fear and guilt of overusing energy, in comparison to displays that give more detail of energy use.
We explored free-riding, where people use more than their fair share of energy, as a common everyday scenario, and found that the type of display had a significant effect on how people responded to the same situations – when one of their household members is found to use more energy than was agreed previously and was used by the others. With average displays that did not identify who overused energy, participants were more likely to choose non-punishing reactions, such as checking that appliances were switched off and asking others to do the same. With displays that provided more information about the free-rider, people were more likely to choose sanctions that were directed at an individual, such as asking the individual who had overused to pay more for their electricity use.
The information on the display also influenced emotional responses and subsequent intentions to use energy. The less information participants had from the energy display, the guiltier and the more fearful they felt when too much energy had been used. Conversely, the more information that people received from the display and the more, they could identify who had used too much energy, the angrier they felt when too much energy had been used. Interestingly, no matter whether someone had used more than their fair share of energy or not, less informative (average) displays were more likely to result in participants suggesting that they would subsequently reduce their energy use. This response was driven by feelings of fear and guilt. However, more informative displays did mean that participants were more likely to identify and sanction others who were overusing.
Display and Energy Use
Our data indicate key differences in the way that people react to different energy information both in standard energy sharing situations and in free-riding scenarios. With common displays that provide an overall energy reading (and possibly historical reading) and do not allow determining where energy has been overused, people tend to indicate that they will subsequently use less energy than those people who view more detailed displays. Although previous research has indicated that some form of cooperation has been observed in situations of anonymity (Schuessler, 1989; Fehr and Gächter, 2002), generally cooperation in such situations was lower than in situations where participants could be identified (Andreoni and Petrie, 2004; Rege and Telle, 2004). Here, we observe the opposite: we find that displays with less information (average) tend to increase cooperation intentions. The mediation analyses reveal that this effect is due to emotional responses of fear and guilt. The less information participants have about energy users’ identity, the more guilty, and fearful, they feel. Subsequently, people intend to use energy according to these emotional reactions: the more guilty and fearful they feel, the more they intend to reduce their energy use. So, whereas previous research showed that anonymity would reduce cooperation, here anonymity, because it increases people’s fear and guilt, encourages cooperation (i.e., reduction of energy use). These findings are in line with previous research that finds that guilt increases cooperation, particularly for pro-self oriented people (Ketelaar and Au, 2003; de Hooge et al., 2007; Nelissen et al., 2007). However, our findings are at odds with previous research showing that fear decreases cooperation (Nelissen et al., 2007). We propose that differences may arise with respect to what feelings of fear relate to. In previous studies, fear and guilt were directly manipulated, and it is unclear how they were interpreted by the participants. In the current study, we also did not examine what our participants felt afraid of. Fear may therefore have differing effects depending on what it is related to. For example, in our study, people might feel fear being considered as the free-rider or not having enough money to pay the bill, so they decide to cooperate and intend to reduce their energy use in the future. In previous studies, they may have been afraid of other people not cooperating, and hence, decide to not cooperate themselves. In addition, fear may interact with some other aspect of the study to determine behavioral effects. Indeed, it has previously been noted that fear interacts with perceived control over behavior, so that when people feel empowered to take action, fear is more effective in promoting that action (Witte and Allen, 2000). Clearly, the relationship between fear and cooperation is more complex than previously thought and should be examined in more depth in future research.
It is still to be established why people feel more guilt and fear when presented with an average display compared to more detailed displays in a free-riding scenario. One explanation is that they think that other people in the house might suspect them to be the person who has been free-riding. Another explanation is that they think that they may really have been the person who was free-riding and did use more than their fair share of energy. Without any information or proof on each person’s use, there is uncertainty over everyone’s use, as well as their own. It is also possible that participants felt empathy for the free-rider and as consequence of expecting the free-rider to feel fear and guilt; it increased their own feelings of guilt and fear. These possibilities are in line with Rawls’ theory of justice where people are put in a “veil of ignorance” (Rawls, 1971). According to his theory, if people know nothing about their position or abilities in a group or society, they will make their decision from the perspective of all members (the worst-off as well as the best-off). Here, participants presented with an average display might decide to reduce their energy use because it would be the best option for everyone, whatever their actual energy use is or was the previous month, if the common goal is to keep the bill under a certain amount. In such a context, the “veil of ignorance” would then encourage actual communal sharing as a model in the group, rather than “equality matching” where people keep track of imbalances and act accordingly (Fiske, 1992).
Preferred Sanctions on Energy Overuse
Our research is the first to test the hypotheses of altruistic punishment in the context of energy use. Common reactions to free-riding in an energy situation here were to confront the person who was overusing and ask them to pay more. This supports previous psychological research on altruistic punishment that finds that people will punish free-riders, even at a high cost (discomfort) to themselves (Fehr and Gächter, 2002; Fehr et al., 2002; Fehr and Rockenbach, 2003; Balliet et al., 2011). However, the most common potential reaction choice in a free-riding situation was to organize a house meeting and discuss the problem. This is consistent with experimental work showing that people prefer centralized over individualized punishment regimens (Gürerk et al., 2006; Baldassarri and Grossman, 2011; Traulsen et al., 2012). Note that, it is possible that this reaction was, in part due to the characteristics of the population sample examined; our participants were all university staff and postgraduates and therefore, might be slightly more moderate than the general UK population (Zipp and Fenwick, 2006).
The information that a participant viewed on the display also had a significant impact on their anger and their preferred sanction for a free-rider. Given that anonymous and named displays provided more information about where energy was being overused, it is perhaps unsurprising that in these scenarios, participants were angrier and more likely to directly ask the individual to pay more. This shows that people are likely to use this strategy where possible, however, that the additional information provided by more detailed displays may be useful in enabling this preferred strategy. We also note, however, that the increased visibility of energy use provided by more detailed displays may help to increase cooperative behavior by reducing the likelihood of free-riding in the first place (Haley and Fessler, 2005).
Practical Implications
Our findings have important implications for the ongoing rollout of smart meters and associated displays across western countries, for other energy sharing situations, e.g., virtual power plants, and for the continuing development of energy monitoring technologies. Indeed, average energy displays (that display overall energy use) are currently being rolled out in the UK and in many other western countries, so it is important to compare the utility of these with more detailed energy displays that are becoming available. Our research indicates that average displays actually appear to encourage people to reduce their energy use more than more detailed displays. However, in situations where energy use is unequal or unfair, i.e., when somebody is free-riding, they may also increase potentially negative emotions such as fear and guilt that could have detrimental effects on further interactions. Detailed displays may be less useful in encouraging personal behavior change but may be more useful in monitoring others’ behavior. We note that more detailed displays provoke the negative emotion of anger that also could be detrimental for further interactions. Viewing more detailed displays also means that people are more likely to intend to take direct actions and want to ask others who overuse energy to pay more. This can be a powerful way of reducing overall energy usage. Increased visibility may also be an effective tool in instigating initial cooperative actions and maintaining a reduced energy usage (Haley and Fessler, 2005). We propose that research that considers repeated social interactions of the kind studied here will be useful in further considering behavioral responses to energy displays implemented. Our results suggest that detailed information on displays may be less useful in encouraging personal behavior change in this context; however, it is possible that more detailed displays are more helpful for occasional reference or at a managerial level in business use than for a mass audience for everyday use. This idea is also supported by the fact that more detailed displays facilitate direct sanctions intentions, though, it is important also to consider preferences for whether sanctions should be imposed informally or by an external agent. This should be investigated in further research where context (e.g., residential, workplace) is also explored in more depth.
Limitations
Our study used hypothetical scenarios of energy sharing instead of real life situations of energy use in a group (e.g., in a house or in the workplace). This type of design, while allowing us to control for interfering factors (e.g., the number of free-riders, or the extent to which people sharing the energy know each other) limits the extent to which, we can generalize our results. Most importantly, in real life, people might be more motivated to save energy and costs than in a scenario. Also, in reality, it is still difficult to measure accurately individual energy use: energy use per appliance is becoming more common, but a part of energy can be used “as a group” (e.g., heating in a common room). Furthermore, we used self-reports of behavior preferences and intentions rather than actual sanction reactions or energy use, and these are not always well aligned with actual behavior (Paulhus and John, 1998; John and Benet-Martinez, 2000). In particular, energy use is difficult to monitor and to control for individuals, so intentions to reduce energy may diverge somewhat from actual energy use. We also note that sanctions and negative emotions can be particularly affected by impression management and self-deceptive enhancement, as people may be reluctant to admit to certain actions, particularly gossiping or ostracizing. An interesting further study would be to ask participants in the laboratory to share a real amount of energy, and to look at real reactions to a confederate free-riding or to explore sharing behavior in a real energy situation with energy feedback provided. Finally, we note that while we used a large sample of participants, this sample was not nationally representative of the UK population. Our sample was drawn from a sample of university staff and postgraduates students and therefore may have distinct characteristics, e.g., more liberal in views, which could have influenced their reactions in the scenarios. In addition, respondents may be more cooperative than others, given that they were willing to help with this research. However, given that sample characteristics were constant between different scenarios and conditions, these could not account for the differences we found between groups.
Conclusion
To conclude, we find that different information on energy displays provoke significantly different responses from people that must be taken into account when implementing energy monitoring technologies. Average displays appear to result in most people reducing their personal energy use and therefore may be the most useful design for a mass rollout in shared spaces. However, research has shown that cooperation was increased particularly where regulation and sanctions were available to ensure and reassure participants of mutually beneficial behavior (Alexander and Christia, 2011). Hence, more detailed displays that are more useful in implementing sanctions, may be more useful for occasional and managerial consultation. We find that social interactions around energy are important in determining personal reactions and energy use and therefore further research in this field should consider the social context around energy displays.
Conflict of Interest Statement
The authors declare that the research was conducted in the absence of any commercial or financial relationships that could be construed as a potential conflict of interest.
Acknowledgments
The authors would like to thank Dr. Ben Bedwell for his help with the design of the material of the study, and Eryk Walczak for his contribution to the data collection. This research was supported by Horizon Digital Economy Research, RCUK grant (EP/G065802/1) and by a research grant from the Engineering and Physical Sciences Research Council (EP/K002589/1).
References
Abrahamse, W., Steg, L., Vlek, C., and Rothengatter, T. (2005). A review of intervention studies aimed at household energy conservation. J. Environ. Psychol. 25, 273–291. doi: 10.1016/j.jenvp.2005.08.002
Alexander, M., and Christia, F. (2011). Context modularity of human altruism. Science 334, 1392–1394. doi:10.1126/science.1202599
Anderson, W., and White, V. (2009). Exploring Consumer Preferences for Home Energy Display Functionality (Bristol: Centre for Sustainable Energy), 1–50.
Andreoni, J., and Petrie, R. (2004). Public goods experiments without confidentiality: a glimpse into fund-raising. J. Public Econ. 88, 1605–1623. doi:10.1016/S0047-2727(03)00040-9
Baldassarri, D., and Grossman, G. (2011). Centralized sanctioning and legitimate authority promote cooperation in humans. Proc. Natl. Acad. Sci. U.S.A. 108, 11023–11027. doi:10.1073/pnas.1105456108
Balliet, D., Mulder, L. B., and Van Lange, P. A. (2011). Reward, punishment, and cooperation: a meta-analysis. Psychol. Bull. 137, 594–615. doi:10.1037/a0023489
Bateson, M., Nettle, D., and Roberts, G. (2006). Cues of being watched enhance cooperation in a real-world setting. Biol. Lett. 2, 412–414. doi:10.1098/rsbl.2006.0509
Berg-Insight. (2011b). Smart Metering in North America and Asia-Pacific. M2M Research. Gothenburg: Berg Insight, 30–33.
Biel, A., and Thogersen, J. (2007). Activation of social norms in social dilemmas: a review of the evidence and reflections on the implications for environmental behaviour. J. Econ. Psychol. 28, 93–112. doi:10.1016/j.joep.2006.03.003
Brandon, G., and Lewis, A. (1999). Reducing household energy consumption: a qualitative and quantitative field study. J. Environ. Psychol. 19, 75–85. doi:10.1006/jevp.1998.0105
Broms, L., Katzeff, C., Bång, M., Nyblom, Å., Hjelm, S. I., and Ehrnberger, K. (2010). “Coffee maker patterns and the design of energy feedback artefacts,” in 8th ACM Conference on Designing Interactive Systems (Aarhus, Denmark: ACM), 93–102.
Carlsson-Kanyama, A., and Lindén, A. L. (2007). Energy efficiency in residences – challenges for women and men in the North. Energy Policy 35, 2163–2172. doi:10.1016/j.enpol.2006.06.018
Carver, C. S. (2001). Affect and the functional bases of behavior: on the dimensional structure of affective experience. Pers. Soc. Psychol. Rev. 5, 345–356. doi:10.1207/S15327957PSPR0504_4
Carver, C. S., and Harmon-Jones, E. (2009). Anger is an approach-related affect: evidence and implications. Psychol. Bull. 135, 183–204. doi:10.1037/a0013965
CCC. (2013). Meeting Carbon Budgets – 2013 Progress Report to Parliament. London: Committee on Climate Change.
Cialdini, R. B. (2003). Crafting normative messages to protect the environment. Curr. Dir. Psychol. Sci. 12, 105–109. doi:10.1111/1467-8721.01242
Cialdini, R. B., Kallgren, C. A., and Reno, R. R. (1991). A focus theory of normative conduct: a theoretical refinement and reevaluation of the role of norms in human behavior. Adv. Exp. Soc. Psychol. 24, 201–234. doi:10.1016/S0065-2601(08)60330-5
Darby, S. (2006a). The Effectiveness of Feedback on Energy Consumption: A Review for DEFRA of the Literature on Metering, Billing and Direct Displays. Oxford: Environmental Change Institute.
Darby, S. (2006b). Social learning and public policy: lessons from an energy-conscious village. Energy Policy 34, 2929–2940. doi:10.1016/j.enpol.2005.04.013
Dawes, R. M. (1980). Social dilemmas. Annu. Rev. Psychol. 31, 169–193. doi:10.1146/annurev.ps.31.020180.001125
de Hooge, I. E., Zeelenberg, M., and Breugelmans, S. M. (2007). Moral sentiments and cooperation: differential influences of shame and guilt. Cogn. Emot. 21, 1025–1042. doi:10.1080/02699930600980874
DECC. (2011). UK Climate Change Sustainable Development Indicator: 2010 Greenhouse Gas Emissions, Provisional Figures and 2009 Greenhouse Gas Emissions by Fuel Type and End User. London: H. Gov.
Department of Communities and Local Government. (2009). Commercial and Industrial Floorspace and Rateable Value Statistics. UK National Statistics.
Elgaaied, L. (2012). Exploring the role of anticipated guilt on pro-environmental behavior-A suggested typology of residents in France based on their recycling patterns. J. Consum. Mark. 29, 369–377. doi:10.1108/07363761211247488
Engel, C. (2011). Dictator games: a meta study. Exp. Econ. 14, 583–610. doi:10.1007/s10683-011-9283-7
EPRI. (2011). Consumer Engagement: Facts, Myths and Motivations. Palo Alto, CA: Electric Power Research Institute.
Faruqui, A., Sergici, S., and Sharif, A. (2010). The impact of informational feedback on energy consumption – a survey of the experimental evidence. Energy 35, 1598–1608. doi:10.1016/j.energy.2009.07.042
Fehr, E., and Fischbacher, U. (2003). The nature of human altruism. Nature 425, 785–791. doi:10.1038/nature02043
Fehr, E., Fischbacher, U., and Gächter, S. (2002). Strong reciprocity, human cooperation and the enforcement of social norms. Hum. Nat. 13, 1–25. doi:10.1007/s12110-002-1012-7
Fehr, E., and Gächter, S. (2002). Altruistic punishment in humans. Nature 415, 137–140. doi:10.1038/415269a
Fehr, E., and Rockenbach, B. (2003). Detrimental effects of sanctions on human altruism. Nature 422, 137–140. doi:10.1038/nature01474
Ferguson, E., Taylor, M., Keatley, D., Flynn, N., and Lawrence, C. (2012). Blood donors’ helping behavior is driven by warm glow: more evidence for the blood donor benevolence hypothesis. Transfusion 52, 2189–2200. doi:10.1111/j.1537-2995.2011.03557.x
Fischer, C. (2008). Feedback on household electricity consumption: a tool for saving energy? Energy Efficiency 1, 79–104. doi:10.1007/s12053-008-9009-7
Fiske, A. P. (1992). The four elementary forms of sociality: framework for a unified theory of social relations. Psychol. Rev. 99, 689–723. doi:10.1037/0033-295X.99.4.689
Froehlich, J. (2009). “Promoting energy efficient behaviors in the home through feedback: The role of human-computer interaction,” in HCIC’09 Workshop. Fraser, CO.
Froehlich, J., Larson, E., Gupta, S., and Cohn, G. (2011). Disaggregated end-use energy sensing for the smart grid. IEEE Pervasive Comput. 2011, 28–39. doi:10.1109/MPRV.2010.74
Gächter, S., and Herrmann, B. (2009). Reciprocity, culture and human cooperation: previous insights and a new cross-cultural experiment. Philos. Trans. R. Soc. Lond. B Biol. Sci. 364, 791–806. doi:10.1098/rstb.2008.0275
Gintis, H. (2000). Strong reciprocity and human sociality. J. Theor. Biol. 206, 169–179. doi:10.1006/jtbi.2000.2111
Guala, F. (2012). Reciprocity: weak or strong? What punishment experiments do (and do not) demonstrate. Behav. Brain Sci. 35, 1–59. doi:10.1017/S0140525X11000069
Gürerk, O., Irlenbusch, B., and Rockenbach, B. (2006). The competitive advantage of sanctioning institutions. Science 312, 108–111. doi:10.1126/science.1123633
Haley, K. J., and Fessler, D. M. T. (2005). Nobody’s watching? Subtle cues affect generosity in an anonymous economic game. Evol. Hum. Behav. 26, 245–256. doi:10.1016/j.evolhumbehav.2005.01.002
Hamburger, H., Guyer, M., and Fox, J. (1975). Group size and cooperation. J. Conflict Resolut. 19, 503–531.
Hardy, C. L., and Van Vugt, M. (2006). Nice guys finish first: the competitive altruism hypothesis. Pers. Soc. Psychol. Bull. 32, 1–12. doi:10.1177/0146167206291006
Hargreaves, T., Nye, M., and Burgess, J. (2010). Making energy visible: a qualitative field study of how householders interact with feedback from smart energy monitors. Energy Policy 38, 6111–6119. doi:10.1016/j.enpol.2010.05.068
Hargreaves, T., Nye, M., and Burgess, J. (2013). Keeping energy visible? Exploring how householders interact with feedback from smart energy monitors in the longer term. Energy Policy 52, 126–134. doi:10.1016/j.enpol.2012.03.027
Harries, T., Rettie, R., Studley, M., Burchell, K., and Chambers, S. (2013). Is social norms marketing effective?: A case study in domestic electricity consumption. Eur. J. Mark. 47, 1458–1475. doi:10.1108/EJM-10-2011-0568
Hayes, A. F. (2013). An Introduction to Mediation, Moderation, and Conditional Process Analysis: A Regression-Based Approach. New York: Guilford Press.
Heiskanen, E., Johnson, M., Robinson, S., Vadovics, E., and Saastamoinen, M. (2010). Low-carbon communities as a context for individual behavioural change. Energy Policy 38, 7586–7595. doi:10.1016/j.enpol.2009.07.002
Hutton, R. B., Mauser, G. A., Filiatrault, P., and Ahtola, O. T. (1986). Effects of cost related feedback on consumer knowledge and consumption behaviour: a field experiment approach. J. Consum. Res. 13, 327–336. doi:10.1086/209072
IEA. (2005). “International Energy Agency demand-side management programme,” in Task XI: Time of use Pricing and Energy use for Demand Management Delivery, Subtask 1 Report: Smaller Customer Energy Saving by End use Monitoring and Feedback. Chester, UK: EA Technology.
Iredale, W., Van Vugt, M., and Dunbar, R. (2008). Showing off in humans: male generosity as a mating signal. Evol. Psychol. 6, 386–392.
Janda, K. B. (2011). Buildings don’t use energy: people do. Archit. Sci. Rev. 54, 15–22. doi:10.3763/asre.2009.0050
John, O. P., and Benet-Martinez, V. (2000). “Measurement: reliability, construct validation, and scale construction,” in Handbook of Research Methods in Social and Personality Psychology, eds H. T. Reis and C. M. Judd (Cambridge: Cambridge University Press), 339–369.
Ketelaar, T., and Au, W. T. (2003). The effects of feelings of guilt on the behaviour of uncooperative individuals in repeated social bargaining games: an affect-as-information interpretation of the role of emotion in social interaction. Cogn. Emot. 17, 429–453. doi:10.1080/02699930143000662
Lorenzoni, I., Nicholson-Cole, S., and Whitmarsh, L. (2007). Barriers perceived to engaging with climate change among the UK public and their policy implications. Glob. Environ. Change 17, 445–459. doi:10.1016/j.gloenvcha.2007.01.004
Marwell, G., and Ames, R. E. (1979). Experiments on the provision of public goods I: resources, interest, group size, and the free rider problem. Am. J. Sociol. 85, 926–937. doi:10.1086/227094
Milinski, M., Semmann, D., and Krambeck, H. J. (2002a). Donor to charity gain in both indirect reciprocity and political reputation. Proc. R Soc. Lond. B Biol. Sci. 269, 881–883. doi:10.1098/rspb.2002.1964
Milinski, M., Semmann, D., and Krambeck, H. J. (2002b). Reputation helps solve the ‘tragedy of the commons’. Nature 415, 424–426. doi:10.1038/415424a
Muller, D., Judd, C. M., and Yzerbyt, V. Y. (2005). When moderation is mediated and mediation is moderated. J. Pers. Soc. Psychol. 89, 852–863. doi:10.1037/0022-3514.89.6.852
Nelissen, R. M., Dijker, A. J., and deVries, N. K. (2007). How to turn a hawk into a dove and vice versa: interactions between emotions and goals in a give-some dilemma game. J. Exp. Soc. Psychol. 43, 280–286. doi:10.1016/j.jesp.2006.01.009
Norman, D. A. (2000). “The design challenge,” in The Design of Everyday Things, ed. D. Norman (London: MIT Press), 141–187.
Nowak, M. A., and Sigmund, K. (1998). Evolution of indirect reciprocity by image scoring. Nature 393, 573–577. doi:10.1038/31225
Olli, E., Grendstad, G., and Wollebaek, D. (2001). Correlates of environmental behaviors: bringing back social context. Environ. Behav. 33, 181–208. doi:10.1177/00139160121972945
Paulhus, D. L., and John, O. P. (1998). Egoistic and moralistic biases in self-perception: the interplay of self-deceptive styles with basic traits and motives. J. Pers. 66, 1025–1060. doi:10.1111/1467-6494.00041
Pillutla, M. M., and Murnighan, J. K. (1996). Unfairness, anger, and spite: emotional rejections of ultimatum offers. Organ. Behav. Hum. Decis. Process 68, 208–224. doi:10.1006/obhd.1996.0100
Raw, G. J., and Ross, D. I. (2011). Energy Demand Research Project: Final Analysis. London, UK: Office of Gas and Electricity Markets.
Rege, M., and Telle, K. (2004). The impact of social approval and framing on cooperation in public good situations. J. Public Econ. 88, 1625–1644. doi:10.1016/S0047-2727(03)00021-5
Scherer, K. R. (1997). Profiles of emotion antecedent appraisal: testing theoretical predictions across cultures. Cogn. Emot. 11, 113–150. doi:10.1080/026999397379962
Schuessler, R. (1989). Exit threats and cooperation under anonymity. J. Conflict Resolut. 33, 728–749. doi:10.1177/0022002789033004007
Schultz, P. W., Nolan, J. M., Cialdini, R. B., Goldstein, N. J., and Griskevicius, V. (2007). The constructive, destructive, and reconstructive power of social norms. Psychol. Sci. 18, 429–434. doi:10.1111/j.1467-9280.2007.01917.x
Small, D. A., and Loewenstein, G. (2005). The devil you know: the effects of identifiability on punishment. J. Behav. Decis. Mak. 18, 311–318. doi:10.1002/bdm.507
Strengers, Y. A. (2011). “Designing eco-feedback systems for everyday life,” in SIGCHI Conference on Human Factors in Computing Systems (New York, NY: ACM), 2135–2144.
Tabibnia, G., Satpute, A. B., and Lieberman, M. D. (2008). The sunny side of fairness: preference for fairness activates reward circuitry (and disregarding unfairness activates self-control circuitry). Psychol. Sci. 19, 339–347. doi:10.1111/j.1467-9280.2008.02091.x
Thogersen, J. (2006). Norms for environmentally responsible behaviour: an extended taxonomy. J. Environ. Psychol. 26, 247–261. doi:10.1016/j.jenvp.2006.09.004
Traulsen, A., Röhl, T., and Milinski, M. (2012). An economic experiment reveals that humans prefer pool punishment to maintain the commons. Proc. R. Soc. Lond. B Biol. Sci. 279, 3716–3721. doi:10.1098/rspb.2012.0937
Watson, D., Clark, L. A., and Tellegen, A. (1988). Development and validation of brief measures of positive and negative affect: the PANAS scales. J. Pers. Soc. Psychol. 54, 1063–1070. doi:10.1037/0022-3514.54.6.1063
Weber, J. M., Kopelman, S., and Messick, D. M. (2004). A conceptual review of decision making in social dilemmas: applying a logic of appropriateness. Pers. Soc. Psychol. Rev. 8, 281–307. doi:10.1207/s15327957pspr0803_4
Witte, K., and Allen, M. (2000). A meta-analysis of fear appeals: implications for effective public health campaigns. Health Educ. Behav. 27, 591–615. doi:10.1177/109019810002700506
Keywords: energy displays, energy behavior, free-riding, social behavior, emotions
Citation: Leygue C, Ferguson E, Skatova A and Spence A (2014) Energy sharing and energy feedback: affective and behavioral reactions to communal energy displays. Front. Energy Res. 2:29. doi: 10.3389/fenrg.2014.00029
Received: 12 March 2014; Paper pending published: 14 June 2014;
Accepted: 10 July 2014; Published online: 25 July 2014.
Edited by:
Joni Jupesta, United Nations University, JapanReviewed by:
Masaru Yarime, University of Tokyo, JapanJoni Jupesta, United Nations University, Japan
Copyright: © 2014 Leygue, Ferguson, Skatova and Spence. This is an open-access article distributed under the terms of the Creative Commons Attribution License (CC BY). The use, distribution or reproduction in other forums is permitted, provided the original author(s) or licensor are credited and that the original publication in this journal is cited, in accordance with accepted academic practice. No use, distribution or reproduction is permitted which does not comply with these terms.
*Correspondence: Caroline Leygue, Horizon Institute, University of Nottingham, Triumph Road, Nottingham NG7 2TU, UK e-mail: caroline.leygue@nottingham.ac.uk