Strain selection, biomass to biofuel conversion, and resource colocation have strong impacts on the economic performance of algae cultivation sites
 Erik R. Venteris
 Mark S. Wigmosta
 Andre M. Coleman
- Pacific Northwest National Laboratory, Richland, WA, USA
Decisions involving strain selection, biomass to biofuel technology, and the location of cultivation facilities can strongly influence the economic viability of an algae-based biofuel enterprise. We summarize our past results in a new analysis to explore the relative economic impact of these design choices. Our growth model is used to predict average biomass production for two saline strains (Nannochloropsis salina and Arthrospira sp.), one fresh to brackish strain (Chlorella sp., DOE strain 1412), and one freshwater strain (order Sphaeropleales). Biomass to biofuel conversion is compared between lipid extraction and hydrothermal liquefaction (HTL) technologies. National-scale models of water, CO2 (as flue gas), land acquisition, site leveling, construction of connecting roads, and transport of HTL oil to existing refineries are used in conjunction with estimates of fuel value (from HTL) to prioritize and select from 88,692 unit farms (UF, 405 ha in pond area), a number sufficient to produce 136E + 9 L year−1 of renewable diesel [36 billion gallons year−1 (BGY)]. Strain selection and choice of conversion technology have large economic impacts, with differences between combinations of strains and biomass to biofuel technologies being up to $10 million year−1 UF−1. Results based on the most productive strain, HTL-based fuel conversion, and resource costs show that the economic potential between geographic locations within the selection can differ by up to $4 million year−1 UF−1, with 1.8 BGY of production possible from the most cost-effective sites. The local spatial variability in site rank is extreme, with very high and low sites within 10 kms of each other. Colocation with flue gas sources has a strong influence on rank, but the most costly resource component varies from site to site. The highest rank UFs are located predominantly in Florida and Texas, but most states south of 37°N latitude contain promising locations.
Introduction
PNNL’s biomass assessment tool (BAT) (Wigmosta et al., 2011) provides a national-scale, integrated modeling environment to study the complex interactions between algal biology, biomass to biofuel technology, and resource availability and costs. BAT enables detailed and rigorous incorporation of spatiotemporal information into site selection exercises (Venteris et al., 2014a) and in estimates of national biofuel production potential (Wigmosta et al., 2011; Venteris et al., 2013, 2014b,c), with a current focus on open-pond cultivation (Jorquera et al., 2010). While a definitive picture of the best strategies for producing biofuel from algae remains elusive, we have made sufficient progress in our modeling efforts to warrant a summary analysis. Of particular interest, and an issue not fully explored in the previous contributions, is the relative import of economic and technical challenges between these three aspects of production.
Evaluating these requires estimates of production values relative to costs at potential unit farm (UF) sites across the coterminous United States (CONUS). For example, natural resource requirements are often discussed in the context of their potential limitations on the feasibility and sustainability of algae biofuel at energy scales (National Research Council, 2012). Key considerations include the availability of water for cultivation (freshwater and a range of saline alternatives), consumption of CO2 for growth rate enhancement relative to current waste sources (flue gas), N and P fertilizer requirements relative to that of traditional agriculture, and the availability of land that is both suitable for the construction of large open-pond cultivation facilities (405 ha or larger) and requires minimal economic and environmental tradeoffs. Our BAT-based investigations have confirmed these resources as important siting factors. However, within the range of renewable production targets considered [19–136E + 9 L year−1 or 5–36 billion gallons year−1 (BGY) of renewable diesel (RD), using the Energy Independence and Security Act of 2007 and other documents (United States Department of Energy, 2010) as guidance], the limitations they present are mainly economic rather than absolute, and spatially relative.
To illustrate, we summarize key conclusions from our previous BAT-based investigations. Wigmosta et al. (2011) have demonstrated large contrasts in algae growth rate due to climate, with the best sites in the southern half of the US producing at least twice the ash-free biomass as those in coolest CONUS locations. The annual average biomass production is also strain dependent, the impacts on performance being one of the results of this current analysis. Estimating the amount of biofuel produced per unit biomass requires a fuel conversion process. We have considered two main technologies, lipid extraction (LE) (Davis et al., 2012) and hydrothermal liquefaction (HTL) (Elliott et al., 2013; Frank et al., 2013; Jazrawi et al., 2013; López Barreiro et al., 2013), to estimate fuel production. In LE, the algae biomass is dried and lipids (triacylglycerols or TAGs) are extracted (through various methods, the employment of solvents such as hexane is commonly suggested) and upgraded to bio or RD. The leftover biomass may be sold as co-products or the nutrients recycled through anaerobic digestion (AD) (Frank et al., 2011) or catalytic hydrothermal gasification (CHG) (Brown et al., 2010; Frank et al., 2013; Venteris et al., 2014b). In HTL, the full, moist (~10–30% water content) biomass is put into a reaction vessel and subjected to heat (~300°C) and pressure (10–25 MPa). HTL demonstrates higher biomass to biofuel conversion efficiency, so there is less leftover material to process than for LE. Estimates of biomass to biofuel efficiency are consistently much greater for HTL than LE (Venteris et al., 2014b,c); the selection of HTL roughly doubles the output of RD per unit biomass. In general, sites using a productive species in a favorable climate, with biomass to biofuel based on HTL, have higher fuel production, make more efficient use of resources and therefore have more favorable economic prospects.
Our studies suggest that resources mainly present economic challenges rather than hard and fast supply barriers. Land availability alone does not present serious limitations. Suitable (low slope, non-protected) barren and desert lands as well as minimally productive agricultural lands are more than sufficient (Wigmosta et al., 2011; Venteris et al., 2012) to meet the current range of production targets under consideration. However, the combined impact of water supply and infrastructure constraints inherent to marginal steppe and desert lands present serious challenges (Venteris et al., 2014c). The most significant supply (non-economic) limitations come from freshwater, with the CONUS production potential being 23.5 BGY but with 16 BGY of sites lacking supply in the southwestern US alone [region defined in Figure 1 (Venteris et al., 2013), with estimates based on LE, using HTL technology would roughly double both numbers]. Seawater and saline groundwater provide intriguing alternatives (Venteris et al., 2013) but are limited by the high cost of pipeline supply systems, expensive wells that are typically deeper than those required for freshwater, and concentrate disposal costs. Carbon dioxide is also a cost-limited resource. While waste supplies of CO2 such as flue gas from electricity generation are plentiful, economic delivery requires proximity (~10 km) to sources to maintain recovery costs below the market value of industrial CO2 (~$40 metric tonne−1) (National Energy Technology Laboratory, 2010). Direct capture of CO2 from the air [typically using bases such as NaOH (Holmes and Keith, 2012)] is currently very expensive and ecological approaches (CO2-evolving cyanobacteria in mixed culture) are in their infancy. In contrast, transport and acquisition costs for N and P fertilizers are relatively small, but consumption relative to current agricultural demand could have negative impacts on food costs and security. Supplying nutrients at energy scales to support the full consumption of biomass through fuel and co-products is likely prohibitive (Venteris et al., 2014b). However, the combination of HTL (Elliott et al., 2013; Frank et al., 2013) and nutrient recycling through AD or CHG can dramatically reduce the nutrient demand and increase the amount of biofuel that can be based on recycled waste nutrients including municipal sewage and animal manures (Venteris et al., 2014b). Balancing nutrient demands between food and fuel production requires careful planning, but there are many opportunities to increase utilization efficiency for both algae biofuel and traditional agriculture (Mac Donald et al., 2009; Crouse and Havlin, 2011).
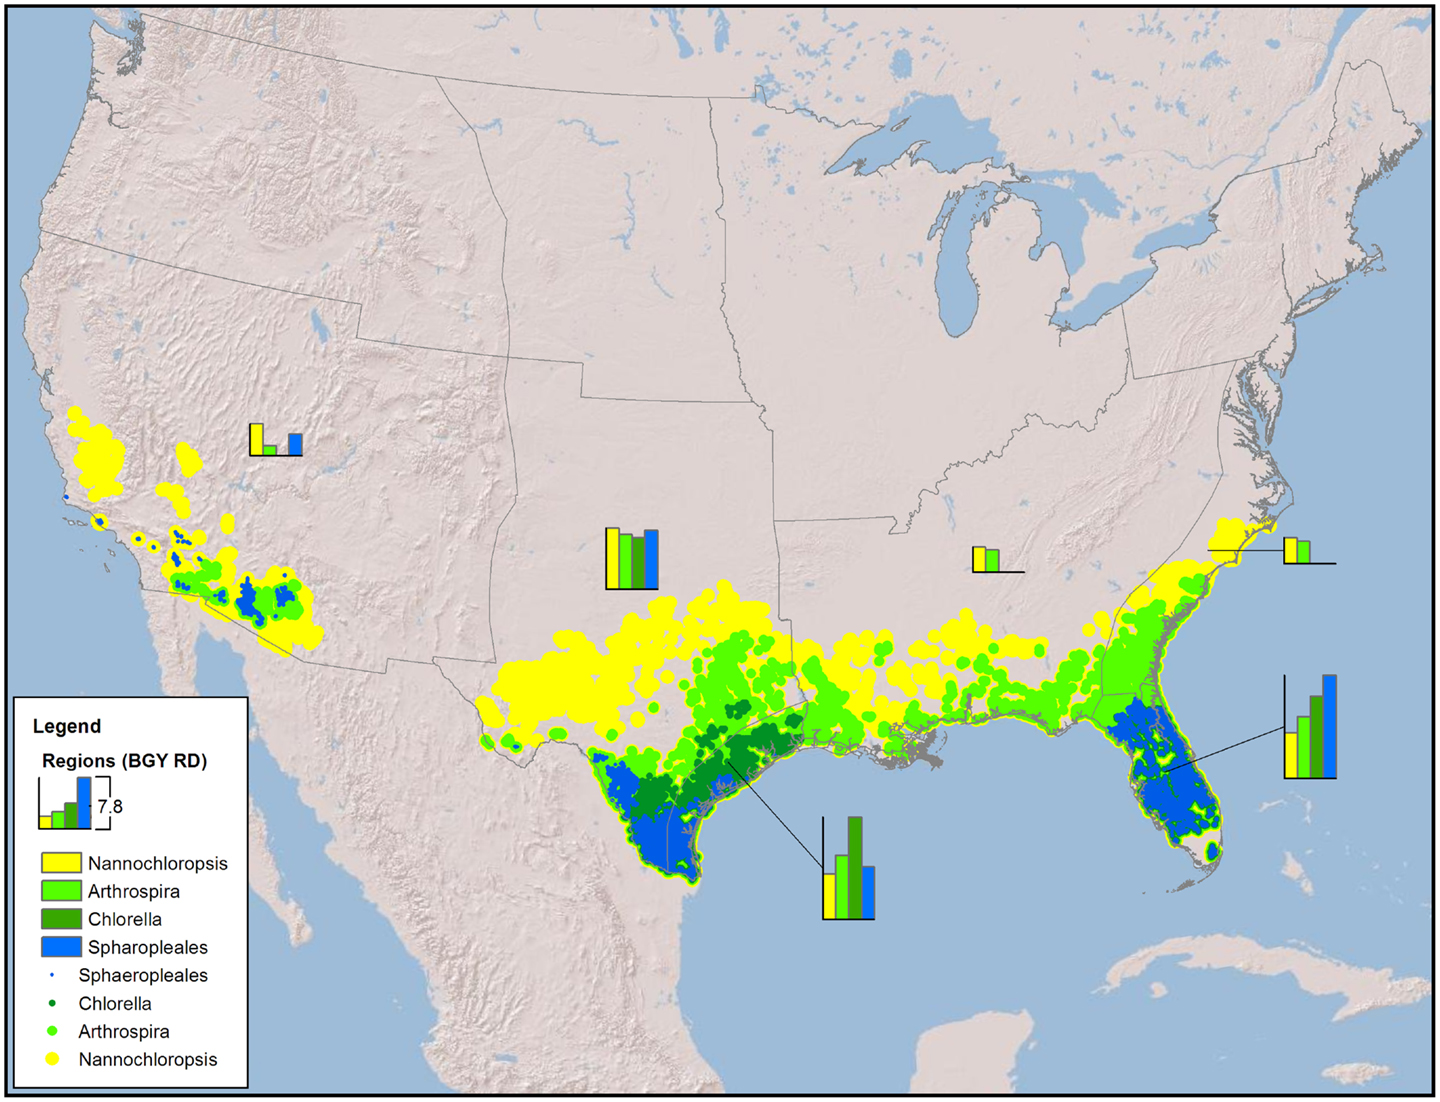
Figure 1. Map of the CONUS showing the number and locations of sites required to produce 36 BGY of RD without any resource constraints (production only).
In this review, we present a new analysis based on our previously published models and parameters. Our main goal is to quantify and illustrate the economic consequences associated with a range of design decisions rather than estimate overall biofuel production potentials (Venteris et al., 2013, 2014b,c). In Venteris et al. (2014a), we explored similar siting issues by applying a series of binary screens relating to groundwater salinity, soil hydraulic conductivity, and proximity to transportation infrastructure. We identified the locations with the highest algae growth rate that met the selection criteria. Here, we revisit the issue of site location, but with a model based on a partial techno-economic assessment (TEA) based on fuel production value and resource costs. Biomass production is determined by the selected strain’s sensitivity to climate (light and temperature) and valued by the amount of RD produced through either LE or HTL. At each potential site this is compared against resource costs for land acquisition, site leveling, water and flue gas availability and delivery costs, construction of connecting roads, and transport of fuel precursors (raw HTL oil) to existing refineries. We explore the range of values and costs for each of these factors and how these can inform decisions on strain selection, choice of biofuel to biomass technology, and determining the best UF locations for cultivation sites, those with both a climate supporting high algae growth rates and low cost access to resources.
Materials and Methods
We have presented the components of the open-pond based BAT growth and resource models in previous publications and so provide only a brief overview here. In its current implementation, our growth model is focused on predicting the geographic variations in biomass production rate due to climate under optimal nutrient conditions without consideration of the biogeochemical aspects of pond operation or ecological dynamics relating to multi-strain assemblages and predation. In addition, the number of strains parameterized and published remains limited to one generic (Wigmosta et al., 2011; Venteris et al., 2013) and four specific strains [Nannochloropsis salina, Chlorella sp. (DOE strain 1412), Arthrospira sp., and members of the order Sphaeropleales (Table 1)]. While a more complete strain database will be required to define the economic role of organism selection, we can make preliminary comparisons of performance. These species and strains were of high interest to the national alliance for advanced biofuels and bio-products (NAABB) research consortium (Venteris et al., 2014c) and to a private sector collaborator [Sapphire Energy Inc. (Venteris et al., 2014a)]. The selected organisms incorporated a range of lipid contents (10–35.4%, Table 2), salinity requirements [fresh (<2 g kg−1) to saline (35 g kg−1)], and ideal temperature ranges for growth (Table 1), and so provided at least a glimpse into the potential growth variability and economic impacts of strain selection.
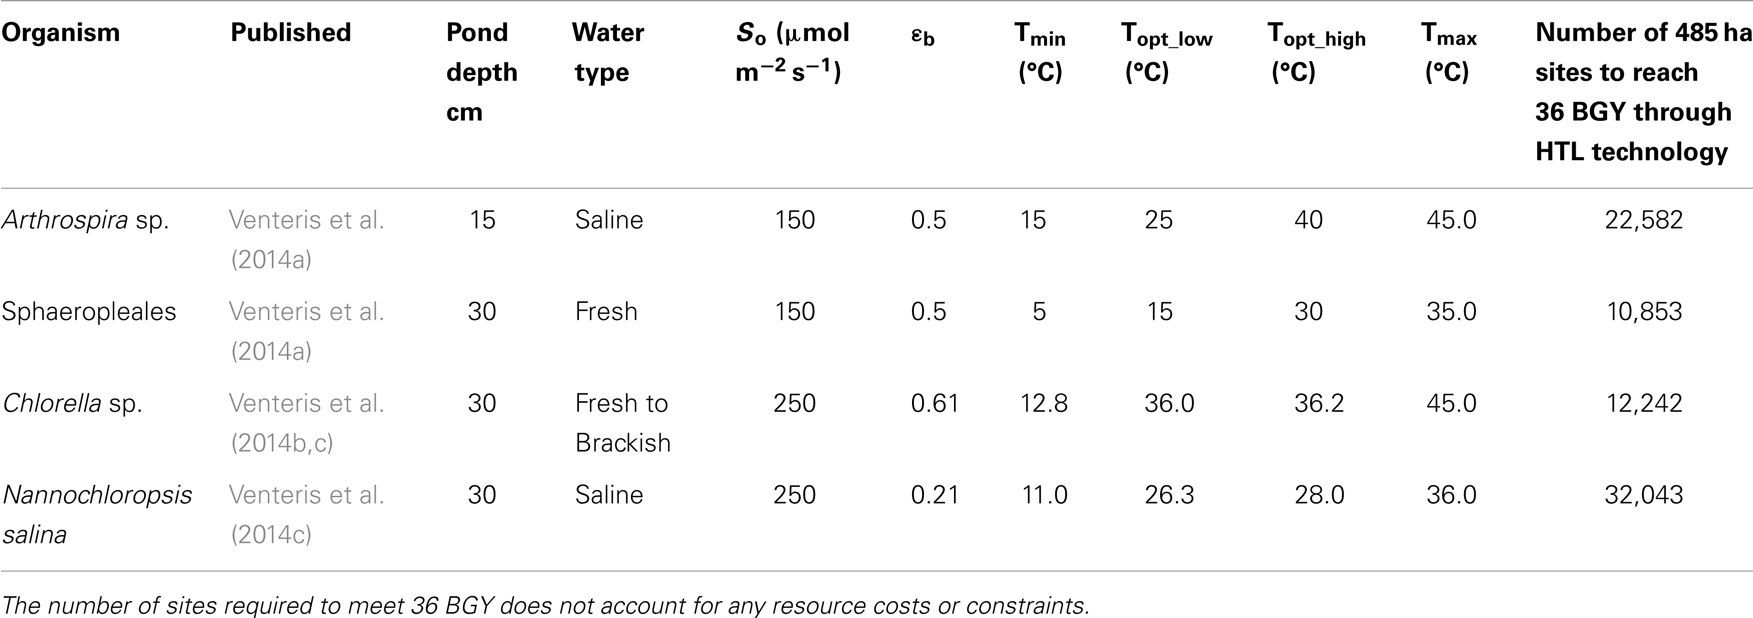
Table 1. Summary of growth model parameters used with the Wigmosta et al. (2011) growth model, and the initial publication of appearance for the four strains used in this study.
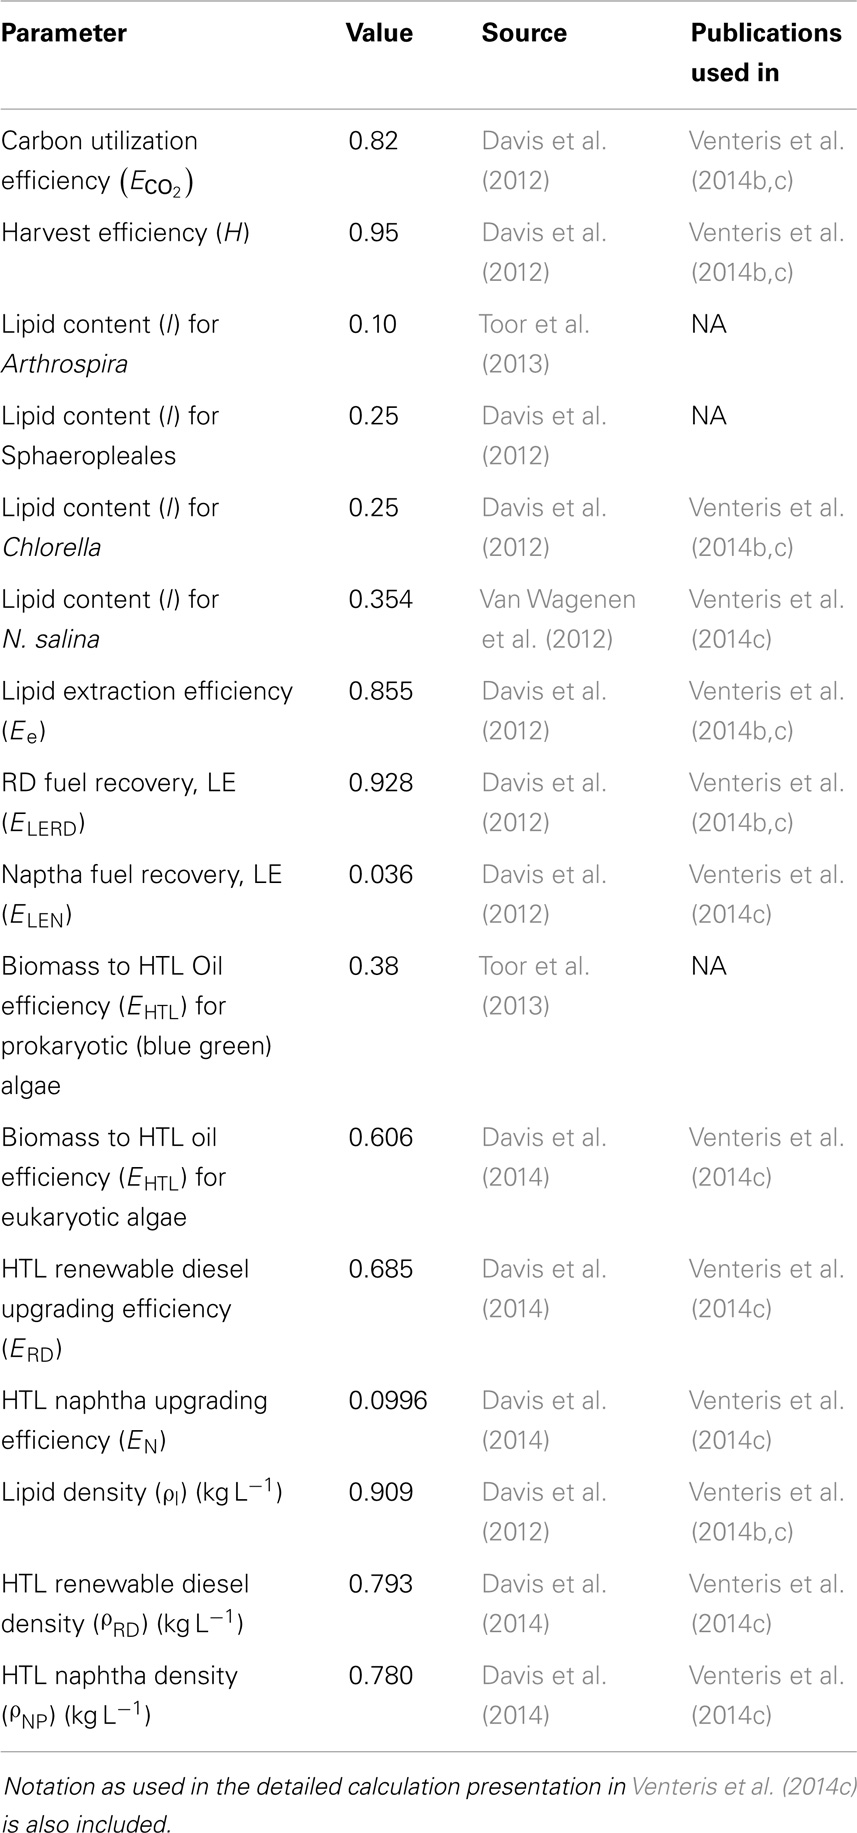
Table 2. Summary of parameters used in CO2 demand and biomass to biofuel calculations.
The rate of algae production was predicted through equations that consider the impact of the amount of light reaching the pond, the efficiency of the organism in using light, and the effect of pond temperature (Weyer et al., 2010; Zemke et al., 2010; Wigmosta et al., 2011). A stochastic weather generator [Cligen (Nicks and Gander, 1994)] was used to simulate the amount of solar insolation, air temperature, and precipitation, which in-turn drove a numerical simulation of pond state [MASS2 (Perkins et al., 2004)] that predicted pond temperature and the freshwater evaporation rate. Simulations were conducted at an hourly time step and the average annual biomass and evaporative water consumption computed, based on 30 years of simulation results. Issues of equipment design, greenhouse-gas life-cycle analysis, and techno-economic modeling relating to seasonal and monthly variations in algae production were presented in Davis et al. (2014) and Coleman et al. (2014).
Current analyses (Frank et al., 2013; Davis et al., 2014; Venteris et al., 2014b) have emphasized the nutrient recovery potential of HTL when coupled with CHG. Less understood is the relative co-product value between LE and HTL residues; here, we emphasized scenarios with maximized nutrient recycling to minimize impacts on agricultural nutrient supplies and food costs (Venteris et al., 2014b). Therefore, potential co-products and their values were not considered. The RD production value for each UF was calculated from the dry, ash-free biomass, which was then converted to volume of fuel and price [based on $3.05 gal−1, wholesale (Energy Information Administration, 2012)] through conversion factors [Table 2, the calculation methods were presented in detail previously (Venteris et al., 2014b,c)].
The central analysis was a resource-based tradeoff prioritization and site selection from the initial 88,692 UF (485 total area with 405 ha of cultivation ponds). A number of UFs sufficient to produce 36 BGY of RD were selected. While we have integrated the water portion of our resource models with life cycle and TEA focused on cultivation and biofuel processing (Davis et al., 2012, 2014; Coleman et al., 2014), the emphasis has been on the sustainability and economics of up and downstream resources. Based on comparisons of strains and biomass to biofuel performance, we conducted a new analysis based on Sphaeropleales cultivation in freshwater (where it was available, with a 2 g kg−1 operating salinity) and Chlorella cultivation in brackish water (where freshwater was not available, with a 10 g kg−1 operating salinity), with biomass to biofuel conversion through HTL. An updated model was in development for seawater cost assessment, so further analysis of the seawater resource was reserved for an upcoming, focused article. In keeping with the spirit of this review, we mainly considered previously presented resource components (Table 3). Resources considered included fresh and brackish groundwater supply costs (Venteris et al., 2014c), with freshwater use limited to 5% of the mean annual flow for each watershed (Venteris et al., 2013). CO2 was provided by flue gas (Venteris et al., 2014b,c), with costs assessed by a pipeline transport model and the number farms connected to each source limited by capacity. In addition, sites where CO2 costs exceeded the market value of $40 tonne−1 were excluded. Hence, our site evaluation model was constrained by the supply of water resources by watershed and CO2 resource by point source. The impact of these availability constraints would decrease for smaller RD production targets. In addition, leveling costs (Venteris et al., 2014b) based on dividing each farm into 10 terrace units, land acquisition costs (Venteris et al., 2012, 2014b), and construction of a road to the cultivation site (Venteris et al., 2014b) were included. We introduced one new resource cost component, where HTL oils were sent to an existing refinery through road (tanker truck), rail, and/or ship, with costs estimated from Geographic Information System (GIS)-based cost distance models (a simplified version of this model was used in the selection for Davis et al., 2012). Details of this transport model are presented in the supporting information. The generalized algorithm used for conducting site prioritization and selection was presented in detail previously (Venteris et al., 2014c). Results were ordered by decreasing net value until the 36 BGY production target was met or a key resource was exhausted, whichever came first.
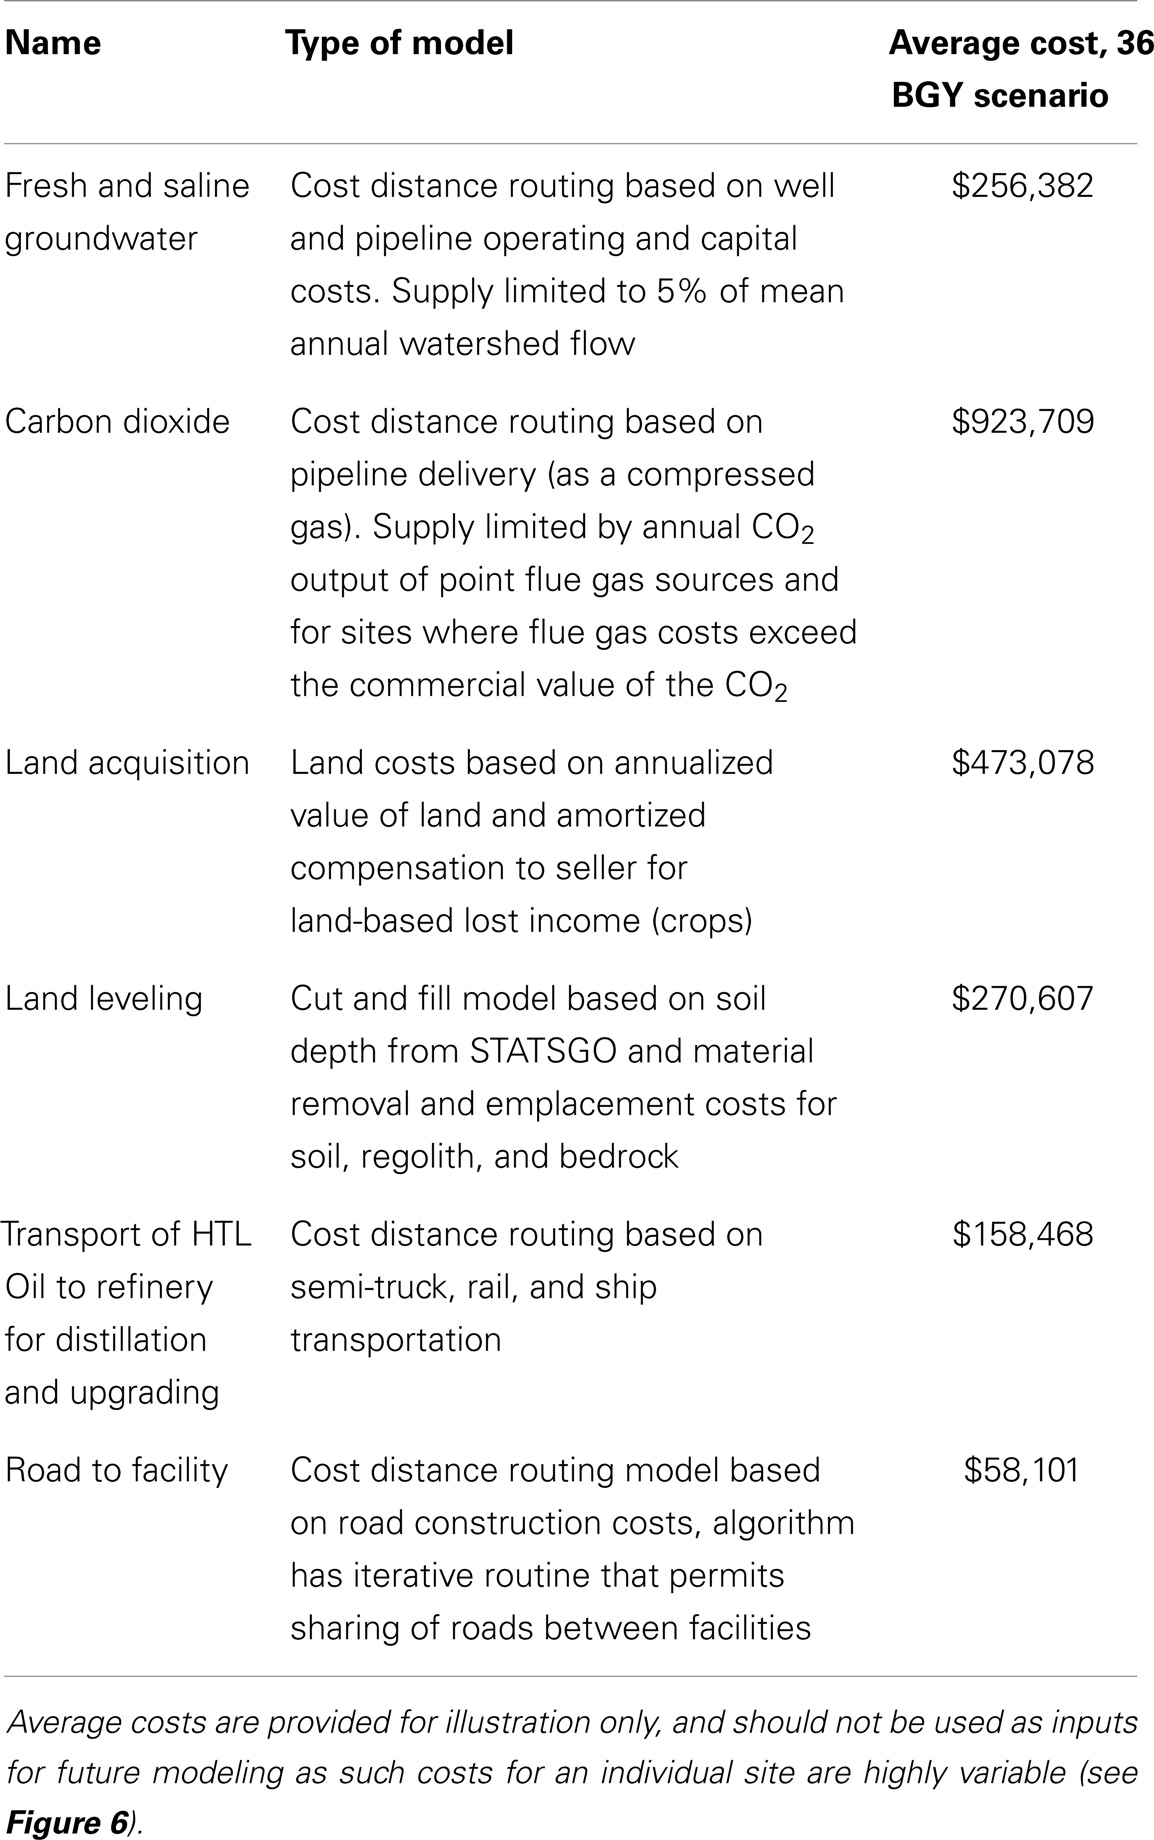
Table 3. Summary of resource components used in the site prioritization and selection model.
Results
The minimum number of UF sites required (Table 1, based on biomass to biofuel conversion through HTL) to meet the 36 BGY RD target and their locations (Figure 1) illustrated the significant impact of strain selection and performance. Predicted growth rates (Figure 2) for Sphaeropleales were nearly 60% higher than N. salina, but roughly similar to the other strains. The differences between the strains were compounded by the interaction between production and climate. N. salina required the most sites, with the least productive location having a growth rate 36% less than the most productive. In contrast, that difference for Sphaeropleales was only 11%. These contrasts in mean annual growth rate had a dramatic impact on the number of required cultivation sites and their geographic distribution. N. salina required over 21,000 more sites (10 million ha) to achieve the same RD target.
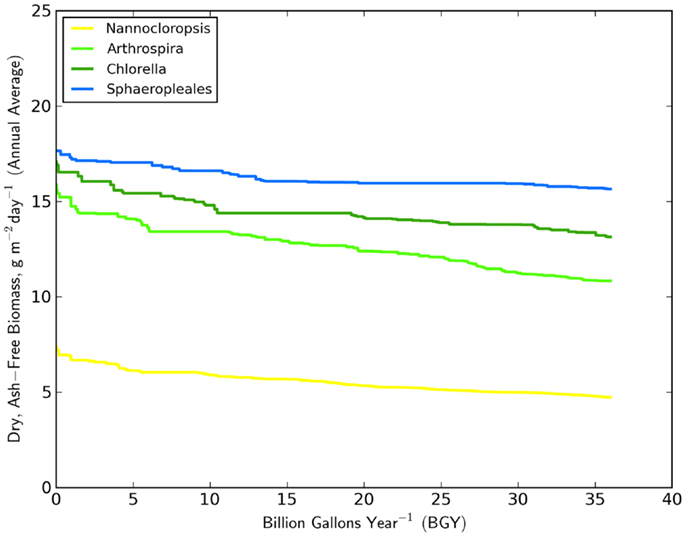
Figure 2. Distribution of mean annual growth rate (g m2 day−1) over the 36 BGY selection presented in Figure 1, for the four strains studied.
Assessing the economic impact of strain selection required the specification of a biomass to biofuel technology. Combined, the economic impacts were dramatic (Figure 3). The difference in biofuel value (RD and naphtha) between the best and worst performing strain was over $6 million year−1 UF−1 (based on HTL) for the most productive climates. HTL’s conversion efficiency resulted in a much larger amount of biofuel and revenue stream relative to LE. For only one scenario did LE outperform HTL. The gains in production value between the conversion technologies ranged from $4 to $6 million year−1 UF−1 for the top three strains. The higher lipid content of N. salina did not result in a reversing of the relative fuel production between HTL and LE for that strain. The relationship between HTL efficiency and lipid content was not well-established (Frank et al., 2013) and required further laboratory studies. We did not specifically include the potential influence of lipid content in HTL oil yield. However, we did apply a smaller yield factor (Toor et al., 2013) for the low-lipid organism Arthrospira than was used for the other strains. The combination of Arthrospira and LE was the worst performing scenario, only producing 25 BGY despite occupation of all potential CONUS sites. In contrast, biofuel production through HTL increased productivity threefold. HTL clearly has the potential to improve the economics for biofuel production based on this commonly grown and well-established strain (Ahsan et al., 2008; Earthrise Nutritionals, 2013).
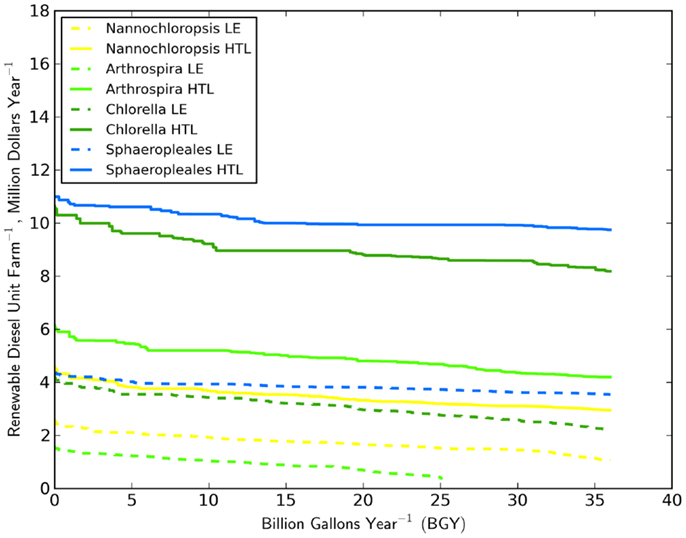
Figure 3. Distribution of the value of RD per unit farm (405 ha pond area) for the four strains and two biomass to biofuel processes studied.
The high productivity of Sphaeropleales and the large HTL conversion efficiency (Davis et al., 2014; Venteris et al., 2014c) made this 36 BGY scenario the most optimistic we have presented to date. Producing 36 BGY required 12,019 UF sites (Figure 4). As reflected in the cost statistics, this new scenario had favorable impacts on resource use efficiency, but we do not present a new compilation of total resource requirements. Inventories were presented for a similar model (Venteris et al., 2014c), so we focus on the drivers of performance variability between individual UF sites. Strain performance and resource costs were highly variable, which resulted in a complex geographic distribution of site ranks (Figure 4). The net fuel value [fuel (RD and naptha) minus resource costs] ranged from over $11 million year−1 UF−1 for the best to $7 million year−1 UF−1 for the worst sites within the selection (Figure 5). There were a limited number of high performing locations (the top 5%, encompassing 539 UFs) with a total RD production capacity of 1.8 BGY. Lower rank sites showed a steady, linear decrease in net value. The total value of fuel is clearly a significant driver of site rank, but there is a very large amount of scatter (over $2 million year−1 UF−1) between sites of similar rank (Figure 5). High algal growth rates alone did not guarantee favorable economics for a given site, as even those with the large fuel values (over $12 million year−1 UF−1) occasionally had very low ranks.
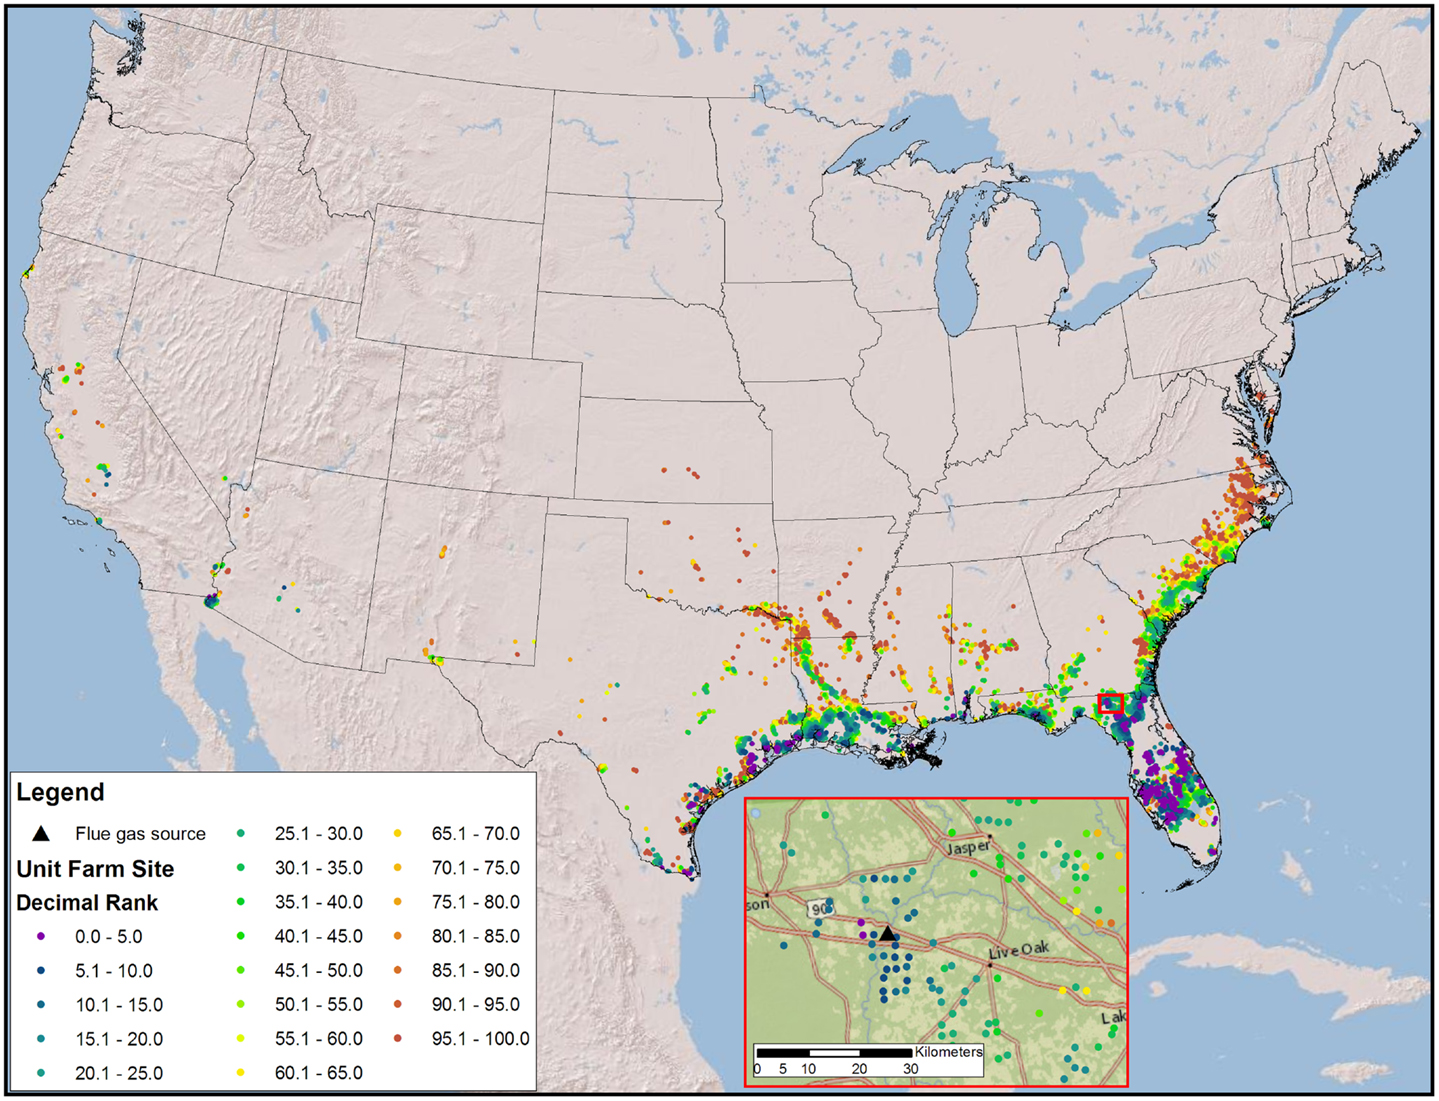
Figure 4. Map of the CONUS showing the number and locations of sites require to produce 36 BGY constrained by freshwater and flue gas resources and prioritized by fuel value minus resource costs. The inset map illustrates the complexity of ranks for a very small geographic area.
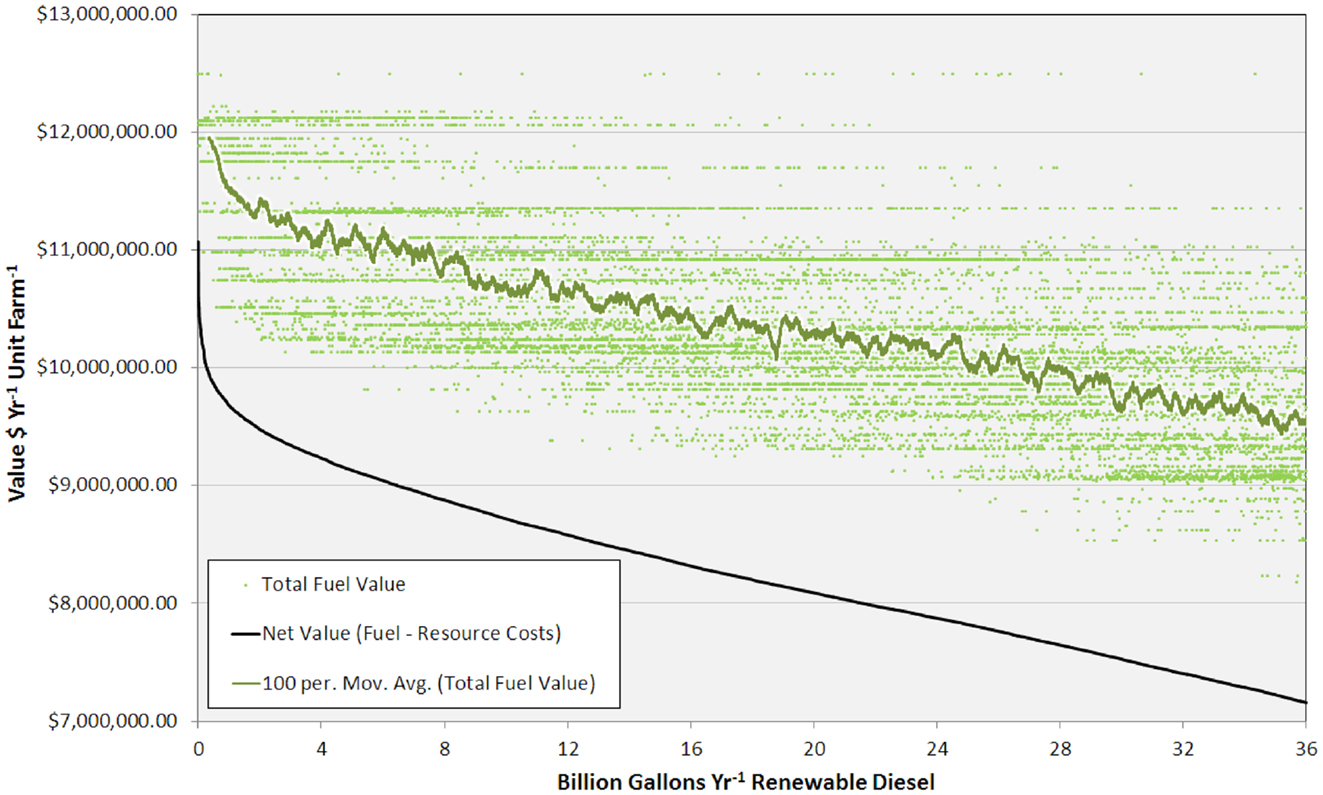
Figure 5. Graph showing total fuel value (for each unit farm and as a 100 site running average) and net value versus RD production from 0 to 36 BGY.
This complexity was also partially driven by large spatial variability in resource costs (Figure 6). Sites with similar rank exhibited marked contrasts in the total resource costs and the relative importance between individual components. The plot of annualized resource costs versus BGY of RD was best described as scattered (Figure 6), but trends were discernable in the 100 site running means. Carbon dioxide delivery was the largest resource cost and there was a clear trend from 0 to 8.0 BGY, which demonstrated that proximity to flue gas resources was key contributor to site rank. Land acquisition was the second most significant cost, and as with flue gas, it showed very large variability between sites of similar rank. Land value is a function of the income derived from it (crops, etc.) and proximity to infrastructure (Venteris et al., 2012) so high land values in some cases are offset by more favorable infrastructure costs. This is reflected in the slightly decreasing trend with increasing RD production. For water, the trend in costs reflected the gradual transition from the use of inexpensive freshwater resources to more costly saline groundwater. For site leveling, the trend was the result of the limited number of construction sites with low-slopes and deep soils (removal of near-surface bedrock is expensive and accounted for in the model). While water and site leveling costs were not the highest cost components, the trends demonstrated their important influence on site prioritization. In general, costs associated with construction of connecting roads and HTL oil transport were not significant. Interestingly, the transportation of HTL oils to existing refineries showed a decrease in costs with increased RD production over the range 0–2 BGY. This is the result of elevated transportation cost to bring HTL oil to existing refineries in Alabama from high-productivity cultivation sites in Florida (Figure SI-1 in Supplementary Material). For other transported materials such as fertilizers, prices were largely set by the national market, not by geographic location (ERS-USDA Economic Research Service, 2013).
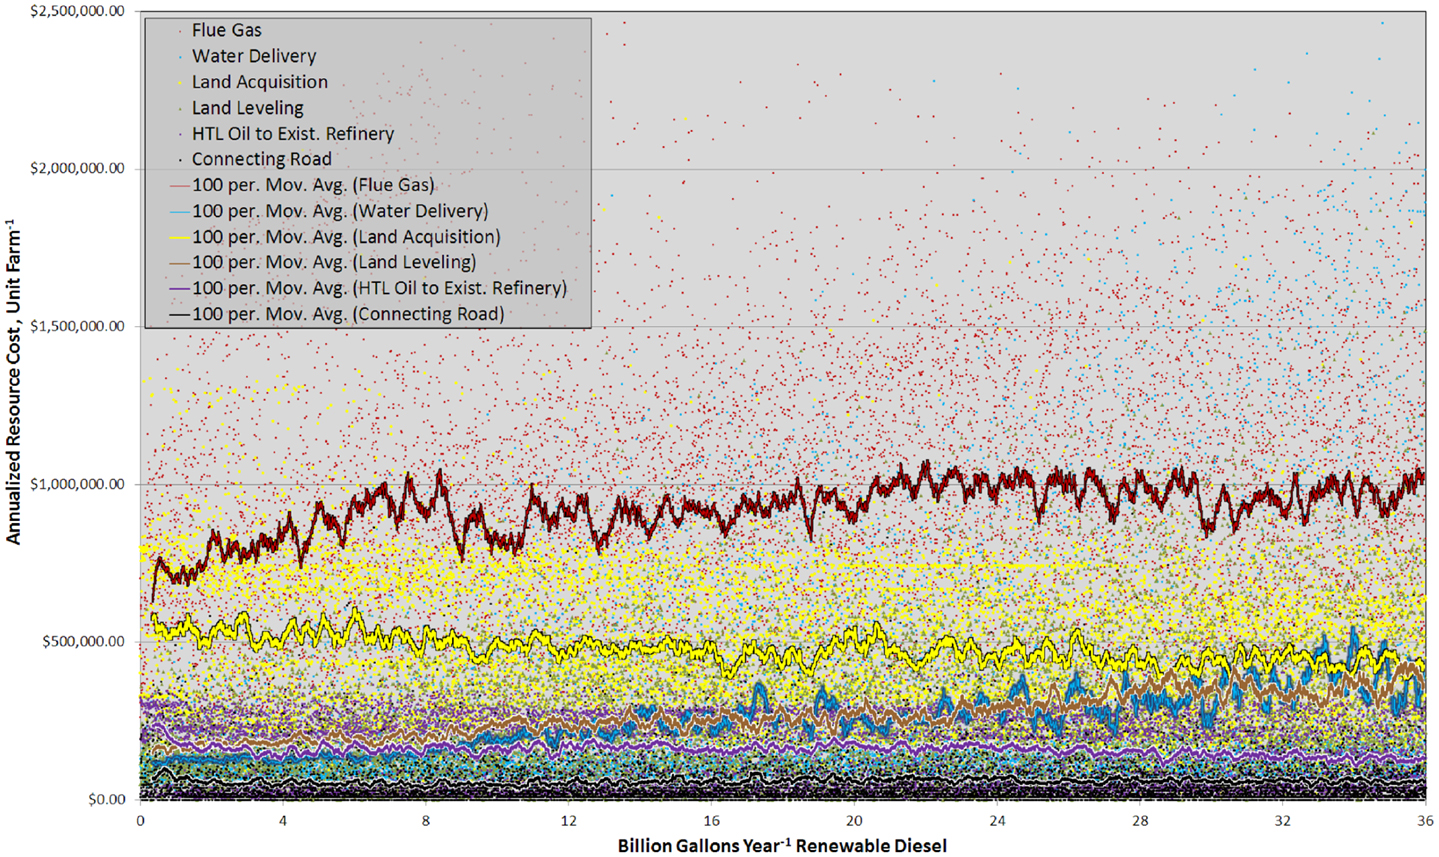
Figure 6. Graph showing the annualized cost of each resource component, for each unit farm and as a 100 site running mean versus RD production from 0 to 36 BGY.
Discussion
The results show that the selection of algae strain, biomass to biofuel conversion technology, and geographic location are all important considerations when designing an algae cultivation facility. Even within our limited set of strains there are dramatic differences in productivity worth millions of dollars year−1 UF−1. The uncertainty in growth rate prediction is currently unknown, with validation studies being conducted for the regional algal feedstock testbed project (RAFT) (USDOE, 2014). The true performance differences and how much could be made up through site optimization [(Mc Bride and Merrick, 2014) strain selection, growth conditions, breeding and genetic modification, ecology, etc.] require further investigation. In addition, a fuller understanding of growth performance under saline conditions is important to evaluate feasibility of algae cultivation based on freshwater alternatives. While freshwater supplies are not a critical issue to the early development of the industry, as energy scales are realized it will be desirable to limit impacts, and freshwater availability has already been shown to strongly impact siting flexibility (Venteris et al., 2013, 2014a). Currently, our high salinity strains do not perform as well as the freshwater strains. Laboratory data (M. Heusemann, personal communication) shows Chlorella can tolerate brackish salinities with a modest performance penalty (Venteris and Wigmosta, 2013; Venteris et al., 2014b). However, in this modeling effort, we do not penalize Chlorella production for growth in brackish water, as it is currently unknown how much performance can be recovered through optimization. This analysis demonstrates that growth rates remain a key consideration and studies such as RAFT that expand our knowledge of real-world performance constraints and variability due to climate, water chemistry, and ecological interactions are essential.
Analyses continue to show impressive fuel production benefits from HTL technology due to its high biomass to biofuel conversion efficiency. However, a host of issues for investigation remain for biofuel production and the fate of by-products. Fuel production is a major USDOE goal, but is certainly not the only business model for algae cultivation. The potential for co-products from LE by-products are well understood, but the emphasis for HTL investigations has been on the recycling of nutrients contained in leftover biomass (Elliott et al., 2013; Frank et al., 2013; Davis et al., 2014; Venteris et al., 2014b). The optimal choice of biomass to biofuel technology to meet large energy targets may contrast with that best for producing by-products such as plastics, nutraceuticals, and animal feed.
Our models confirm that careful selection of geographic location is of utmost importance. The first consideration is a climate amenable to the cultivation of algae; accordingly, we have quantified the advantages of light and warmth and located the best geographic areas. However, resource costs show tremendous variability, with spatial economic gradients far larger than those found in algae growth rates. The scatter in Figures 5 and 6 shows that sites with very similar rank arrive there by quite different combinations of biomass production and resource cost components. This variation is driven by colocation (Figure 4), with significant spatial variations in resource costs and subsequent rank occurring over small distances (as small as 10 kms). While the results are strongly influenced by CO2 transport, all resources contribute, their general relative contribution being apparent in Figure 6. In an example drawn from Florida (Figure 4, inset), high and low rank sites are within 30 km of each other. Even with the high-productivity rates in Florida, the spatial variability in resource costs results in large spatial variability in rank.
Spatial selection and site rank are highly sensitive to the design requirements of the cultivation facility in question. For example, in our study with Sapphire Energy Inc. (Venteris et al., 2014a) infrastructure proximity and the potential influence of soil properties was emphasized. In that work, pond leakage was to be controlled through soil engineering rather than the typically specified plastic pond liner. In contrast, in this analysis we specified plastic liners, so soil properties only subtly influence the selection though site leveling costs. There is also an issue of accounting that requires more studies to resolve. Some of the cost-contrasts could be damped through consideration of broader, multi-farm enterprise. Determining the optimal number of farms to combine biomass for downstream processing will require better information on the economics of scaling for biomass to biofuel and refining facilities (Wright and Brown, 2007). Nevertheless, it is clear that BAT’s UF (485 ha) basis provides critical spatial information that is not attainable from studies conducted at county resolution, which cannot account for site-specific costs and availability.
Conclusion
Decisions relating to strain selection, biomass to biofuel conversion technology, and geographic location can result in millions of dollars’ year−1 UF−1 of cost benefits. Within the range of sites required to produce 36 BGY, the net fuel values differ by $4,000,000 year−1 UF−1. High resolution spatiotemporal models built within GIS software such as BAT are essential tools for exploring the resource consumption and economic consequences of the various design decisions surrounding algae biofuel enterprises. We have identified at least 500 locations where the combination of climate and resource availability and costs are especially favorable for economic success.
Conflict of Interest Statement
The authors declare that the research was conducted in the absence of any commercial or financial relationships that could be construed as a potential conflict of interest.
Acknowledgments
Support for this research was provided by the Bioenergy Technologies Office of the U.S. Department of Energy. The Pacific Northwest National Laboratory is operated by Battelle Memorial Institute for the U.S. Department of Energy under contract DE-AC06-76RLO 1830.
Supplementary Material
Supplementary material describing the road construction and material transport models is included with this text. The Supplementary Material for this article can be found online at http://www.frontiersin.org/Journal/10.3389/fenrg.2014.00037/abstract
References
Ahsan, M., Habib, B., Parvin, M., Huntington, T., and Hasan, M. (2008). A Review on Culture, Production and Use of Spirulina as Food for Humans and Feeds for Domestic Animals. Rome: FAO.
Brown, T. M., Duan, P., and Savage, P. E. (2010). Hydrothermal liquefaction and gasification of Nannochloropsis sp. Energy Fuels 24, 3639–3646. doi: 10.1021/ef100203u
Coleman, A. M., Abodeely, J. M., Skaggs, R. L., Moeglein, W. A., Newby, D. T., Venteris, E. R., et al. (2014). An integrated assessment of location-dependent scaling for microalgae biofuel production facilities. Algal Res. 5, 79–94. doi:10.1016/j.algal.2014.05.008
Crouse, D., and Havlin, J. (2011). 22 Geographic information and the management of animal manure. GIS Appl. Agr. 2, 385. doi:10.1201/b10600-23
Davis, R., Fishman, D., Frank, E. D., Wigmosta, M. S., Aden, A., Coleman, A. M., et al. (2012). Renewable Diesel from Algal Lipids: An Integrated Baseline for Cost, Emissions, and Resource Potential from a Harmonized Model. Golden, CO: Argonne National Laboratory, Pacific Northwest National Laboratory, National Renewable Energy Laboratory.
Davis, R. E., Fishman, D. B., Frank, E. D., Johnson, M. C., Jones, S. B., Kinchin, C. M., et al. (2014). Integrated evaluation of cost, emissions, and resource potential for algal biofuels at the national scale. Environ. Sci. Technol. 48, 6035–6042. doi:10.1021/es4055719
Earthrise Nutritionals. (2013). Welcome to Earthrise.com [Online]. Available at: http://www.earthrise.com/
Elliott, D. C., Hart, T. R., Schmidt, A. J., Neuenschwander, G. G., Rotness, L. J., Olarte, M. V., et al. (2013). Process development for hydrothermal liquefaction of algae feedstocks in a continuous-flow reactor. Algal Res. 2, 445–454. doi:10.1016/j.algal.2013.08.005
Energy Information Administration. (2012). U.S. No 2 Diesel Low Sulfur 15-500 ppm Retail Sales by Refiners [Online]. Available at: http://www.eia.gov/dnav/pet/hist/LeafHandler.ashx?n=PET&s=EMA_EPD2DM10_PTG_NUS_DPG&f=M
ERS-USDA Economic Research Service. (2013). Fertilizer Use and Price [Online]. USDA. Available at: http://www.ers.usda.gov/data-products/fertilizer-use-and-price.aspx#.U3zoEyhwW5I
Frank, E., Elgowainy, A., Han, J., and Wang, Z. (2013). Life cycle comparison of hydrothermal liquefaction and lipid extraction pathways to renewable diesel from algae. Mitig. Adapt. Strateg. Glob. Change 18, 137–158. doi:10.1007/s11027-012-9395-1
Frank, E., Han, J., Palou-Rivera, I., Elgowainy, A., and Wang, M. (2011). Life-Cycle Analysis of Algal Lipid Fuels with the GREET Model. Chicago, IL: Argonne National Laboratory.
Holmes, G., and Keith, D. W. (2012). An air-liquid contactor for large-scale capture of CO2 from air. Philos. Trans. R. Soc. Lond. A 370, 4380–4403. doi:10.1098/rsta.2012.0137
Jazrawi, C., Biller, P., Ross, A. B., Montoya, A., Maschmeyer, T., and Haynes, B. S. (2013). Pilot plant testing of continuous hydrothermal liquefaction of microalgae. Algal Res. 2, 268–277. doi:10.1016/j.algal.2013.04.006
Jorquera, O., Kiperstok, A., Sales, E. A., Embiruçu, M., and Ghirardi, M. L. (2010). Comparative energy life-cycle analyses of microalgal biomass production in open ponds and photobioreactors. Bioresour. Technol. 101, 1406–1413. doi:10.1016/j.biortech.2009.09.038
López Barreiro, D., Prins, W., Ronsse, F., and Brilman, W. (2013). Hydrothermal liquefaction (HTL) of microalgae for biofuel production: state of the art review and future prospects. Biomass Bioenergy 53, 113–127. doi:10.1016/j.biombioe.2012.12.029
Mac Donald, J. M., Ribaudo, M., Livingston, M., Beckman, J., and Huang, W. (2009). Manure Use for Fertilizer and for Energy: Report to Congress. Washington, DC: Economic Research Service.
Mc Bride, R. C., and Merrick, D. S. (2014). Innovations in open pond algae agriculture for biofuel production. Ind. Biotechnol. 10, 162–163. doi:10.1089/ind.2013.1614
National Energy Technology Laboratory. (2010). CO2 EOR Primer [Online]. Available at: http://www.netl.doe.gov/file%20library/research/oil-gas/CO2_EOR_Primer.pdf
National Research Council. (2012). Sustainable Development of Algal Biofuels in the United States. Washington DC: The National Academies Press.
Nicks, A., and Gander, G. (1994). “CLIGEN: a weather generator for climate inputs to water resource and other models,” in Proceedings of the Fifth International Conference on Computers in Agriculture (Orlando, FL: American Society of Agricultural and Biological Engineers), 903–909.
Perkins, W. A., Richmond, M. C., and Mcmichael, G. A. (2004). “Two-dimensional modeling of time-varying hydrodynamics and juvenile Chinook salmon habitat in the Hanford Reach of the Columbia River,” in World Water and Environmental Resources Congress (Salt Lake City, UT: American Society of Civil Engineers), 1–8.
Toor, S. S., Reddy, H., Deng, S., Hoffmann, J., Spangsmark, D., Madsen, L. B., et al. (2013). Hydrothermal liquefaction of Spirulina and Nannochloropsis salina under subcritical and supercritical water conditions. Bioresour. Technol. 131, 413–419. doi:10.1016/j.biortech.2012.12.144
United States Department of Energy. (2010). “National algal biofuels technology roadmap,” in US Department of Energy, Office of Energy Efficiency and Renewable Energy, Biomass Program (National Algal Biofuels Technology Roadmap), eds J. Ferrell and V. Sarisky-Reed. Washington, DC.
USDOE. (2014). Bioenergy Technologies Office – Research and Development [Online]. Available at: http://www1.eere.energy.gov/bioenergy/m/algae.html
Van Wagenen, J., Miller, T. W., Hobbs, S., Hook, P., Crowe, B., and Huesemann, M. (2012). Effects of light and temperature on fatty acid production in nannochloropsis salina. Energies 5, 731–740. doi:10.3390/en5030731
Venteris, E. R., Mcbride, R. C., Coleman, A. M., Skaggs, R. L., and Wigmosta, M. S. (2014a). Siting algae cultivation facilities for biofuel production in the United States: trade-offs between growth rate, site constructability, water availability, and infrastructure. Environ. Sci. Technol. 48, 3559–3566. doi:10.1021/es4045488
Venteris, E. R., Skaggs, R. L., Wigmosta, M. S., and Coleman, A. M. (2014b). A national-scale comparison of resource and nutrient demands for algae-based biofuel production by lipid extraction and hydrothermal liquefaction. Biomass Bioenergy 64, 276–290. doi:10.1016/j.biombioe.2014.02.001
Venteris, E. R., Skaggs, R. L., Wigmosta, M. S., and Coleman, A. M. (2014c). Regional algal biofuel production potential in the coterminous United States affected by resource availability trade-offs. Algal Res. doi:10.1016/j.algal.2014.02.002
Venteris, E. R., Skaggs, R. L., Coleman, A. M., and Wigmosta, M. S. (2012). An assessment of land availability and price in the coterminous United States for conversion to algal biofuel production. Biomass Bioenergy 47, 483–497. doi:10.1016/j.biombioe.2012.09.060
Venteris, E. R., Skaggs, R. L., Coleman, A. M., and Wigmosta, M. S. (2013). A GIS cost model to assess the availability of freshwater, seawater, and saline groundwater for algal biofuel production in the United States. Environ. Sci. Technol. 47, 4840–4849. doi:10.1021/es304135b
Venteris, E. R., and Wigmosta, M. S. (2013). “Water cost and availability for algae cultivation – salinity issues,” in ABO Webinars, ed. M. Rosenthal (Washington, DC: Algae Biomass Organization).
Weyer, K., Bush, D., Darzins, A., and Willson, B. (2010). Theoretical maximum algal oil production. Bioenergy Res. 3, 204–213. doi:10.1007/s12155-009-9046-x
Wigmosta, M. S., Coleman, A. M., Skaggs, R. J., Huesemann, M. H., and Lane, L. J. (2011). National microalgae biofuel production potential and resource demand. Water Resour. Res. 47:W00H04. doi:10.1029/2010wr009966
Wright, M., and Brown, R. C. (2007). Establishing the optimal sizes of different kinds of biorefineries. Biofuels Bioprod. Biorefin. 1, 191–200. doi:10.1002/bbb.25
Keywords: algae, biofuels, resource assessment, geographic information systems, techno-economics
Citation: Venteris ER, Wigmosta MS, Coleman AM and Skaggs RL (2014) Strain selection, biomass to biofuel conversion, and resource colocation have strong impacts on the economic performance of algae cultivation sites. Front. Energy Res. 2:37. doi: 10.3389/fenrg.2014.00037
Received: 27 June 2014; Paper pending published: 16 July 2014;
Accepted: 20 August 2014; Published online: 16 September 2014.
Edited by:
Qiang Wang, Chinese Academy of Sciences, ChinaReviewed by:
Jiangxin Wang, Arizona State University, USAAnoop Singh, Denmark Technical University, Denmark
Copyright: © 2014 Venteris, Wigmosta, Coleman and Skaggs. This is an open-access article distributed under the terms of the Creative Commons Attribution License (CC BY). The use, distribution or reproduction in other forums is permitted, provided the original author(s) or licensor are credited and that the original publication in this journal is cited, in accordance with accepted academic practice. No use, distribution or reproduction is permitted which does not comply with these terms.
*Correspondence: Erik R. Venteris, Pacific Northwest National Laboratory, 902 Battelle Boulevard, P.O. Box 999, MSIN K9-33, Richland, WA 99352, USA e-mail: erik.venteris@pnl.gov