Life-cycle assessment of the production of rare-earth elements for energy applications: a review
 Julio Navarro
 Fu Zhao
- 1School of Mechanical Engineering, Purdue University, West Lafayette, IN, USA
- 2Division of Environmental and Ecological Engineering, School of Mechanical Engineering, Purdue University, West Lafayette, IN, USA
Rare-earth elements (REEs) are a group of 17 elements with similar chemical properties, including 15 in the lanthanide group, yttrium, and scandium. Due to their unique physical and chemical properties, REEs gain increasing importance in many new energy technologies and systems that contribute to reduce greenhouse gas emissions and fossil fuel depletion (e.g., wind turbine, electric vehicles, high efficiency lighting, batteries, and hydrogen storage). However, it is well known that production of REEs is far from environmentally sustainable as it requires significant material and energy consumption while generating large amounts of air/water emissions and solid waste. Although life-cycle assessment (LCA) has been accepted as the most comprehensive approach to quantify the environmental sustainability of a product or process, to date, there have been only very limited LCA studies on the production of REEs. With the continual growth of renewable energy and energy efficient technologies, global production of REEs will increase. Therefore, reducing environmental footprints of REE production becomes critical and identifying environmental hotspots based on a holistic and comprehensive assessment on environmental impacts serves as an important starting point. After providing an overview of LCA methodology and a high-level description of the major REE production routes used from 1990s to today, this paper reviews the published LCA studies on the production of REEs. To date, almost all the LCA studies are based on process information collected from the operation of Mountain Pass facility in U.S. in 1990s and the operation of facilities in Bayan Obo, China. Knowledge gaps are identified and future research efforts are suggested to advance understanding on environmental impacts of REE production from the life-cycle perspective.
Introduction
Rare-earth elements (REEs) are comprised of the 15 elements that make up the lanthanide group of the periodic table and also include yttrium and scandium because of their similar physical and chemical properties (Castor and Hedrick, 2006; Gambogi and Cordier, 2010; Walters et al., 2010; Liao et al., 2013; Golev et al., 2014). The elements can be grouped into two different categories based on their atomic numbers. REEs with atomic number 57–63 are classified as light-rare earths (LREEs), and REEs with atomic number 64–71 are classified as heavy-rare earths (HREEs). Scandium and yttrium are usually classified as HREEs (Humphries, 2011; Yang et al., 2013; Pothen, 2014). From other work, a third category, i.e., medium-rare earths (MREEs) is used to describe samarium, europium, and gadolinium (Chen, 2011; Hatch, 2011; Tharumarajah and Koltun, 2011). Table 1 lists the 17 REEs with their main applications, with applications related to energy in bold.
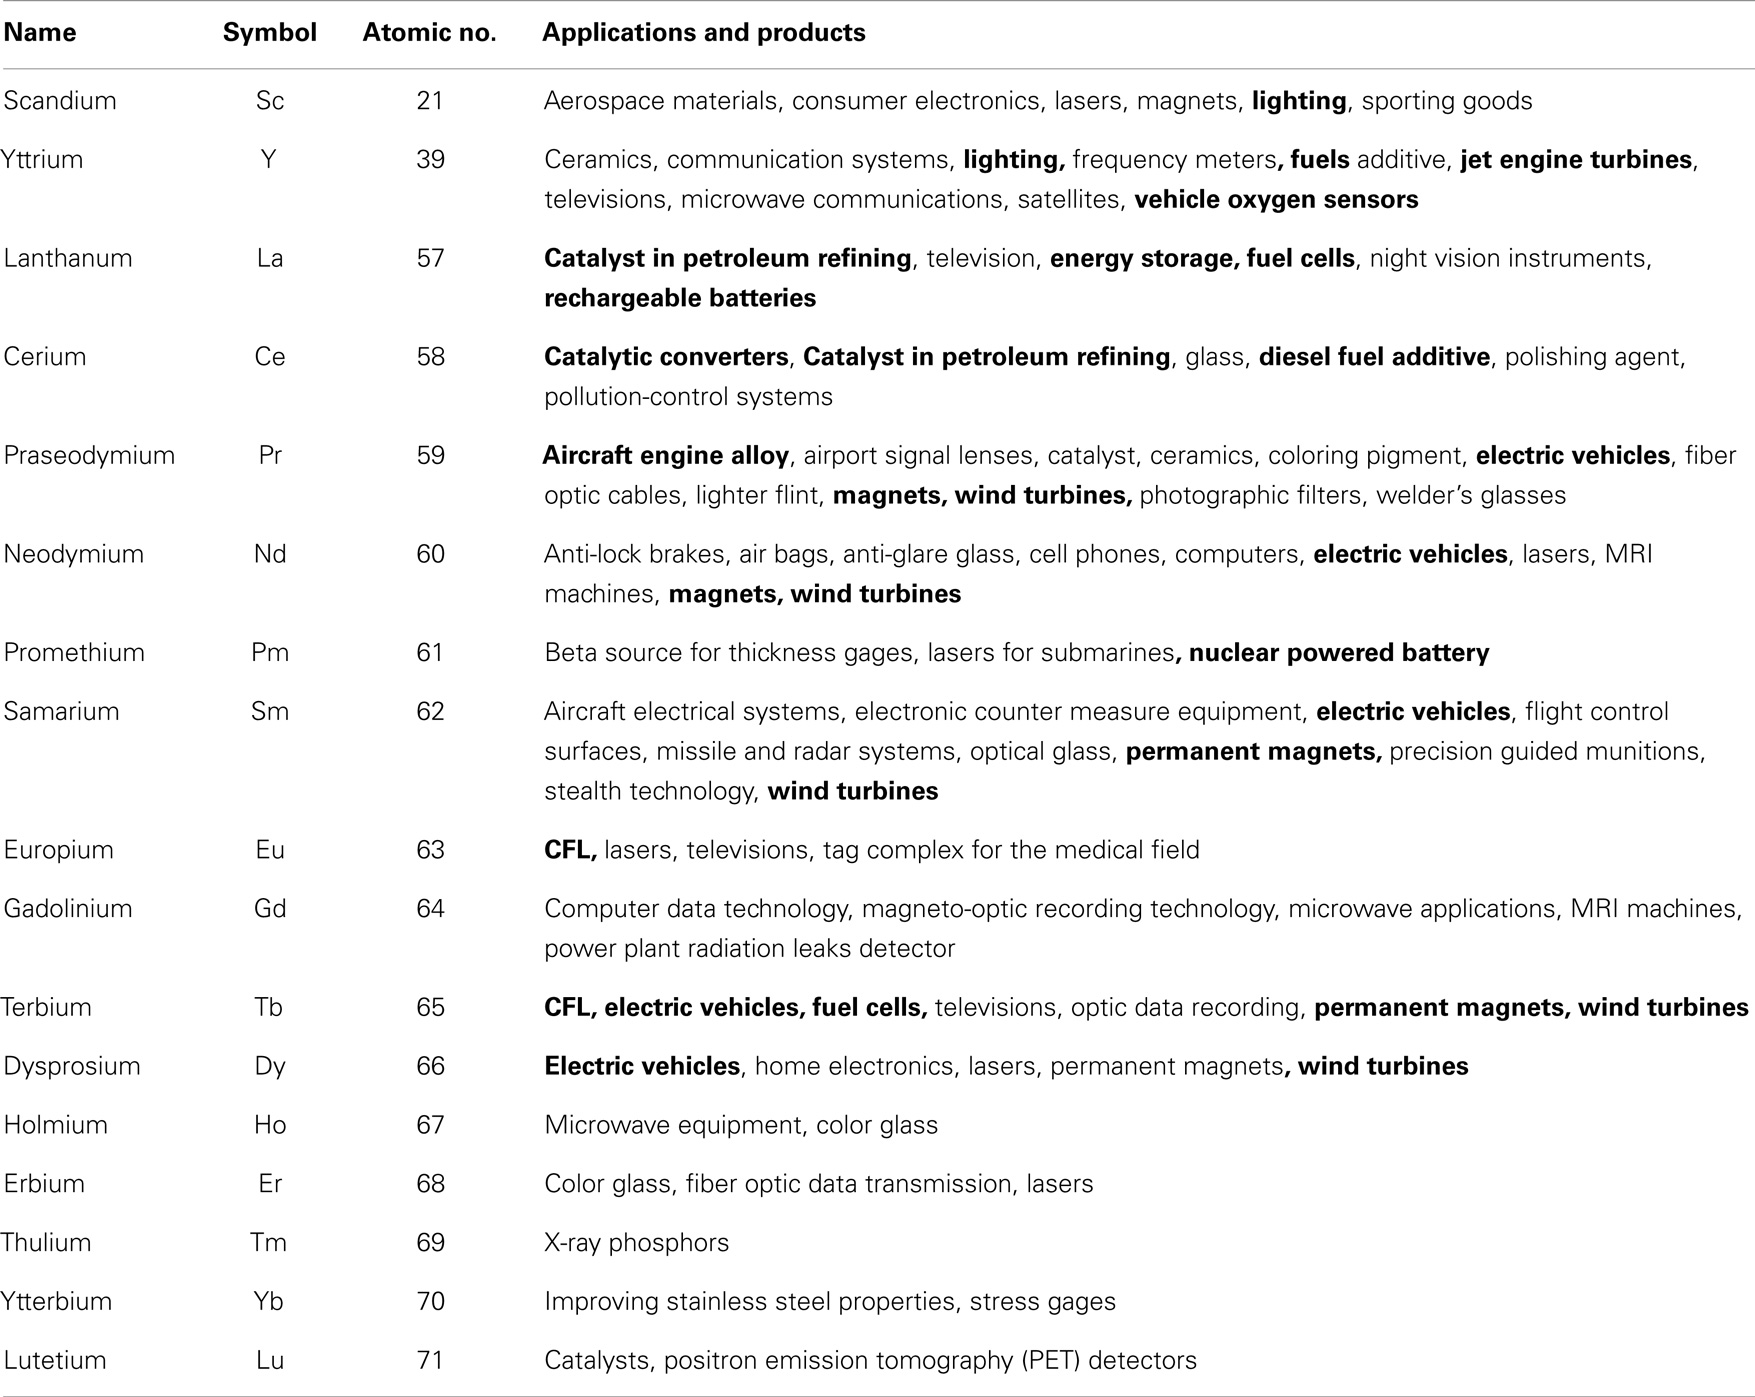
Table 1. REEs and their applications (Gupta and Krishnamurthy, 2005; Hurst, 2010; Hatch, 2012).
Rare-earth elements have traditionally been applied in a variety of domains and products, including catalysts, ceramics, communications, electronics, lighting, phosphors, and polishing powders (Eggert et al., 2008; Hatch, 2012; White et al., 2013). What distinguishes REEs from other elements is their particular electronic structures (i.e., 4f orbitals), which offer unique chemical, structural, and physical properties (Korinek and Kim, 2010; Graf et al., 2013; Fouquet and Martel-Jantin, 2014). The REE industry’s importance has ballooned in the last few years, emerging from an industry that was widely ignored to one that is essential to an environmentally efficient economy (Bourzac, 2010; Kara et al., 2010; Binnemans et al., 2013; Clapper, 2013; Adibi et al., 2014). Furthermore, REEs have gained worldwide attention, given their application in hybrid vehicles, wind turbines, and military systems (Hagelüken and Meskers, 2009; Grasso, 2013; Kifle et al., 2013; Lewis and Jiménez-Villacorta, 2013; Bogue, 2014). For example, it is estimated that wind turbines, incorporating NdFeB magnets, contain 171 kg of REEs per MW of capacity (Wallington et al., 2013). Also, the properties of REEs allow them be used to miniaturize components and appliances (Brown et al., 2002; Chakhmouradian and Wall, 2012). Given that REEs provide critical functionality in many applications, especially sustainable mobility and energy supply (Gibson and Parkinson, 2011; Alonso et al., 2012; Hatch, 2012), the interest and need for them is growing and will continue to grow (Bauer et al., 2010; Paul and Campbell, 2011; Moss et al., 2013; Wallington et al., 2013).
Accounting for more than 90% of the total world supply, China is currently the largest producer of REEs (Chu and Majumdar, 2012). However, in 2008, China began the process of implementing a REE production quota as well as limiting the number of permitted exporters, which has made the global REE market extremely volatile (Walters et al., 2010). This has forced other countries to examine their supply chains for potential risks (Gambogi and Cordier, 2010; Hurst, 2010; Tse, 2011; McLellan et al., 2013; He, 2014). In 2008, the European Union (EU), through the European Commission’s Raw Material Supply Group, prepared a national plan recommending direct actions be taken to increase market accessibility, increase investments in R&D, and support recycling programs (Blakely et al., 2012). The EU has also established the Strategic Energy Technology Plan, which aims to promote renewable resources and energy efficiency in order to tackle climate change (Moss et al., 2011). Japanese firms and the Japanese government have searched for mines throughout Asia, Africa, and the Americas to secure supplies of REEs (Humphries, 2011; Blakely et al., 2012). In 2011 and 2012, the U.S. Department of Energy (DOE) released the Critical Materials Strategies, calling for a reduced dependence on critical materials, as well as ensuring that energy technologies are not obstructed by future supply shortages (Grasso, 2013). The most critical materials identified by the DOE are all REEs: Dy, Nd, Tb, Eu, and Y (Bauer et al., 2010). The Critical Materials Energy Innovation hub was established recently to address challenges in mineral processing, material substitution, and reuse and recycling (EERE Network News, 2012; Goldman, 2014).
Although many REEs are critically important to sustainable mobility and energy supply, production of REEs itself incurs significant environmental damages (Schüler et al., 2011; Ali, 2014). The Mountain Pass mine in California, which operated by MolyCorp and dominated the world REE production for decades (accounting for 70% of the world’s supply in the 1970s and 1980s), closed in 2002 (Bourzac, 2010; Chakhmouradian and Wall, 2012; Shujing, 2013). One of the two major causes of this closure is environmental issues with the other being intensive price competition from Chinese producers (Meyer and Bras, 2011; Schüler et al., 2011; Fuerstenau, 2013).
Similarly, large scale REE production in China has raised serious environmental concerns, particularly with regards to heavy metal and radioactive emissions in groundwater, river ways, soil, plants, and the atmosphere around mine sites (He et al., 2004; Liang et al., 2014). The Chinese Society of Rare Earths, estimate that a ton of REE produces 8.5 kg of fluorine and 13 kg of flue dust, while refining with H2SO4 generates 9,600–12,000 m3 of gas containing flue dust concentrate, HF, SO2, and H2SO4 (Paul and Campbell, 2011; Sonich-Mullin, 2012). Other estimates indicate that producing one ton of REEs creates 60,000 m3 of gases mixed with H2SO4 and HF, 200 m3 of acid water, and 1.4 tons of radioactive waste (China Daily, 2009; Blakely et al., 2012). In addition, long-term mining dust inhalation can cause pneumoconiosis (black lung) (Hirano and Suzuki, 1996; China Daily, 2009). For example, the city of Baotou, located 120 km from the Bayan Obo mine, has had considerable pollution issues due to the nearby REE processing facilities (The Guardian, 2012). The Chinese government has cited environmental damage as one of the major drivers to close heavy pollution facilities and limit production (Blakely et al., 2012; Ting and Seaman, 2013). Overall, production of REEs involves a large number of process steps, out of which many incur significant material/energy consumption and environmental release (Golev et al., 2014). A comprehensive assessment of the environmental impacts represents a key first step toward reducing the environmental damage of REE production.
Currently, the most widely accepted (and arguably the most objective) methodology for environmental sustainability assessment is life-cycle assessment (LCA) (Ness et al., 2007; Evans et al., 2009). In recent years, LCA has become a core tool in sustainable product development and environmental policy making for companies and governments all over the world (Guinee et al., 2010). This paper starts by providing a brief overview of the LCA methodology, followed by a concise introduction of major REE production routes with a focus on material/energy flows and environmental emissions. Published LCA studies related to REEs are then reviewed to identify knowledge gaps and future efforts needed.
Overview of Life-Cycle Assessment
In short, LCA takes a holistic approach and provides a complete view of the environmental impacts over the entire life cycle of a process or product, from raw material extraction and acquisition, manufacturing, transportation and distribution, use and maintenance, reuse and recycle, and all the way to disposal and waste management (Curran, 2006; Lehtinen et al., 2011; Lizin et al., 2013). LCA avoids shifting environmental consequences from one life-cycle stage to another, from one geographic area to another, and from one environmental medium to another. LCA has been used to study the environmental impact of energy technologies such as electric vehicles, solar photovoltaics, wind turbines, etc. (Samaras and Meisterling, 2008; Martinez et al., 2009; Tremeac and Meunier, 2009; Garrett and Rønde, 2013; Lizin et al., 2013). ISO 14040 and 14044 developed by the International Standards Organization provide principles and guidelines for evaluating environmental impacts of products using LCA (Suh and Huppes, 2005; Finkbeiner et al., 2006; ISO, 2006; Ness et al., 2007). According to ISO 14040, a typical LCA can be carried out in four interdependent steps: goal and scope definition, life-cycle inventory (LCI), life-cycle impact assessment (LCIA), and interpretation of results (Figure 1) (Curran, 2006; Lizin et al., 2013; Weidema et al., 2013). It should be noted that several iterations are generally needed when conducting an LCA (shown as the bi-directional arrows in Figure 1).
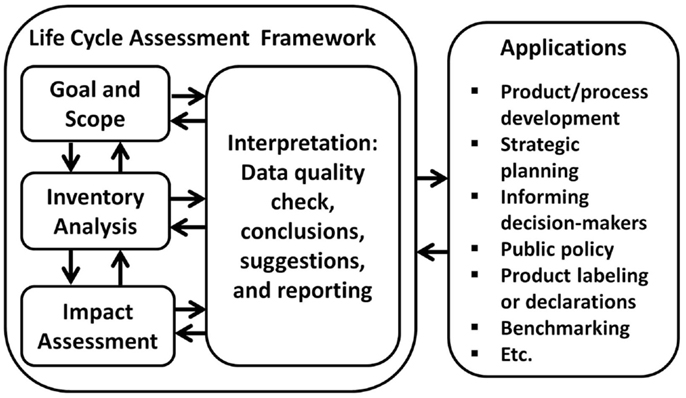
Figure 1. Four main steps for LCA (ISO, 2006; Guinee et al., 2010).
Goal and Scope
The first step of an LCA is to define the goal and scope. This step includes specifying the goal, the intended application, the reason for which the study will be conducted, and the audience to whom the results will be communicated. Given the goal of the study, the scope should be defined in a way such that the breadth, depth, and detail are consistent with the stated goal. In general, the scope defines the product system of interest, the function delivered by the system, the system boundary, data requirements, environmental impacts considered, and methodology of impact assessment, limitations, and assumptions of the study. To ensure comparability of LCA results, a functional unit must be defined during the goal and scope definition stage. According to Lehtinen et al. (2011), a functional unit is a unit of service used to measure what will be delivered by the product or process.
Life-Cycle Inventory Analysis
Life-cycle inventory analysis is a technical, data-based process of quantifying energy and raw material requirements, and emissions over the entire life-cycle of the product or process in order to deliver the service defined by the functional unit. The LCI is a critical component as it is the data foundation of the LCA study. The approach adopted by ISO 14044 is to compile the inventory based on the inputs and outputs from each of the processes (referred to as unit processes) involved in a product’s life cycle (Suh and Huppes, 2005; EU Commission, 2010). For this reason, having transparent, up-to-date information for the LCI is highly desirable. The LCI can establish baseline information for improvement, rank contributions from an individual process or life-cycle stage, and identify data gaps.
For an actual product system, an LCI analysis can be time and resource demanding. When a unit process-based approach is adopted, it is common to apply certain cutoff criteria to make the system more tangible given the constraints on time and resources. The cutoff can be done based on mass or energy balance. For example, all the material inputs to a product system can be ranked based on their mass and a mass-based cutoff with 90% balance will exclude the inputs at the bottom of the ranked list (i.e., those adding up to 10% of total mass) from the inventory analysis.
Many industrial processes deliver more than one product. An important aspect of LCI analysis is how to treat co-products. ISO standards recommend system expansion, which treats co-products as avoided burden. This approach requires inventory data for processes that deliver the co-products of interest as their main products, thus additional efforts are needed. It should be noted that system expansion is not always possible as the “avoided” production process for co-products of interest may not exist in reality. As an alternative, allocation based on mass, energy, or economic value can be used.
To facilitate inventory analysis, many LCI databases have been developed. These include Ecoinvent, GaBi, SimaPro, ELCD, and US LCI. These databases have a decent coverage on processes, and efforts are being made to further expand their coverage. As an alternative to the unit process-based inventory analysis, LCI can also be developed based on economic flows in and out of a product system. The approach, referred to as Economic input–output LCA, relies on an economic input–output table and sector level environmental emissions (Hendrickson et al., 1998; Curran, 2006; Samaras and Meisterling, 2008). EIO-LCA requires much less time and effort for inventory analysis, but the inventory derived is highly aggregated and only has sector level resolution, which may not be sufficient for many applications.
Life-Cycle Impact Assessment
The LCIA step of an LCA study is used to evaluate the significance of potential environmental impacts using inventory data, and providing information for the interpretation step. This is generally done through classification, i.e., associating inventory data with environmental impact categories and characterization, i.e., calculating the impacts using characterization models and presenting the results as magnitude of category indicators (ISO, 2006; Lehtinen et al., 2011). Many LCIA methodologies have been developed, e.g., CML, Eco-indicator, ReCiPe, and TRACI (Hischier et al., 2010). These methodologies may classify environmental impacts into different categories and the common impact categories considered include global warming, ozone depletion, acidification, eutrophication, photochemical smog, fossil fuel depletion, mineral depletion, terrestrial/aquatic toxicity, human health risks, land use, and water use (Garrett and Rønde, 2013; Adibi et al., 2014). The category indicator results can be further normalized, grouped, and weighted to derive a single score of environmental performance.
When conducting the LCIA, either midpoint or endpoint characterization can be used. As the names imply, midpoint assessment stops at the midpoint of the cause-effect chain. It is largely problem-oriented, rather than damage-oriented as in the case of endpoint assessment (Pre Consultants, 2014). For example, when evaluating the impacts of global warming, midpoint assessment measures global warming potential, i.e., the relative potency of different greenhouse gases such as carbon dioxide, methane, and nitrous oxide, and reports the results in term of kg CO2-equivalent. On the other hand, endpoint assessment will quantify the environmental damages caused by greenhouse gases in term of flooding, extinction of species, and human lives lost. Endpoint assessments are easier to understand for the general public, but carry a higher uncertainty (mainly due to the complexity of modeling and value choices) when compared to midpoint assessments.
Interpreting the Results
The last step in an LCA study is the interpretation of results. The findings from the LCI and LCIA are considered together. The results will be discussed and summarized in the form of conclusions and recommendations, and presented to decision makers (Lehtinen et al., 2011). It is very important that the findings should be consistent with the goal and scope defined earlier. If any discrepancies arise, iterative reviewing and revising of the goal and scope, and subsequently LCI and LCIA steps may be required.
Lastly, an uncertainty analysis plays a substantial role in LCAs. With data coming from different sources and the lack of representativeness for many industries, relying on a simple point estimate to draw conclusions and recommendations can be considered questionable. An uncertainty analysis provides decision makers a better understanding of the reliability and level of confidence of the results. Furthermore, uncertainties exist with regard to the level of technology penetration and selection of technologies, which are usually handled with a scenario analysis.
Major REE Production Pathways
REE Resources and Reserves
Rare-earth elements are widely distributed throughout the world (Liu and Bongaerts, 2014). These elements are actually not rare, but they are difficult to extract and purify given their low concentrations in ores. Globally, they are found in concentrations of around 0.8%, which is larger than copper and lead reserves (Fouquet and Martel-Jantin, 2014; Liang et al., 2014). The most abundant REE is Ce (60 ppm), while the least plentiful are Tm and Lu (0.5 ppm), which are still more abundant than gold (0.001 ppm) (Emsley, 2011; Kifle et al., 2013; Lewis and Jiménez-Villacorta, 2013; Massari and Ruberti, 2013).
It is estimated that there are 110 million tons of rare-earth oxides (REOs) reserves worldwide (United States Geological Survey, 2013; Liu and Bongaerts, 2014). Between the years 1995 and 2007, the in-use stock of REOs increased from 80 to 120 million killograms per year, with some REEs (Sm, Gd, Dy, Er, and Yb) tripling in the same time span (Du and Graedel, 2011a). While many countries have significant reserves of REEs, China provided approximately 95–97% of global REEs in 2011, falling to 85% by 2012 (Schüler et al., 2011; Chakhmouradian and Wall, 2012; Sonich-Mullin, 2012; United States Geological Survey, 2013). Additionally, over 90% of REE purification occurs in China. (Dobransky, 2012; Kynicky et al., 2012; Massari and Ruberti, 2013; United States Geological Survey, 2013; Yang et al., 2013).
The major types of REE ores are bastnasite, monazite, xenotime, and ion-adsorption clays (Golev et al., 2014; Liu and Bongaerts, 2014). A summary of the compositions, reserve amounts, and main reserve locations for the four major REE minerals can be seen in Table 2. Bastnasite is the most common REE containing mineral. Xenotime is usually found along with monazite (Jordens et al., 2013), but is not currently mined at a significant level.
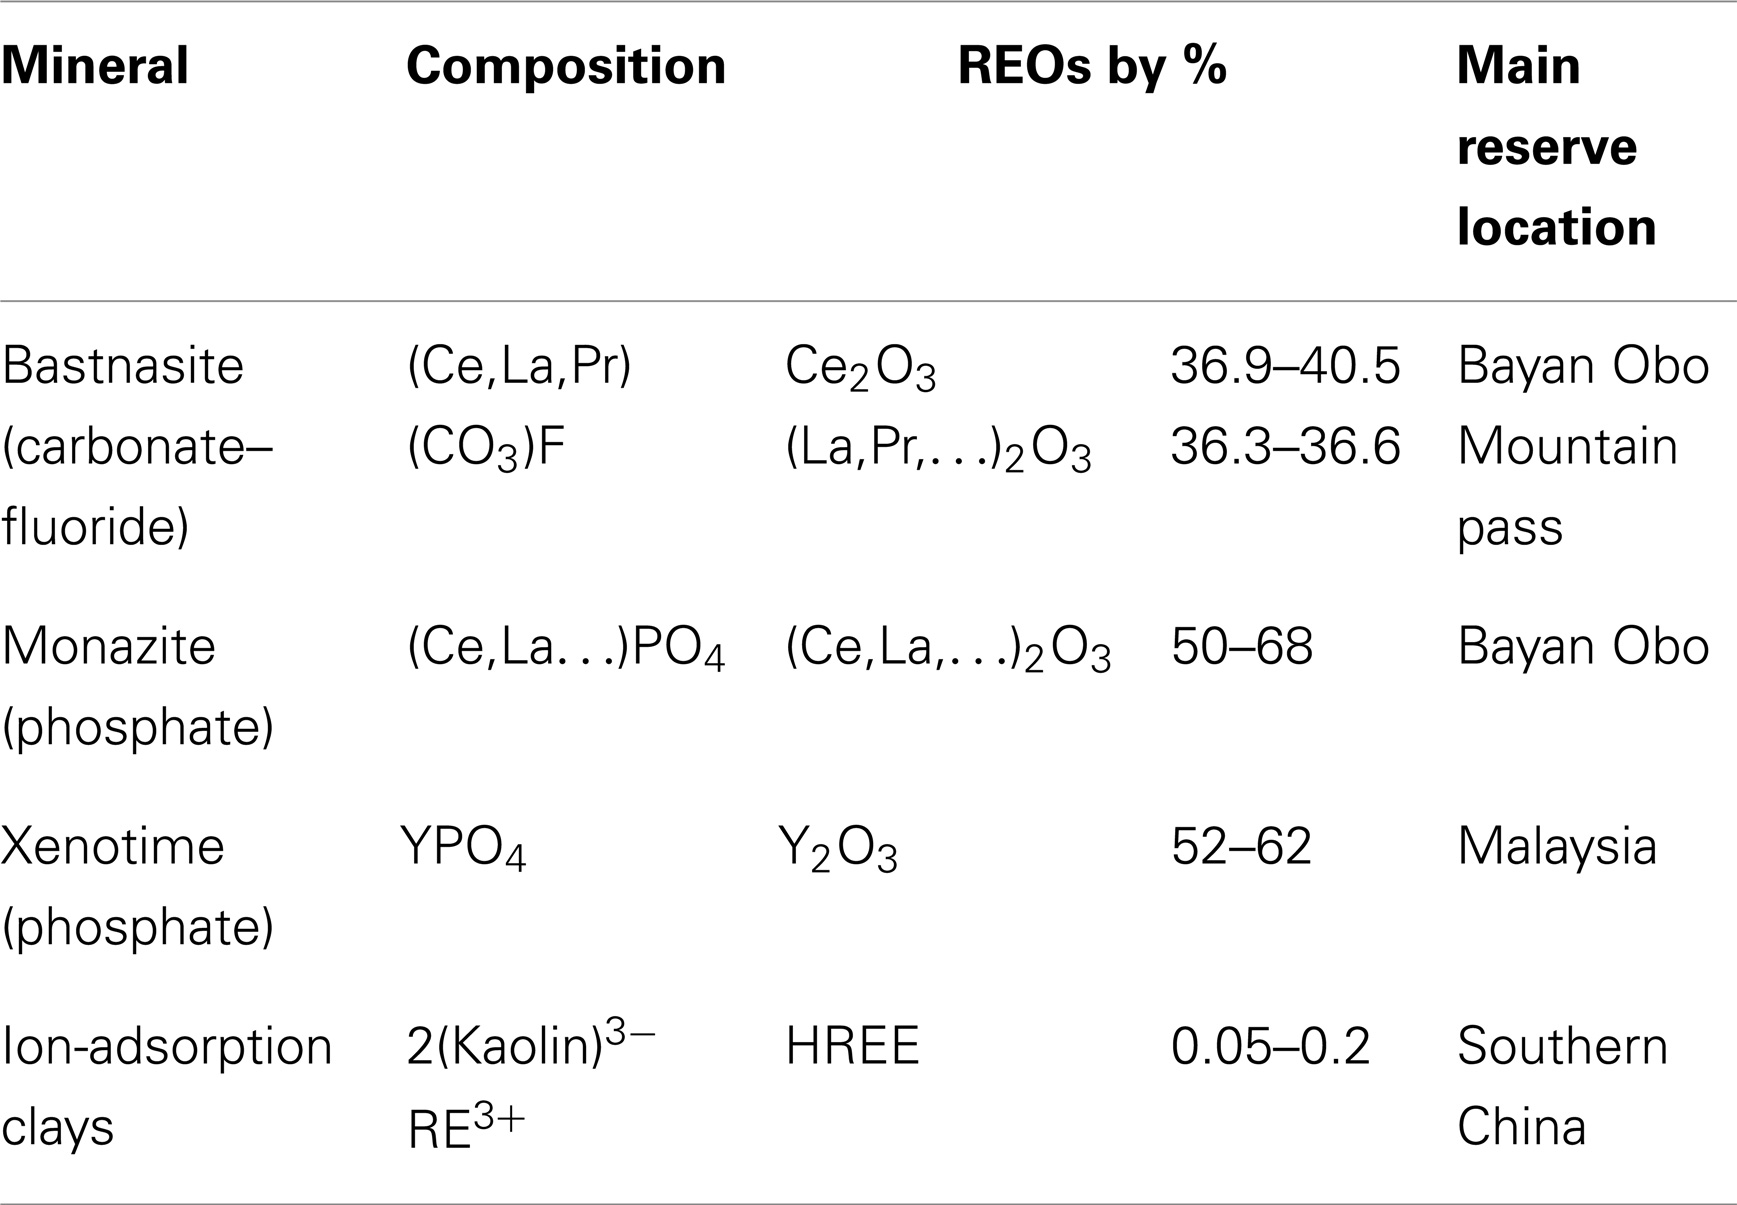
Table 2. Major REE containing minerals and locations (Gupta and Krishnamurthy, 2005).
REE Ores Processing Routes
As can be seen in Figure 2, the major steps in the processing of REEs ores include: mining, beneficiation, chemical treatment, separation, reduction, refining, and purifying. The first step is to mine ores with REO concentration varying from 0.05 to 10%, depending on the mine site and ore types (Fuerstenau, 2013; Golev et al., 2014). The methods for mining REEs ores can vary from placer mining, underground mining, open pit mining, and in situ mining (Walters et al., 2010; Sonich-Mullin, 2012). The majority of LREEs and HREEs are produced via open pit mines and in situ mining, respectively (Yang et al., 2013).
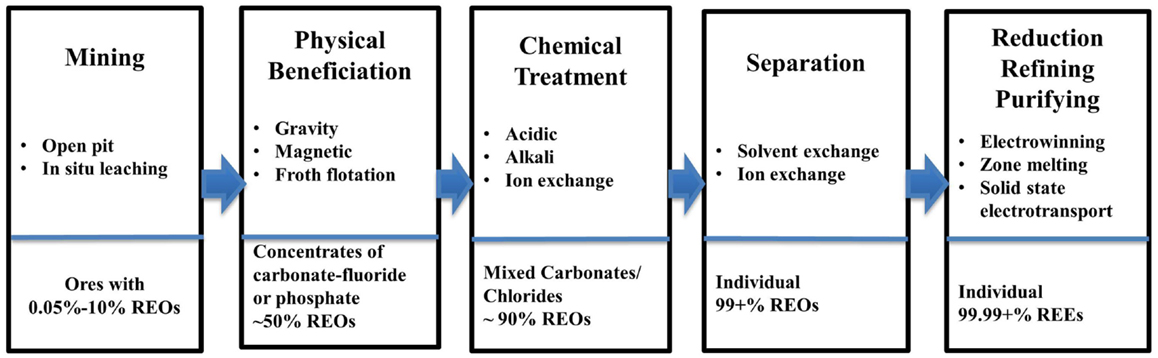
Figure 2. General processing routes for REE ores.
In step two, a physical beneficiation processes separates the RE minerals from gangue minerals to produce a RE mineral concentrate (Zhang and Edwards, 2013). The resulting concentration is approximately 50% REOs (Gupta and Krishnamurthy, 2005). There is little or no beneficiation needed for ion-adsorption clays, given the way the REE minerals are presented in the ore (Jordens et al., 2013).
The beneficiation process can include: grinding, sifting, gravitational separation, magnetic separation, and froth flotation. Froth flotation is widely used given its ability to process a wide range of ore particle sizes (Jordens et al., 2013). Some processes, such as gravitational separation, have little heating requirement and do not require chemicals, making their environmental impact minimal (Falconer, 2003). Common collectors for bastnasite froth floatation include hydroxamats, fatty acids, dicarboxylic acids, and organic phosphoric acids (Jordens et al., 2013). Depressants commonly used include sodium silicate, sodium hexafluorosilicate, lignin sulfonate, and sodium carbonate (soda ash or Na2CO3) (Jordens et al., 2013). Monazite flotation uses minerals such as ilmenite, rutile, quartz, and zircon, while the depressants include sodium silicate, sodium sulfide, and sodium oxalate (Jordens et al., 2013). In many operations, there are large tailings ponds with wastes from the various processes (Walters et al., 2010). The mixture of wastewater, chemicals used for processing, and ground-up materials (including heavy metals) carry a major environmental impact (Schüler et al., 2011). In addition, these wastes include radioactive elements such as thorium (Th) and uranium (U) (Chen, 2011; de Boer and Lammertsma, 2013).
Step three and four of the REE processing route involves chemical treatment (or “cracking”) and separation. REE minerals (in the form of fluorocarbonates and phosphates) have to be converted to carbonates or chlorides before separation can be done via ion exchange or solvent extraction (McGill, 2000). Chemical treatment of the concentrates will also remove impurities and increase REOs concentration to around 90%. The chemical treatment process reagents can include inorganic acids [sulfuric acid (H2SO4), hydrochloric acid (HCl), and HNO3], alkalis (NaOH and Na2CO3), and electrolytes ((NH4)2SO4, NH4Cl, and NaCl). H2SO4 and the alkalis are mainly used for phosphate and carbonate–fluoride ores like monazite and bastnasite (Zhang and Edwards, 2013). High temperature acid roasting is a common practice used in China, emitting fluoride (HF), sulfur dioxide (SO2), sulfur trioxide (SO3), and silicon tetrafluoride (SiF4) (Zhang and Edwards, 2013). A water scrubber (which collects impurities extracted by solvent) is used to capture most exhaust gases. Typically, HF, H2SO4, and H2SiF6 can be recovered in the initial scrub and a second scrubber using diluted Na2CO3 solution is used to purify the exhaust as it is being released (Zhang and Edwards, 2013).
Step four of the process involves separation to get individual REOs, for which solvent extraction is commonly used (Fuerstenau, 2013). This process utilizes the small differences in basicity, and through this step, the REO content can be in excess of 99% (Gupta and Krishnamurthy, 2005). However, since the differences in basicity among REEs are small, separation for individual REOs is both time and cost intensive. Multiple stage solvent extraction is a very common procedure, and the following scheme is typically used: separation of REO in trivalent stage, fractionation of REOs into three or four groups, separation of Y, extraction of Ce (Ce4+) and Eu (Eu2+), and separation of desired individual REO (Gupta and Krishnamurthy, 2005). Common extractants used in industry include di-2-ethylhexyl-phosphoric acid (D2EHPA or P204) and 2-ethylhexyl phosphonic acid mono-2-ethylhexyl ester (HEH/EHP or P507) (Chang et al., 2010; Radhika et al., 2011; Wang et al., 2011, 2014). Another process for REO separation is ion exchange that can be used to get REOs with purities exceeding 99.9999%, but it is less economical (McGill, 2000).
Step five involves the reduction, refining, and purifying of the REEs. Reduction is the processes where the REE is derived from the REO compound (Gupta and Krishnamurthy, 2005). On an industrial scale, this is generally achieved through metallothermic reduction in molten salt or fused salt electrolysis (electrowinning). Finally, the refining and purifying stage can involve fused salt electrolysis, molten salt oxide reduction, metallothermic reduction, zone melting, solid state transport (solid state electrolysis), etc., where the REE purity can reach 99.99 + %. High purity REEs cannot be achieved through one refining technique as a sequence of processes has to be applied (Gupta and Krishnamurthy, 2005).
There are three major mining sites for REEs: Bayan Obo, Mountain Pass, and Southern China (Eggert et al., 2008; Kynicky et al., 2012). Although, overall the production route at each site is similar to that presented in Figure 2, ores at each site have different composition and the process routes deviate from Figure 2 to different extents (except for Step 5). In the following sections, description of the three major process routes are provided with particular attention paid to material/energy consumptions and environmental releases associated with each process step. It should be noted that these three processing routes are the most widely studied throughout literature.
Processing route at Bayan Obo mine
The Bayan Obo mine in Inner Mongolia, China has the largest reserves of REEs in the world, and accounts for 83.7% of Chinese reserves (Walters et al., 2010; Yang et al., 2013). The Bayan Obo mine contains bastnasite and monazite with approximately 4.1% REOs (Peiró and Méndez, 2013; Yang et al., 2013). In the Bayan Obo route, the REEs are by-products of iron ore extraction, and per 350 kg of iron mined 60 kg of REOs and 1.3 kg niobium are produced (Ayres and Peiró, 2013). At Bayan Obo, the ore is mined with electric shovels, rail haulage, and shipped via 150 km of railroad to milling and processing facilities in the city of Baotou (Castor and Hedrick, 2006). Norgate and Haque (2010) concluded that for iron ore mining the total greenhouse gas emissions are 11.9 kg CO2-eq/ton. Considering that REEs are by-products, allocation should be used to determine the impact of REEs (Martinez et al., 2009).
For the Bayan Obo ores, there are mainly six different beneficiation routes being used (Wu, 2005). A typical route is shown in Figure 3, which begins with at least 90% of the ore being ground to less than 74 μm in preparation for the froth flotation process. Na2CO3 is used as a pH regulator with Na2SiO3 as the depressant of iron minerals and silicates and paraffin soap as a collector (Gupta and Krishnamurthy, 2005). The depressed iron minerals and silicates, which remain at the bottom of the flotation cells, are taken for iron beneficiation and niobium recovery. After eliminating the surplus fatty acid collector by thickening and desliming, selective REO flotation is carried out. This is accomplished with Na2CO3 as the pH regulator, Na2SiO3 and Na2SiF6 as gangue depressants, and hydroxamic acid as the collector. The depressed calcite, fluorite, and barite settle to the cell bottom. After selective flotation, the rougher concentrate contains around 45% REO containing both monazite and bastnasite. The recovery of REO at this stage is approximately 80%. The final treatment includes cleaning or high intensity magnetic separation. This results in two concentrate fractions with the primary bastnasite having 68% REO concentrate and a secondary monazite containing 36% REO. The total recovery rate of REOs from the ore is around 61%, i.e., bastnasite at 25% and the monazite at 36%. After the flotation process, it is estimated that 80.63% of thorium, a radioactive element, remains in the tailings and 1.83% is in the REE concentrate (Liu and Bongaerts, 2014).
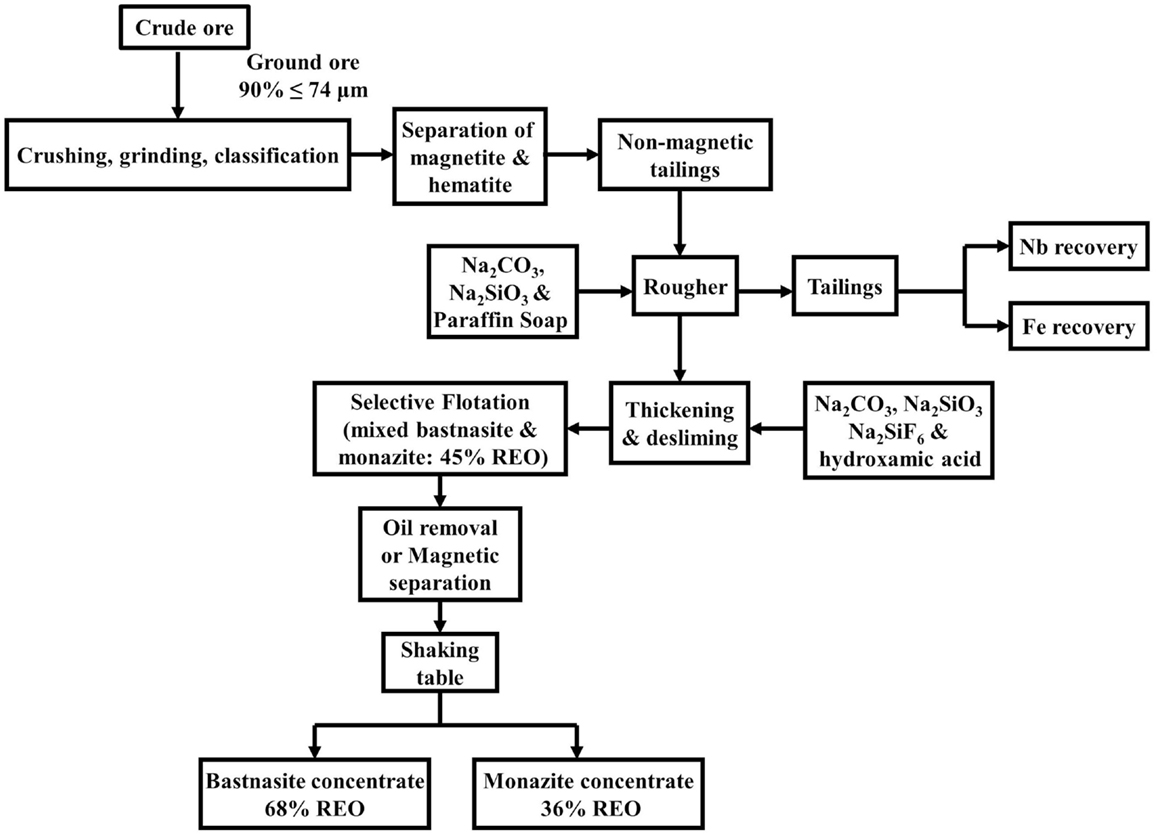
Figure 3. Typical beneficiation route for Bayan Obo REE ores (Gupta and Krishnamurthy, 2005).
Gupta and Krishnamurthy (2005) and Wu and Bian (2012) provide an example for the Bayan Obo process for “cracking” the REE minerals (Figure 4). The REE concentrates from beneficiation is processed using 98% H2SO4 being heated to 750°C in a rotary kiln. The roasting process breaks down the flurocarbonate content, while HF, CO2, and SO2 are released. The roasting residue is leached with water to dissolve rare-earth sulfates and the solution is then neutralized with MgO and FeCl3, leaving a residue containing Th. The purified leachate proceeds to be precipitated with ammonium bicarbonate (NH4HCO3). According to Schüler et al. (2011), chemical treatment to obtain 92% REO consumes between 1 and 1.2 tons of NH4HCO3. Next, it proceeds to water rinsing and filtration, releasing treated effluent into a nearby body of water, and resulting in REO carbonate. The major reactions are described in Eqs 1–6 (Gupta and Krishnamurthy, 2005; Zhang and Edwards, 2013).
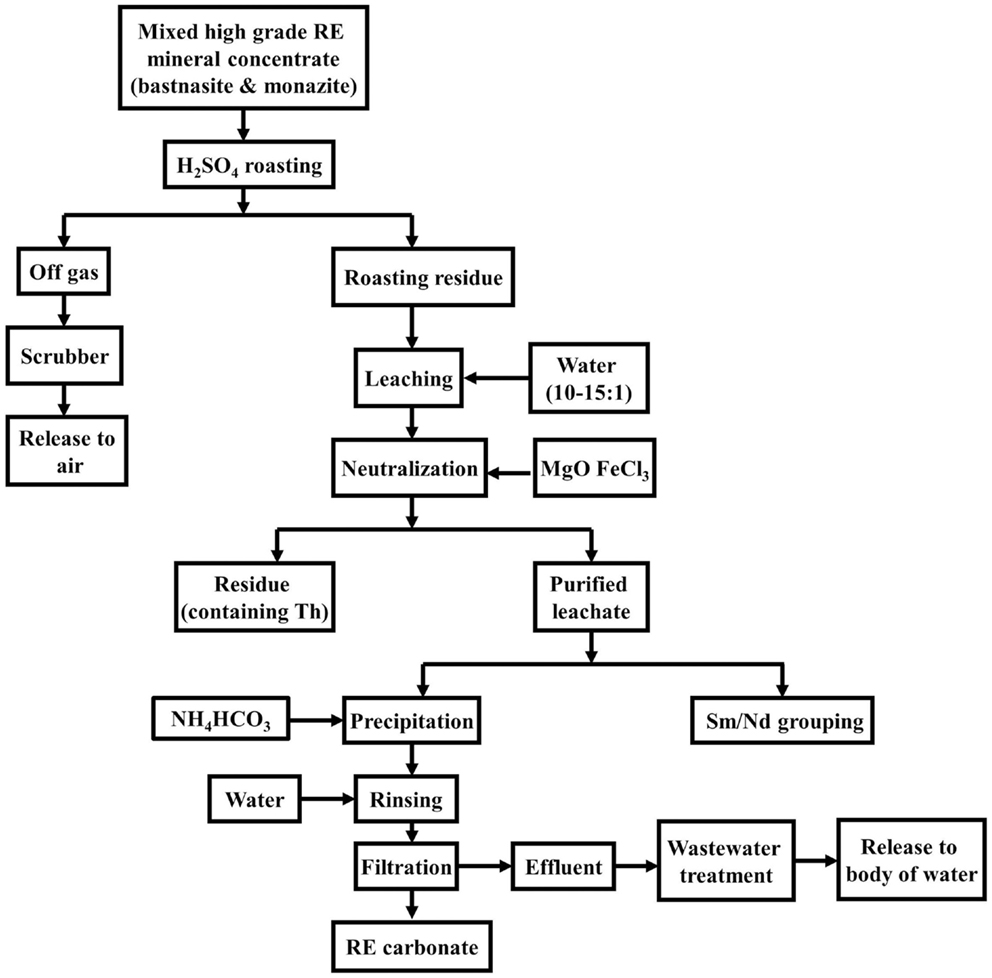
Figure 4. Chemical treatment of REE concentrates from Bayan Obo mine (Gupta and Krishnamurthy, 2005).
In addition to produce REE carbonates, the purified leachate can also go through Sm/Nd grouping. Figure 5 shows a typical Sm/Nd grouping procedure given by the China Beneficiation Technology Network (2009). In this grouping procedure, diluted P204 is used as the solvent and HCl is used to strip the loaded organic phase. The Sm group REEs (i.e., Sm, Eu, and Gd), are stripped first and then precipitated from strip liquor using NH4HCO3. The depleted aqueous phase (raffinate) contains REEs of La to Nd and goes through another round of solvent extraction. After HCl stripping, the strip liquor contains these REEs and further evaporation produces REE chlorides. To achieve individual REE of high purity, solvent extraction has to be repeated many times. Li et al. (2000) stated that separation for the Bayan Obo route can have more than 100 stages. Usually, mixtures of REE chlorides are used as feed to the solvent extraction process.
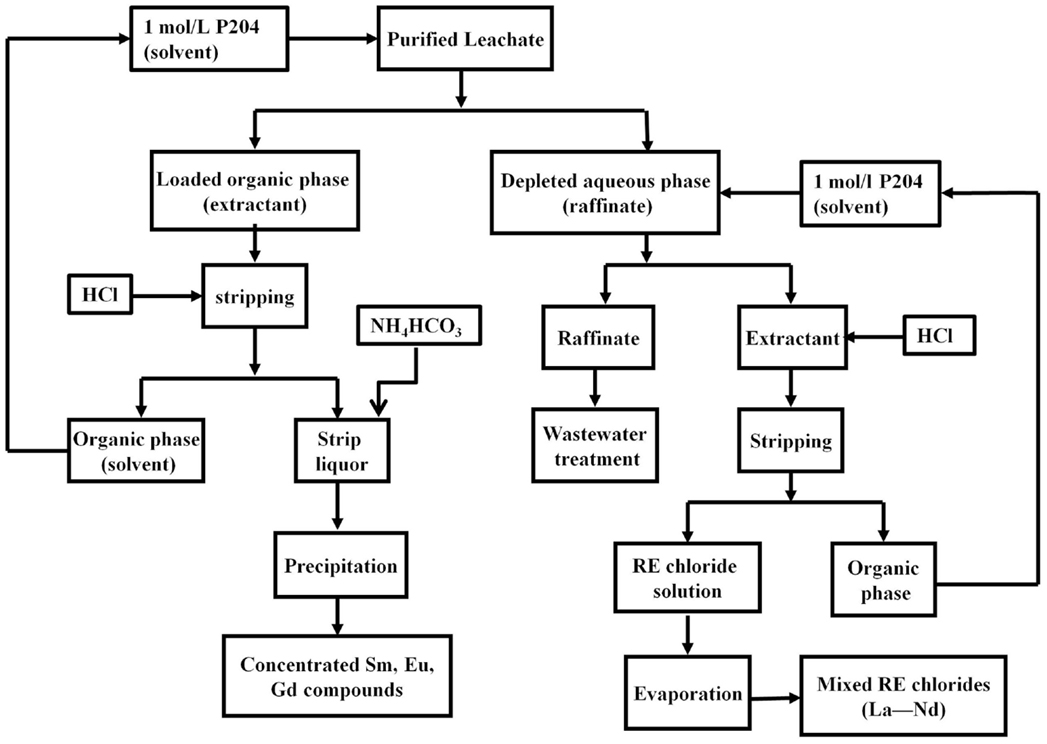
Figure 5. Sm/Nd grouping used by Bayan Obo mine (China Beneficiation Technology Network, 2009).
Processing route at Mountain Pass mine
The second largest REE mine, Mountain Pass mine in California contains an estimated 28 million tons of REO reserves (Kanazawa and Kamitani, 2006). The Mountain Pass mine’s main mineral is bastnasite containing between 5 and 10% REOs (Kanazawa and Kamitani, 2006; Fuerstenau, 2013). The mining for bastnasite from the Mountain Pass site varies from the Bayan Obo route, because the REEs are the only minerals of interest. Mining is done through the traditional open pit mining practices of drilling, blasting, loading, hauling, and milling (Gupta and Krishnamurthy, 2005). Mining wastes include soil storage piles, overburden, ore, and sub economic ore storage, as well as waste rock, which accounts for easily over 90% of the material extracted (Sonich-Mullin, 2012). The processing facilities for the ores are located near the extraction site.
The Mountain Pass facility has a different physical beneficiation process (Figure 6) given REE minerals are the sole interest (Gupta and Krishnamurthy, 2005). According to Fuerstenau (2013) and Gupta and Krishnamurthy (2005), the process begins with an ore averaging 10% of bastnasite and containing 7% REO. After the mineral is crushed and grounded, the mixture goes to six different conditioning treatments before entering a rough flotation process. Conditioning is carried out with steam being bubbled through the pulp. In the first stage, Na2CO3 (2.5–3.3 kg/ton), sodium fluosilicate (0.4 kg/ton), and steam are added to the pulp. The second stage is steam conditioning of the pulp. Ammonium lignin sulfonate (2.5–3.3 kg/ton) is added in the presence of steam in the third tank. The next three stages involve the conditioning of the pulp with steam, steam, and distilled tall oil C-30 (0.3 kg/ton) and steam, respectively.
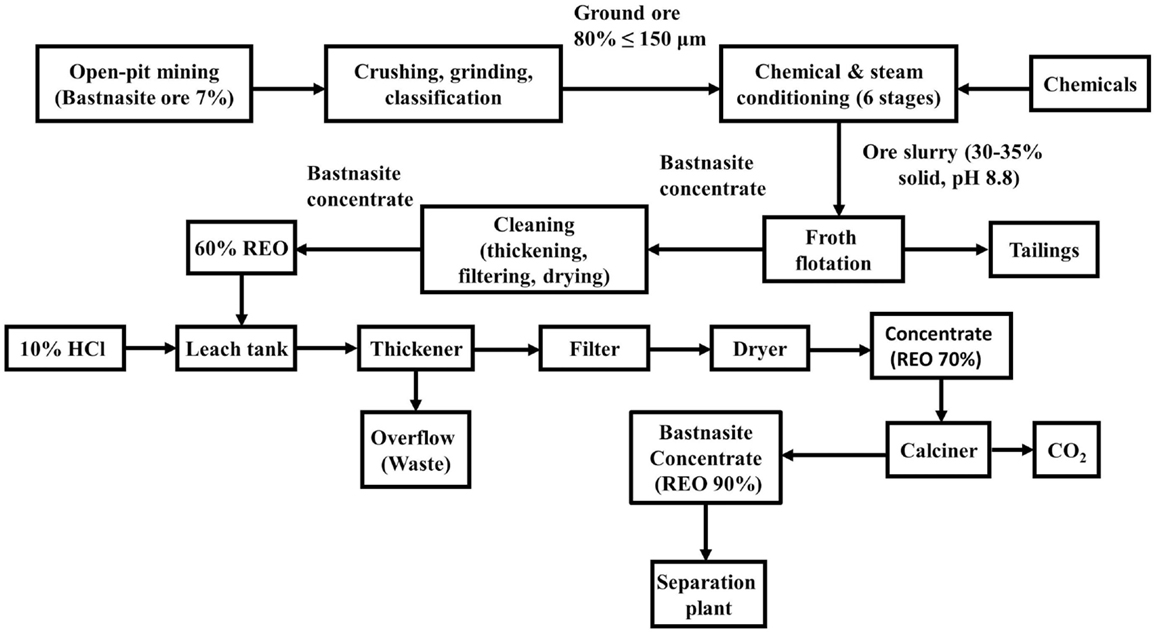
Figure 6. Beneficiation and chemical treatment at mountain pass mine (Gupta and Krishnamurthy, 2005).
After conditioning, the pulp containing 30–35% solids at pH 8.8 is pumped to the rougher cells. This is carried out in 12 flotation cells with capacities of 1,700 L with the final tails contain an average of 1–2% REO. The rougher concentrate assaying 30% REO, is then subjected to four states of cleaning at 50% solids where the tailings are recirculated. The flotation concentrate is thickened, filtered, dried, and packaged, to achieve a final concentrate assaying 60% REO, with an overall recovery of 65–70% of the rare earth. Finally, the concentrates are calcined and then treated with HCl (McGill, 2000).
Next, according to Fuerstenau (2013) and Gupta and Krishnamurthy (2005), the 60% REO bastnasite concentrate is leached with 10% HCl in 1.8 m-diameter leaching tanks. The corresponding reactions could be described in Eqs 7–9. Ca and Sr carbonates are thus removed, and the final leached product contains as high as 72% REO. Leached concentrates can be further calcined in roasters to remove CO2 to produce a 90%+ REO product.
and
Gupta and Krishnamurthy (2005) also provide an example for separation of the Eu2O3 (Figure 7). This process starts with a chloride solution of 100 g REO/L and 0.2 g Eu2O3/L containing all the REEs except Ce. The solution is clarified and the pH is adjusted to 1.0 with Na2CO3. Next, it is steam heated to 60°C, clarified again, and put through a Eu recovery circuit. The solvent used is 10% P204 in kerosene with the extraction taking place in five mixer settler stages, and the loaded organic stripped with 4 M HCl. The stripped solution containing 10–20 g Eu/L, also contains Fe that is precipitated out at 3.5 pH with Na2CO3.
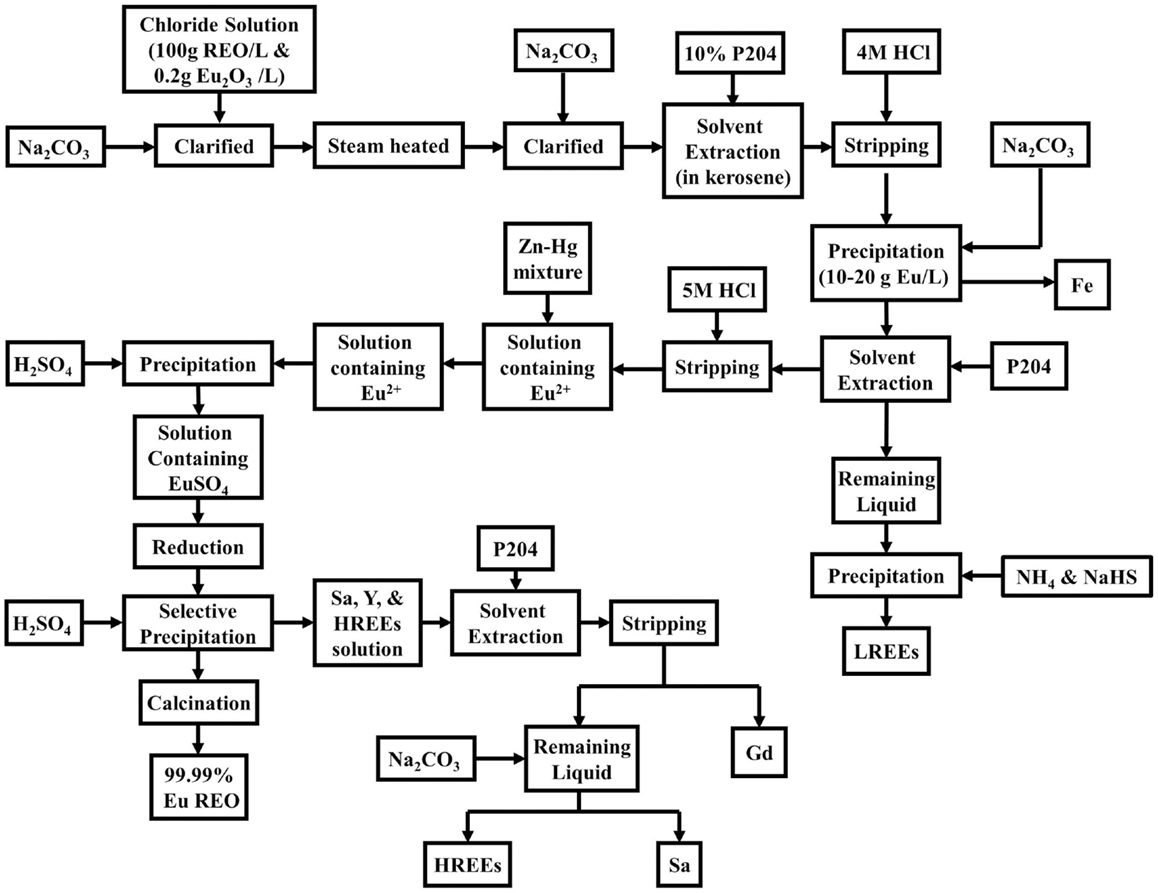
Figure 7. Separation of Eu2O3 and other REEs at mountain pass mine (Gupta and Krishnamurthy, 2005).
Following the Fe removal, the solution goes through more solvent extraction with P204 in another five mixer settler stages. This further purifies the Eu REO, leaving LREE in the remaining liquid, which can be precipitated using NH4 and NaHS. Now, the Eu in the organic is stripped with 5 M HCl. The solution is passed through a column of Zn–Hg mixture to reduce Eu3+ to Eu2+, i.e. the trivalent and divalent oxidation states, respectively, where there are valence electrons. Next, H2SO4 is added to the Eu2+ solution to precipitate Eu sulfate. Reduction and selective precipitation purify Eu from the HREEs, and more than 99.99% Eu REO is obtained by calcination. After Eu removal, the solution still contains Sa, Y, and HREEs. Ga is extracted from this solution by P204 in a 10-stage extraction circuit followed by five stages of stripping. Finally, the remaining liquid is neutralized with Na2CO3 to precipitate Sa and the HREEs. Similar processing route exists for yttrium separation. Overall, to retrieve individual REEs, multi-stage solvent extraction is needed. Here, the approach at Mountain Pass is similar to that adopted at the Bayan Obo processing route. It should be noted that Molycorp predicted that after renovating their mining facilities their annual operations would produce 67.67 ton/year of CO2 emissions, 20.66 ton/year of VOC emissions, 282.3 ton/year in NOx emissions, and 2.23 ton/year in SOx emissions (Meyer and Bras, 2011).
Processing route for ion-adsorption clay in Southern China
The ion-adsorption ores are mainly mined and processed in seven provinces of southern China, representing 2.9% of reserves (Schüler et al., 2011; Yang et al., 2013). The REEs in ion-adsorption ores are adsorbed on the surface of clay minerals with REO concentration 0.05–0.2% (Kanazawa and Kamitani, 2006; Moldoveanu and Papangelakis, 2012; Golev et al., 2014). Although the grade of ion-adsorption ores seems low, the ion state of REEs makes extraction and processing easier. In addition, ion-adsorption ores contain high concentrations of HREEs. For example, ion-adsorption clay at Longnan, Jiangxi Province has 6.7% Dy and 65% Y, which are much higher than the bastnasite and monazite (Gupta and Krishnamurthy, 2005). In general, the ores’ location is much closer to the surface than in the case of Bayan Obo and Mountain Pass. Given the differences in formation of the ion-adsorption clays, leaching is usually adopted instead of open pit. In situ leaching has become the major technology, replacing heap leaching and pool leaching due to its improved environmental performance (Yang et al., 2013). This process involves injecting fluid into the ground and pumping out liquid mixture (see Figure 8). The in situ mining techniques are better suited for the softer clays (Walters et al., 2010).
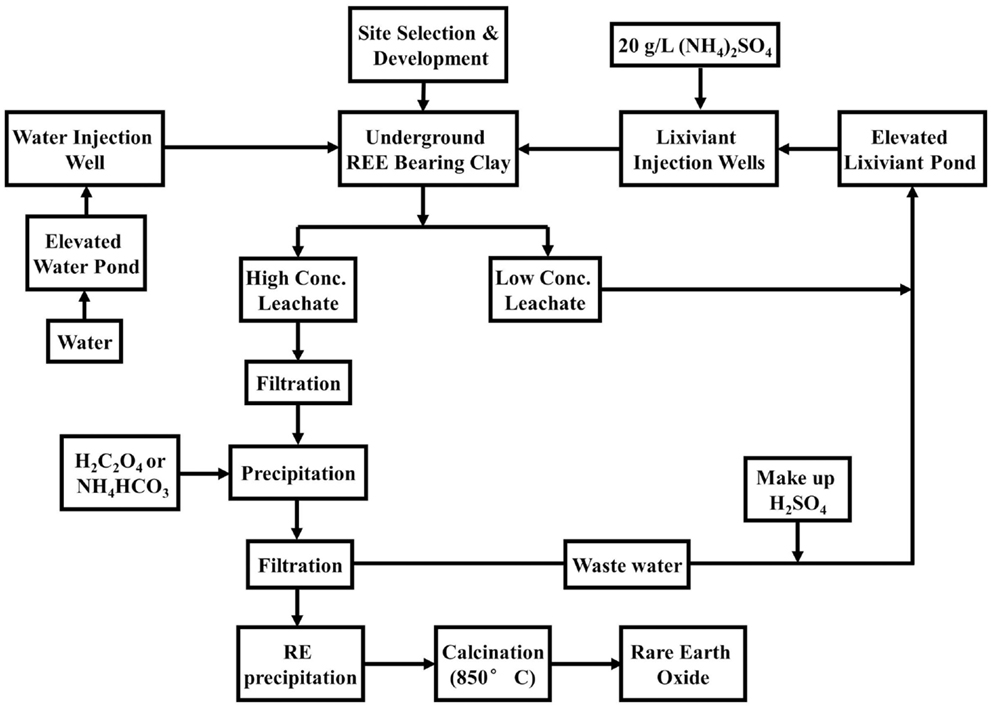
Figure 8. In situ leaching of ion-adsorption clay in Southern China (Wu, 2005).
According to Yang et al. (2013), the in situ leaching requires the removal of one-third of the topsoil. It requires drilling of holes with a diameter of 0.8 m, depth of 1.5–3 m, and distance of 2–3 m in between holes. The concentration of the leaching solution is generally 3–5% ammonium sulfate (NH4)2 SO4 and it takes 150–400 days for REE containing slurry to be produced. An example for the leaching technique of extracting REEs using an aqueous electrolyte solution ((NH4)2 SO4) by ion-exchange reaction is given by Eq. 10 (Yang et al., 2013). Leaching can be carried out using other concentrated inorganic salt solutions, such as of Na2SO4, NH4Cl, and NaCl (Moldoveanu and Papangelakis, 2012). Each mine requires a dedicated in situ leaching program based on a geological survey. When leaching is done, fresh water is injected to drive out the remaining REE-bearing solution. This also reduces contamination to groundwater. The leachate is usually treated either with NH4HCO3 or H2C2O4 to precipitate REEs. At some mining sites, a rough solvent extraction is used with naphthenic acid as solvent.
For ion-adsorption clays, there exist little uranium and thorium wastes. However, there are other pollutants, e.g., groundwater pollution (Kynicky et al., 2012). According to Yang et al. (2013), in situ leach mining produces 7,000 m3 of drilling slurry/ha and one-third of the vegetation is typically cleared. Other environmental issues include landslides, mine collapses, and water contamination. The water contamination contributes to an increased pH level, electrical conductivity, and total dissolved solids. It is reported that there are increased concentrations of 3.5–4.0 g/L (NH4)2 SO4 in the groundwater and concentrations in the surface water of 0.08–0.16 g/L NH4+ and 0.02 g/L REEs. While sulfate and other pollutants directly cause environmental degradation, capillary forces surrounding the leaching holes attract high concentrations of leaching solution back to the topsoil layer, destroying surface vegetation and making rehabilitation more difficult. According to Zhou (2012), the inputs per ton of REOs, with high concentrations of Y and Eu extracted via in situ leaching in southern provinces of China, include 5.2 tons of (NH4)2 SO4, 2.2 tons of ammonium carbonate ((NH4)2CO3), 0.5 tons of H2SO4, and 400 kWhr of electricity. Also, they state NH4 concentrations up to 3.5–4.0 g/L with the wastewater remaining in situ being about 0.2 m3/ton.
The separation process for the ion-adsorption route is similar to that of the Bayan Obo route. That is, multi-stage solvent extraction is needed to produce individual REEs with high purity. Given the scale of most ion-adsorption clay mining activities, this usually happens at centralized facilities.
REO Reduction, Refining, and Purifying
After the separation process, REOs enter the reduction, refining, and purifying processes. The final step for the reduction of REEs is transitioning from a highly pure REO to a REE or a rare-earth metal (REM) (Waseda and Isshiki, 2002). Here, the process routes for Bayan Obo, Mountain Pass, and ion-adsorption, do not vary. Purities vary by stage and can get to 99.99% or greater depending on the element and application (Blakely et al., 2012). For reduction, there are several processes that can be used to produce REEs of different purities. These processes include the reduction of anhydrous chlorides or fluorides, reduction of REOs, and fused salt electrolysis of chlorides or REO-fluoride mixtures (Gupta and Krishnamurthy, 2005).
Gupta and Krishnamurthy (2005) give an example of a metallothermic reduction in molten salt for Nd2O3. This is accomplished with a Ca in a CaCl2-NaCl melt at temperatures between 710 and 790°C. The REM was recovered from the CaCl2-NaCl melt by extraction into a molten Nd-Zn alloy pool. Subsequently, the Zn was removed from the alloy by vacuum distillation, since Nd melts at 1021°C and Zn boils at 907°C. The corresponding reactions are described in Eqs 11–14.
or
For refining and purifying REEs, the processes of molten salt electrolysis, solid state electrotransport (SSE), zone melting (zone refining), etc. have been used where no single technique will yield pure REEs (Isshiki, 1996; McGill, 2000; Gupta and Krishnamurthy, 2005). The level of purity desired depends on the application, where the purity needed for certain products may prove inadequate for others. A method for the further purification of Nd can be accomplished through zone melting and SSE (Isshiki, 1996). According to Gupta and Krishnamurthy (2005), the process begins with a bar of Nd weighing approximately 92 g. It is degassed in a water cooled copper crucible and filled with purified Ar. The Nd is subjected to 25 molten zones at a rate of 0.117 m/h. During this process, the beginning of the rod is thicker than the end, so it is removed, shaped, and the ends are cropped. Next, it is cleaned, placed in the crucible, degassed with Ar, and 14 more molten zones are passed. After the removal process is repeated, the bar is further shaped, the ends are re-cropped, and the middle portion is ready to proceed to SSE.
Gupta and Krishnamurthy (2005) describe the process for SSE, where the bar is subjected to a direct current passed through the metal held by two electrodes under purified Ar. The impurities are susceptible to transporting to one side of the bar (cathode end to anode end), leaving the remaining piece with a higher purity. Initially, the sample is outgassed in a vacuum at 830°C for 144 h. Next, the sample is put under 50 × 103 Pa purified Ar at temperatures greater than 863°C, 820–863°C, and 800°C for a total of 775 h. The anode end containing the impurities is cut off, and it is processed with under vacuum again. The run lasts for 1060 h, with 412 h being greater than 863°C. The resulting purity is approximately 99.97%.
Review of LCA Studies on REEs
As shown in Section “Major REE Production Pathways,” there is significant amount of literature describing the material and energy inputs of process steps involved in representative REE production pathways. However, it should be noted that the data and information reported for the Mountain Pass pathway are over 20 years old. On the other hand, the description of production pathways used in China reflects more recent practices. Unfortunately, emissions and environmental damages associated with these pathways are rarely quantified or at best discussed in an anecdotal manner. For all pathways, only aggregated environmental emissions are reported, i.e., at facility level instead of process level. All of these make it challenging to conduct an LCA study. As a result, to date only a handful of LCA studies on REE production have been conducted. In the following paragraphs, these LCA studies will be critically reviewed.
The datasets in the Ecoinvent database (Ecoinvent v2.0 and subsequent v2.2 and v3.0) represent probably the first LCA study related to REEs (Althaus et al., 2007), which examines the environmental impacts of the Bayan Obo pathway. As shown in Figure 9, the study covers mining, physical beneficiation, cracking, and solvent extraction while leaving out REM refining and purification. Correspondingly, six unit processes/datasets are included: rare-earth concentrate, 70% REO, from bastnasite, at beneficiation/CN; Cerium concentrate, 60% Cerium oxide, at plant/CN; neodymium oxide, at plant/CN; samarium–europium–gadolinium concentrate, 94% rare-earth oxide, at plant/CN; lanthanum oxide, at plant/CN; and Praseodymium oxide, at plant/CN. The first unit process includes mining and physical beneficiation, while the remaining five unit processes cover the cracking and the multi-stage solvent extraction process. Here, the geographical code “CN” represents production in China.
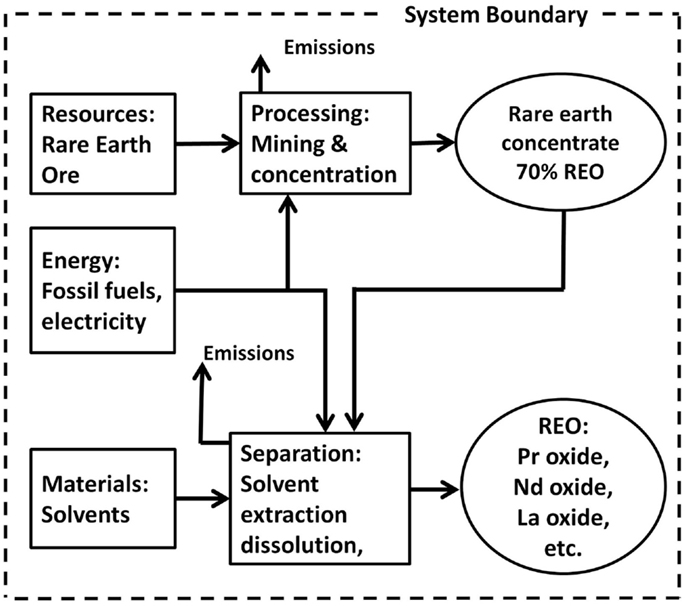
Figure 9. System boundary for REO production from bastnasite as in Ecoinvent Database (Althaus et al., 2007).
The Ecoinvent datasets were developed by aggregating data from literature and stoichiometric estimations. Energy use, chemical consumption, transportation, and infrastructure are all considered when developing inventory data. Due to the quality and availability of data, the study has the following limitations:
• Ore composition. The REO composition used in the study is slightly different from the average of bastnasite at Bayan Obo. It seems that the composition is based on annual production weighted average of Bayan Obo and Mountain Pass. In addition, it should be noted that although it is claimed that the study investigates the Bayan Obo pathway, the ores processed at Bayan obo are actually mixture of bastnasite and monazite.
• Mining process. At Bayan Obo, REO ores are co-products of iron ore mining. However, this is not considered in the study. Process energy consumption was estimated using phosphate rock mining data based on the mass of crude ore recovered. The explosives’ consumption as well as air emissions were assumed to be the same as iron ore mining. The radioactive emissions were estimated based on Mountain Pass data, while the ores mined at Bayan Obo contain a higher concentration of radioactive elements (Gupta and Krishnamurthy, 2005).
• Physical beneficiation. Again, energy consumption in the form of electricity, heat, and steam was assumed to be the same as phosphate rock beneficiation. Chemicals usage, water consumption, and water emissions were estimated based on those reported for the Mountain Pass facility.
• Cracking. The sulfuric acid roasting and the subsequent calcination process are assumed to consume the same amount of energy as treating phosphate rocks. The chemical consumptions were estimated based on stoichiometry with 95% process efficiency. Since sulfuric acid may decompose at roasting temperatures, i.e., 500°C, this efficiency seems too high, thus may lead to underestimate material consumption. For air emission control, scrubbers with 95% removal efficiency were assumed, which represents common practice in the U.S. instead of China.
• Solvent extraction. It was pointed out that electricity consumption is not negligible due to large amount of liquids pumped. Since no information is available, the electricity requirement for solvent extraction of vegetable oils was used. It was also assumed that four separation steps are needed to obtain the desired products. Apparently, this tends to underestimate electricity consumption since REE solutions are more challenging to separate and more steps may be needed. The consumption of solvent (70% kerosene and 30% organo-phosphoric acid) was estimated based on Mountain Pass data. Since no manufacturing information is available for organo-phorphoric acid, generic organic chemical is used as a surrogate. Wastes and emissions to water were assumed to be similar to the Mountain Pass process.
• Allocation. Economic value was employed to allocate energy/material consumption and emissions to all the products. The allocation factors were determined according to the average bulk prices (FOB China) for cerium oxide, lanthanum oxide, neodymium oxide, and praseodymium oxide between 2004 and 2006, while for samarium–europium–gadolinium concentrate price in 2002 was used. This clearly introduces some inconsistency. In addition, volatile REE prices further complicate economic value-based allocation.
Although the LCI datasets in Ecoinvent database carry many limitations, the study provides a good starting point for further LCA efforts. Nuss and Eckelman (2014) conducted an LCA of 63 metals, including all of the 15 lanthanide elements. The default Ecoinvent inventory data was used but the energy/material inputs and emissions were re-allocated to all the 15 REOs based on Bayan Obo bastnasite composition provided in Chinese Rare-Earth Yearbook 2010 and 2006–2010 REO prices (Nuss and Eckelman, 2014). It was concluded that for REOs the cracking/solvent extraction steps carry larger environmental impacts than mining/physical beneficiation. It is interesting to point out that the study develops LCI datasets associated with a pathway of co-producing thorium and REEs from monazites. The data was largely based on environmental assessment report for a planned Lynas project in Malaysia, which will process REO concentrates derived from monazites mined at Mount Weld, Australia (Schmidt, 2013).
There have been efforts on addressing some of the limitations associated with Ecoinvent datasets. Koltun and Tharumarajah (2014) proposed a two-step allocation procedure to deal with the co-mining issue at Bayan Obo. In the first step, environmental burdens of mining and physical beneficiation are allocated to hematite (FeO), columbite (niobium ore), and REO bearing ore (i.e., bastnasite and monazite) based on mass fractions and prices. In the second step, the allocation among all the 17 REOs was done based on economic value, assuming recovery rate for each REE oxide is the same. Different from Ecoinvent, the study considers the REE ores as mixture of bastnasite and monazite with 3:1 ratio. In a separate study, Koltun and Tharumarajah (2010) expanded the system boundary to include reduction of REOs. These two publications, however, lack critical details on how life inventory data was compiled and do not include a complete LCI. It was implied that the inventory was developed based on Ecoinvent dataset but the lack of transparency makes it extremely difficult for other researchers to repeat their studies.
In a recent study, Sprecher et al. (2014) conducted comprehensive updates on Ecoinvent datasets. Seven major REOs are included: cerium oxide, lanthanum oxide, neodymium oxide, praseodymium oxide, europium oxide, gadolinium oxide, and samarium oxide. Since the study aims at assessing life-cycle environmental impacts of NdFeB magnets, particular attention was put on neodymium. Two Ecoinvent unit processes, i.e., rare-earth concentrate, 70% REO, from bastnasite, at beneficiation/CN and neodymium oxide, at plant/CN were split into five processes: ore removal from mine, beneficiation of REE containing ore, acid roasting, leaching, and solvent extraction. For the mining process, it argues that the REE ore mining in Bayan Obo is equivalent to regular open pit iron ore mining, and the default Ecoinvent process of iron ore mining was adopted. The REO concentration in the ores is assumed to be 4.1%, which is more realistic than the 6.0% used in Ecoinvent. The same approach was used for REE ore beneficiation because beneficiation techniques used in the Bayan Obo mine can be assumed to be the same as in a normal iron ore mine. Radioactive emissions were also updated based on thorium and uranium content of monazites mined in Bayan Obo. In addition, allocation was done between iron ore and REE ore using economic value. For acid roasting, leaching, and solvent extraction, the study adopted amounts of chemical consumption (e.g., sulfuric acid, hydrochloric acid, ammonium bicarbonate, and sodium hydroxide) reported in several Chinese publications. Given the focus on neodymium, allocation for solvent extraction process was done only between neodymium and praseodymium oxides and other REOs.
Sprecher et al. (2014) further expanded Ecoinvent datasets to include production of pure neodymium metal via molten salt electrolysis, which is similar to the Hall–Heroult process used for aluminum production. Therefore, the production of metallic neodymium was modeled based on Ecoinvent process “Aluminum, primary, liquid, at plant/RER” while adjusting energy and material inputs based on properties of alumina and neodymium oxide. It is interesting to point out that this study also explores two hard disk drives magnets recycling/remanufacturing routes: one via manual dismantling and the other via shredding.
To date, the most comprehensive LCI datasets on REEs are probably those in the GaBi databases (Figure 10) developed by PE International in 2011 and 2012 (PE International, 2012). The databases include 20 datasets, i.e., cerium and its oxides, lanthanum and its oxides, praseodymium and its oxides, neodymium oxides, samarium and its oxides, europium and its oxides, gadolinium, terbium, holmium, erbium, thulium, ytterbium, lutetium, and yttrium. Production of pure metals via molten salt electrolysis is also included. According to the database document, the main data source is the Chinese Rare-Earth Industry Report 2009 and additional oral communication with experts. Although having extensive coverage, the datasets have many issues. Overall, it seems that all the LCI data is highly aggregated. From the documentation, it is difficult to tell whether or not the solvent extraction process was included. In addition, two different pathways are selected for the production of pure metal and the production of REOs. For the production of pure metal, it was assumed that mining, beneficiation, roasting, and production of rare-earth chlorides are all conducted in Sichuan, China. The REE ores available in Sichuan are mainly bastnasites, and the annual processing capacity of facilities in Sichuan only account for less than 20% of the total capacity in China (Ministry of Environmental Protection (MEP) of the People’s Republic of China, 2011). For REOs (except neodymium oxides), the production in Bayan Obo was modeled. Although allocation was performed on co-mining and co-processing of iron ore and REE ore, no details were provided regarding cracking and solvent extraction. In both pathways, the database-documentation suggests that cracking is done via either direct acid leaching or acid leaching followed by calcination. These technologies seem to be only used by facilities in Sichuan while processing concentrated ores from bastnasite (please note Bayan Obo facility uses high temperature sulfuric acid roasting for cracking) (Huang et al., 2011). Moreover, due to some reasons the database-documentation mentions that monazites are predominant in China, which is simply not true (the three leading REE-bearing ores mined in China are Bayan Obo bastnasite–monazite mixture, ion-adsorption clay in southern provinces, and bastnasites in Sichuan). The dataset of neodymium oxide was developed using Mountain Pass production data from 1995, which is almost 20 years old. To make it worse, even though the Mountain Pass facility has restarted operation, its processing capacity is much smaller than that of China. All of these make the representativeness of the inventory datasets questionable.
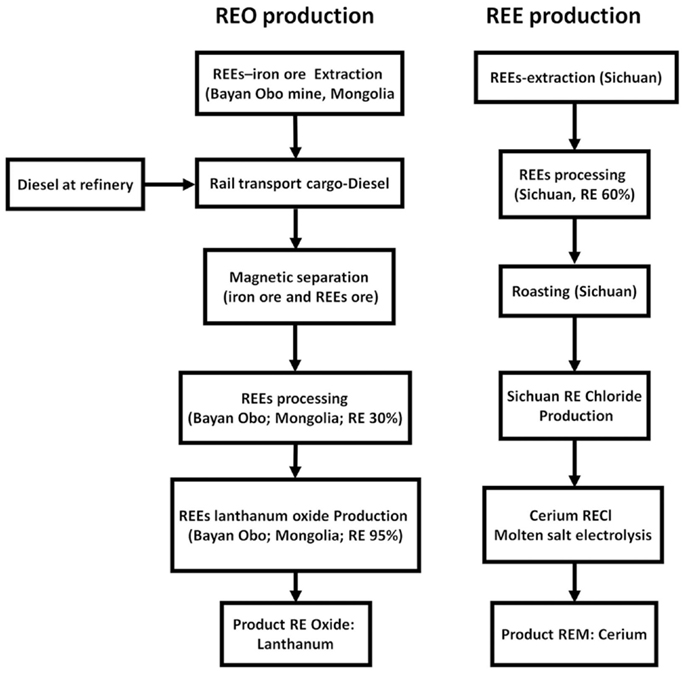
Figure 10. Production processes for REOs and REEs as in Gabi documentation (PE International, 2012).
In summary, very limited LCA studies have been conducted on REEs. All of the studies are based on Mountain Pass production data from the 1990s or information from Chinese literature or a combination. In general, the data quality is low. For many process steps, no information is available and surrogates are commonly used. This is a common practice in LCA efforts and reasonable in some cases. For example, mining of REE-bearing ores can be approximated by open pit mining of iron ores. However, using vegetable oil extraction as an approximate to REO separation to estimate electricity consumption may not be a good choice. In addition, the current LCI databases do not have entries corresponding to the solvents (e.g., P204 and P507) used in REO separation. Generic organic chemical is usually used as surrogate, which may introduce large errors.
Both mass based and revenue based allocation have been adopted to deal with the multi-products issues associated with several REE processing steps. Although ISO 14040 recommends system expansion over allocation, this is not feasible in the case of REEs. On the other hand, both mass based and revenue based allocation have their own shortcomings. Mass-based allocation tends to put most environmental burdens to metals of high abundance, e.g., cerium and lanthanum, while revenue based allocation suffers from extremely volatile REE market. In addition, the prices of REEs vary significantly from metal to metal (e.g., scandium is currently priced at $17,500/kg while cerium at $12/kg, July 30, 2014, www.mineralprices.com).
In addition to data accuracy, completeness, representativeness issues, and allocation method selection, published LCA studies carry some discrepancy with regard to system boundaries, cutoff criteria, and assumptions made. As a result, the LCA results likely carry large uncertainties. For example, the carbon footprint of 1 kg neodymium oxide reported in the studies ranges from 12 kg CO2-Eq (Sprecher et al., 2014) to 66 kgCO2-Eq (Koltun and Tharumarajah, 2014).
Due to the limitations associated with current LCA studies, further efforts are clearly needed. The Mountain Pass facility has been upgraded for reduced environmental impacts and restarted operation in 2013, justifying an updated LCA. For the Bayan Obo pathway, a critical analysis of the current studies and a closer look into Chinese literature are desired in order to harmonize the results so the LCA can provide better support for process development and policy making. The DOE’s National Renewable Energy Laboratory (NREL) has done work on LCA harmonization of solar and wind energy (Heath and Mann, 2012) and the methodology could be adopted. In addition, no LCA has been attempted for the production of REEs from ion-adsorption clay, although ion-adsorption clay has been an important source of HREEs. Moreover, there are specific chemicals used in REE processing for which LCI should be developed.
Future Outlooks
There have been certain sites designated for REE extraction outside of China. In the U.S., these include mines in Diamond Creek, ID, USA, Bear Lodge Mountains, WY, USA, and Pea Ridge, MO, USA (Paul and Campbell, 2011; Long et al., 2012). There are also reserves in Australia, Brazil, Canada, and India (Kanazawa and Kamitani, 2006; Hatch, 2011; Schüler et al., 2011). Japanese scientists have begun to explore the Pacific Ocean for REEs and have shown substantial reserve potential (Kato et al., 2011). Each of these sites has their associated ways of extraction and different processing pathways may be adopted. This will add to the complexity of assessing the environmental impacts of REEs using LCA. In addition, with the advent of new processing technology, new life inventory will need to be developed. Depending on the nature of the new technology, this could be done by updating current inventory, although this will not be easy given the fact that most of the current inventory lacks the needed transparency.
Furthermore, recycling of REEs will be an important topic for future LCAs. Since many products only contain small amounts of REEs, recycling is costly and energy intensive. Estimates of recycling rates are around 1% (Buchert et al., 2009; Chakhmouradian and Wall, 2012; Reck and Graedel, 2012; Binnemans et al., 2013; Bogue, 2014). Given the uncertainties in price, quality, quantity, and dependability of the materials, the research is increasing for REE recycling and this percentage will certainly rise. Companies such as Toyota, Honda, Hitachi, and Mitsubishi have announced REE recycling initiatives targeting as much as 10% of their REE consumption via recycled materials (Akahori et al., 2014; Golev et al., 2014). Further, there have been attempts to look at the recycling and remanufacturing of products incorporating REEs (Dent, 2012; Nagai and Uzawa, 2014; Tan et al., 2014). For some REEs, such as the Nd and Dy in NdFeB permanent magnets, the in-use stock can be four times that of the yearly extraction amount (Du and Graedel, 2011b). A typical approach for recycling includes: collection, dismantling, separation, and processing (Buchert et al., 2009; Sonich-Mullin, 2012). Recycling would further complicate the REE life cycle. The methods and processes for recycling would have to be evaluated, and a couple of LCA studies have been conducted on different routes of recovering Nd and Dy from magnets (Akahori et al., 2014; Sprecher et al., 2014).
Conclusion
As REEs gain increasing importance in many new energy technologies and systems, with the drive to reduce GHG emissions the demand for REEs will keep increasing. Although REEs contribute significantly to energy sustainability, the production of REEs is energy/material intensive and heavily polluting. With the increasing demand of REEs, a comprehensive understanding on the environmental impacts of REEs production is needed. LCA is the most widely used methodology for evaluating environmental sustainability. However, very limited LCA studies have been conducted on the production of REEs.
A critical review of LCA studies on REEs (as well as major REE production pathways) reveals some severe limitations. The LCI was mostly developed based on data from Chinese literature and/or Mountain Pass production data from 1990s. Data consistency, accuracy, completeness, and representativeness are of significant concerns and the LCA results are expected to carry large uncertainties. The studies to date usually draw system boundaries, define cutoff criteria, select allocation methods, and make assumptions differently. Therefore, a harmonization effort is needed. In addition, all the studies are for the processing bastnasite or bastnasite–monazite mixture, while no LCA has been conducted on the processing of ion-adsorption clay, which is an important source of HREEs.
Worldwide, there are sites being explored for REE ore extraction to meet the increasing demand and to reduce supply risks. Depending on the composition of the ores, different processing pathways may be adopted. There are also efforts undergoing to improve REE processing technologies, and to recycle REEs. All of these have impacts on REE life cycle, and LCI has to be developed. Due to the proprietary nature of these new developments, close collaboration with industry is critical. It is envisioned that a comprehensive and transparent LCA database will provide better support to efforts on greening the REE life cycle and to policymaking.
Conflict of Interest Statement
The authors declare that the research was conducted in the absence of any commercial or financial relationships that could be construed as a potential conflict of interest.
Acknowledgments
This work is supported by the National Science Foundation under Grant No. 1336534 and the Critical Materials Institute, an Energy Innovation Hub funded by the U.S. Department of Energy, Office of Energy Efficiency and Renewable Energy, Advanced Manufacturing Office. Any opinions, findings, and conclusions or recommendations expressed in this material are those of the authors and do not necessarily reflect the views of the National Science Foundation and the U.S. Department of Energy.
References
Adibi, N., Lafhaj, Z., Gemechu, E. D., Sonnemann, G., and Payet, J. (2014). Introducing a multi-criteria indicator to better evaluate impacts of rare earth materials production and consumption in life cycle assessment. J. Rare Earths 32, 288–292. doi: 10.1016/S1002-0721(14)60069-7
Akahori, T., Hiroshige, Y., Motoshita, M., Hatayama, H., and Tahara, K. (2014). Assessment of environmental impact of rare earth metals recycling from used magnets. Rare Met. Technol. 107–111. doi:10.1002/9781118888551.ch21
Pubmed Abstract | Pubmed Full Text | CrossRef Full Text | Google Scholar
Ali, S. H. (2014). Social and environmental impact of the rare earth industries. Resources 3, 123–134. doi:10.1016/j.scitotenv.2011.11.017
Pubmed Abstract | Pubmed Full Text | CrossRef Full Text | Google Scholar
Alonso, E., Sherman, A. M., Wallington, T. J., Everson, M. P., Field, F. R., Roth, R., et al. (2012). Evaluating rare earth element availability: a case with revolutionary demand from clean technologies. Environ. Sci. Technol. 46, 3406–3414. doi:10.1021/es203518d
Pubmed Abstract | Pubmed Full Text | CrossRef Full Text | Google Scholar
Althaus, H. J., Chudacoff, M., Hischier, R., Jungbluth, N., Osses, M., and Primas, A. (2007). Lifecycle Inventories of Chemicals. Final Report Ecoinvent Data v2.0 No. 8. Dubendorf: Swiss Centre for Life Cycle Inventories.
Ayres, R. U., and Peiró, L. T. (2013). Material efficiency: rare and critical metals. Philos. Trans. R. Soc. Lond. A 371, 20110563. doi:10.1098/rsta.2011.0563
Pubmed Abstract | Pubmed Full Text | CrossRef Full Text | Google Scholar
Bauer, D., Diamond, D., Li, J., Sandalow, D., Telleen, P., and Wanner, B. (2010). Critical Materials Strategy. Washington, DC: US Department of Energy.
Binnemans, K., Jones, P. T., Blanpain, B., Van Gerven, T., Yang, Y., Walton, A., et al. (2013). Recycling of rare earths: a critical review. J. Clean. Prod. 51, 1–22. doi:10.1016/j.wasman.2013.10.034
Pubmed Abstract | Pubmed Full Text | CrossRef Full Text | Google Scholar
Blakely, C., Joseph, C., Ashu, K., Iclal, S., and Ross, W. (2012). Rare Earth Metals and China. Ann Arbor, MI: Gerald R. Ford School of Public Policy.
Bogue, R. (2014). Sustainable manufacturing: a critical discipline for the twenty-first century. Assem. Autom. 34, 117–122. doi:10.1108/AA-01-2014-012
Bourzac, K. (2010). Can the US rare earth industry rebound. Technol. Rev. 29. Available at: http://www.technologyreview.com/energy/26655/
Brown, D., Ma, B. M., and Chen, Z. (2002). Developments in the processing and properties of NdFeB-type permanent magnets. J. Magn. Magn. Mater. 248, 432–440. doi:10.1016/S0304-8853(02)00334-7
Buchert, M., Schüler, D., and Bleher, D. (2009). Critical Metals for Future Sustainable Technologies and Their Recycling Potential. Freiburg: United Nations Environment Programme (UNEP).
Castor, S. B., and Hedrick, J. B. (2006). “Rare earth elements,” in Industrial Minerals Volume, 7th Edition: Society for Mining, Metallurgy, and Exploration, eds J. E. Kogel, N. C. Trivedi, J. M. Barker, and S. T. Krukowski (Littleton, CO: Society for Mining, Metallurgy, and Exploration, Inc. (SME)), 769–792.
Chakhmouradian, A. R., and Wall, F. (2012). Rare earth elements: minerals, mines, magnets (and more). Elements 8, 333–340. doi:10.2113/gselements.8.5.333
Chang, H., Li, M., Liu, Z., Hu, Y., and Zhang, F. (2010). Study on separation of rare earth elements in complex system. J. Rare Earths 28, 116–119. doi:10.1016/S1002-0721(10)60270-0
Chen, Z. (2011). Global rare earth resources and scenarios of future rare earth industry. J. Rare Earths 29, 1–6. doi:10.1016/S1002-0721(10)60401-2
China Beneficiation Technology Network. (2009). Bastnaesite-Mixed Rare Earth Concentrates of Monazite Decomposition of Sulfuric Acid Roasting Technology. Available at: http://www.chinadaily.com.cn/bw/2009-09/07/content_8660849.htm
China Daily. (2009). Rare Earth Industry Adjusted to Slow Market. Available at: http://www.mining120.com/html/0906/20090609_15287.asp
Chu, S., and Majumdar, A. (2012). Opportunities and challenges for a sustainable energy future. Nature 488, 294–303. doi:10.1038/nature11475
Clapper, J. R. (2013). Worldwide Threat Assessment of the US Intelligence Community. Washington, DC: Senate Select Committee on Intelligence.
Curran, M. A. (2006). Life-Cycle Assessment: Principles and Practice. Cincinnati, OH: National Risk Management Research Laboratory, Office of Research and Development, US Environmental Protection Agency.
de Boer, M. A., and Lammertsma, K. (2013). Scarcity of rare earth elements. ChemSusChem 6, 2045–2055. doi:10.1002/cssc.201200794
Pubmed Abstract | Pubmed Full Text | CrossRef Full Text | Google Scholar
Dent, P. C. (2012). Rare earth elements and permanent magnets. J. Appl. Phys. 111, 07A721. doi:10.1063/1.3676616
Dobransky, S. (2012). “Rare Earth elements and us foreign policy: the critical ascension of REEs in global politics and US national security,” in APSA 2012 Annual Meeting Paper, New Orleans.
Du, X., and Graedel, T. E. (2011a). Global in-use stocks of the rare earth elements: a first estimate. Environ. Sci. Technol. 45, 4096–4101. doi:10.1021/es102836s
Pubmed Abstract | Pubmed Full Text | CrossRef Full Text | Google Scholar
Du, X., and Graedel, T. E. (2011b). Global rare earth in-use stocks in NdFeB permanent magnets. J. Ind. Ecol. 15, 836–843. doi:10.1111/j.1530-9290.2011.00362.x
EERE Network News. (2012). Energy Department Announces Launch of Energy Innovation Hub for Critical materials Research. Available at: http://apps1.eere.energy.gov/news/news_detail.cfm/news_id=18370
Eggert, R. G., Carpenter, A. S., Freiman, S. W., Graedel, T. E., Meyer, D. A., McNulty, T. P., et al. (2008). Minerals, Critical Minerals and the US Economy. Washington, DC: National Research Council (US).
Emsley, J. (2011). Nature’s Building Blocks: An AZ Guide to the Elements. Oxford: Oxford University Press.
EU Commission. (2010). Critical Raw Materials for the EU. Report of the Ad-Hoc Working Group on Defining Critical Raw Materials. Technical Report. Brussels: European Commission.
Evans, A., Strezov, V., and Evans, T. J. (2009). Assessment of sustainability indicators for renewable energy technologies. Renew. Sustain. Energ. Rev. 13, 1082–1088. doi:10.1016/j.rser.2008.03.008
Falconer, A. (2003). Gravity separation: old technique/new methods. Phys. Sep. Sci. Eng. 12, 31–48. doi:10.1080/1478647031000104293
Finkbeiner, M., Inaba, A., Tan, R., Christiansen, K., and Klüppel, H. J. (2006). The new international standards for life cycle assessment: ISO 14040 and ISO 14044. Int. J. Life Cycle Assess. 11, 80–85. doi:10.1065/lca2006.02.002
Fouquet, Y., and Martel-Jantin, B. (2014). Rare and strategic metals. Deep Mar. Miner. Resour. 55–64. doi:10.1007/978-94-017-8563-1_3
Fuerstenau, D. W. (2013). Design and development of novel flotation reagents for the beneficiation of Mountain pass rare-earth ore. Miner. Metallur. Proc. 30, 1–9.
Garrett, P., and Rønde, K. (2013). Life cycle assessment of wind power: comprehensive results from a state-of-the-art approach. Int. J. Life Cycle Assess. 18, 37–48. doi:10.1007/s11367-012-0445-4
Gibson, M., and Parkinson, I. (2011). Once Ignored on the Periodic Table, Don’t Ignore Them Now. A Rare Earth Element Industry Overview. Toronto: CIBC World Market Inc. Report.
Goldman, J. A. (2014). The US rare earth industry: its growth and decline. J. Policy Hist. 26, 139–166. doi:10.1017/S0898030614000013
Golev, A., Scott, M., Erskine, P. D., Ali, S. H., and Ballantyne, G. R. (2014). Rare earths supply chains: current status, constraints and opportunities. Resour. Policy 41, 52–59. doi:10.1016/j.resourpol.2014.03.004
Graf, R., Held, M., and Lindner, J. P. (2013). “Life cycle assessment of rare earths under consideration of new supply trends,” in The 6th International Conference on Life Cycle Management in Gothenburg 2013, Gothenburg.
Grasso, V. B. (2013). Rare Earth Elements in National Defense: Background, Oversight Issues, and Options for Congress. Washington, DC: Library of Congress, Congressional Research Services.
Guinee, J. B., Heijungs, R., Huppes, G., Zamagni, A., Masoni, P., Buonamici, R., et al. (2010). Life cycle assessment: past, present, and future. Environ. Sci. Technol. 45, 90–96. doi:10.1021/es101316v
Pubmed Abstract | Pubmed Full Text | CrossRef Full Text | Google Scholar
Gupta, C. K., and Krishnamurthy, N. (2005). Extractive Metallurgy of Rare Earths. Boca Raton: CRC Press.
Hagelüken, C., and Meskers, C. (2009). “Technology challenges to recover precious and special metals from complex products,” in R’09 World Congress, Davos, Switzerland, Conference Start Date, Vol. 14, 2009.
Hatch, G. P. (2011). Critical Rare Earths: Global Supply and Demand Projections and the Leading Contenders for New Sources of Supply. Carpentersville: Technology Metals Research, LLC.
Hatch, G. P. (2012). Dynamics in the global market for rare earths. Elements 8, 341–346. doi:10.2113/gselements.8.5.341
He, J., Mi, N., Kuang, Y. C., Fan, Q. Y., Wang, X., Guan, W., et al. (2004). Speciation and distribution characters of rare earth elements in the Baotou section of the Yellow river. Environ. Sci. 25, 61–66.
He, Y. (2014). Reregulation of China’s rare earth production and export. Int. J. Emerg. Mark. 9, 236–256. doi:10.1108/IJoEM-09-2012-0117
Heath, G. A., and Mann, M. K. (2012). Background and reflections on the life cycle assessment harmonization project. J. Ind. Ecol. 16, S8–S11. doi:10.1111/j.1530-9290.2012.00478.x
Hendrickson, C., Horvath, A., Joshi, S., and Lave, L. (1998). Peer reviewed: economic input-output models for environmental life-cycle assessment. Environ. Sci. Technol. 32, 184A–191A. doi:10.1021/es983471i
Pubmed Abstract | Pubmed Full Text | CrossRef Full Text | Google Scholar
Hirano, S., and Suzuki, K. T. (1996). Exposure, metabolism, and toxicity of rare earths and related compounds. Environ. Health Perspect. 104(Suppl. 1), 85. doi:10.2307/3432699
Pubmed Abstract | Pubmed Full Text | CrossRef Full Text | Google Scholar
Hischier, R., Weidema, B., Althaus, H. J., Bauer, C., Doka, G., Dones, R., et al. (2010). Implementation of Life Cycle Impact Assessment Methods. Ecoinvent Report. Dubendorf: Swiss Centre for Life Cycle Inventories.
Huang, X. W., Zhang, Y. Q., and Li, H. W. (2011). Development trend and research progress of rare earth extraction in China. Bull. Natl. Sci. Found. China 3, 134–137.
Humphries, M. (2011). Rare earth elements: the global supply chain. Washington, DC: Congr. Res. Serv. 7–5700.
Hurst, C. (2010). China’s Rare Earth Elements Industry: What Can the West Learn?. Washington, DC: Institute for the Analysis of Global Security (IAGS).
ISO. (2006). 14040: Environmental Management – Life Cycle Assessment – Principles and Framework. London: British Standards Institution.
Isshiki, M. (1996). Purification of rare earth metals. Vacuum 47, 885–887. doi:10.1016/0042-207X(96)00087-5
Jordens, A., Cheng, Y. P., and Waters, K. E. (2013). A review of the beneficiation of rare earth element bearing minerals. Miner. Eng. 41, 97–114. doi:10.1016/j.mineng.2012.10.017
Kanazawa, Y., and Kamitani, M. (2006). Rare earth minerals and resources in the world. J. Alloys Comp. 408, 1339–1343. doi:10.1016/j.jallcom.2005.04.033
Kara, H., Chapman, A., Crichton, T., Willis, P., and Morley, W. (2010). Lanthanide Resources and Alternatives. Aylesbury: Oakdene Hollins.
Kato, Y., Fujinaga, K., Nakamura, K., Takaya, Y., Kitamura, K., Ohta, J., et al. (2011). Deep-sea mud in the Pacific Ocean as a potential resource for rare-earth elements. Nat. Geosci. 4, 535–539. doi:10.1038/ngeo1185
Kifle, D., Sverdrup, H., Koca, D., and Wibetoe, G. (2013). A simple assessment of the global long term supply of the rare earth elements by using a system dynamics model. Environ. Nat. Resour. Res. 3, 77. doi:10.5539/enrr.v3n1p77
Koltun, P., and Tharumarajah, A. (2010). LCA study of rare earth metals for magnesium alloy applications. Mater. Sci. Forum 654-656, 803–806. doi:10.4028/www.scientific.net/MSF.654-656.803
Koltun, P., and Tharumarajah, A. (2014). Life cycle impact of rare earth elements. ISRN Metallur. 2014, 10. doi:10.1155/2014/907536
Korinek, J., and Kim, J. (2010). Export restrictions on strategic raw materials and their impact on trade and global supply. OECD Trade Policy Stud 2010, 103. doi:10.1787/18166873
Kynicky, J., Smith, M. P., and Xu, C. (2012). Diversity of rare earth deposits: the key example of China. Elements 8, 361–367. doi:10.2113/gselements.8.5.361
Lehtinen, H., Saarentaus, A., Rouhiainen, J., Pitts, M., and Azapgic, A. (2011). A Review of LCA Methods and Tools and Their Suitability for SMEs. Manchester, UK: Europe Innova.
Lewis, L. H., and Jiménez-Villacorta, F. (2013). Perspectives on permanent magnetic materials for energy conversion and power generation. Metallur. Mater. Trans. A 44, 2–20. doi:10.1007/s11661-012-1278-2
Li, W., Ascenzo, G., Curini, R., Chunhua, Y., Jianfang, W., Tao, J. J., et al. (2000). Simulation of the development automatization control system for rare earth extraction process: combination of ESRECE simulation software and EDXRF analysis technique. Anal. Chim. Acta 417, 111–118. doi:10.1016/S0003-2670(00)00749-2
Liang, T., Li, K., and Wang, L. (2014). State of rare earth elements in different environmental components in mining areas of China. Environ. Monit. Assess. 186, 1499–1513. doi:10.1007/s10661-013-3469-8
Pubmed Abstract | Pubmed Full Text | CrossRef Full Text | Google Scholar
Liao, C., Wu, S., Cheng, F., Wang, S., Liu, Y., Zhang, B., et al. (2013). Clean separation technologies of rare earth resources in China. J. Rare Earths 31, 331–336. doi:10.1016/S1002-0721(12)60281-6
Liu, J., and Bongaerts, J. C. (2014). Mine planning and equipment selection supply chain of rare earth elements (REEs). Mine Plan. Equipment Sel. 1419–1426.
Lizin, S., Van Passel, S., De Schepper, E., Maes, W., Lutsen, L., Manca, J., et al. (2013). Life cycle analyses of organic photovoltaics: a review. Energy Environ. Sci. 6, 3136–3149. doi:10.1039/c3ee42653j
Long, K. R., Van Gosen, B. S., Foley, N. K., and Cordier, D. (2012). The Principal Rare Earth Elements Deposits of the United States – A Summary of Domestic Deposits and a Global Perspective. US Geological Survey Scientific Investigations, Report 2010–5220, 96. Berlin: Springer. doi:10.1007/978-90-481-8679-2_7
Martinez, E., Sanz, F., Pellegrini, S., Jimenez, E., and Blanco, J. (2009). Life cycle assessment of a multi-megawatt wind turbine. Renew. Energy 34, 667–673. doi:10.1016/j.renene.2008.05.020
Massari, S., and Ruberti, M. (2013). Rare earth elements as critical raw materials: focus on international markets and future strategies. Resour. Policy 38, 36–43. doi:10.1016/j.resourpol.2012.07.001
McLellan, B. C., Corder, G. D., and Ali, S. H. (2013). Sustainability of rare earths – an overview of the state of knowledge. Minerals 3, 304–317. doi:10.3390/min3030304
Meyer, L., and Bras, B. (2011). “Rare earth metal recycling,” in Sustainable Systems and Technology (ISSST), 2011 IEEE International Symposium. Chicago: Institute of Electrical and Electronics Engineers, 1–6.
Ministry of Environmental Protection (MEP) of the People’s Republic of China. (2011). GB 26451-2011 Emission Standards of Pollutants from Rare Earth Industry, Appendix 3. Beijing: Beijing standards press of China (in Chinese).
Moldoveanu, G. A., and Papangelakis, V. G. (2012). Recovery of rare earth elements adsorbed on clay minerals: I. Desorption mechanism. Hydrometallurgy 117, 71–78. doi:10.1016/j.hydromet.2012.02.007
Moss, R. L., Tzimas, E., Kara, H., Willis, P., and Kooroshy, J. (2011). Critical Metals in Strategic Energy Technologies. Petten: JRC-Scientific and Strategic Reports, European Commission Joint Research Centre Institute for Energy and Transport.
Moss, R. L., Tzimas, E., Kara, H., Willis, P., and Kooroshy, J. (2013). The potential risks from metals bottlenecks to the deployment of strategic energy technologies. Energy Policy 55, 556–564. doi:10.1016/j.enpol.2012.12.053
Nagai, T., and Uzawa, T. (2014). Recovery of rare earth metals from wasted magnet. Rare Met. Technol. 2014, 99–101. doi:10.1002/9781118888551.ch19
Ness, B., Urbel-Piirsalu, E., Anderberg, S., and Olsson, L. (2007). Categorising tools for sustainability assessment. Ecol. Econ. 60, 498–508. doi:10.1016/j.ecolecon.2006.07.023
Norgate, T., and Haque, N. (2010). Energy and greenhouse gas impacts of mining and mineral processing operations. J. Clean. Prod. 18, 266–274. doi:10.1016/j.jclepro.2009.09.020
Nuss, P., and Eckelman, M. J. (2014). Life cycle assessment of metals: a scientific synthesis. PLoS ONE 9:e101298. doi:10.1371/journal.pone.0101298
Pubmed Abstract | Pubmed Full Text | CrossRef Full Text | Google Scholar
Paul, J., and Campbell, G. (2011). Investigating Rare Earth Element Mine Development in EPA Region 8 and Potential Environmental Impacts. EPA Mining Reports. Washington, DC: EPA Document-908R1103.
PE International. (2012). GaBi LCA Databases Documentation. Available at: http://database-documentation.gabi-software.com/support/gabi/gabi-6-lci-documentation/extension-database-vi-precious-metals/
Peiró, L. T., and Méndez, G. V. (2013). Material and energy requirement for rare earth production. JOM 65, 1327–1340. doi:10.1007/s11837-013-0719-8
Pothen, F. (2014). Dynamic market power in an exhaustible resource industry: the case of rare earth elements. ZEW Discussion Papers, No. 14-005. Mannheim.
Pre Consultants. (2014). Life Cycle Methodology. Available at: http://pre-sustainability.com/lca-methodology
Radhika, S., Nagaphani Kumar, B., Lakshmi Kantam, M., and Ramachandra Reddy, B. (2011). Solvent extraction and separation of rare-earths from phosphoric acid solutions with TOPS 99. Hydrometallurgy 110, 50–55. doi:10.1016/j.hydromet.2011.08.004
Reck, B. K., and Graedel, T. E. (2012). Challenges in metal recycling. Science 337, 690–695. doi:10.1126/science.1217501
Samaras, C., and Meisterling, K. (2008). Life cycle assessment of greenhouse gas emissions from plug-in hybrid vehicles: implications for policy. Environ. Sci. Technol. 42, 3170–3176. doi:10.1021/es702178s
Pubmed Abstract | Pubmed Full Text | CrossRef Full Text | Google Scholar
Schmidt, G. (2013). Description and Critical Environmental Evaluation of the REE Refining Plant Lamp Near Kuantan/Malaysia. Darmstadt: Öko-Institut eV.
Schüler, D., Buchert, M., Liu, R., Dittrich, S., and Merz, C. (2011). Study on Rare Earths and Their Recycling. Darmstadt: Öko-Institut eV.
Shujing, Z. (2013). Problems and countermeasures of rare earth industry in China. Can. Soc. Sci. 9, 9–14. doi:10.3968/j.css.1923669720130903.Z1013
Sonich-Mullin, C. (2012). Rare Earth Elements: A Review of Production, Processing, Recycling, and Associated Environmental Issues. Cincinnati: United States Environmental Protection Agency.
Sprecher, B., Xiao, Y., Walton, A., Speight, J., Harris, R., Kleijn, R., et al. (2014). Life cycle inventory of the production of rare earths and the subsequent production of NdFeB rare earth permanent magnets. Environ. Sci. Technol. 48, 3951–3958. doi:10.1021/es404596q
Pubmed Abstract | Pubmed Full Text | CrossRef Full Text | Google Scholar
Suh, S., and Huppes, G. (2005). Methods for life cycle inventory of a product. J. Clean. Prod. 13, 687–697. doi:10.1016/j.jclepro.2003.04.001
Tan, Q., Li, J., and Zeng, X. (2014). Rare earth elements recovery from waste fluorescent lamps: a review. Crit. Rev. Environ. Sci. Technol. doi:10.1080/10643389.2014.900240
Tharumarajah, R., and Koltun, P. (2011). “Cradle to gate assessment of environmental impact of rare earth metals,” in Proceedings of the 7th Australian Conference on Life Cycle Assessment (Melbourne, VIC: Australian Life Cycle Assessment Society), 9–10.
The Guardian. (2012). Rare-earth mining in China comes at a heavy cost for local villages. Guardian Weekly, International Business Times.
Ting, M. H., and Seaman, J. (2013). Rare earths: future elements of conflict in Asia? Asian Stud. Rev. 37, 234–252. doi:10.1080/10357823.2013.767313
Tremeac, B., and Meunier, F. (2009). Life cycle analysis of 4.5 MW and 250W wind turbines. Renew. Sustain. Energ. Rev. 13, 2104–2110. doi:10.1016/j.rser.2009.01.001
Tse, P. K. (2011). China’s Rare-Earth Industry. Reston: US Department of the Interior, US Geological Survey.
United States Geological Survey. (2013). Mineral Commodities Summary 2013. Washington, DC: Government Printing Offices.
Wallington, T. J., Alonso, E., Everson, M. P., Field, F. R., Gruber, P. W., Keoleian, G. A., et al. (2013). “Sustainable mobility: lithium, rare earth elements, and electric vehicles,” in Proceedings of the FISITA 2012 World Automotive Congress, Heidelberg: Springer Berlin 155–166.
Walters, A., Lusty, P., Chetwyn, C., and Hill, A. (2010). Rare Earth Elements. Keyworth: British Geological Survey (BGS).
Wang, L., Huang, X., Yu, Y., and Long, Z. (2014). Kinetics of rare earth pre-loading with 2-ethylhexyl phosphoric acid mono 2-ethylhexyl ester [HEH (EHP)] using rare earth carbonates. Sep. Purif. Technol. 122, 490–494. doi:10.1016/j.seppur.2013.12.007
Wang, X., Li, W., and Li, D. (2011). Extraction and stripping of rare earths using mixtures of acidic phosphorus-based reagents. J. Rare Earths 29, 413–415. doi:10.1016/S1002-0721(10)60470-X
Waseda, Y., and Isshiki, M. (eds) (2002). Purification Process and Characterization of Ultra High Purity Metals: Application of Basic Science to Metallurgical Processing. Berlin: Springer.
Weidema, B. P., Bauer, C., Hischier, R., Mutel, C., Nemecek, T., Reinhard, J., et al. (2013). Overview and Methodology: Data Quality Guideline for the Ecoinvent Database Version 3. St. Gallen: Swiss Centre for Life Cycle Inventories.
White, A. A., Platz, M. S., Aruguete, D. M., Jones, S. L., Madsen, L. D., and Wesson, R. D. (2013). The national science foundation’s investment in sustainable chemistry, engineering, and materials. ACS Sustain. Chem. Eng. 1, 871–877. doi:10.1021/sc400002r
Wu, W. Y., and Bian, X. (2012). Rare-Earth Metallurgical Technology/Modern Metallurgy and Process Engineering of Materials. Beijing: Science Press.
Yang, X. J., Lin, A., Li, X. L., Wu, Y., Zhou, W., and Chen, Z. (2013). China’s ion-adsorption rare earth resources, mining consequences and preservation. Environ. Dev. 8, 131–136. doi:10.1016/j.envdev.2013.03.006
Zhang, J., and Edwards, C. (2013). Mineral decomposition and leaching processes for treating rare earth ore concentrates. Can. Metallur. Q. 52, 243–248. doi:10.1179/1879139513Y.0000000084
Keywords: environmental impact, life-cycle assessment, life-cycle inventory, energy technology, rare-earth elements
Citation: Navarro J and Zhao F (2014) Life-cycle assessment of the production of rare-earth elements for energy applications: a review. Front. Energy Res. 2:45. doi: 10.3389/fenrg.2014.00045
Received: 04 June 2014; Accepted: 13 October 2014;
Published online: 06 November 2014.
Edited by:
Christopher Koroneos, Columbia University in the City of New York, USAReviewed by:
Payman Dehghanian, Texas A&M University, USATiziana Susca, Federal Institute for Materials Research and Testing, Germany
Copyright: © 2014 Navarro and Zhao. This is an open-access article distributed under the terms of the Creative Commons Attribution License (CC BY). The use, distribution or reproduction in other forums is permitted, provided the original author(s) or licensor are credited and that the original publication in this journal is cited, in accordance with accepted academic practice. No use, distribution or reproduction is permitted which does not comply with these terms.
*Correspondence: Fu Zhao, Division of Environmental and Ecological Engineering, School of Mechanical Engineering, Purdue University, 585 Purdue Mall, West Lafayette, IN 47907-2088, USA e-mail: fzhao@purdue.edu