Understanding and overcoming the challenges posed by electrode/electrolyte interfaces in rechargeable magnesium batteries
 Fuminori Mizuno1*
  Nikhilendra Singh1
 Timothy S. Arthur1
 Paul T. Fanson1
 Mayandi Ramanathan2,3
 Aadil Benmayza2
Jai Prakash2
Yi-Sheng Liu4
Aadil Benmayza2
Jai Prakash2
Yi-Sheng Liu4
 Per-Anders Glans4
  Jinghua Guo4
- 1Toyota Research Institute of North America, Ann Arbor, MI, USA
- 2Department of Chemical and Biological Engineering, Center for Electrochemical Science and Engineering, Illinois Institute of Technology, Chicago, IL, USA
- 3Department of Chemical Engineering, University of Washington, Seattle, WA, USA
- 4Advanced Light Source, Lawrence Berkeley National Laboratory, Berkeley, CA, USA
Magnesium (Mg) battery technologies have attracted attention as a high energy-density storage system due to the following advantages: (1) potentially high energy-density derived from a divalent nature, (2) low-cost due to the use of an earth-abundant metal, and (3) intrinsic safety aspect attributed to non-dendritic growth of Mg. However, these notable advantages are downplayed by undesirable battery reactions and related phenomena. As a result, there are only a few working rechargeable Mg battery systems. One of the root causes for undesirable behavior is the sluggish diffusion of Mg2+ inside a host lattice. Another root cause is the interfacial reaction at the electrode/electrolyte boundary. For the cathode/electrolyte interface, Mg2+ in the electrolyte needs a solvation–desolvation process prior to diffusion inside the cathode. Apart from the solid electrolyte interface (SEI) formed on the cathode, the divalent nature of Mg should cause kinetically slower solvation–desolvation processes than that of Li-ion systems. This would result in a high charge-transfer resistance and a larger overpotential. On the contrary, for the anode/electrolyte interface, the Mg deposition and dissolution process depends on the electrolyte nature and its compatibility with Mg metal. Also, the Mg metal/electrolyte interface tends to change over time, and with operating conditions, suggesting the presence of interfacial phenomena on the Mg metal. Hence, the solvation–desolvation process of Mg has to be considered with a possible SEI. Here, we focus on the anode/electrolyte interface in a Mg battery, and discuss the next steps to improve the battery performance.
Introduction
Rechargeable batteries, coupled with other alternative energy sources (hydrogen, solar, wind, etc.) to fossil fuels, are undoubtedly a key component in realizing a sustainable society (Tarascon and Armand, 2001; Armand and Tarascon, 2008; Dunn et al., 2011; Bruce et al., 2012). Electrical energy generated by such alternative (primary) energy sources can be stored within tangible rechargeable battery (secondary) sources, enabling us to transport energy on-demand to any location, while also enhancing the energy efficiency of the system. Lithium-ion (Li-ion) batteries are among the most notable examples of recently discovered rechargeable batteries, and have revolutionized portable consumer electronic devices, as well as the automotive industry. This is thanks to the advantages of higher energy density and lighter weight as compared to classical rechargeable battery systems, such as lead (Pb)/acid and nickel/cadmium (Ni/Cd). Today, this battery technology, originally spawned in the lab-scale, has been transferred into mid-scaled automobile and aerospace applications and large-scaled smart grid applications. Much effort is being devoted to advanced Li-ion battery research and development to meet the requirements of such applications. It has, however, proven difficult for Li-ion batteries to satisfy all the requirements of such applications, since the use of the battery is very different in each application. It is hence reasonable that a variety of rechargeable batteries coexist by supplementing the system with their unique application strengths. Therefore, apart from further progression of the Li-ion batteries themselves, post Li-ion battery technologies must be established to enable the diversification of electric utilization.
Magnesium (Mg) batteries (inclusive of Mg metal batteries and Mg-ion batteries) have gained much attention as post Li-ion batteries; because of (1) the higher volumetric capacity of Mg metal (3832 mAh/cc) than Li metal (2061 mAh/cc), (2) earth-abundant metal [Clark number; 1.93 (Mg) vs. 0.005 (Li)] making Mg a cost effective metal, (3) absence of dendritic growth of Mg metal, which is different in nature from the observed preferential dendritic growth of Li metal (Gofer et al., 2013; Yoo et al., 2013). Such highlighted features should allow for the creation of a new kind of energy storage system. Interestingly, Mg batteries had been intensively investigated as far back as the 1980s, prior to the appearance of Li-ion batteries (Linden and Reddy, 2011). One of the examples highlighted in these studies were magnesium sea water batteries comprising of Mg metal anode, AgCl cathode, and sea water as the electrolyte. In principle, the sea water would electrochemically activate the Mg metal anode, producing Mg2+ ions and two electrons for the cathode reaction. These batteries are also well known as primary batteries for emergency use, and are able to operate under large current densities over 10 mA/cm2. Unfortunately, the aforementioned electrochemical activation of Mg metal results in a continuous self-discharge reaction, which highlights one of the key challenges of the Mg based sea water battery. Additionally, this type of battery is quite difficult to recharge (as a secondary battery), since the Mg deposition process requires an extremely high overpotential. Moreover, this Mg deposition process most likely competes with electrolyte decomposition, passivating the Mg metal surface, and hence resistively hindering further Mg deposition.
Motivated by these challenges and the aforementioned needs, two significantly important breakthroughs for rechargeable Mg batteries were achieved by Gregory et al. (1990) and by Aurbach et al. (2000a). Gregory et al. referred to the possibility of non-aqueous Mg batteries using Grignard electrolytes and reported some candidates for electrolytes as well as cathodes. Aurbach et al. demonstrated a prototype Mg battery comprising of the Chevrel phase Mo6S8 cathode, a Grignard-reagent based electrolyte and a Mg metal anode. They were able to exhibit excellent cycling performances of over 2000 cycles with this setup. Inspired by these great successes, research efforts on rechargeable Mg batteries have continued around the world. Since the electrolyte is generally the most critical component for a battery, it has been extensively studied first and featured repeatedly in recent literatures (Aurbach et al., 2003; Yoshimoto et al., 2003; Kim et al., 2011; Mohtadi et al., 2012; Wang et al., 2012; Khoo et al., 2013; Higashi et al., 2014; Orikasa et al., 2014; Zhao-Karger et al., 2014). Some cathode candidates beyond Mo6S8, which brought about the aforementioned great progress, have also been listed to date Novak et al., 1999; (Aurbach et al., 2007; Ichitsubo et al., 2011; Kim et al., 2011; Liang et al., 2011; Zhang et al., 2012; Shiga et al., 2013; Orikasa et al., 2014), however, still on an exploratory level. Today, Mo6S8 is the only reported cathode material to realize practical high durability in a Mg battery. This lack of the practical cathodes is currently the biggest issue restraining the advancement of the entire Mg battery system.
On the other hand, the Mg metal anode does not seem to restrain Mg dissolution and deposition due to the great electrolyte discoveries. However, we found that the interfacial resistance originated between Mg metal and electrolyte drastically changed over time and with operating conditions. Even though the electrolyte compatible with Mg metal was used for the study, this phenomenon was obviously observed. Furthermore, the processes of Mg deposition and dissolution are mechanistically complicated, so that a root cause for the interface still remains unclear. Overall, the Mg metal anode/electrolyte interface would affect the proper operation of cathodes for rechargeable Mg batteries. Compared to the electrolyte and cathode, there exist only a few investigations of the Mg metal anode and its reaction process (Aurbach et al., 2000b, 2001; Matsui, 2011). Mechanistic understanding of the interface between Mg metal and the electrolyte is remarkably important for future material design and enhancement of battery performance. In this article, we focus on the anode/electrolyte interface of Mg batteries, with emphasis on Mg metal/organohaloaluminate electrolyte interfaces. To highlight the challenges observed there, electrochemical analyses are combined with spectroscopic and microscopic analyses as well as computational analysis.
Materials and Methods
Battery Fabrication and Evaluation
One organohaloaluminate electrolyte for Mg battery evaluation was prepared from the following starting materials: commercially available phenylmagnesium chloride solution (2 M PhMgCl in tetrahydrofuran, Sigma Aldrich), aluminum trichloride solution (0.5 M AlCl3 in tetrahydrofuran, Sigma Aldrich), and tetrahydrofuran (THF, Sigma Aldrich) as solvent (Arthur et al., 2014). First, the Lewis base, PhMgCl/THF was mixed with the Lewis acid, AlCl3/THF in THF in a molar ratio of 2:1. The final concentration for the electrolyte was 0.2 M. This electrolyte was reported by Aurbach et al. (2000a), and is abbreviated as APC. In a similar manner, a different kind of organohaloaluminate electrolyte was prepared by mixing ethylmagnesium chloride solution (EtMgCl, purchased from Sigma Aldrich) with diethylaluminum chloride solution (Et2AlCl, purchased from Sigma Aldrich) in THF in a molar ratio of 1:2 (Arthur et al., 2012a; Benmayza et al., 2013; Singh et al., 2013). The concentration was 0.25 M. All the chemicals were handled in an argon (Ar) filled glove box (<1 ppm of water and oxygen) and stirred overnight prior to initial use.
A manganese dioxide (MnO2) cathode was fabricated by mixing potassium-ion (K+) stabilized α-MnO2 (made by ErachemComilog), ketjenblack (KB, ECP600JD, from KB international) as conducting carbon, and poly(tetrafluoroethylene) (PTFE, from Daikin) as binder in ethanol in a weight ratio of 70:15:15. The mixture was pressed by a roll-press machine to form a sheet with an average thickness of 100–150 μm. Finally, the self-standing sheet of the MnO2 cathode was dried at 120°C under vacuum prior to battery assembly (Zhang et al., 2012; Arthur et al., 2014).
A Mg battery full-cell was assembled by using the as-prepared MnO2 cathode, as-prepared APC electrolyte immersed in a glass microfiber filter as the separator (from Whatmann) and a Mg foil anode (purchased from ESPI, 3N35 in purity). These components were sandwiched by carbon paper (CP, purchased from Toray) as the cathode current collector, while a stainless steel plate was used as the anode current collector. The setup was then were placed in a customized evaluation cell equipped with a glassy carbon inset dish, to prevent corrosion of the stainless steel testing cell (Muldoon et al., 2012). All cell assembly processes were carried out in the Ar filled glove box.
The fabricated Mg battery was evaluated with a Bio-Logic VMP3 potentiostat capable of impedance analysis under galvanostatic conditions at 25°C. Detailed evaluation conditions are described later.
Spectroscopic and Microscopic Analyses
One square centimeter silicon (Si) wafers were first sputtered with 100 nm of platinum (Pt) metal, followed by 100 nm of Mg metal. All materials were sputtered under a 3 mtorr Ar atmosphere with a substrate rotation speed of 40 RPM. The sputtering temperature was 16°C and the thickness of each material was monitored via an internal quartz crystal microbalance thickness gage. It is important to note here that it was paramount to keep the Mg metal free from exposure to air or moisture, in order to prevent oxidation of the materials. Such oxidation would inherently interfere with any analysis performed on the anode/electrolyte interface, leading to false results related to the identity of the interface.
Each sputtered wafer was then soaked in a specific electrolyte for a duration of 12 h in a glass vial, within the Ar filled glove box. The soaked wafer was then removed from the vial and any excess electrolyte was rinsed off by stirring the wafer into a fresh THF solution. Then, the rinsed wafer was sealed and enclosed into an oven to dry at 80°C under vacuum overnight. To avoid exposure of the samples to ambient air, the dried samples were set up in an air-free sample holder for field emission scanning electron microscopy (FE-SEM) and X-ray photoelectron spectroscopy (XPS) analyses. FE-SEM studies were carried out on a JEOL 7800 FLV scanning electron microscope operated at 5 kV, at a working distance of 5 mm. All samples observed via FE-SEM for the studies presented herein, were imaged “as-is,” without any sputter coating of conductive materials to enhance imaging (i.e., C, Au, Pt, etc.). XPS spectra were collected on a PHI ULVAC-PHI VersaProbe II instrument for the samples after Ar+ sputtering for 6 min as a typical means to eliminate advantageous species.
For in situ soft X-ray absorption spectroscopy (sXAS), the Mg K-edge was detected by fluorescence mode on the beamline 6.3.1.2 ISAAC end station at the advanced light source at Lawrence Berkeley National Laboratory. Details of the in situ electrochemical/XAS set-up are described in a previous publication (Arthur et al., 2012b). For the Mg deposition study, a 40 nm thick Pt layer was used as the working electrode, and was sputtered onto the 100 nm thick silicon nitride (Si3N4) window. On the contrary, for the Mg dissolution study, Mg metal was potentiostatically deposited onto the Pt covered Si3N4 window. Mg deposition was conducted at −0.75 V (vs. Mg) for 100 s. It was confirmed that there was a shift of the edge to lower energies before and after Mg deposition, which indicated the successful deposition of Mg metal onto the Si3N4 window. The thickness of the Mg metal deposited was calculated to be ~2.0 μm.
Computational Analysis
An electrochemical model was developed through alternating current (AC) impedance experimental studies. A three electrode cell was comprised of a Pt working electrode onto which Mg was electrodeposited, a Mg ribbon as a reference electrode, and a Mg wire as the counter electrode, all in an organohaloaluminate electrolyte. Detailed equations and the predicted model are described below. This model takes the electrochemical conversion of Mgz+ ions to solid Mg on the Pt surface initially, into account. After a complete layer of Mg is formed, Mg is continuously deposited over the previously deposited Mg layer. The following reaction mechanism was considered for Mg deposition.
where s+ is the stoichiometric coefficient of the reactant Mgz+, z+ is the valence of the magnesium ion and n is the number of electrons transferred. Solvent species M0 are not allowed to react with magnesium ions in this model. Based on the charge and mass balance for the ionic species in the electrode/electrolyte interface, following equations were developed by resolving the real and complex part of each parameter.
Electrolyte resistance, Rm = δ/κ; where δ is the thickness of the reaction interface layer and κ is the ionic conductivity of the electrolyte.
Mass-transfer resistance,
where D+ is the diffusivity of the magnesium ion in the electrolyte film and c+, the bulk electrolyte concentration.
Charge-transfer resistance across the interface, Rct = RT/nFi0; where i0 is the equilibrium exchange current density.
Film impedance is given by,
where,
accounting for the double-layer capacitance and the interfacial capacitance arising due to the moving interface between Mg metal and the electrolyte. The complex part of the reaction current density at the interface is given by,
Resolving the real and imaginary parts, the Z′ and Z″ values were calculated at each frequency according to the equation,
where the last term in the Z″ equation represents the correction factor used to account for high interfacial capacitance (Cifl). Using the equations for Z′ and Z″, a Nyquist plot for the present model was developed and compared with the experimental AC impedance data.
Results
Figure 1A shows the first magnesiation/de-magnesiation curves of the Mg/MnO2 cell with the APC electrolyte, at an applied current density of 0.1 mA/cm2 at 25°C. The cut-off conditions were 0.8 and 2.85 V during magnesiation and de-magnesiation, respectively. The observed capacity was normalized to the weight of MnO2. If a two electron transfer process were to occur for the MnO2 cathode, i.e., a redox reaction attributed to Mn4+/Mn2+, a theoretical capacity of 616 mAh/g would be obtained. However, the initial magnesiation and de-magnesiation capacities were ~250 and 180 mAh/g, respectively, which are less than half of the predicted theoretical capacity. A large irreversible capacity of ~70 mAh/g was also observed under the upper cut-off voltage of 2.85 V. If the cut-off potential was set higher than 2.85 V, a greater de-magnesiation capacity was observed. However, this capacity was found to originate from electrolyte decomposition occurring at 2.85 V or higher. Additionally, no clear voltage plateau was observed during magnesiation and de-magnesiation, while the voltage hysteresis between magnesiation and de-magnesiation was ~1.0 V.
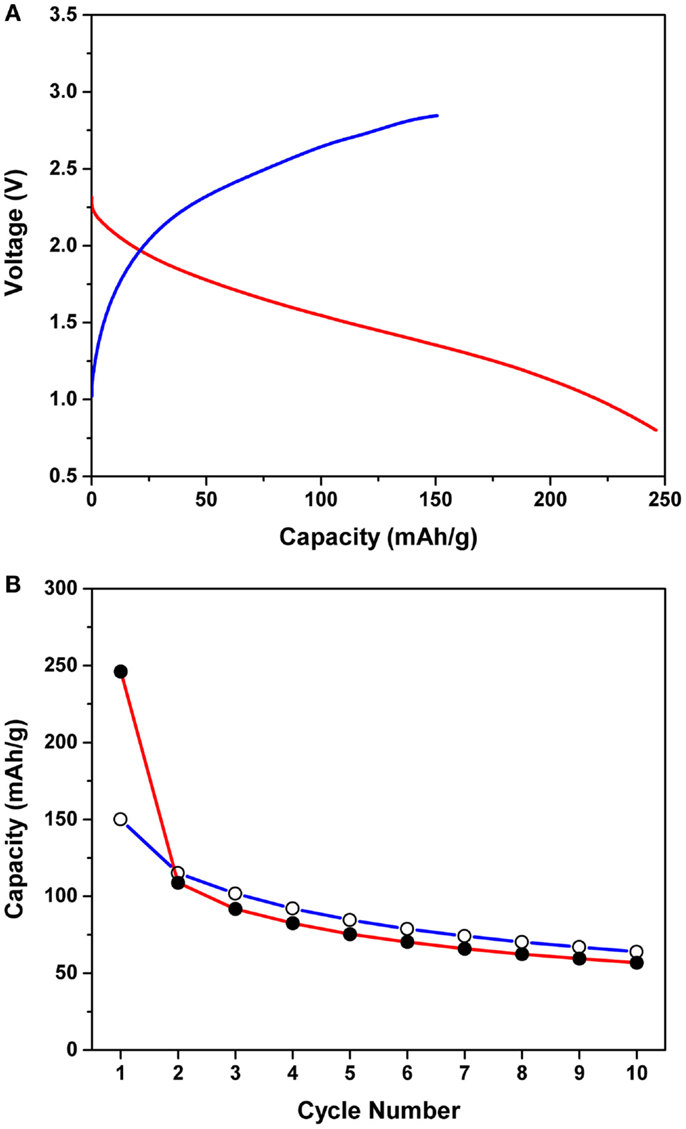
Figure 1. (A) First magnesiation/de-magnesiation curves of the Mg/MnO2 cell with the APC electrolyte, at an applied current density of 0.1 mA/cm2 at 25°C. The cut-off conditions were 0.8 and 2.85 V during magnesiation and de-magnesiation, respectively. (B) Cycling performance of the Mg/MnO2 cell with the APC electrolyte for the first 10 cycles. Shaded and unshaded circles denote the magnesiation and de-magnesiation capacities, respectively.
Figure 1B shows the cycling performance of the Mg/MnO2 cell with the APC electrolyte for the first 10 cycles. Shaded and unshaded circles denote the magnesiation and de-magnesiation capacities, respectively. The voltage profiles observed for cycling were almost the same as those in Figure 1A. As observed in the figure, even within 10 cycles, the capacities drastically decreased down to ~50 mAh/g. Moreover, the de-magnesiation capacity was observed to be a bit higher than the corresponding magnesiation capacity after the second cycle, indicating an overcharging behavior. Based upon these observations, the following challenges for the APC electrolyte based Mg/MnO2 cell exist; (1) low magnesiation/de-magnesiation capacity, (2) large irreversible capacity, (3) voltage hysteresis, (4) poor cyclability. As for materials properties, the electrochemical stability of the APC electrolyte is critical to improving the battery performance. Mg2+ diffusion in the cathode is also another point that must be considered extensively in future studies. However, we will focus on the interfaces formed between electrodes and electrolyte for this article. While the reaction mechanism has been discussed previously (Arthur et al., 2014), in reality, the electrolyte instability is intricately involved with cathode inactivation toward magnesiation/de-magnesiation processes. Electrode/electrolyte interfaces are known to strongly govern battery performances, since one or more mobile carriers need to be transported across such interfaces in order to conduct redox reactions on both electrodes in a battery (cathode and anode). In the current Mg battery, such interfaces are of scientific and practical importance to enhance the battery performance.
Figure 2 shows the Nyquist plots of the Mg/MnO2 cell described in Figure 1. All impedance data were collected under open circuit voltage (OCV) within the frequency range of 2 MHz ~ 0.1 Hz. Unshaded and shaded circles denote the impedance data collected prior to, and after cycling, respectively. Prior to cycling, a distorted semicircle with a slightly curled spike was observed, which can be attributed to resistive components within the cell. After cycling, the distorted semicircle was continuously obtained with the absence of the curled spike. This curled spike looks very different for each cell, as shown later in Figure 4A, and appears to be linked with the state of the electrode/electrolyte interface. Regardless of any capacity fading, there was no significant increase in the impedance during cycling. This implies that highly resistive components, which are often used to explain capacity fading, could not be formed in this system. At present, the capacity fading can be explained by the following root causes at the cathode/electrolyte interface and interphase; (1) structural deformation (Ling and Mizuno, 2012, 2013), (2) sluggish Mg2+ diffusion (Ling and Mizuno, 2012, 2013), and (3) core-shell formation (Arthur et al., 2014). Further evaluation of such curious impedance phenomenon, before and after the initial cycle was investigated in Figures 3 and 4.
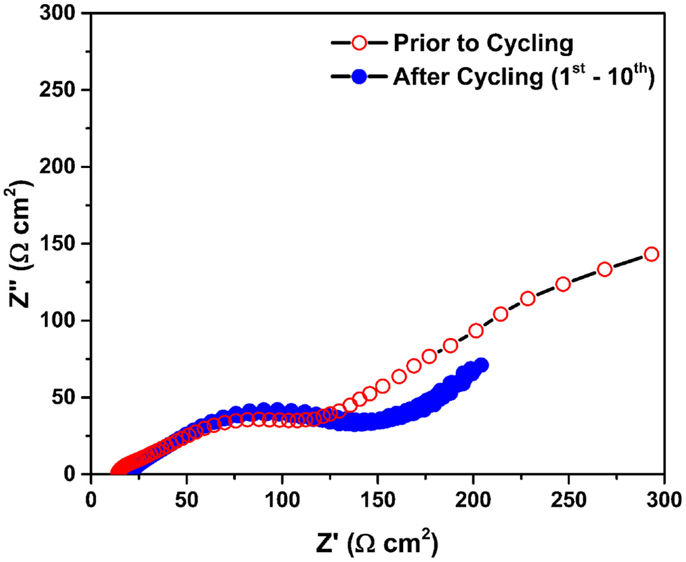
Figure 2. Nyquist plots of the Mg/MnO2 cell described in Figure 1. All impedance data were collected under open circuit voltage (OCV) within the frequency range of 2 MHz ~ 0.1 Hz. Unshaded and shaded circles denote the impedance data collected prior to and after cycling, respectively.
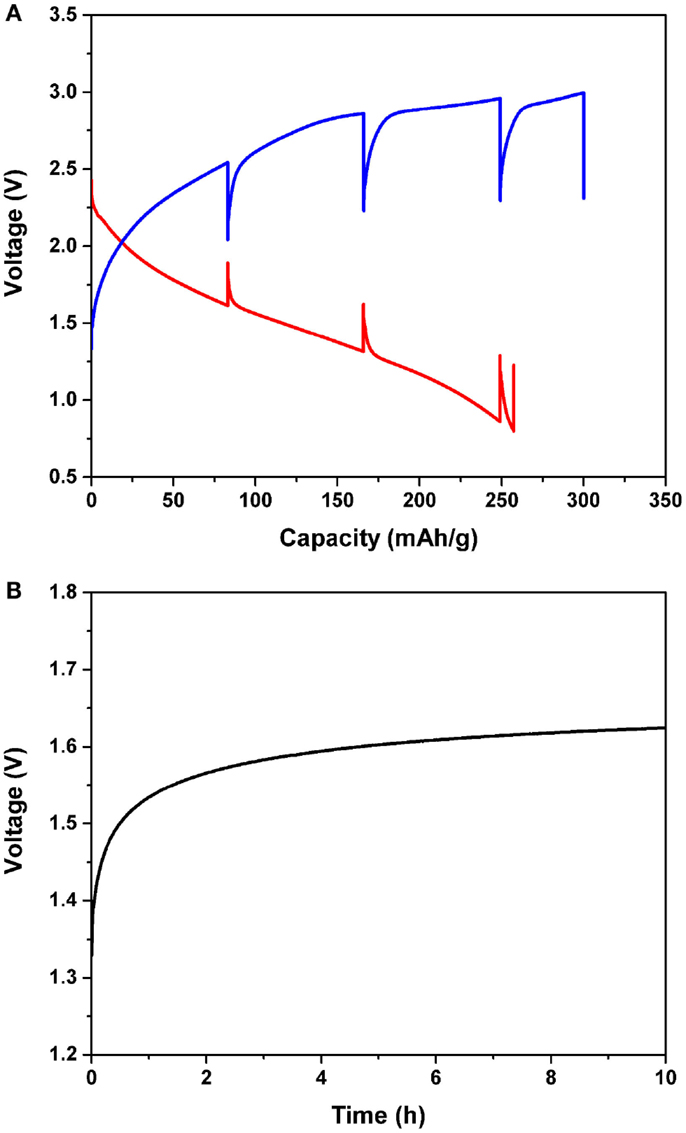
Figure 3. (A) Intermittent magnesiation/de-magnesiation profile of the Mg/MnO2 cell with the APC electrolyte for the initial cycle, and (B) voltage profile as a function of time. The current density was constantly 0.1 mA/cm2. Every 7 h, the cell was allowed to rest for 10 h, as shown in (B). The cut-off conditions were 0.8 and 2.85 V for magnesiation and de-magnesiation, respectively.
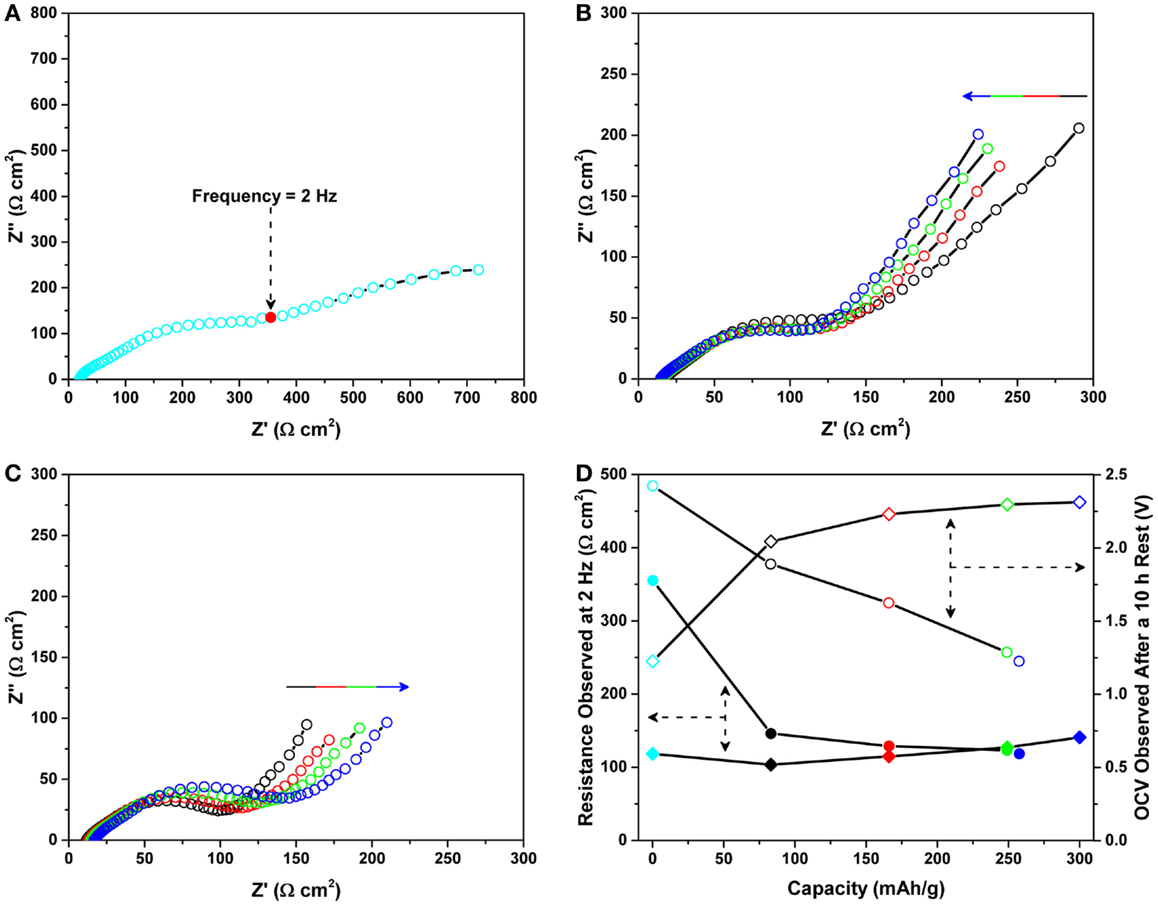
Figure 4. Nyquist plots of the Mg/MnO2 cell recorded under OCV (A) prior to magnesiation, (B) during magnesiation, and (C) during de-magnesiation for the data reported in Figure 3. All impedance data were collected under open circuit voltage (OCV) within the frequency range of 2 MHz ~ 0.1 Hz. The arrows in (B) and (C) represent an increase in the state of magnesiation/de-magnesiation. (D) shows the impedance data observed for the initial cycle. Shaded circles and diamonds denote data recorded at 2 Hz during magnesiation and de-magnesiation, respectively. Unshaded circles and diamonds represent the values of OCV recorded during impedance measurements.
Figure 3A shows the intermittent magnesiation/de-magnesiation profile of the Mg/MnO2 cell with the APC electrolyte for the initial cycle. The initial magnesiation/de-magnesiation profiles were recorded under a constant current density of 0.1 mA/cm2. Every 7 h, the cell was allowed to rest for 10 h to keep its voltage steady, as shown in Figure 3B. Finally, the cell impedance was monitored under OCV condition within the frequency range of 2 MHz ~ 0.1 Hz. These evaluations were repeatedly performed until the cut-off conditions of 0.8 and 2.85 V were reached for magnesiation and de-magnesiation, respectively. Once either the magnesiation or de-magnesiation reaction was terminated, the absence of an applied overpotential allowed the cell to reach an equilibrium state. Generally, the very short time span immediately after relaxation corresponds to IR loss, and gradual potential changes, henceforth, depend on reaction kinetics and subsequent mass transport. After complete relaxation, the cell voltage gradually recovered by 0.3 ~ 0.6 V depending on the depth of magnesiation and de-magnesiation. As shown in Figure 3B, a gradual voltage change during relaxation for several hours was observed in the current Mg battery, which suggests that both kinetics and mass transport, not IR losses, are rate-limiting factors. For magnesiation, the value of OCV observed after 10 h was found to decrease with an increase in capacity, which meant that the MnO2 cathode successfully magnesiated. Further, the magnesiation process at the initial stage was easier than the one observed at the final stage, due to the observed polarization gradually increasing with the state of magnesiation. Considering the morphological changes observed via transmission electron microscopy (TEM) (Arthur et al., 2014), this electrochemical observation is very reasonable; shell formation on the surface of MnO2 makes magnesiation difficult. In the meantime, for de-magnesiation, the voltage after relaxation showed an initial increase, but remained constant in the end. As shown in Figure 3A, the de-magnesiation curve quickly approached the upper cut-off voltage, and then assumed a near-plateau-like profile. Also, the overcharging behavior was clearly observed. Since electrolyte decomposition occurs in this voltage region, we can speculate that the resulting polarization is larger than usual.
Figure 4 shows the corresponding Nyquist plots recorded under OCV (a) prior to magnesiation, (b) during magnesiation, and (c) during de-magnesiation for the data reported in Figure 3. All impedance data were collected under OCV within the frequency range of 2 MHz ~ 0.1 Hz. The impedance prior to testing, (a) was significantly higher than the impedances observed during testing, (b) and (c). This trend is similar to the previous results shown in Figure 2. The observed high impedance prior to testing seems to disappear post battery operation. A detailed investigation of this impedance phenomenon is discussed later. On the contrary, as shown in Figures 4B,C, a relatively smaller distorted semicircle was observed after battery operation, however, no significant change was observed. This behavior looks similar to the cycling behavior in terms of impedance. To clearly understand such behavior, the impedance obtained at the frequency of 2 Hz (which is marked in Figure 4A and is the first point where the spike behavior starts), was plotted as a function of capacity during magnesiation and de-magnesiation. Figure 4D shows the impedance data observed for the initial cycle. Shaded circles and diamonds denote data recorded at 2 Hz during magnesiation and de-magnesiation, respectively. Further, unshaded circles and diamonds represent the values of OCV recorded during impedance measurements. As discussed previously, the initial impedance was observed to suddenly decrease just after magnesiation. After the initial decease, the impedance continued to decrease as the capacity increased. Then, during de-magnesiation, the impedance was observed to gradually increase. Although the gradual increase may be affected by electrolyte decomposition, overall, the impedance did not change drastically after the first event. In general, the impedance observed at 2 Hz is characteristic of interfacial resistance. The value of the real component in the impedance should be charge-transfer resistance at the electrode/electrolyte interfaces. With the exception of the first event, the charge-transfer resistance (i.e., charge transfer at the interface) looked similar regardless of the state of magnesiation and de-magnesiation. Based on these impedance analyses, we can speculate that the first event of impedance drop could be attributed to activation at one or more interfaces in the Mg/MnO2 battery.
To understand the initial impedance behavior, two types of symmetrical cells for the MnO2 cathode and the Mg anode were fabricated. Figure 5 shows the Nyquist plots of the symmetrical (a) MnO2/MnO2 cell and (b) Mg/Mg cell (as a function of holding time) under OCV. The impedance of the symmetrical cells was recorded every 3 h (up to total 12 h). All impedance data were collected under OCV and the lowest frequency was 0.1 and 0.01 Hz for the cathode and anode studies, respectively. The APC electrolyte was used with a glass filter separator, while CP and a stainless steel plate were used as current collectors for the cathode and anode materials, respectively. All the electrodes were pristine and electrochemically un-altered. The MnO2 cathode itself had very small resistance of less than 1 Ωcm2. The MnO2 symmetrical cell highlighted a distorted semicircle having an impedance of ~200–250 Ωcm2, which is derived from both the CP/electrolyte and MnO2/electrolyte interfaces. The total impedance increased slightly with holding time but no significant changes were observed. On the contrary, for the Mg symmetrical cell, a depressed semicircle, which is assigned to the Mg/electrolyte interface, was clearly observed to increase with holding time. The charge-transfer resistance increased with an increase in the holding time at OCV, and reached roughly 350 kΩcm2 at 12 h. This is in good agreement with the previous results (Aurbach et al., 2000b, 2001). Interestingly, once a constant voltage (herein, +150 mV) was applied to the symmetrical cell, the large impedance value disappeared. The inset in Figure 5B shows the Nyquist plot of the Mg/Mg symmetrical cell measured under a bias voltage of +150 mV. A very reasonable resistance (herein, ~0.8 kΩcm2) was observed instead of the initial large resistance. Although the detailed impedance study on the Mg/electrolyte interface is still under investigation, these experiments provide evidence of high impedance values before testing and low impedance values during testing. It can, therefore, be speculated that the initially formed Mg metal/electrolyte interface brings about high impedance, while the electrochemically active interface is self-formed on the Mg metal by applying either voltage or current to the cell, resulting in lower impedance, which enables the reversible Mg dissolution/deposition process. At present, this interfacial resistance on the Mg metal anode does not significantly affect the cell performance due to low applied current densities. However, this interfacial phenomenon will undoubtedly be important in operating Mg “metal” batteries at a practical rate.
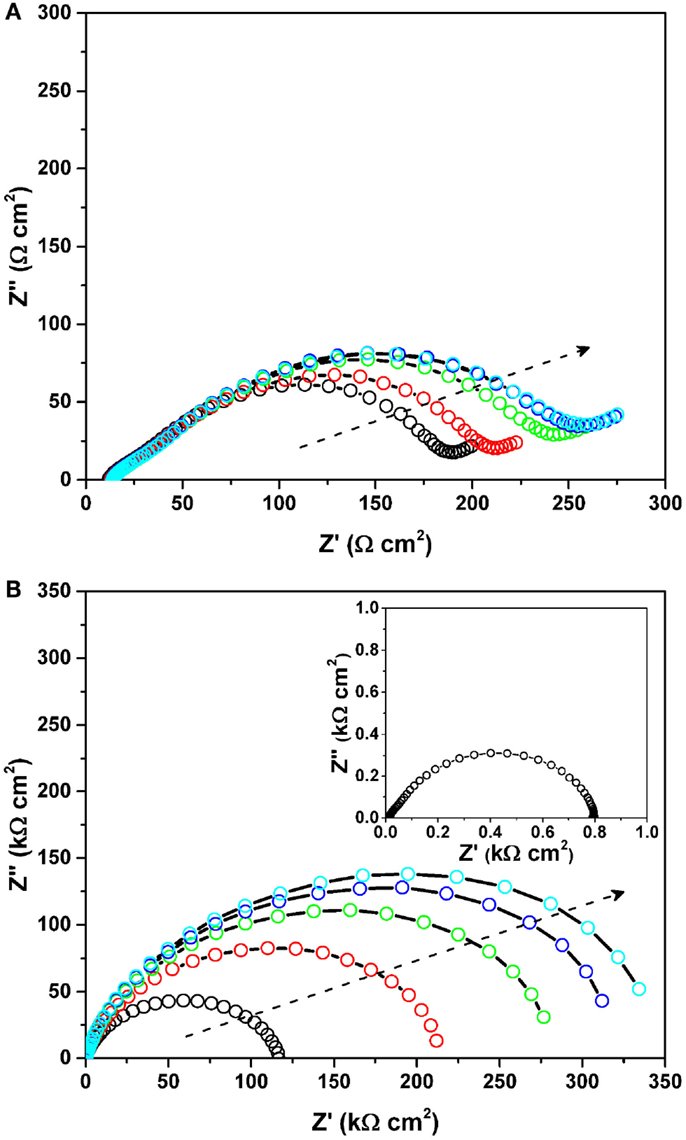
Figure 5. Nyquist plots of the symmetrical (A) MnO2/MnO2 cell and (B) Mg/Mg cell (as a function of holding time) under OCV. The impedance of the symmetrical cells was recorded every 3 h (up to total 12 h). All impedance data were collected under OCV and the lowest frequency was 0.1 and 0.01 Hz for the cathode and anode studies, respectively. The arrows represent an increase of the holding time. The inset in (B) shows the Nyquist plot of the Mg/Mg symmetrical cell measured under a bias voltage of +150 mV.
Motivated by the interface between Mg metal and the organohaloaluminate electrolyte, further spectroscopic and microscopic analyses were conducted. The impedance change at the interface should affect the apparent surface on the Mg metal and create some interfacial components. Figure 6 shows the FE-SEM images of sputtered Mg metal (a) before and (b) after soaking for 12 h in the EtMgCl-Et2AlCl/THF solution as an electrolyte. It is evident from the SEM data gathered here that there was no significant morphological change observed when the Mg metal anode was soaked in the organohaloaluminate electrolyte. However, the Mg surface apparently got a bit smoother after the soaking process was complete. This suggests that some Mg dissolution into the electrolyte due to the highly corrosive nature of the organohaloaluminate electrolyte occurs. Taking into account the result highlighted in Figure 5, it should be noted that slight dissolution of Mg metal could cause the reformation of the Mg metal/electrolyte interface over time, resulting in a gradual increase in the overall impedance observed for the symmetrical cell.
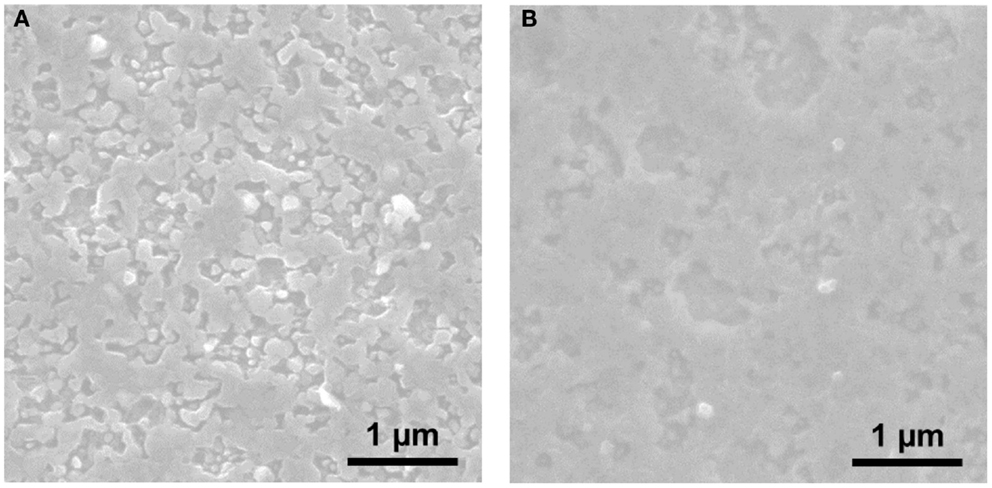
Figure 6. FE-SEM images of sputtered Mg metal (A) before and (B) after soaking for 12 h in the EtMgCl-Et2AlCl/THF solution as an electrolyte.
Figure 7 shows the corresponding XPS spectra for sputtered Mg metal (a) before and (b) after the soaking experiment shown in Figure 6. The XPS data gathered for the Mg metal anode further clarify the case for the formation of an interface layer. As shown, both the as-sputtered sample and the soaked sample in the organohaloaluminate electrolyte only display the Mg 2 s peak and do not show any other elements (Al, Cl) from the electrolyte. Although the other possible species attributed to carbon and oxygen is still under discussion, this in turn confirms the absence of any solid-state interface layer formed when Mg metal is soaked in the organohaloaluminate electrolyte. Hence, it can be summarized, that the contribution of the interfacial layer on Mg metal, which is often referred to as a solid electrolyte interface (SEI) layer in Li-ion batteries, was either absent or negligible.
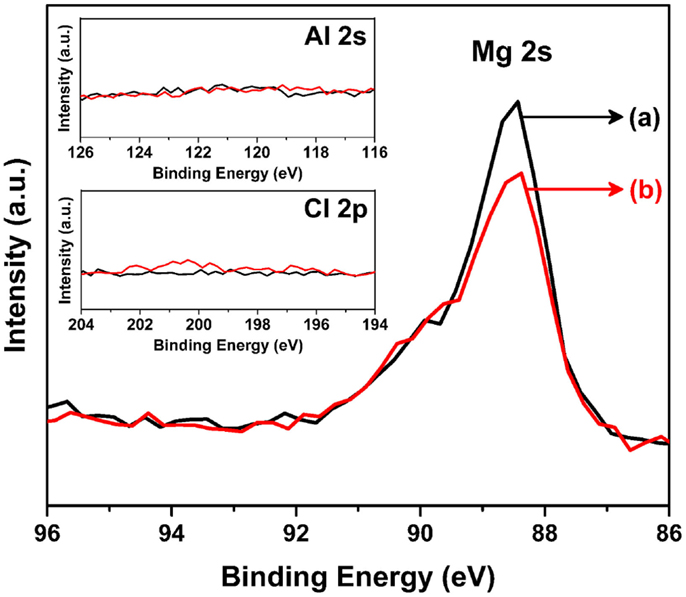
Figure 7. Mg 2s XPS spectra for sputtered Mg metal (a) before and (b) after the soaking experiment shown in Figure 6. Inset figure shows the spectra of (top) Al 2s and (bottom) Cl 2p for the same sputtered materials.
However, in situ observation at the interface presented very impressive findings and new insights. Figure 8 shows the in situ X-ray absorption near edge structure (XANES) spectra of the Mg K-edge for the interface between Mg metal and the organohaloaluminate electrolyte (a) during Mg deposition on a Pt electrode and (b) during Mg dissolution from the electrochemically deposited Mg metal onto the Pt electrode. The applied potentials were −0.1, −0.2, and −0.75 V vs. Mg for deposition and +0.1 and +0.5 V vs. Mg for dissolution. The total collection and potential application for Mg deposition was 1800 s for −0.1 and −0.2 V, and 100 s for −0.75 V. To obtain sufficient spectral quality during the dissolution process, the total collection times were 100 s while the potential application times were 1800 and 400 s for +0.1 and +0.5 V, respectively. As seen in Figure 8A, Mg deposition had not started at −0.1 V vs. Mg. Nonetheless, a new edge was clearly observed at ~1304 eV, forming a new “intermediate species” before Mg deposition. With more negative potential, the intensity of this new edge was observed to increase, and finally at −0.75 V vs. Mg, the edge of the XANES spectrum shifted from 1304 to 1301 eV, which corresponds to Mg metal. The observation of the new edge unveiled the presence of an intermediate species formed at the interface between Mg metal and organohaloaluminate electrolyte for the very first time. As a consequence, it was found that such an intermediate species likely plays a significant role in electrochemical Mg deposition.
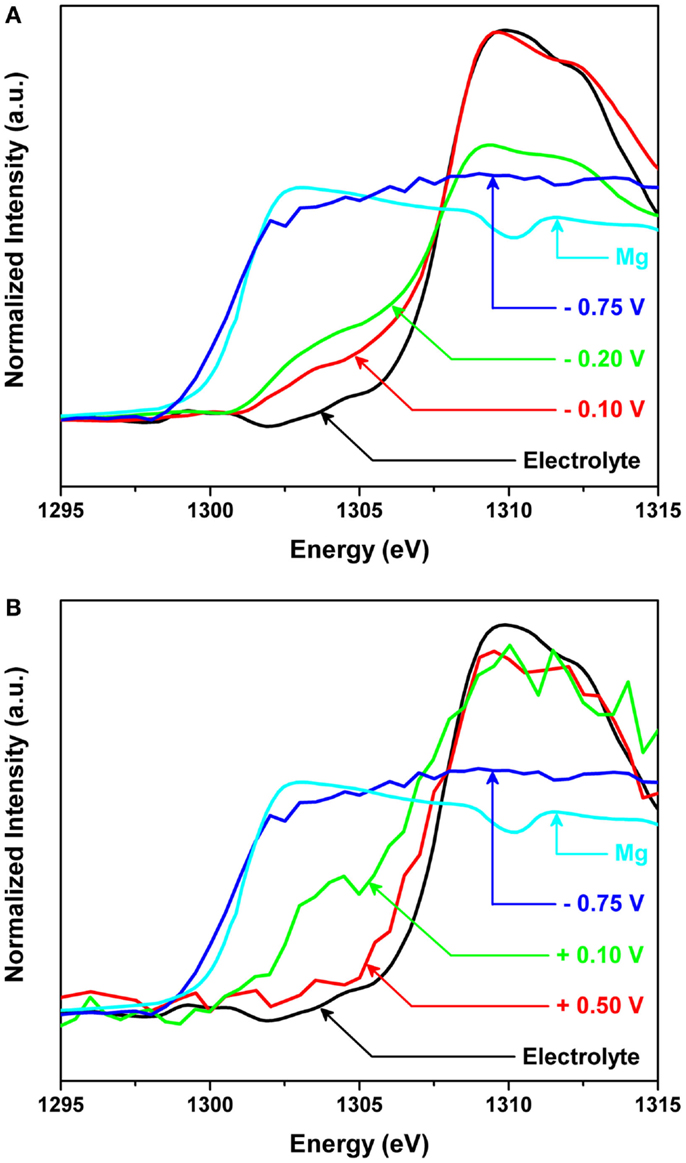
Figure 8. In situ X-ray absorption near edge structure (XANES) spectra of the Mg K-edge for the interface between Mg metal and the organohaloaluminate electrolyte (A) during Mg deposition on a Pt electrode and (B) during Mg dissolution from the electrochemically deposited Mg metal onto the Pt electrode. The applied potentials were −0.1, −0.2, and −0.75 V vs. Mg for deposition and +0.1 and +0.5 V vs. Mg for dissolution.
While applying the positive potentials, the in situ absorption spectra for the Mg dissolution process were also collected as in Figure 8B. When a potential of +0.5 V vs. Mg was applied, a sudden increase in edge energy due to the complete removal of Mg from the surface of the Pt electrode was observed. The obtained spectrum looked very similar in intensity and edge position to the spectrum of the as-made electrolyte, indicating that all of the Mg metal had been successfully removed. During this experiment, it was difficult to capture any electrolyte intermediates during Mg dissolution due to the very short lifetimes of such species at +0.5 V vs. Mg. To observe the dissolution process of Mg metal from the surface in more detail, the applied potential was reduced to +0.1 V vs. Mg. The edge shifted to higher energies indicating the removal of Mg metal from the surface. More importantly, the edge position did not completely shift back to that of the as-made electrolyte. According to our careful comparisons, at very positive applied potentials, the Mg K-edge returned to the original, as-made position of the electrolyte, before Mg metal deposition. However, at less positive potentials, an additional edge at ~1303 eV remained present. The presence of this additional edge can be explained by (1) the presence of Mg metal that was not removed at +0.1 V vs. Mg or (2) an intermediate species necessary for dissolution of Mg metal.
The edge position Eo taken for sXAS K-edge spectra is generally sensitive to the electronic structure of materials, for example, oxidation state and symmetry. Therefore, the Eo value was precisely estimated by taking the derivative of the spectrum. In our data, the peak for Mg metal is located at 1301.0 eV, while the peak for the as-made electrolyte is located at 1309.1 eV. For the spectrum obtained at more positive applied potentials, there is one clear maximum located at 1308.7 eV, indicating a return to the original state after oxidation. However, for the spectrum obtained at less positive potentials, there are two peak maximums present; one located at 1308.9 eV and the other located at 1303.2 eV. Comparing the latter peak to the peak seen for Mg metal, +2.2 eV shift was observed. It was, thus, demonstrated that the new Eo position was an indication of an intermediate species needed for Mg dissolution. However, additional experiments are needed to determine if the small shift in Eo value may also be interpreted as negligible due to the fast collection times rates required for the in situ dissolution process. Additionally, it is not clear whether the intermediate species formed are the same during Mg deposition and dissolution processes. Structural refinement of the intermediate species, supported by spectral simulations will be required as future detailed investigations. These points aside, we have proven that the interface between Mg metal and electrolyte is crucial to carry out Mg deposition/dissolution processes, via in situ XAS observations.
Finally, resistances of the electrolyte and other electrochemical processes were measured using AC impedance on a three electrode cell. A predictive model was developed to quantitatively describe the electrochemical processes occurring at the Mg/electrolyte interface. Figure 9 shows Nyquist plots of the Mg/Pt cell in EtMgCl-Et2AlCl/THF solution as an electrolyte. Unshaded and shaded circles denote the measured and predicted plots, respectively. Inset figure shows the schematic of the model for Mg/electrolyte interface. As seen, there was consistency of the AC impedance model with the experimental data; the charge-transfer resistance was 2.25 kΩcm2. Based on the model fitting, an important parameter, the thickness of the intermediate species layer, was estimated to be ~7 μm in a three electrode cell. Further, during this analysis, the ion diffusion coefficient was measured to be 1.37 × 10⁻⁸ cm2/s and the mass transport resistance was calculated to be 1720 kΩcm2, indicating that the bulk electrolyte showed relatively poor transport properties. In this setup, the distance between the Mg counter electrode and Pt working electrode was roughly 1 cm. Considering the width of the bulk electrolyte solution, the intermediate species layer would have a skin-like appearance on the Mg metal surface. However, this skin-like interface seems responsible for determining whether the electrochemical reaction proceeds as desired, or not. Further investigation of the Mg/electrolyte interface is very important for electrolyte design as well as interfacial control.
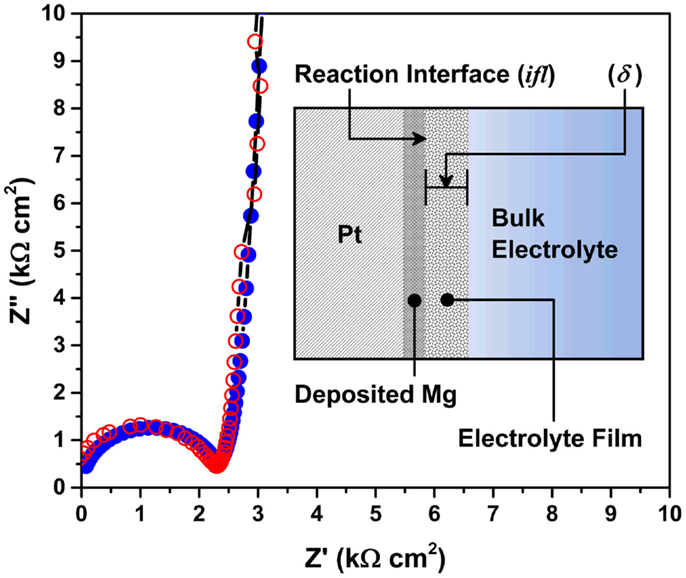
Figure 9. Nyquist plots of the Mg/Pt cell in the EtMgCl-Et2AlCl/THF solution as an electrolyte. Unshaded and shaded circles denote the measured and predicted plots, respectively. Inset figure shows the schematic of the model for Mg/electrolyte interface.
Discussion
The performance of a Mg/MnO2 battery utilizing organohaloaluminate electrolytes was demonstrated. High initial capacity of 250 mAh/g was confirmed, but overcharging, severe capacity fading and large voltage hysteresis were observed as major issues needing attention. Further, prior to battery testing, a large impedance was initially observed for the Mg battery. Through detailed impedance analyses, it was found that the initial impedance mainly originated from the interface between Mg metal and the organohaloaluminate electrolyte. From SEM and XPS studies, a solid-state species (like a SEI) was not observed. On the contrary, from in situ XAS observation, an intermediate layer in the form of soluble species was clearly detected at the Mg/electrolyte interface.
A schematic image of the Mg metal/organohaloaluminate electrolyte interface layer incorporating intermediate species is drawn in Figure 10. Also, the speculated interfacial reaction processes on the Mg metal anode are described here;
where the anion complex includes Cl−, AlCl4−, and RxAlCly−.
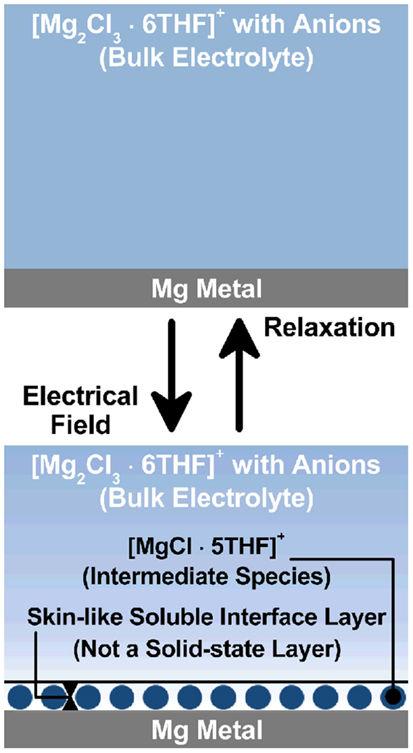
Figure 10. A schematic image of the Mg metal/organohaloaluminate electrolyte interface layer incorporating intermediate species.
When the cell was just assembled, a fresh interface was created between the Mg metal anode and the organohaloaluminate electrolyte (top of Figure 10), which grew as a function of time, resulting in a large charge-transfer resistance. Impedance data show that it is not an electrochemically active interface, although Mg metal was slightly dissolved into the electrolyte. The organohaloaluminate electrolyte mostly exists in the form of [Mg2Cl3.6THF]+ with a corresponding anion complex on Mg metal as shown in the Eq. (1) above. Once the electrochemical potential was induced, a newly formed interface (bottom of Figure 10) was created with the formation of at least one intermediate species (a shift of equilibrium reaction to the right), as revealed by the in situ soft X-ray analysis. As a result, a relatively low charge-transfer resistance was observed. A key point is to form electrochemically active species at the interface between Mg metal and the electrolyte and to build the desired interface from the fresh interface. Herein, the active species are most likely the same intermediate species identified in the soft X-ray analysis, specifically the [MgCl.5THF]+ molecule. Provided that the [MgCl.5THF]+ species is a key material for both Mg deposition and Mg dissolution, either applied potential or current is able to drive the strong adsorption–desorption of [MgCl.5THF]+ on the Mg metal [shown in the Eq. (1)], and the following two electron reaction described in the Eqs (2 and 3) (Benmayza et al., 2013).
Here, the adsorption–desorption process of [MgCl.5THF]+ as an intermediate species would be a type of interlayer as drawn in the bottom of Figure 10. Eq. (2) above describes the solvation–desolvation process on the Mg metal. Fortunately, this process appears to be faster than expected in spite of low Mg-ion transport properties in the organohaloaluminate electrolyte, because the in situ XAS observation would not identify any different species from the aforementioned intermediate species. In contrast, in Li-ion batteries, this process is kinetically very important to determine the overall battery performance. In case of the Mg battery, it appears to be much more complicated because of divalent nature of Mg2+ and the existence of monovalent complexes derived from [MgCl.5THF]+ and [Mg2Cl3.6THF]+ species. To date, the solvation–desolvation process may be hidden by other limiting factors. However, when a practical rate is applied for the Mg battery, its influence on the anode/electrolyte interface is certainly significant. Further investigation of the interface between electrode and electrolyte is essential to realize Mg battery as a next generation battery.
Conflict of Interest Statement
The authors declare that the research was conducted in the absence of any commercial or financial relationships that could be construed as a potential conflict of interest.
Acknowledgments
The authors thank Dr. Rana Mohtadi, Dr. Oscar Tutusaus, Dr. John Muldoon, Dr. Claudiu Bucur, Dr. Chen Ling, Dr. Ruigang Zhang, and Dr. Masaki Matsui. The work at the Advanced Light Source is supported by the Director, Office of Science, Office of Basic Energy Science, of the U.S., Department of Energy, under Contract DE-AC02-05CH11231.
References
Armand, M., and Tarascon, J.-M. (2008). Building better batteries. Nature 451, 652–657. doi: 10.1038/451652a
Arthur, T. S., Singh, N., and Matsui, M. (2012a). Electrodeposited Bi, Sb and Bi1-xSbx alloys as anodes for Mg-ion batteries. Electrochem. Commun. 16, 103–106. doi:10.1016/j.elecom.2011.12.010
Arthur, T. S., Glans, P.-A., Matsui, M., Zhang Ma, B., and Guo, J. (2012b). Mg deposition observed by in situ electrochemical Mg K-edge X-ray absorption spectroscopy. Electrochem. Commun. 24, 43–46. doi:10.1016/j.elecom.2012.08.018
Arthur, T. S., Zhang, R., Ling, C., Glans, P.-A., Fan, X., Guo, J., et al. (2014). Understanding the electrochemical mechanism of K-αMnO2 for magnesium battery cathode. ACS Appl. Mater. Inter. 6, 7004–7008. doi:10.1021/am5015327
Pubmed Abstract | Pubmed Full Text | CrossRef Full Text | Google Scholar
Aurbach, D., Lu, Z., Schechter, A., Gofer, Y., Gizbar, H., Turgeman, R., et al. (2000a). Prototype systems for rechargeable magnesium batteries. Nature 407, 724–727. doi:10.1038/35037553
Pubmed Abstract | Pubmed Full Text | CrossRef Full Text | Google Scholar
Aurbach, D., Moshkovich, M., Schechter, A., and Turgeman, R. (2000b). Magnesium deposition and dissolution processes in ethereal Grignard salt solutions using simultaneous EQCM-EIS and In situ FTIR spectroscopy. Electrochem. Solid State Lett. 3, 31–34. doi:10.1149/1.1390949
Aurbach, D., Schechter, A., Moshkovich, M., and Cohen, Y. (2001). On the mechanisms of reversible magnesium deposition process. J. Electrochem. Soc. 148, A1004–A1014. doi:10.1149/1.1387980
Aurbach, D., Suresh, G. S., Levi, E., Mitelman, A., Mizrahi, O., Chusid, O., et al. (2007). Progress in rechargeable magnesium battery technology. Adv. Mater. 19, 4260–4267. doi:10.1002/adma.200701495
Pubmed Abstract | Pubmed Full Text | CrossRef Full Text | Google Scholar
Aurbach, D., Weissman, I., Gofer, Y., and Levi, E. (2003). Nonaqueous magnesium electrochemistry and its application in secondary batteries. Chem. Rec. 3, 61–73. doi:10.1002/tcr.10051
Pubmed Abstract | Pubmed Full Text | CrossRef Full Text | Google Scholar
Benmayza, A., Ramanathan, M., Arthur, T. S., Matsui, M., Mizuno, F., Guo, J., et al. (2013). Effect of electrolytic properties of a magnesium organohaloaluminate electrolyte on a magnesium deposition. J. Phys. Chem. C 117, 26881–26888. doi:10.1021/jp4077068
Bruce, P. G., Freunberger, S. A., Hardwick, L. J., and Tarascon, J.-M. (2012). Li-O2 and Li-S batteries with high energy storage. Nat. Mater. 11, 19–29. doi:10.1038/nmat3191
Pubmed Abstract | Pubmed Full Text | CrossRef Full Text | Google Scholar
Dunn, B., Kamath, H., and Tarascon, J.-M. (2011). Electrical energy storage for the grid: a battery of choices. Science 334, 928–935. doi:10.1126/science.1212741
Pubmed Abstract | Pubmed Full Text | CrossRef Full Text | Google Scholar
Gofer, Y., Pour, N., and Aurbach, D. (2013). “Lithium batteries: advanced technologies and applications,” in Electrolytic Solutions for Rechargeable Magnesium Batteries. eds B. Scrosati, K. M. Abraham, W. A. van Schalkwijk, and J. Hassoun (Weinheim: Wiley), 328–345.
Gregory, T. D., Hoffman, R. J., and Winterton, R. C. (1990). Nonaqueous electrochemistry of magnesium – applications to energy storage. J. Electrochem. Soc. 137, 775–780. doi:10.1149/1.2086553
Higashi, S., Miwa, K., Aoki, M., and Takechi, K. (2014). A novel inorganic solid state ion conductor for rechargeable Mg batteries. Chem. Commun. 50, 1320–1322. doi:10.1039/c3cc47097k
Pubmed Abstract | Pubmed Full Text | CrossRef Full Text | Google Scholar
Ichitsubo, T., Adachi, T., Yagi, S., and Doi, T. (2011). Potential positive electrodes for high-voltage magnesium-ion batteries. J. Mater. Chem. 21, 11764–11772. doi:10.1039/c1jm11793a
Khoo, T., Somers, A., Torriero, A. A. J., MacFarlane, D. R., Howlett, P., and Forsyth, M. (2013). Discharge behaviour and interfacial properties of a magnesium battery incorporating trihexyl(tetradecyl) phosphonium based ionic liquid electrolytes. Electrochim. Acta 87, 701–708. doi:10.1016/j.electacta.2012.09.072
Kim, H. S., Arthur, T. S., Allred, G. D., Zajicek, J., Newman, J. G., Rodnyansky, A. E., et al. (2011). Structure and compatibility of a magnesium electrolyte with a sulphur cathode. Nat. Commun. 2, 427–432. doi:10.1038/ncomms1435
Pubmed Abstract | Pubmed Full Text | CrossRef Full Text | Google Scholar
Liang, Y., Feng, R., Yang, S., Ma, H., Liang, J., and Chen, J. (2011). Rechargeable Mg batteries with graphene-like MoS2 cathode and ultrasmall Mg nanoparticle anode. Adv. Mater. 23, 640–643. doi:10.1002/adma.201003560
Pubmed Abstract | Pubmed Full Text | CrossRef Full Text | Google Scholar
Linden, D., and Reddy, T. B. (2011). Linden’s Handbook of Batteries, 4th Edn. New York: McGraw-Hill.
Ling, C., and Mizuno, F. (2012). Capture lithium in αMnO2: insights from first principles. Chem. Mater. 24, 3943–3951. doi:10.1021/cm302347j
Ling, C., and Mizuno, F. (2013). Phase stability of post-spinel compound AMn2O4 (A = Li, Na, or Mg) and its application as a rechargeable battery cathode. Chem. Mater. 25, 3062–3071. doi:10.1021/cm401250c
Matsui, M. (2011). Study on electrochemically deposited Mg metal. J. Power Sources 196, 7048–7055. doi:10.1016/j.jpowsour.2010.11.141
Mohtadi, R., Matsui, M., Arthur, T. S., and Hwang, S. J. (2012). Magnesium borohydride: from hydrogen storage to magnesium battery. Angew. Chem. Int. 51, 9780–9783. doi:10.1002/anie.201204913
Pubmed Abstract | Pubmed Full Text | CrossRef Full Text | Google Scholar
Muldoon, J., Bucur, C. B., Oliver, A. G., Sugimoto, T., Matsui, M., Kim, H. S., et al. (2012). Electrolyte roadblocks to a magnesium rechargeable battery. Energy Environ. Sci. 5, 5941–5950. doi:10.1039/c2ee03029b
Novak, P., Imhof, R., and Hass, O. (1999). Magnesium insertion electrodes for rechargeable nonaqueous batteries – a competitive alternative to lithium? Electrochim. Acta 45, 351–367. doi:10.1016/S0013-4686(99)00216-9
Orikasa, Y., Masese, T., Mori, T., Hattori, M., Yamamoto, K., Okado, T., et al. (2014). High energy density rechargeable magnesium battery using earth-abundant and non-toxic elements. Sci. Rep. 4, 5622–5627. doi:10.1038/srep05622
Pubmed Abstract | Pubmed Full Text | CrossRef Full Text | Google Scholar
Shiga, T., Hase, Y., Kato, Y., Inoue, M., and Takechi, K. (2013). A rechargeable non-aqueous Mg–O2 battery. Chem. Commun. 49, 9152–9154. doi:10.1039/c3cc43477j
Pubmed Abstract | Pubmed Full Text | CrossRef Full Text | Google Scholar
Singh, N., Arthur, T. S., Ling, C., Matsui, M., and Mizuno, F. (2013). A high energy-density tin anode for rechargeable magnesium-ion batteries. Chem. Commun. 49, 149–151. doi:10.1039/c2cc34673g
Pubmed Abstract | Pubmed Full Text | CrossRef Full Text | Google Scholar
Tarascon, J.-M., and Armand, M. (2001). Issues and challenges facing rechargeable lithium batteries. Nature 414, 359–367. doi:10.1038/35104644
Pubmed Abstract | Pubmed Full Text | CrossRef Full Text | Google Scholar
Wang, F. F., Guo, Y. S., Yang, J., Nuli, Y., and Hirano, S. (2012). A novel electrolyte system without a Grignard reagent for rechargeable magnesium batteries. Chem. Commun. 48, 10763–10765. doi:10.1039/c2cc35857c
Pubmed Abstract | Pubmed Full Text | CrossRef Full Text | Google Scholar
Yoo, H.-D., Shterenberg, I., Gofer, Y., Gershinsky, G., Pour, N., and Aurbach, D. (2013). Mg rechargeable batteries: an on-going challenge. Energy Environ. Sci. 6, 2265–2279. doi:10.1039/c3ee40871j
Yoshimoto, N., Yakushiji, S., Ishikawa, M., and Morita, M. (2003). Rechargeable magnesium batteries with polymer gel electrolytes containing magnesium salts. Electrochim. Acta 48, 2317–2322. doi:10.1016/S0013-4686(03)00221-4
Zhang, R., Yu, X., Nam, K.-W., Ling, C., Arthur, T. S., Song, W., et al. (2012). α-MnO2 as a cathode material for rechargeable Mg batteries. Electrochem. Commun. 23, 110–113. doi:10.1016/j.elecom.2012.07.021
Keywords: magnesium battery, electrode/electrolyte interface, Mg metal, anode, intermediate species, solvation–desolvation process
Citation: Mizuno F, Singh N, Arthur TS, Fanson PT, Ramanathan M, Benmayza A, Prakash J, Liu Y-S, Glans P-A and Guo J (2014) Understanding and overcoming the challenges posed by electrode/electrolyte interfaces in rechargeable magnesium batteries. Front. Energy Res. 2:46. doi: 10.3389/fenrg.2014.00046
Received: 14 August 2014; Accepted: 14 October 2014;
Published online: 11 November 2014.
Edited by:
Peter G. Bruce, University of St. Andrews, UKCopyright: © 2014 Mizuno, Singh, Arthur, Fanson, Ramanathan, Benmayza, Prakash, Liu, Glans and Guo. This is an open-access article distributed under the terms of the Creative Commons Attribution License (CC BY). The use, distribution or reproduction in other forums is permitted, provided the original author(s) or licensor are credited and that the original publication in this journal is cited, in accordance with accepted academic practice. No use, distribution or reproduction is permitted which does not comply with these terms.
*Correspondence: Fuminori Mizuno, Materials Research Department, Toyota Research Institute of North America, 1555 Woodridge Avenue, Ann Arbor, MI 48105, USA e-mail: fuminori.mizuno@tema.toyota.com