The influence of particle size, fluidization velocity, and fuel type on ash-induced agglomeration in biomass combustion
 Bernhard Gatternig*
  Jürgen Karl
- Chair of Energy Process Engineering, Friedrich-Alexander University Erlangen-Nürnberg, Nuremberg, Germany
Agglomeration of the bed material is one of the main obstacles for biomass utilization in fluidized bed combustors. Especially, high-potential fuels such as fast growing energy crops or biogeneous residues are affected because of their high content of alkaline metals. Despite ongoing research efforts, the knowledge base on what fuels are affected is still limited. This paper describes the design and installation of two lab-scale reactors for the experimental determination of agglomeration temperatures. The reactor concept and measurement method were developed under consideration of experiences from existing test rigs published in literature. Preliminary tests confirmed a reproducibility of ±5°C for both new reactors. The results of an extended measurement campaign (156 test runs of 25 fuel species at a wide range of the operational parameters “bed particle size,” “gas velocity,” and “bed ash accumulation”), based on “design of experiment” (DoE) criteria, showed high-agglomeration tendencies for residues (e.g., dried distillery grains, corn cobs) while woody energy crops (e.g., willow, alder) exhibited very stable combustion behavior. The operating parameters influenced the agglomeration behavior to a lesser degree than different ash compositions of fuel species tested. An interpolation within the DoE factor space allowed for a subsequent comparison of our results with experiments reported in literature. Good agreement was reached for fuels of comparable ash composition considering the interpolation errors of ±32°C on average.
Introduction
The potential of biomass as a supplement for fossil fuels is strongly dependent on suitable energy conversion paths. Fluidized bed combustion is well suited for this task because of its inherent advantages, such as low-combustion temperatures, high-fuel flexibility, and suitability for low-calorific fuels (Khan et al., 2009). The ash composition of biogenic fuels, especially of innovative species like energy crops or agricultural residues, however, leads to the well described problems of slagging, corrosion, and agglomeration (Latva-Somppi et al., 1998). A large factor for these issues in the case of fluidized bed combustion is the melting behavior of the ash and also its interaction with the bed material. The appearance of a liquid phase leads to an increase in adhesive forces and the accelerated diffusion within this melt amplifies these harmful processes. This knowledge leads to the development of a wide variety of procedures for the determination of ash melting behavior. Among those, the ash fusion test according to ASTM D1857 or DIN 51730 is most commonly used. The process starts with the ashing of the fuel at 815 ± 10°C (DIN51719) and 550 ± 10°C (DIN 14775) for coal and biomass, respectively, followed by its compaction into a standard shape (cylinder for DIN or cone for ASTM). The sample is then heated at a constant temperature gradient and observed optically for deformation caused by sintering or melting. The temperatures of characteristic shape changes are recorded:
• initial deformation (IDT) – e.g., rounding of edges, shrinking, etc.
• softening temperature (ST) – spherical appearance with original sample height
• hemispherical temperature (HT) – hemispherical appearance with half the original sample height
• flow temperature (FT) – sample height below 1/6 of original.
As the effects of ash-bed interaction or fractioning of the ash are not considered in the process, its application to fluidized bed combustion – in particular, for the determination of agglomeration behavior – is controversial (Hansen et al., 1999; Fernández Llorente and Carrasco García, 2005; Bartels et al., 2008). Other agglomeration prediction methods are based on the change in physical properties, e.g., electrical or heat conductivity (Hansen et al., 1999), or on the mechanical strength of ash pellets (Fernández Llorente and Carrasco García, 2005). The most reliable results for predicting agglomeration behavior could be achieved using lab-scale fluidized bed reactors able to perform controlled agglomeration of the bed material (Ergudenler and Ghaly, 1993; Natarajan et al., 1998; Gatternig et al., 2009), albeit at a high cost of material and time.
A lot of research is also dedicated toward detection of agglomeration during the operation of a boiler. These online methods allow plant operators to react to harmful effects at an early stage, and to adapt operational parameters accordingly. Thorough investigations on these methods were published by Bartels et al. (2008, 2009a,b, 2010).
A very promising alternative is the simulation of chemical reactions and phase changes using thermochemical equilibrium calculations. The continued increase in computational performance made it possible to simulate multicomponent-multiphase equilibria with a large number of participating species within timeframes in the magnitude of minutes. The quality of such predictions is strongly dependent on the thermodynamic data and algorithms applied. A comprehensive review on this topic was published by Lindberg et al. (2013).
Empirically determined indices that are derived from the ash composition (Seggiani, 1999; Visser et al., 2004) or mathematical descriptions of the phenomenon in the form of prediction models could also be a favorable alternative for boiler designers and plant operators facing possible agglomeration issues.
The most promising method for the investigation of agglomeration behavior is controlled agglomeration tests conducted on lab scale fluidized bed reactors. These are usually of small dimensions (around 100 mm bed diameter), ensuring fast, and flexible test runs. Additionally, wide ranges of particle sizes and fluidization velocities are achievable. Electrical heating or gas burners ensure stable, controllable temperatures while different biomass fuels are combusted. A collection of such reactors is given in Table 1. The evaluation of the results is commonly performed by one of three main procedures:
• off-line analysis (“agglomeration extent”)
• defluidization time
• agglomeration temperature.

Table 1. List of lab scale reactors used for controlled agglomeration tests.
In the first, biomass is combusted for a certain amount of time under given operational parameters and the resulting bed ash is inspected for agglomerates. This can happen visually, by sieving, or by SEM analyses. The findings are described and the overall behavior is categorized in discrete levels of severity (Olofsson et al., 2002; Lin and Wey, 2004). Naturally, such classifications are subjective to some degree, which impacts reproducibility and applicability of the results.
This criticism is answered by the two latter procedures, as they measure a continuous physical property. In defluidization time experiments fuel is fed (at a constant set of process parameters) until the fluidized bed collapses because of agglomeration. This can easily be detected by observation of the pressure drop across the bed, or abrupt changes of the bed-temperature distribution. The time from the start of fuel feeding until the bed collapse is finally reported as “defluidization time” (Van der Drift and Olsen, 1999; Scala et al., 2000; Lin et al., 2003; Lin and Wey, 2004; Scala and Chirone, 2008; Chaivatamaset et al., 2011; Yu et al., 2011). Variations of the bed temperature or other process parameters give results that plant operators can use as an indication of safe operating conditions for a given fuel. One obstacle to its direct application in large scale furnaces, however, is the lack of continuous bed renewal usually performed in commercial boilers. A constant increase of ash content in the bed does not depict real operating conditions, where a balance of (fuel) ash addition and bed ash removal determines a constant ash concentration.
These considerations lead to the development of the third procedure (“agglomeration temperature”), consisting of a two-stage process. In the first part of the experiment, fuel is combusted at temperatures that insure agglomeration-free operation (700°C or lower). Once a certain amount of ash has accumulated within the bed, fuel feeding is stopped and the bed is heated electrically until agglomeration is registered. The according temperature defines the upper operation limit of a bed containing the given ash concentration of the analyzed fuel (Nordin et al., 1995; Öhman and Nordin, 1998; Visser et al., 2008). The influence of process parameters such as particle size or fluidization velocity can be determined in separate test runs while keeping their settings constant through both stages. For the determination of the onset of agglomeration, online detection methods as described by Bartels are applied. Öhman and Nordin (1998) reported a reproducibility of ±5°C and precision of ±30°C for this procedure. Table S4 in Supplementary Material presents published results of defluidization times, while Tables S2 and S3 in Supplementary Material list published results for the third type of test.
The experiments reported so far offer only very narrow range of different operational parameters, focusing instead on different fuel types. An estimation of the impact of operational parameters such as bed particle size, bed ash concentration, or fluidization velocity on agglomeration tendencies can thus not easily be deduced. Also, the magnitude of these effects in comparison with the influence of different ash composition is not clear. For plant designers, it would, however, be valuable information whether were it possible to adjust to the agglomeration characteristics of new fuels by adapting operational parameters. In addition, a better coverage of parameter influences would facilitate the development – and consequent validation – of prediction models for the determination of agglomeration behavior.
Aim of the Experimental Investigation
The experimental investigations are therefore set to serve three main purposes: first, to generate an exhaustive dataset for the validation of the newly developed models (to be presented in our upcoming publications). Second, to investigate some of the open questions in the published agglomeration mechanisms and finally to study the influence of the operational parameters bed ash concentration, fluidization velocity, and particle size on the extent of agglomerations. This resulted in the following profile of specifications for the reactor:
• Fast and highly automated operation in order to achieve a sufficiently large number of data points
• Flexible design to allow testing of different fuels with different bed materials (types as well as particle sizes) under a wide range of operational parameters
• Dependable and reproducible (possibly redundant) detection of agglomeration
• Easy adaptability for special purpose investigations
• Online sampling of bed material or agglomerates.
The study of existing lab scale agglomeration reactors revealed measurements of the agglomeration temperature to be the preferable method. Investigations on agglomeration extent return only rough (subjective) classifications, unable to validate modeling results. The concept of defluidization time fails to separate the parameters bed ash concentration and coating formation (or sintering) time. Plant operators can influence the former (by adapting bed renewal rates), but not the latter, so a combined value of both is not helpful. The set of parameters returned by agglomeration temperature tests, i.e., the highest agglomeration-free operating temperature, fluidization velocity, bed ash concentration, and bed particle size are all accessible.
Materials
Design and Construction of the Lab-Scale Reactor for Agglomeration Prediction and In situ Detection of Sintering
The first two specifications, fast and flexible were translated into small build size. Small means short-heat-up times and quick bed ash accumulation. The lower limit was imposed by the size of the fuel particles and possible wall effects in the fluidized bed. The demand of a high number of data points eventually lead to the construction of two reactors, allowing a parallel processing of the test matrix. This additionally delivered some degree of reactor independence in the results by incorporating different bed geometries (see Table 2). Finally, owing to its larger dimensions, the L.A.P.I.S. 2 reactor is able to handle larger fuel size fractions, thus, expanding the possible range of tested fuels.
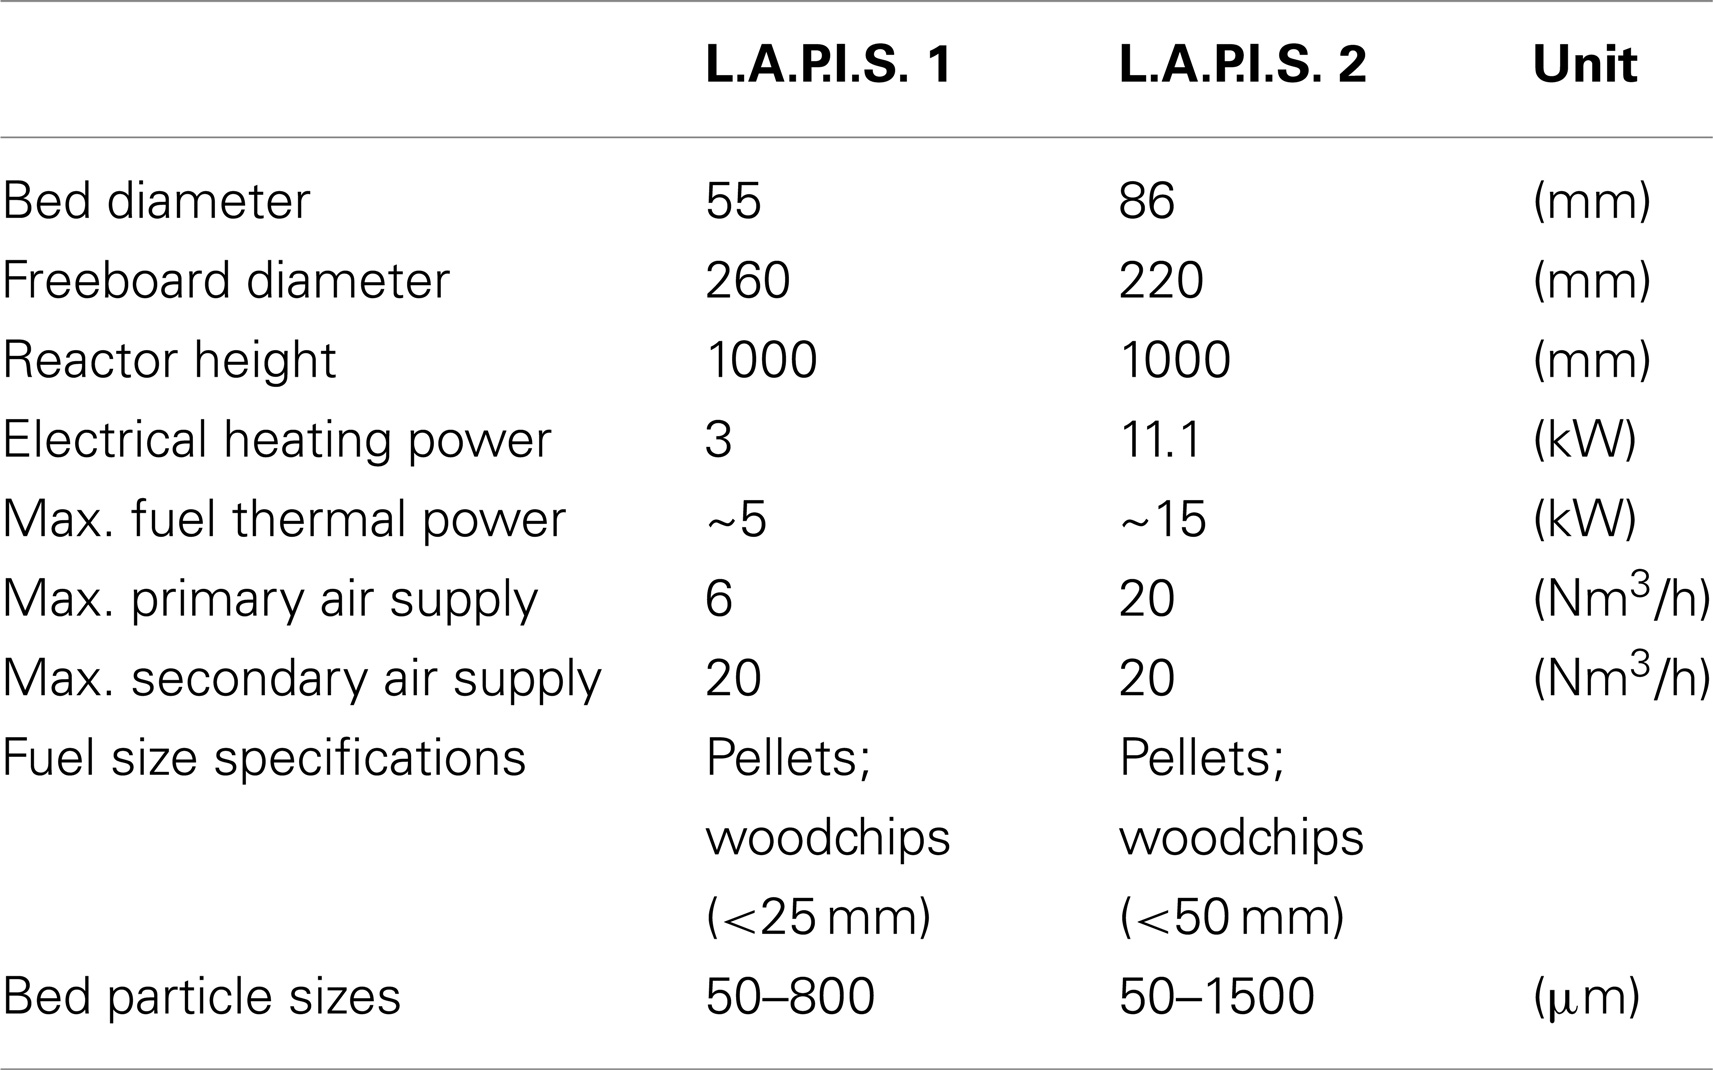
Table 2. Properties of the L.A.P.I.S. reactors.
As mentioned, the primary air is pre-heated in an annular orifice around the actual fluidized bed reactor tube. This was implemented in order to avoid effects of temperature gradients within the bed because of cold air injection. The small dimensions of the reactors would exaggerate this problem, leading to results that would have been very design specific. Another advantage of this concept is the lowering of the wall temperatures compared to direct radiative heat transfer from the electric oven. This would present hot surfaces – not found in large scale plants – that could accelerate ash melting effects. A schematic of this layout is given in Figure 1.
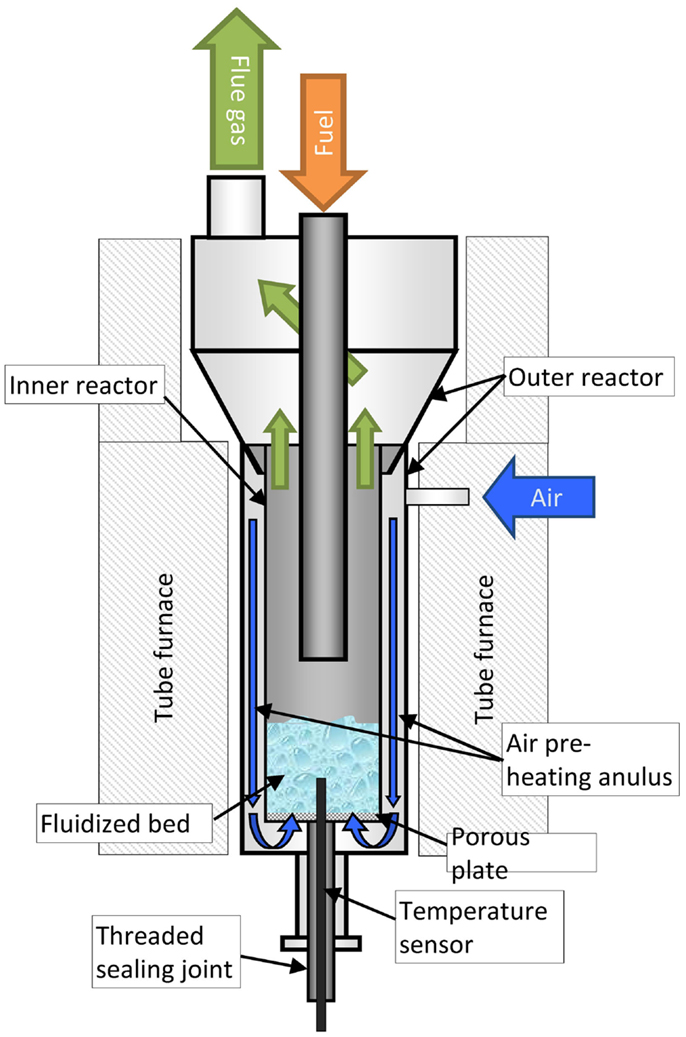
Figure 1. Internal structure of the L.A.P.I.S. showing the electrical heating, outer and inner reactor walls. Primary air is pre-heated in the annulus between inner and outer reactor.
The inner reactor tube was constructed to be removable for both reactors. This has proven to be valuable for the removal of totally defluidized and heavily sintered bed material in between tests. The sealing of the connection between inner and outer reactor was realized with high-temperature (mica) gaskets. The necessary sealing force was applied through a bayonet-type lock at the top and a threaded connection at the bottom of the inner reactor on Lapis 1 and Lapis 2, respectively.
In order to investigate the progress of coating formation, the L.A.P.I.S. 2 reactor can be opened during operation for online-sampling of bed material. This was realized through a fuel feeder assembly that can be elevated and rotated. The connection to the main reactor was designed as a contact free seal similar to labyrinth types. The bottom plate fixed on top of the freeboard and the upper plate as part of the fuel feed assembly slide into each other and provide an elevated pressure loss due to the closely contacting surfaces. Sealing air injection through the middle rim enhances this effect.
The final assembly of the reactors is shown in Figure 2 (actual image). The basic design is very similar with the main differences being the larger dimensions and removable fuel feeder of Lapis 2. The control elements are also labeled in the pictures with the touch-panel being the main interaction point for the user.
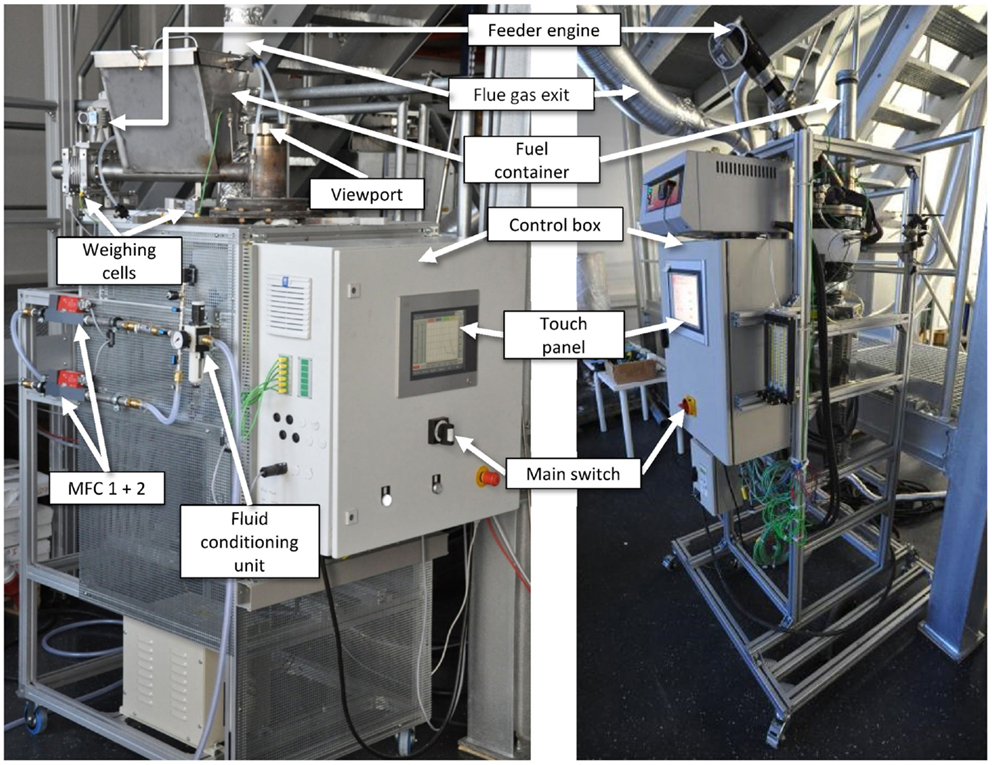
Figure 2. L.A.P.I.S. reactors in operational condition (V2 on the left, V1 on the right).
The fuels that were tested for agglomeration tendencies are commercially available for either heating purposes (wood pellets), for small animal bedding (corn, hay, hemp, and wheatstraw), or for BBQ-smoking applications (alder, beech, birch, hickory, maple, mesquite, and robinia). The two types of short-rotation coppice were collected directly from the producer in western Styria (region Bärnbach). All fuels were characterized through proximate analyses and ultimate analyses of their ash components by different labs – as stated in Table 3 – in order to reduce the bias of lab testing. Samples of dried distillers grains with solubles (DDGS), rapeseed, vinyard prunings, wastewood, and wheatstraw were provided for testing from the AshMelt project along with corresponding fuel analyses.
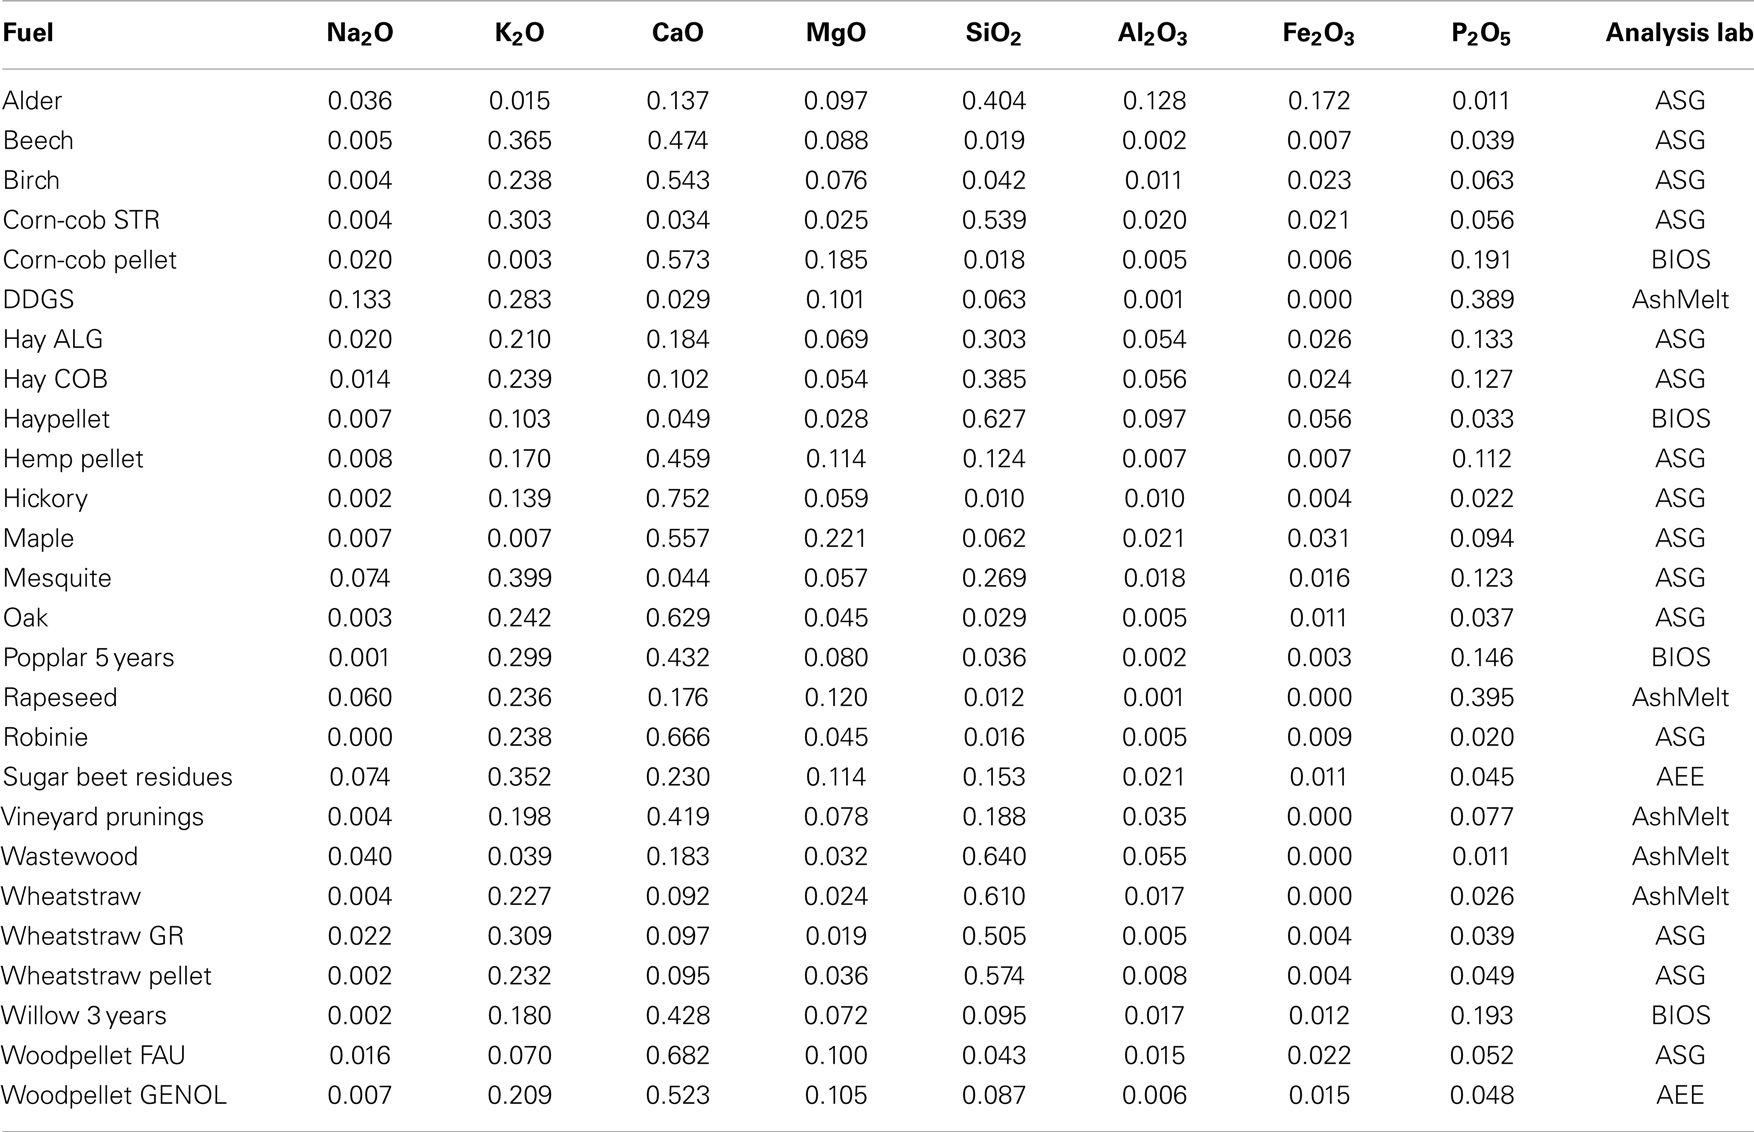
Table 3. Composition of the tested biomass ashes (kg/kgash).
The physical shape of the fuels ranged from pellets of ~5 mm × 30 mm to 15 mm × 50 mm, to wood chips of 10 mm up to 50 mm edge length. Larger fractions were treated in cutting mills until the desired size was reached. All resulting size fractions were fed into the reactor (i.e., no sieving of fines was performed).
The bed material used for the bulk of the experiments was quartz sand retrieved from Quarzwerke Gruppe GmbH (Amberger Kaolinwerke), composed of a minimum of 97% of SiO2 (the remainder being mostly composed of feldspar). The composition of the tested alternative bed materials is given in Table 4. Particle sizes of all bed materials are stated for the individual test runs in the Supplementary Material (Tables S2 and S3 in Supplementary Material) as Sauter mean diameter.
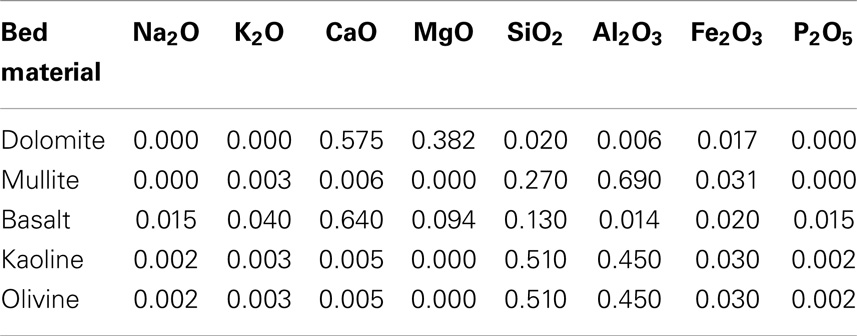
Table 4. Composition of tested alternative bed materials (kg/kg).
Procedure of Agglomeration Test Runs (Methods)
The agglomeration temperature was determined using a three-part sequence as displayed in Figure 3. An initial mass of 150–300 g (depending on the fuel’s ash content) was inserted into the furnace. Then the reactor was electrically heated to 550°C, followed by a fuel feed and combustion period until the desired ash concentration (Xa) in the bed was achieved. During this period, the bed temperature was kept close to 550°C through adaptation of the excess air ratio (λ ≫ 1). Finally, the fuel supply was stopped and the fluidized bed was heated in steps of 25 K using the tube furnace until agglomeration was detected by the pressure variance method [published by Scala and Chirone (2006)] and confirmed by visual inspection. Upon cooling of the reactor, the bed, and fly ash were weighed to determine the mass gain and consequently the ash concentration of the bed. This was backed up by analysis of the phosphorous content of the bed as tracer for the ash concentration performed for one fifth of the total runs. Agreement to gravimetrically determined bed ash concentrations was good and revealed a constant 70% of the supplied fuel ash to be captured in the bed. The choice of phosphorous as tracer was based on findings of Obernberger et al. (1997) and Valmari et al. (1999), who determined Ca, Mg, and P to be the elements with the lowest evaporation and elutriation rates. Calcium and magnesium were disregarded as tracers, since they make up the major fraction of some of the alternative bed materials to be tested (e.g., lime or olivin).
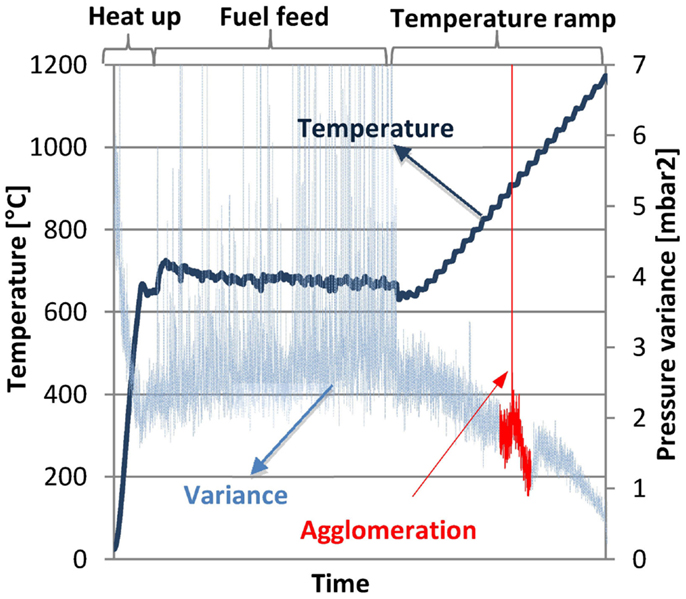
Figure 3. Data-log of an agglomeration experiment showing the three phases of heat-up, ash accumulation (fuel feed), and step-wise temperature increase to induce agglomeration. Detection of defluidisation is based on evaluation of pressure variance as described by Scala and Chirone (2006).
The primary goal of the experiments was to determine agglomeration temperatures for a large number of fuels under a wide range of the three process parameters particle size, ash content, and fluidization velocity. A total of 26 fuels could be acquired for this purpose; their ash compositions are listed in Table 3. In order to even out the possible influence of the analysis lab, the fuels were tested in four different institutes as stated in the table.
The selection of values for the process parameters was performed using “design of experiment” (DoE) techniques as defined by Fisher (1971). This allowed me to reduce the amount of experiments while still retaining good information on the effect of parameter changes. Assuming non-linearity in the parameter influences, I chose to investigate 10 levels for each parameter (these are called “factors” in DoE). With the four relevant factors (10 levels for ds, Xa, and u/u0, plus 26 ash compositions), this would result in 26 × 310 = 1.535.274 test runs for all possible combinations. An optimized response surface model [a DoE model capable of representing non-linear factor influences; for details refer to Siebertz et al. (2010) or Fisher (1971)] was able to reduce this number to the 156 runs represented in Table S2 in Supplementary Material. The setup and evaluation of the experimental design were performed in “Design Expert v8”1, a software package commonly applied for DoE. The criteria and settings chosen for my setup are listed in Table 5.
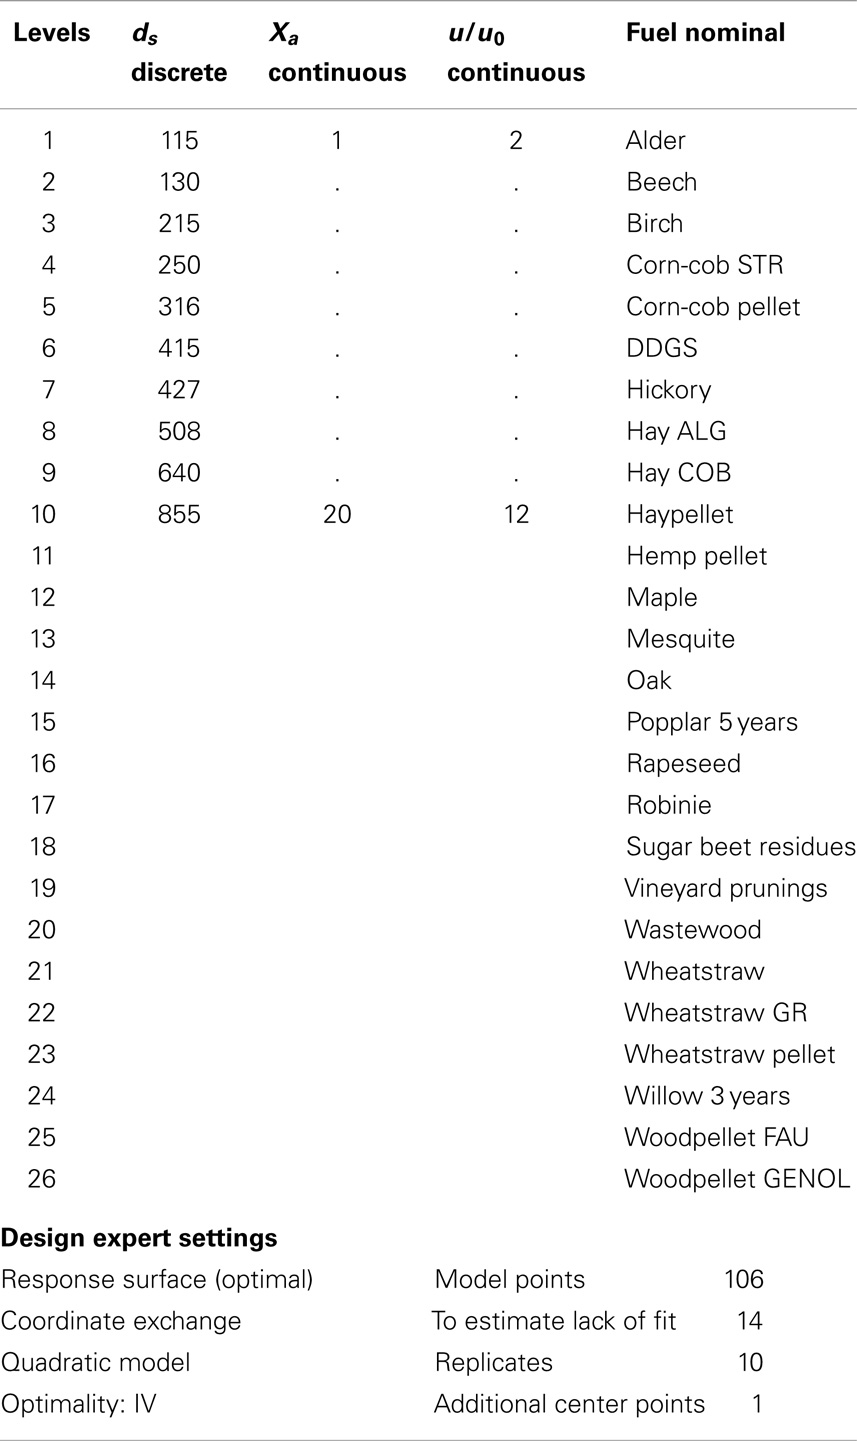
Table 5. Criteria for experimental design and applied settings for DesignExpert v.8.
Results
A preliminary set of experiments was performed to determine the influence of reactor-specific operational parameters on the resulting agglomeration temperatures that could impede the transferability of the results. The reference fuel used in the whole set was sugar beet residue (for composition see Table 3), the bed material was quartz sand with a Sauter mean diameter of 270 μm. Parameters to be investigated were the excess air through lambda, the combustion temperature, and the gradient of the temperature ramp. The range of these parameters is given in Table 6, the results can be seen in Figure 4. The operational parameter “u/u0” was added to the experiments in order to determine the relative impact of the internal parameters.
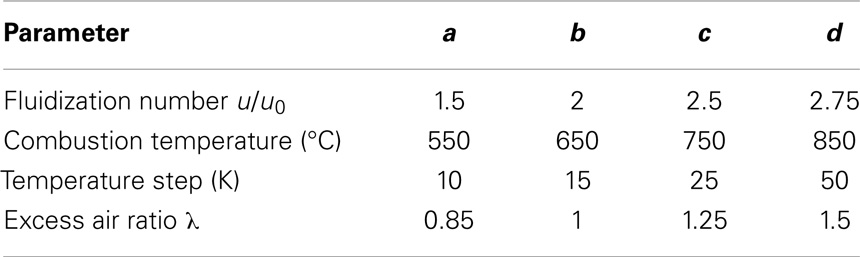
Table 6. Parameters investigated for sensitivity analysis.
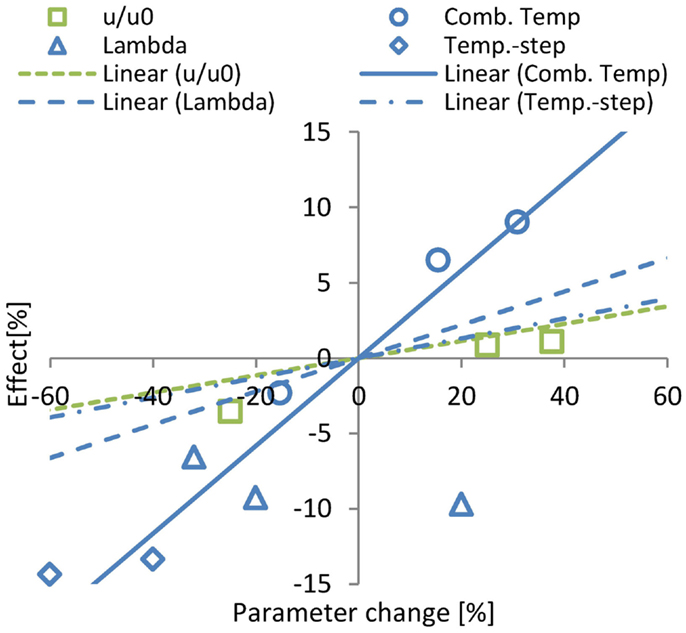
Figure 4. Result of operating parameter sensitivity analysis showing the effect of internal parameters on agglomeration temperature. u/u0 = fluidization velocity; Comb.Temp, combustion temperature during the fuel feed phase; Lambda, excess air ratio; Temp.step, gradient of the temperature ramp;
The most influential reactor relevant value was determined to be the combustion temperature. Higher combustion temperatures produce higher agglomeration temperatures. This is in agreement with findings published by Gilbe et al. (2008), showing higher ash melting temperatures, resulting from the vaporization of specific ash components (mostly alkali metals) at higher ashing temperatures. In accordance to the regulations for ash fusion temperatures, a value of 550°C during combustion was adopted. The effect of the excess air ratio – in the investigated range – is negligible, permitting us to control combustion temperature through this parameter without affecting the results. The final parameter (temperature step) showed a smaller influence than the combustion temperature but still comparable to the influence of u/u0. The steeper temperature ramp, resulting in an increase of this parameter also affects residence times, which could explain the shift toward higher agglomeration temperatures. Consequently, this parameter was kept at a moderate value of 25 K with holding times of 300 s for the rest of the experiments.
Finally, the reproducibility between runs and between reactors was tested. For the former, seven runs with hemp pellets, quartz sand of 640 μm, Xa of 10%, and u/u0 of five were performed. The runs resulted in a mean agglomeration temperature of 857°C and a SD between runs of only 5°C. To compare Lapis 1 and 2, three runs on each reactor were performed with corn-cob granules, ds = 508μm, Xa = 5%, u/u0 = 3.8, returning 839°C as mean and only 1°C as SD of the agglomeration temperature. With these values, the results from both reactors can confidently be compared and used in the subsequent modeling.
In order to validate the DoE evaluation, a series of experiments were performed to directly identify the parameter influence. In these runs, one parameter was changed ±70% from a reference point, while the fuel and the remaining two parameters were kept constant. The parameters Xa and u/u0 were tested with hemp pellets, and ds with mesquite. The process parameters (Figure 5, right-hand side) behaved as expected, with higher ash contents causing lower agglomeration temperatures while particle size and fluidization velocity elevate these temperatures when increased.
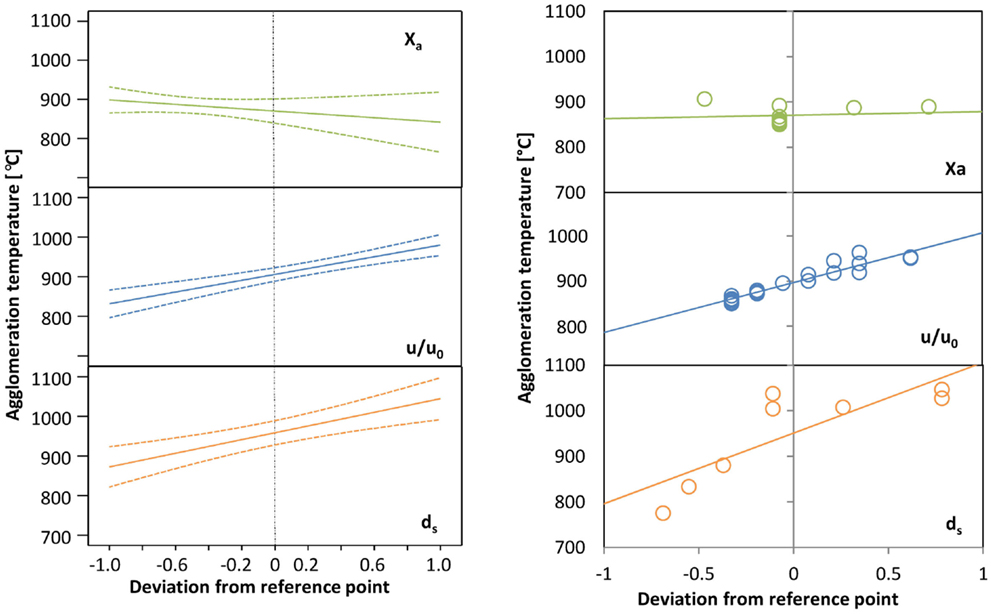
Figure 5. Comparison of DoE evaluation of the whole test matrix (left) and independent test runs (right). Solid line represents a linear trendline, dotted lines show the DoE confidence intervals. Reference points equal: Xa case: ds = 640 μm; Xa = 5.8%; u/u0 = 5; u/u0 case: ds = 640 μm; Xa = 5%; u/u0 = 7.4; ds case: ds = 480 μm; Xa = 5%; u/u0 = 3.
A variation of the parameters from the same reference points was consequentially performed in DesignExpert. Figure 5 demonstrates a very good agreement between both methods, reinforcing the value of the DoE approach. Only the Xa value is slightly inconclusive (albeit still within the error margins of the DoE plot), this could have been caused by a high-reference point, resulting in saturation effects. Lower ash amounts might produce a more distinct shape of the plot.
The results of all test runs are reported in Table S2 in Supplementary Material. A statistical analysis returned a reproduction error of 19 K (deduced from the performed replicate tests) for the experimental procedure. The signal-to-noise ratio (termed “adeq. precision” in DesignExpert) equals 15.6, which is sufficiently high for discerning parameter effects from random errors. Furthermore, the experimental design shows good orthogonality with variance inflation factors below a value of 2.4 for all factors. Outlier detection was performed with DFFITS and Cook’s distance methods – for details see Siebertz et al. (2010) – and revealed no critical points. The most extreme values – though still far below critical thresholds – were returned by the test runs with robinia and wheatstraw pellets. Their results have been double checked subsequently, making sure that no mistakes have been made in the experimental procedure.
The influence of individual fuels on agglomeration tendencies is given in Figure 6. In order to compare them directly, the process parameters were set to constant values (of ds = 400 μm; Xa = 0.06 kg/kg; u/u0 = 5) and the according agglomeration temperatures were interpolated in DesignExpert. The resulting error margins of this interpolation are displayed in Figure 6 as blue bars. They amount to 32 K on average, which is in good agreement with prediction errors reported by Öhman and Nordin (1998) for direct measurements and only slightly above the reproduction error of our experimental procedure (i.e., 19 K).
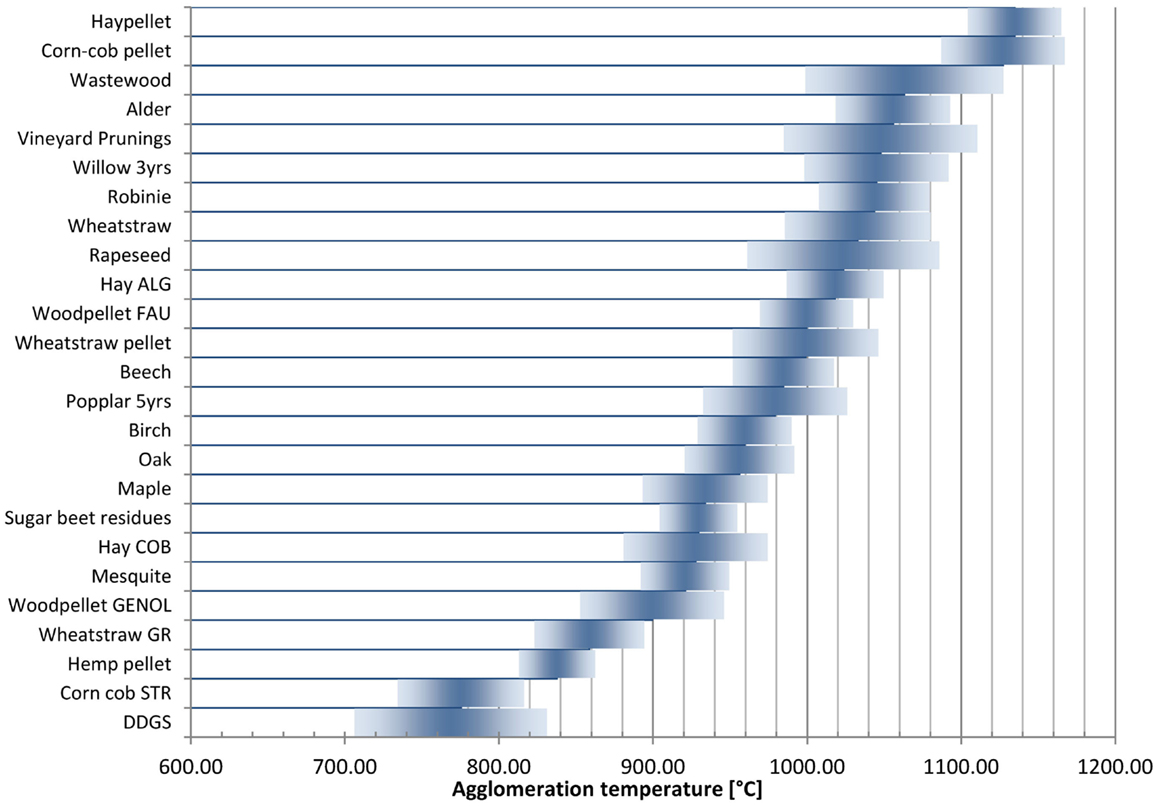
Figure 6. DoE evaluation of experimental results with error bars in blue (Fuel type influence at ds = 400 μm; Xa = 0.06 kg/kg; u/u0 = 5).
The interpolation function of DesignExpert also allows us to compare the results generated on the Lapis reactors with agglomeration temperatures published by other authors. Figure 7 illustrates this comparison for different fuel classes. In order to display different fuel species in these diagrams, the abscissa is calculated from the ratio of specific ash components:
The ratio was determined to return the best correlation with agglomeration temperatures. Negative and positive correlations were attributed to the numerator and denominator, respectively, or removed if their effect on the R2 value (between x and tagglo) was negligible (as in the case of MgO).
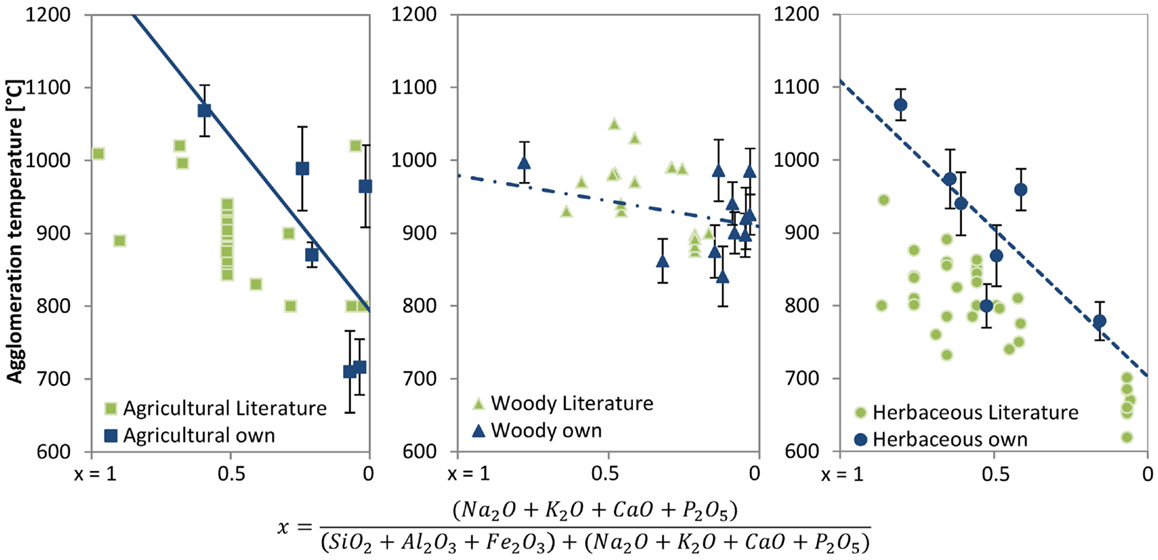
Figure 7. Comparison of our own (interpolated to ds = 225 μm; Xa = 0.1 kg/kg; u/u0 = 4) results with original test runs published in literature (as listed in Table S2 in Supplementary Material).
During the experimental campaign, I have encountered four distinct types of agglomerates as pictured in Figure 9:
• Fuel particle shaped
• Refluidizable oligo-grains
• Completely sintered bed (poly grain)
• Fused, glassy structure.
The first type is closely connected to melt induced agglomeration (but not exclusively so). Bed particles adhere to the burning fuel typically at significant excess temperatures over the bed. Once the combustion reaction is complete, these temperatures decline and cause the liquid bridges to solidify, thereby conserving the original shape of the fuel particle. Hollow structures and char remains are often found in such agglomerates. If bed temperatures are increased after agglomerate formation of this type, structures as shown in Figure 9D can be formed due to further reaction of the remaining char.
Figure 9B shows results from coating induced agglomeration. In this case, few (2.10) bed material grains form clusters that increase the effective particle size and thus lead to defluidization at a given gas velocity. If bed temperatures remain constant, these oligo-grains are refluidizable by increasing the gas flow. Otherwise, the closely contacting coated particles will go through a sintering process, resulting in large agglomerates as depicted in Figure 9C.
Discussion
Among the tested fuels, corn-cob pellet and haypellets produced the best (highest) results, followed by woody types of wastewood, willow, and alder (see Figure 6). Nominally, the top two fuels, as part of the herbaceous class, would be expected to result in lower agglomeration temperatures. A closer look at their ash composition, however, reveals elevated values of SiO2, Al2O3, or Fe2O3, indicating contamination of the fuel with soil during the harvest. A comparison of their ash composition with other samples of according fuel species confirms this observation, as seen in Figure 8. The lowest agglomeration temperatures were produced by another batch of corn cobs and DDGS, followed by hemp and wheat straw. These are more in line with commonly accepted expectations and published reports (Skrifvars et al., 1998; Van der Drift and Olsen, 1999; Brus et al., 2005; De Geyter et al., 2007; Grimm et al., 2011).
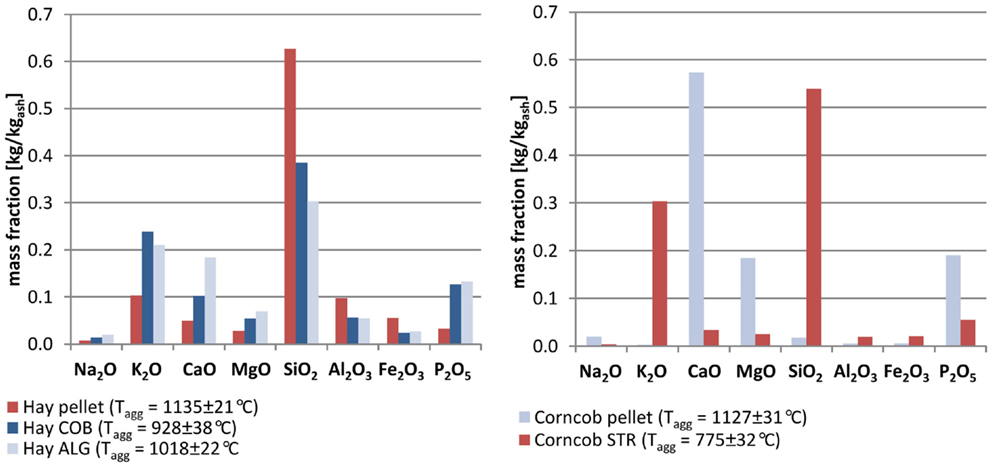
Figure 8. Differences in ash composition within fuel species (left: hay; right: corn-cobs) and their effect on agglomeration temperatures.
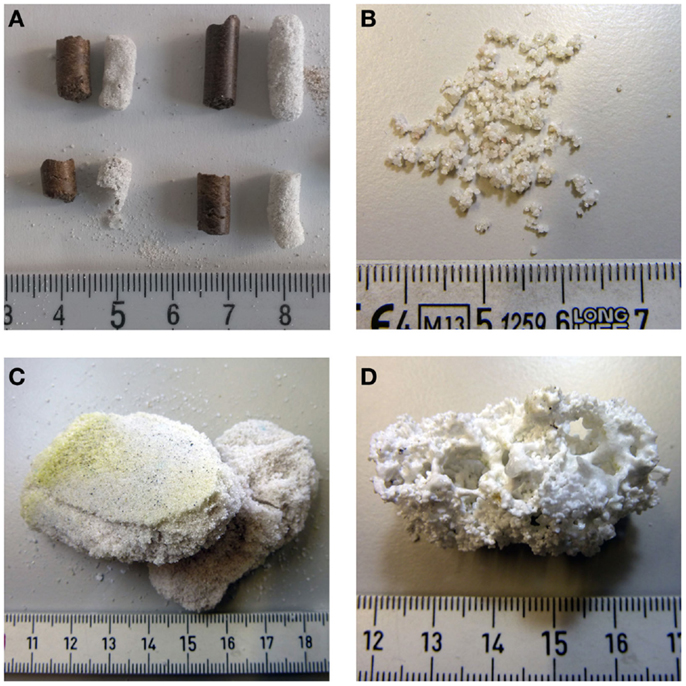
Figure 9. Four types of agglomerates as observed in our experiments: (A) fuel particle shape; (B) oligo-grain; (C) complete sintering; (D) fused structure.
The influence of operational parameters as depicted in Figure 5 (left) can be ranked from high to low as ds > u/u0 > Xa, with the two former showing positive and the latter showing a negative correlation with agglomeration temperature. The bed ash concentration exhibits a pronounced saturation effect, showing great influence in the range of Xa = 0.6% and only negligible effect above this value. This coincides well with findings by Öhman and Nordin (1998), who detected a large influence of Xa between 3 and 6% in his experiments. In his study, the influence of ds is only minor and that of u/u0 non-existent. This discrepancy to our results can be explained by a very narrow parameter range of ds = 180.300 μm and u/u0 = 3.5 in the experiments by Öhman. A comparison of the total extent of parameter influence (~100 K for u/u0 and ~200 K for ds) and fuel influence (~300 K for all classes) in my experiments indicates that adjustments of the former might not be sufficient for retaining high-combustion temperatures with agglomeration-critical fuels. Batch quality variations within one fuel type (e.g., 100 K for woodpellets), on the other hand, could be manageable. One has to keep in mind, however, in what way these changes affect fluid dynamics in other parts of the boiler, e.g., heat exchangers or particle separators.
The comparison of our experiments with published results of other authors (Figure 8) shows good agreement between the woody biomass and agricultural residue classes, while the results for our herbaceous fuels are slightly elevated. This observation revealed a flaw in our experimental design. As can be seen in Table 7, our experiments with herbaceous fuels were performed with very large particle sizes and fluidization velocities. As “fuel class” was not a criterion for the determination of the DoE test matrix, herbaceous fuels were randomly assigned with predominantly large particle sizes. Consequently, the interpolation algorithm falsely attributes a part of the increase in agglomeration temperatures to the fuel type instead of the operational parameters. An extension of the test matrix is therefore scheduled to perform the missing experiments with smaller particle sizes.
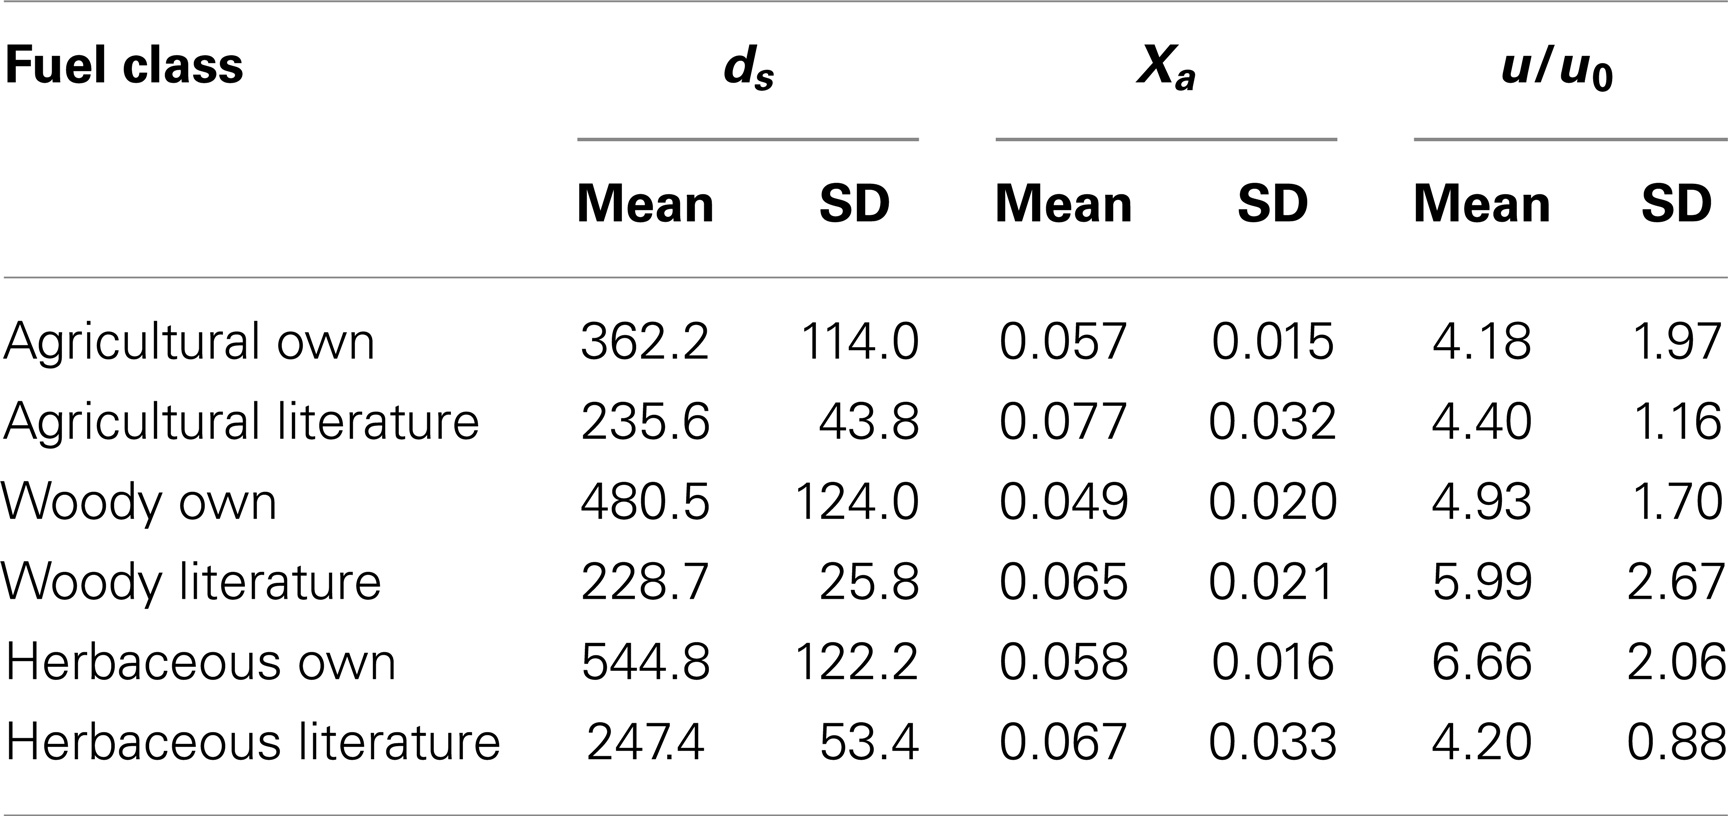
Table 7. Comparison of average operational parameters for different fuel classes.
Conclusion
The knowledge of a fuel’s agglomeration behavior is valuable information for the design of boilers with an extended range of applicable fuels. Experimental determination of this behavior in lab scale fluidized bed reactors proved to be a reliable measure to obtain such information. Previous publications provided results for agglomeration extent, defluidization time, and agglomeration temperatures. The latter is best suited for direct integration in the boiler design process. Consequently, this methodology was adopted for a new campaign to test the agglomeration behavior of several fuels under a wide range of operational parameters. To this end, two lab-scale reactors suited for agglomeration temperature determination were designed and constructed at the Chair for Energy Process Engineering. The measurement campaign comprises 156 test runs of 26 different fuels under different sets of the operational parameters “bed particle size,” “fluidization velocity,” and “bed ash concentration.” The results revealed reasonable trends for different fuel classes (e.g., woody types to be better suited for high-combustion temperatures) and operational parameters (particle size and gas velocity increase applicable combustion temperatures, while bed ash concentration has an inverse effect). The type of fuel with its specific ash composition had a much higher influence on agglomeration temperatures than the selected process parameters. A comparison with results published in literature revealed a tendency of the applied DoE interpolation to over-rate the agglomeration behavior of herbaceous fuels. More experiments will therefore be performed to enhance the data set for the combination of this fuel class with small particle sizes and low-fluidization velocities.
The final data set of the obtained results will serve as basis for an attempt at modeling the agglomeration behavior based on process parameters and ash compositions that will be published in the near future.
Conflict of Interest Statement
The authors declare that the research was conducted in the absence of any commercial or financial relationships that could be construed as a potential conflict of interest.
Acknowledgments
We acknowledge support by Deutsche Forschungsgemeinschaft and Friedrich-Alexander-Universität Erlangen-Nürnberg (FAU) within the funding program Open Access Publishing.
Supplementary Material
The Supplementary Material for this article can be found online at http://www.frontiersin.org/Journal/10.3389/fenrg.2014.00051/abstract
Abbreviations
λ, excess air ratio [−]; BFB, bubbling fluidized bed; DDGS, dried distillers grains with solubles; DoE, design of experiment; ds, sauter mean diameter of bed particles (μm); FT, flow temperature; HT, hemispherical temperature; IDT, initial deformation; L.A.P.I.S., lab-scale reactor for agglomeration prediction and in situ detection of sintering; PCA, principal component analysis; PFBC, pressurized fluidized bed combustion; SEM, scanning electron microscope; ST, softening temperature; u, actual fluidization velocity (m/s); u0, minimum fluidization velocity (m/s); Xa, bed ash accumulation (kgash/kgbed).
Footnote
- ^Design Expert (version v8.0). MS Windows 7. Stat-Ease Inc. Available at: http://www.statease.com/software.html
References
Bartels, M., Lin, W., Nijenhuis, J., Kapteijn, F., and van Ommen, J. R. (2008). Agglomeration in fluidized beds at high temperatures: mechanisms, detection and prevention. Prog. Energy Combust. Sci. 34, 633–666. doi: 10.1016/j.pecs.2008.04.002
Bartels, M., Nijenhuis, J., Kapteijn, F., and van Ommen, J. R. (2010). Case studies for selective agglomeration detection in fluidized beds: application of a new screening methodology. Powder Technol. 203, 148–166. doi:10.1016/j.powtec.2010.05.003
Bartels, M., Nijenhuis, J., Lensselink, J., Siedlecki, M., de Jong, W., Kapteijn, F., et al. (2009a). Detecting and counteracting agglomeration in fluidized bed biomass combustion. Energy Fuels 23, 157–169. doi:10.1021/ef8005788
Bartels, M., Vermeer, B., Verheijen, P. J. T., Nijenhuis, J., Kapteijn, F., and van Ommen, J. R. (2009b). Methodology for the screening of signal analysis methods for selective detection of hydrodynamic changes in fluidized bed systems. Ind. Eng. Chem. Res. 48, 3158–3166. doi:10.1021/ie8012105
Brus, E., Öhman, M., and Nordin, A. (2005). Mechanisms of bed agglomeration during fluidized-bed combustion of biomass fuels. Energy Fuels 19, 825–832. doi:10.1021/ef0400868
Chaivatamaset, P., Sricharoon, P., and Tia, S. (2011). Bed agglomeration characteristics of palm shell and corncob combustion in fluidized bed. Appl. Therm. Eng. 31, 2916–2927. doi:10.1016/j.applthermaleng.2011.05.021
Chirone, R., Miccio, F., and Scala, F. (2006). Mechanism and prediction of bed agglomeration during fluidized bed combustion of a biomass fuel: effect of the reactor scale. Chem. Eng. J. 123, 71–80. doi:10.1016/j.cej.2006.07.004
De Geyter, S., Öhman, M., Boström, D., Eriksson, M., and Nordin, A. (2007). Effects of non-quartz minerals in natural bed sand on agglomeration characteristics during fluidized bed combustion of biomass fuels. Energy Fuels 21, 2663–2668. doi:10.1021/ef070162h
Ergudenler, A., and Ghaly, A. E. (1993). Agglomeration of alumina sand in a fluidized bed straw gasifier at elevated temperatures. Bioresour. Technol. 43, 259–268. doi:10.1016/0960-8524(93)90039-E
Fernández Llorente, M. J., and Carrasco García, J. E. (2005). Comparing methods for predicting the sintering of biomass ash in combustion. Fuel 84, 1893–1900. doi:10.1016/j.fuel.2005.04.010
Gatternig, B., Hohenwarter, U., and Karl, J. (2009). Development of Ash Induced Coatings on Bed Material Particles in Biomass Fired Fluidized Bed Combustion. Hamburg: ETA-Florence Renewable Energies.
Gilbe, C., Lindström, E., Backman, R., Samuelsson, R., Burvall, J., and Ohman, M. (2008). Predicting slagging tendencies for biomass pellets fired in residential appliances: a comparison of different prediction methods. Energy Fuels 22, 3680–3686. doi:10.1021/ef800321h
Grimm, A., Skoglund, N., Boström, D., and Öhman, M. (2011). Bed agglomeration characteristics in fluidized quartz bed combustion of phosphorus-rich biomass fuels. Energy Fuels 25, 937–947. doi:10.1021/ef101451e
Pubmed Abstract | Pubmed Full Text | CrossRef Full Text | Google Scholar
Hansen, L. A., Frandsen, F. J., Dam-Johansen, K., and Sørensen, H. S. (1999). Quantification of fusion in ashes from solid fuel combustion. Thermochim. Acta 326, 105–117. doi:10.1016/S0040-6031(98)00596-6
Khan, A. A., de Jong, W., Jansens, P. J., and Spliethoff, H. (2009). Biomass combustion in fluidized bed boilers: potential problems and remedies. Fuel Proc. Technol. 90, 21–50. doi:10.1016/j.fuproc.2008.07.012
Latva-Somppi, J., Kauppinen, E. I., Valmari, T., Ahonen, P., Gurav, A. S., Kodas, T. T., et al. (1998). The ash formation during co-combustion of wood and sludge in industrial fluidized bed boilers. Fuel Proc. Technol. 54, 79–94. doi:10.1016/S0378-3820(97)00061-1
Lin, C.-L., and Wey, M.-Y. (2004). The effect of mineral compositions of waste and operating conditions on particle agglomeration/defluidization during incineration. Fuel 83, 2335–2343. doi:10.1016/j.fuel.2004.06.030
Lin, W., Dam-Johansen, K., and Frandsen, F. (2003). Agglomeration in bio-fuel fired fluidized bed combustors. Chem. Eng. J. 96, 171–185. doi:10.1016/j.cej.2003.08.008
Lindberg, D., Backman, R., Chartrand, P., and Hupa, M. (2013). Towards a comprehensive thermodynamic database for ash-forming elements in biomass and waste combustion – current situation and future developments. Fuel Proc. Technol. 105, 129–141. doi:10.1016/j.fuproc.2011.08.008
Natarajan, E., Öhman, M., Gabra, M., Nordin, A., Liliedahl, T., and Rao, A. N. (1998). Experimental determination of bed agglomeration tendencies of some common agricultural residues in fluidized bed combustion and gasification. Biomass Bioenergy 15, 163–169. doi:10.1016/S0961-9534(98)00015-4
Nordin, A., Öhman, M., Skrifvars, B.-J., and Hupa, M. (1995). “Agglomeration and defluidization in FBC of biomass fuels – mechanisms and measures for prevention,” in Proc. 1995 Eng. Found. Ash Conf., Waterville Valley (New York: Springer), 16–22.
Obernberger, I., Biedermann, F., Widmann, W., and Riedl, R. (1997). Concentrations of inorganic elements in biomass fuels and recovery in the different ash fractions. Biomass Bioenergy 12, 211–224. doi:10.1016/S0961-9534(96)00051-7
Öhman, M., and Nordin, A. (1998). A new method for quantification of fluidized bed agglomeration tendencies: a sensitivity analysis. Energy Fuels 12, 90–94. doi:10.1021/ef970049z
Olofsson, G., Ye, Z., Bjerle, I., and Andersson, A. (2002). Bed agglomeration problems in fluidized-bed biomass combustion. Ind. Eng. Chem. Res. 41, 2888–2894. doi:10.1021/ie010274a
Pubmed Abstract | Pubmed Full Text | CrossRef Full Text | Google Scholar
Padban, N., Wang, W., Ye, Z., Bjerle, I., and Odenbrand, I. (2000). Tar formation in pressurized fluidized bed air gasification of woody biomass. Energy Fuels 14, 603–611. doi:10.1021/ef990185z
Scala, F., and Chirone, R. (2006). Characterization and early detection of bed agglomeration during the fluidized bed combustion of olive husk. Energy Fuels 20, 120–132. doi:10.1021/ef050236u
Scala, F., and Chirone, R. (2008). An SEM/EDX study of bed agglomerates formed during fluidized bed combustion of three biomass fuels. Biomass Bioenergy 32, 252–266. doi:10.1016/j.biombioe.2007.09.009
Scala, F., Salatino, P., and Chirone, R. (2000). Fluidized bed combustion of a biomass char (Robinia pseudoacacia). Energy Fuels 14, 781–790. doi:10.1021/ef9901701
Seggiani, M. (1999). Empirical correlations of the ash fusion temperatures and temperature of critical viscosity for coal and biomass ashes. Fuel 78, 1121–1125. doi:10.1016/S0016-2361(99)00031-9
Siebertz, K., van Bebber, D., and Hochkirchen, T. (2010). Statistische Versuchsplanung: Design of Experiments (DoE). Heidelberg: Springer.
Skrifvars, B.-J., Backman, R., and Hupa, M. (1998). Characterization of the sintering tendency of ten biomass ashes in FBC conditions by a laboratory test and by phase equilibrium calculations. Fuel Proc. Technol. 56, 55–67. doi:10.1016/S0378-3820(97)00084-2
Valmari, T., Lind, T. M., Kauppinen, E. I., Sfiris, G., Nilsson, K., and Maenhaut, W. (1999). Field study on ash behavior during circulating fluidized-bed combustion of biomass. 1. Ash formation. Energy Fuels 13, 379–389. doi:10.1021/ef980085d
Van der Drift, A., and Olsen, A. (1999). “Conversion of biomass, prediction and solution methods for ash agglomeration and related problems,” in ECN-Report (Energy Research Centre of the Netherlands) ECN-C, 99–90.
Visser, H. J. M., Kiel, J. H. A., and Veringa, H. J. (2004). The Influence of Fuel Composition on Agglomeration Behaviour in Fluidised-Bed Combustion. Delft: Energy research Centre of the Netherlands ECN.
Visser, H. J. M., van Lith, S. C., and Kiel, J. H. A. (2008). Biomass ash-bed material interactions leading to agglomeration in FBC. J. Energy Resour. Technol. 130, 011801. doi:10.1115/1.2824247
Keywords: fluidized bed combustion, ash agglomeration, high-ash biomass fuels
Citation: Gatternig B and Karl J (2014) The influence of particle size, fluidization velocity, and fuel type on ash-induced agglomeration in biomass combustion. Front. Energy Res. 2:51. doi: 10.3389/fenrg.2014.00051
Received: 15 September 2014; Paper pending published: 11 October 2014;
Accepted: 28 October 2014; Published online: 19 November 2014.
Edited by:
Houzhang Tan, Xi’an Jiaotong University, ChinaReviewed by:
Yanqing Niu, Xi’an Jiaotong University, ChinaQinghai Li, Tsinghua University, China
Maria Carolina Quecine, University of São Paulo, Brazil
Copyright: © 2014 Gatternig and Karl. This is an open-access article distributed under the terms of the Creative Commons Attribution License (CC BY). The use, distribution or reproduction in other forums is permitted, provided the original author(s) or licensor are credited and that the original publication in this journal is cited, in accordance with accepted academic practice. No use, distribution or reproduction is permitted which does not comply with these terms.
*Correspondence: Bernhard Gatternig, Friedrich-Alexander University Erlangen-Nürnberg (FAU), Fuerther Str. 244f, Nuremberg 90429, Germany e-mail: bernhard.gatternig@cbi.uni-erlangen.de