Improving reversible capacities of high-surface lithium insertion materials – the case of amorphous TiO2
 Swapna Ganapathy1
 Shibabrata Basak2
Anton Lefering1
Edith Rogers1
Henny W. Zandbergen2
Shibabrata Basak2
Anton Lefering1
Edith Rogers1
Henny W. Zandbergen2  Marnix Wagemaker1*
- 1Fundamental Aspects of Materials and Energy, Department of Radiation, Radionucleides and Reactors, Faculty of Applied Sciences, Delft University of Technology, Delft, Netherlands
- 2Kavli Institute of Nanoscience, Delft University of Technology, Delft, Netherlands
Chemisorbed water and solvent molecules and their reactivity with components from the electrolyte in high-surface nano-structured electrodes remains a contributing factor toward capacity diminishment on cycling in lithium ion batteries due to the limit in maximum annealing temperature. Here, we report a marked improvement in the capacity retention of amorphous TiO2 by the choice of preparation solvent, control of annealing temperature, and the presence of surface functional groups. Careful heating of the amorphous TiO2 sample prepared in acetone under vacuum lead to complete removal of all molecular solvent and an improved capacity retention of 220 mAh/g over 50 cycles at a C/10 rate. Amorphous TiO2 when prepared in ethanol and heated under vacuum showed an even better capacity retention of 240 mAh/g. From Fourier transform infra-red spectroscopy and electron energy loss spectroscopy measurements, the improved capacity is attributed to the complete removal of ethanol and the presence of very small fractions of residual functional groups coordinated to oxygen-deficient surface titanium sites. These displace the more reactive chemisorbed hydroxyl groups, limiting reaction with components from the electrolyte and possibly enhancing the integrity of the solid electrolyte interface. The present research provides a facile strategy to improve the capacity retention of nano-structured electrode materials.
Introduction
For approximately two decades graphite, allowing Li intercalation between the graphitic sheets, has been the dominant negative electrode for lithium ion batteries. Higher negative electrode capacities can be achieved by processes other than insertion/intercalation reactions including conversion/displacement and extrusion reactions (Poizot et al., 2000; Arico et al., 2005; Larcher et al., 2007; Armand and Tarascon, 2008; Bruce et al., 2008; Li et al., 2009; Scrosati and Garche, 2010; Szczech and Jin, 2011). Although these show much promise, generally the problems of large volume expansion limit the cycle life of these reaction mechanisms (Kasavajjula et al., 2007). The stable insertion reactions in transition metal oxides provide another richly studied alternative for graphite (Deng et al., 2009). One of the promising transition metal oxides is titanium dioxide TiO2, owing its popularity to its low cost, ease of preparation, and its high-theoretical capacity of 335 mAh/g. Working around 1.5 V vs. Li/Li+ within the stability window of typical electrolytes results in inherent safety and stability of titanium oxides albeit with a loss in battery energy density due to the smaller working voltage (Yang et al., 2009; Kyeremateng et al., 2011; Plylahan et al., 2012; Wagemaker and Mulder, 2013). Among the most promising polymorphs are nanoparticles of TiO2-anatase (Sudant et al., 2005; Guo et al., 2007; Ren et al., 2010; Shin et al., 2011), nanowires and nanotubes of TiO2-(B) (Armstrong et al., 2005a; Zukalova et al., 2005), and the amorphous TiO2 (Borghols et al., 2010), but all of them suffer from an irreversible loss of capacity during the first battery cycles and a capacity retention that is lower than the theoretical maximum. This appears to be a drawback of nanosizing, for the irreversible capacity loss observed during the first few battery cycles is largely attributed to degradation of the electrolyte components at the electrode surface due to the presence of residual water or solvents. Recent attempts to diminish this initial capacity loss by using pre-lithiation to displace surface chemisorbed −OH groups by lithium appears to have been successful for TiO2-(B) (Brutti et al., 2012) nanotubes, resulting in a more stable solid electrolyte interface (SEI) and better capacity retention, though applying this treatment on a larger scale may prove more challenging.
Amorphous TiO2 has been shown to possess a first discharge capacity that is about two and a half times higher than the theoretical maximum and a reversible capacity of ~200 mAh/g at slow (dis)charge rates (Borghols et al., 2010). It appears very difficult to remove the surface adsorbed water and solvent molecules in this material as is the case for most high-surface titanium dioxides, whereas these residues are held responsible for the capacity fading observed during battery cycling (Morterra, 1988; Hadjiivanov and Klissurski, 1996; Diebold, 2003). In this study, we show that by the smart choice of preparation solvent and extended annealing at moderate temperatures under vacuum it is possible to (A) completely remove the preparation solvent or (B) to utilize this residual solvent to partially functionalize the surface eliminating some chemisorbed −OH, and creating a more stable SEI thereby improving the capacity retention for amorphous TiO2. This provides a facile strategy to improve capacity retention of nano-structured electrode materials.
Materials and Methods
Sample Preparation
The amorphous titania precursor was prepared by adding deionized water dropwise to a mixture of titanium isopropoxide and anhydrous acetone under stirring conditions in an ice bath (Livage et al., 1988; Sudant et al., 2005). The mixture was washed several times with anhydrous acetone after which it was pre-dried overnight at 50°C. To prepare the nano-crystalline anatase TiO2 samples two heating schemes were used. The first sample hereafter referred to as ana-TiO2-A, was prepared by heating the titania precursor with a heating ramp of room temperature to 250°C of 10 min and was further annealed for 1 h. The second sample was prepared by heating the precursor on a ramp of room temperature to 250°C of 96 h and was allowed to anneal for an additional 24 h after reaching the set temperature. This sample shall be referred to from this point onward as sample ana-TiO2-B. A part of each of these samples was dried further under vacuum at 80°C for a week to obtain vacuum dried anatase TiO2 samples that we shall label ana-TiO2-C and ana-TiO2-D, respectively. The amorphous TiO2 samples were prepared by heating the pre-dried titania precursor in a vacuum tube oven set to 80, 100, and 130°C, respectively, for 4 days for the first sample, 8 days for the second, and 15 days for the third. These samples shall be hereafter referred to as A-TiO2-80, A-TiO2-100, and A-TiO2-130. An additional set of amorphous TiO2 samples was made by using a titania precursor prepared in ethanol described by Borghols et al. (2010). The titania precursor was once again heated as described earlier to three different temperatures under vacuum for the same time duration and the amorphous samples so obtained shall be referred to as E-TiO2-80, E-TiO2-100, and E-TiO2-130.
XRD Measurements
To characterize the nano-crystalline anatase TiO2 samples and to attain an initial estimate of particle sizes and to check whether the amorphous TiO2 samples remained amorphous through the heating, X-ray diffraction measurements were performed (supporting information). A PANalytical X’Pert Pro PW3040/60 diffractometer with Cu Kα radiation operating at 45 kV and 40 mA in an angular 2θ range of 20–70° was utilized.
TEM Measurements
For preparing the TEM samples, the A-TiO2 and E-TiO2 samples were ultrasonicated in acetone or ethanol, respectively, for 30 min before dispersing them on standard TEM Cu-grids. TEM measurements were carried out in a FEI TECNAI microscope operating at 200 kV with a Wien filter monochromator and equipped with an improved high-tension tank and a high-resolution GIF (HR-GIF). Electron energy loss spectroscopy measurements (EELS) measurements were done at a total energy resolution of 0.5 eV, determined by measuring the full width at half maximum of the zero-loss peak and an energy dispersion of 0.2 eV/channel.
Electrochemistry
To test the various TiO2 samples in batteries, electrodes were formulated by mixing each TiO2 preparation with a binder (Kynar Flex) and carbon black (Super P) in a ratio of 70:20:10 by weight along with a solvent (NMP) and the mixture was subsequently cast on carbon coated aluminum foil using a doctor blade. The aluminum foil acted as a current collector. Circular pieces measuring 11 mm in diameter were cut out, compressed and then used in a battery, with lithium metal as the counter and reference electrode. The electrolyte was a 1 M solution of LiPF6 in a EC:DMC (1:1) solvent. Electrochemical (dis)charge tests were performed with a MACCOR 5300 battery cycler.
FTIR Measurements
Diffuse reflectance measurements were carried out in the near to mid infrared between 800 and 8000 cm−1. Measurements were obtained using a Pike Easydiff diffuse reflectance accessory in a Bruker Vertex 80 V Fourier transform infrared spectrometer using a Globar source, KBr beamsplitter, and a Ln-MCT detector (Kolmar Technologies KV 100-1-B7/190). KBr powder was used as a reference material as it is considered to have a good transmittance in this region.
Results and Discussion
Rietveld refinement was performed on the diffraction patterns obtained for the anatase TiO2 samples A–D using GSAS (Larson and Von Dreele, 2004) program, resulting in residuals Rwp of <8%. No major differences were observed between samples ana-TiO2-A and C and samples ana-TiO2-B and D. The observed and refined diffraction patterns for samples ana-TiO2-C and D have been illustrated in Figure 1. The average particle sizes deduced from the line widths of the fitted peaks employing the Scherrer formula were ~6.2 and 9.1 nm, respectively, for ana-TiO2-C and D, respectively. The broad diffraction reflections of the TiO2 materials show that the materials are nano-crystalline with a considerable fraction amorphous material. The longer annealing time of the ana-TiO2-D material results in a larger crystalline fraction, and a larger crystallite size.
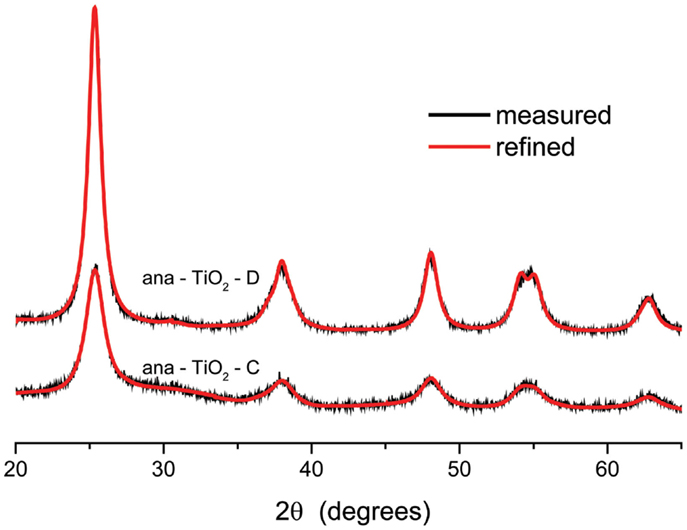
Figure 1. X-ray diffraction patterns of the anatase TiO2 samples prepared with different heating rates and the overlay of the Rietveld refinement of these patterns.
In order to determine the specific surface area of the TiO2 samples the Brunauer–Emmett–Teller (BET) method, N2 adsorption measurements were performed at −195.85°C. The average pore volume and pore size were determined from the absorption-desorption isotherms measured using the Barrett–Joyner–Halenda (BJH) method, and the results for the amorphous TiO2 samples are listed in Table 1. The A-TiO2-80 sample has a BET surface area of 484 m2/g which is lower than that of the E-TiO2-80 sample annealed at the same temperature, which has a specific surface area of 543 m2/g. As is expected, the BET surface area decreased with an increase in annealing temperature. From the pore sizes calculated for A-TiO2 and E-TiO2, all samples fall into the category of mesoporous materials with pore sizes ranging from 3.5 to 3.8 nm for the A-TiO2 samples and larger from 5.6 to 8.6 nm for the E-TiO2 samples. The ana-TiO2-C and -D samples had BET surface areas of 222 and 130 m2/g, respectively.
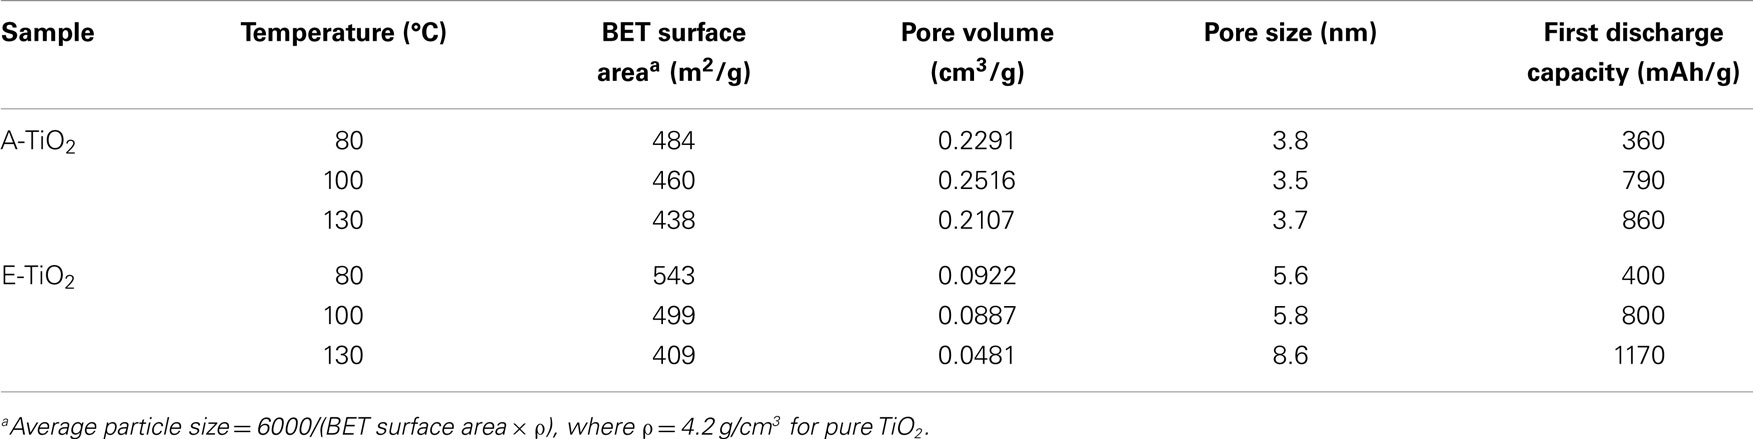
Table 1. Variation in the BET surface area, pore volume, and pore size on heating the amorphous TiO2 samples prepared in acetone and ethanol at various temperatures under vacuum.
Further characterization was done using transmission electron microscopy where the high-resolution micrographs recorded for anatase samples ana-TiO2-C and ana-TiO2-D both resulted in average particle sizes between 5 and 10 nm, respectively (supporting information). However, sample ana-TiO2-D had much more well-defined crystalline particles while the ana-TiO2-C sample appeared to be an amorphous/crystalline mix. The amorphous samples A-TiO2 and E-TiO2 resulted in average particle sizes between 2–3 and 3–5 nm, respectively. Representative micrographs for the A-TiO2-130 and E-TiO2-130 samples are shown in Figure 2. The observed particle sizes are in line with those calculated from the BET surface area. Additionally, the TEM micrographs at a lower magnification show that the aggregates of the E-TiO2-130 particles are more porous compared to the A-TiO2-130 particles, while on the other hand the A-TiO2-130 particles form larger and extremely spherical aggregates. Very few fringes were observed in the HRTEM micrographs and electron diffraction indicated amorphous samples with a negligible crystalline fraction.
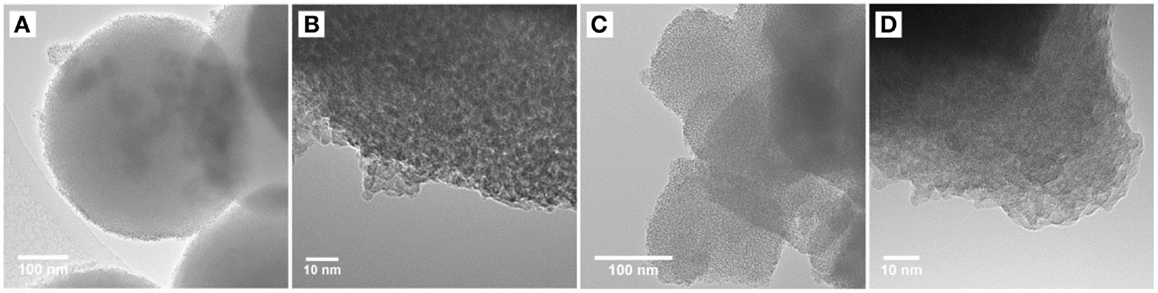
Figure 2. TEM and HRTEM micrographs for amorphous TiO2 samples (A,B) A-TiO2-130 and (C,D) E-TiO2-130.
All TiO2 samples were (dis)charged galvanostatically (constant current) within a range of 2.5 and 0.8 V at a C/10 rate as shown in Figures 3 and 4 for the anatase and amorphous samples, respectively. The voltage plateau was observed at ~1.75 V for all the anatase TiO2 samples, which corresponds to the existence of a well-defined two-phase region, and its truncated and sloping nature are characteristic of nano-crystalline electrode materials (Borghols et al., 2009). The samples ana-TiO2-A and ana-TiO2-C showed a higher first discharge capacities of 590 and 670 mAh/g (Figure 3A) compared to samples ana-TiO2-B and ana-TiO2-D, which had first discharge capacities of 360 and 390 mAh/g (Figure 3A), respectively. These are remarkably high, though not unprecedented for nano-crystalline TiO2 materials (Armstrong et al., 2005a,b; Sudant et al., 2005; Borghols et al., 2008). The theoretical maximum capacity of 335 mAh/g is attained when a composition of Li1TiO2 is reached. The first discharge capacities obtained correspond to compositions of Li1.8TiO2, Li2TiO2, Li1.1TiO2, and Li1.2TiO2 for samples ana-TiO2-A-D. The plateau corresponded to a composition of Li0.3–0.4TiO2 for samples ana-TiO2-A/ana-TiO2-B and Li0.4–0.5TiO2 for samples ana-TiO2-C/ana-TiO2-D, respectively. On performing repeated battery (dis)charge cycles, however, a different picture arose. As seen in Figure 3B only samples ana-TiO2-C and ana-TiO2-D, which were also additionally heated under vacuum show any substantial capacity retention at just under 200 mAh/g and just over 100 mAh/g, respectively, after 50 battery cycles. The main difference between samples ana-TiO2-C and -D is the presence of the amorphous fraction, which arises due to the annealing conditions adopted during the preparation of sample ana-TiO2-C. Lithium storage in the ana-TiO2-C sample probably occurs via a combination of an insertion and capacitive mechanism occurring due to the presence of the high-surface amorphous component, leading to a higher overall capacity (Laskova et al., 2014). In the more crystalline ana-TiO2-D sample, the capacity is consistent what has been found for nano crystalline anatase particles (Sudant et al., 2005) in which case the storage takes place via lithium insertion. The maximum capacity has been shown to be strongly particle size dependent, in micron sized anatase being limited to x ≈ 0.5 increasing up to the theoretical value x = 1 when the particle size is reduced to ~7 nm (Sudant et al., 2005; Wagemaker et al., 2007). This is a consequence of a second phase transition between Li0.5TiO2 and Li1TiO2 only occurring at the surface of the crystallites (Wagemaker et al., 2007).
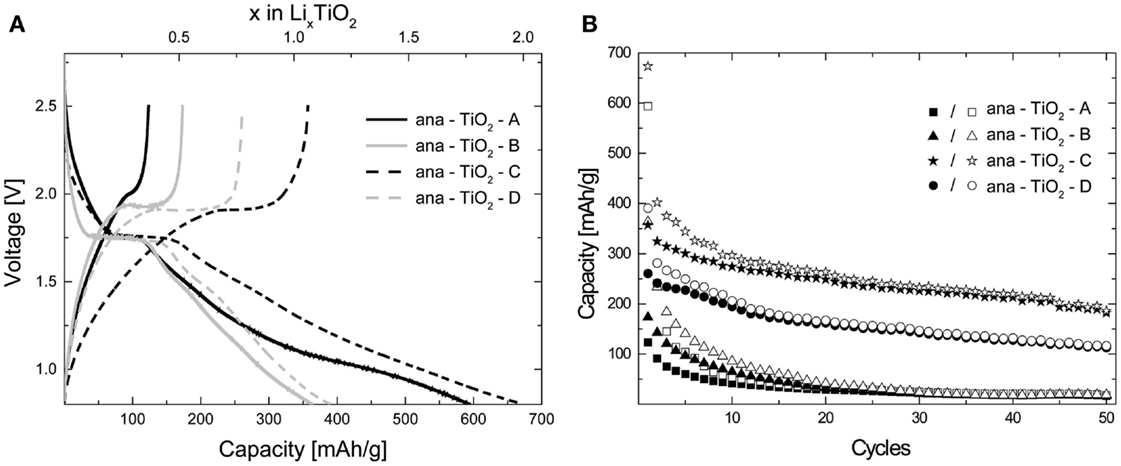
Figure 3. (A) First cycle (dis)charge voltage profiles for the nano-crystalline anatase TiO2 samples measured in the galvanostatic mode at a C/10 rate. (B) Retention of capacity upon performing (dis)charge cycles at a C/10 rate for the nano-crystalline anatase TiO2 samples. The filled data points refer to the charge capacity while the hollow data points refer to the discharge capacity.
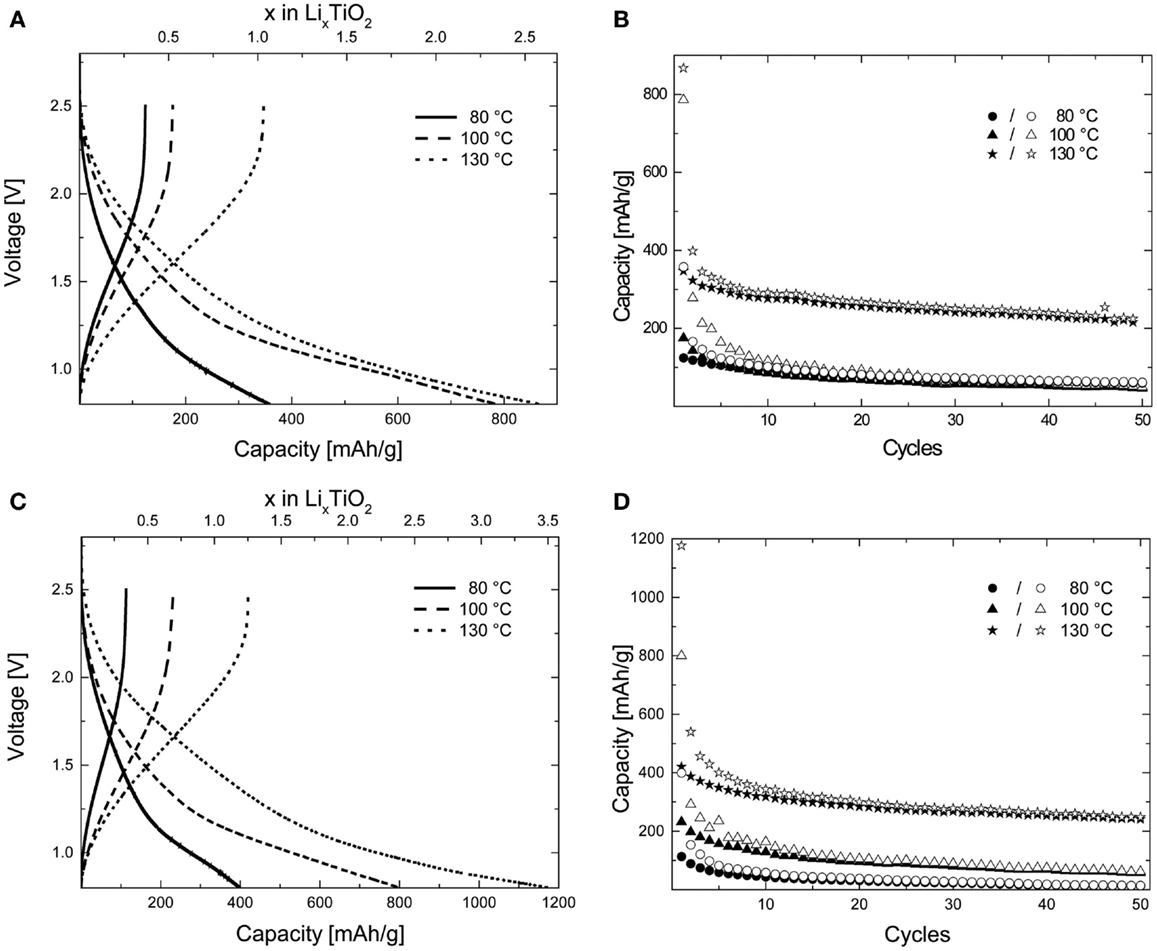
Figure 4. (A,C) First cycle (dis)charge voltage profiles for the amorphous TiO2 samples prepared at various temperatures in ethanol and acetone, respectively, measured in the galvanostatic mode at a C/10 rate. (B,D) Retention of capacity upon performing (dis)charge cycles at a C/10 rate for the amorphous anatase TiO2 samples prepared in ethanol and acetone at various temperatures. The filled data points refer to the charge capacity while the hollow data points refer to the discharge capacity.
For the amorphous samples prepared in different media and at different temperatures, a sloping voltage curve with no plateau is observed unlike what has been reported previously (Borghols et al., 2010) indicating a solid-solution or capacitive (Laskova et al., 2014) lithium insertion mechanism and the absence of a contributing crystalline anatase fraction (Wagemaker and Mulder, 2013). This is further corroborated by the HRTEM micrographs of the samples described in the preceding section by the absence of significant fringes. The samples A-TiO2-130 and E-TiO2-130 both showed extremely high-specific capacities after the first discharge to 0.8 V with 860 and 1170 mAh/g (Figures 4A,C), respectively, both of which are unprecedented for the amorphous TiO2 polymorph (Borghols et al., 2010). These correspond to compositions of Li2.6TiO2 and Li3.5TiO2, respectively. The theoretical maximum capacity of 335 mAh/g is attained when a composition of Li1TiO2 is reached fully utilizing the Ti4+/Ti3+ redox couple. Interestingly, samples annealed at 100°C under vacuum also show high-specific capacities after the first discharge at 790 and 800 mAh/g (Figures 4A,C) for samples A-TiO2-100 and E-TiO2-100, which is comparable to what has been reported previously in literature for amorphous TiO2. This corresponds to a composition of ~Li2.4TiO2; however, the capacity fading is significant to 80 mAh/g after 50 cycles. Finally, samples annealed to 80°C result in first discharge capacities of 360 and 400 (Figures 4A,C) mAh/g significantly lower than those measured for samples annealed at higher temperatures. On performing multiple (dis)charge cycles only samples A-TiO2-130 and E-TiO2-130 show an appreciable capacity retention of 220 and 240 mAh/g after 50 battery cycles, the latter being the highest observed for pristine amorphous TiO2, though C–N doped amorphous TiO2 samples, albeit having a lower BET surface area have been shown to produce higher reversible capacities (Borghols et al., 2010; Xiao et al., 2014).
To obtain better understanding of the increased capacity retention observed for the amorphous samples A-TiO2-130 and E-TiO2-130 and the differences in capacity based only on altered sample preparation medium, Fourier transform infra-red (FTIR) spectroscopy measurements were performed on all the amorphous samples, resulting in the spectra depicted in Figure 5. For the samples prepared in acetone (Figure 5A), each spectrum shows a broad absorption peak corresponding to an −OH stretching vibration of hydrogen bonded water molecules between 2500 and 3700 cm−1 (3300 cm−1), a peak corresponding to chemisorbed surface −OH groups at 3671 cm−1 and a peak at 1626 cm−1 corresponding to a H2O bending vibration. Despite heating to 130°C under vacuum for several hours the peaks corresponding to molecular water persists. The gradual diminishing in intensity and subsequent disappearance of peaks in the region of 3000–2800 cm−1 which belong to the C–H functionality indicate that heating the sample to 130°C is sufficient to remove all remnants of acetone from the amorphous TiO2 material.
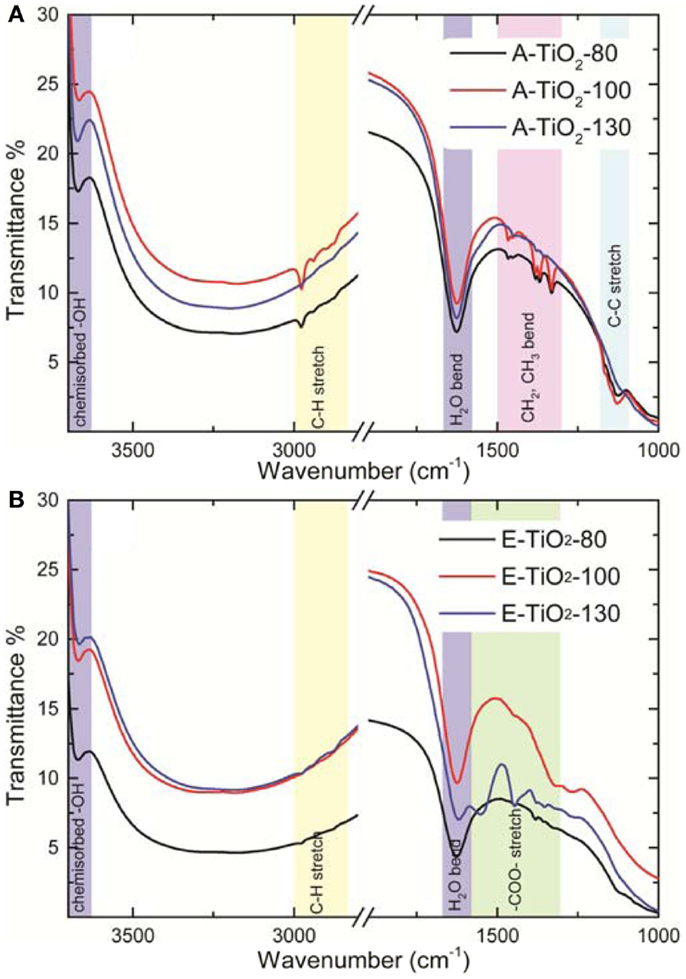
Figure 5. Fourier transform infra-red spectra of the amorphous TiO2 samples annealed under vacuum at various temperatures in (A) acetone and (B) ethanol.
For the samples prepared in ethanol (Figure 5B) similar water peaks at 3671 cm−1 and in the region 2500–3700 cm−1 are observed. The H2O bending peak was present at 1626 cm−1 for the E-TiO2-80 sample and shifted to 1622 cm−1 for the E-TiO2-100 and E-TiO2-130 samples. The characteristic peaks of ethanol physically adsorbed on a TiO2 surface at 1000–1200 cm−1 (C–O and C–C stretching) and 1300–1500cm−1 (CH2 and CH3 bending) are of extremely low intensity while the O–H bending peak that should have appeared at ~1264 cm−1 is absent in the E-TiO2-80 samples (Hussein et al., 1991; Wu et al., 2000). This indicates that there is very little or no physically adsorbed ethanol remaining on a sample heated to 80°C under vacuum. The remaining peaks are attributed to co-adsorbed chemisorbed ethanol and H2O (Wu et al., 2000). Weak peaks at 2978, 2938, and 2977 cm−1 can be attributed to CH – stretching frequencies of chemisorbed ethoxide ions (Jackson and Parfitt, 1972; Graham et al., 1981). In the E-TiO2-130 sample, new peaks centered at 1378, 1446, and 1547 cm−1 are observed, which are attributed to surface carboxylate (COO−) functionality (Graham et al., 1981; Hussein et al., 1991; Wu et al., 2000). This indicates that the chemisorbed ethanol species undergoes oxidation to form a carboxylate containing species, possibly acetate on heating above 100°C under vacuum. This is plausible because TiO2 in the presence of surface OH− groups is known to possess surface acid sites, the number and strength of which increases with decrease in crystallite size which in turn catalyzes the oxidation reaction (Nakabayashi et al., 1991). In addition nano-structured TiO2 when heated under vacuum, leads to the formation of oxygen-deficient species (Bavykin et al., 2006) (Ti4O7 or Ti5O9) due to the removal of lattice oxygen atoms which also results in the presence of under-coordinated titanium sites at the surface, which has already been described in detail elsewhere (Borghols et al., 2010).
The low-columbic efficiency often displayed by high-surface TiO2 materials is typically ascribed to SEI (Bresser et al., 2012), the formation of which can only be prevented above 1.2 V vs. Li/Li+ as been shown for high-surface anatase TiO2 nanorods (Bresser et al., 2012). This indicates that the SEI will be formed under the present conditions, galvanostatic cycling with a lower cut-off voltage of 0.8 V vs. Li/Li+. In addition to the increase observed in capacity retention, there is also an increase in the irreversible discharge capacity compared to what has been reported previously for this material (Table 1) (Borghols et al., 2010; Xiao et al., 2014). Rather than scaling with the BET surface area, the first cycle capacity scales with the annealing temperature (Table 1). This indicates that the substantial irreversible capacity observed after the first discharge is a direct consequence of the solvent-free surfaces of the A/E-TiO2-130 materials. The presence of more reactive surface titanium sites and residual COO− functional groups as determined from the IR measurements leads to a larger fraction of lithium being incorporated into the SEI possibly in the form of carbonate species. We suggest that the better capacity retention of samples annealed at higher temperatures is therefore due to a more stable SEI, which is the consequence of the absence of residual solvent molecules, unlike for samples annealed at 80 or 100°C, where lithium continues to react with reactive solvent species leading to a much lower capacity retention.
To get a better indication of the amount of carbon in the E-TiO2-130 material, we also performed EELS focusing on the carbon K-edge, which is visible at 284 eV as shown in Figure 6. For comparison purposes, the raw data are normalized to the maximum intensity. A carbon K-edge of appreciable intensity is observed for the E-TiO2-80 sample and the intensity of the peak diminishes for the E-TiO2-100 sample and no peak appears for the E-TiO2-130 material. This reiterates the absence of any molecular ethanol and also indicates that the amount of surface carboxylate present is very small and only visible in the bulk FTIR measurements.
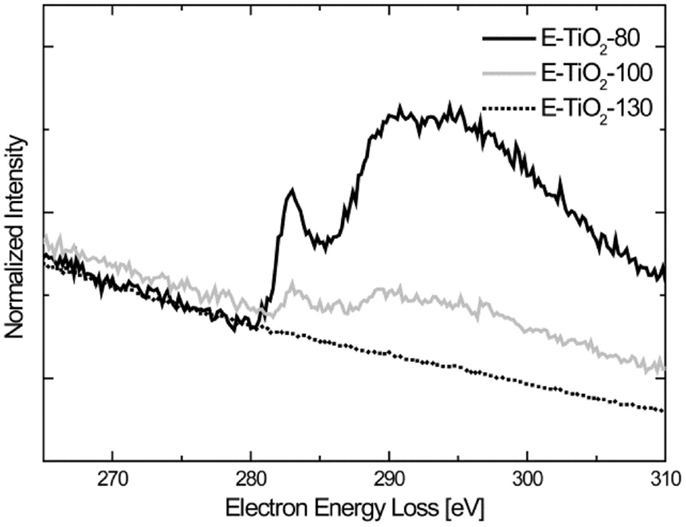
Figure 6. Electron energy loss spectroscopy measurements spectra of the carbon K-edge of the amorphous TiO2 samples annealed under vacuum at various temperatures in ethanol.
Amorphous TiO2 cannot be heated to higher temperatures without inducing crystallization. Nano-structured TiO2 has an inherent affinity to H2O and OH− groups, which persist despite heating to higher temperatures. The reactivity of these with the components of the electrolyte remains the main reason for capacity fading observed in these materials (Morterra, 1988). The consequence of the improved capacity observed for sample E-TiO2-130 could be partially due to the presence of ester-like linkages of RCOO− groups to under-coordinated surface Ti sites (Figure 7). These potentially act as lithium carriers, improving Li-access and diffusion to all parts of the electrode during (dis)charge. A more stable bridging coordination of the RCOO− species to neighboring fourfold coordinated surface titanium atoms (Figure 5) (Diebold, 2003), may also be responsible for reducing the availability of titanium sites vulnerable to the attachment of surface hydroxyl groups. This is seen in the reduced intensity in the peak at 3671 cm−1 from the E-TiO2-80 to E-TiO2-130 samples. A consequence could be the reduced hydrolysis of present in the electrolyte and subsequently smaller amounts of LiF and organophosphates formed implying a more stable SEI and hence better retention of capacity (Brutti et al., 2012).
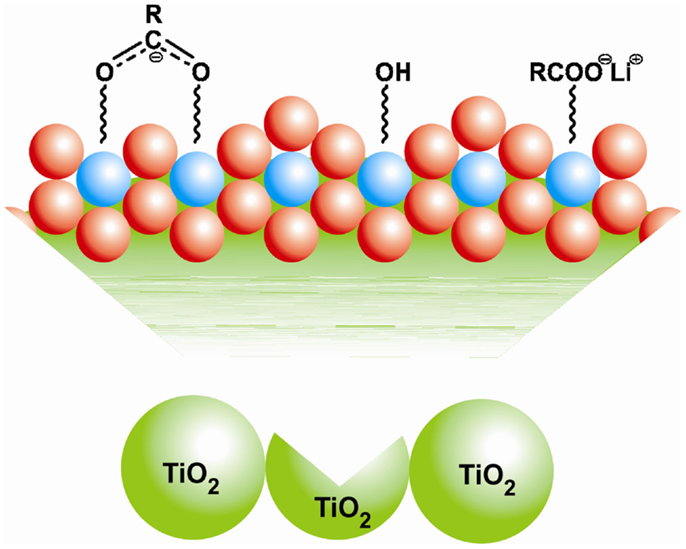
Figure 7. Schematic for the various kinds of surface binding of the COO− and OH− groups at a section of the amorphous TiO2 particle surface. The blue and red spheres represent titanium and oxygen atoms, respectively.
Conclusion
To conclude, it has been shown that extended annealing under vacuum leads to capacity retention of 220 and 240 mAh/g after 50 cycles for amorphous TiO2 prepared in acetone and ethanol, respectively. Using FTIR and EELS, it was determined that for the amorphous TiO2 samples prepared in acetone, there is no residual solvent present, while for the samples prepared in ethanol the surface of the amorphous TiO2 is partially functionalized by a small amount of residual functional groups coordinated to the oxygen-deficient surface displacing the more reactive hydroxyl groups. These results demonstrate even the presence of small amounts of residual solvent has a drastic impact on the electrochemistry of nano-structured battery electrodes due to their very large surface area and the simple act of extensive solvent cleaning from the sample allows the reversible capacity to be improved by up to 20%. Thereby, the present results provide a simple and effective strategy to improve the performance of high-surface area transition metal oxides.
Conflict of Interest Statement
The authors declare that the research was conducted in the absence of any commercial or financial relationships that could be construed as a potential conflict of interest.
Acknowledgments
We would like to thank Mr. David van Asten and BASF Nederland B.V. for their assistance with the N2 adsorption measurements. We would like to thank Mr. Prasad Gonugunta and Dr. Iulian Dugulan for their assistance with the FTIR measurements. We would also like to acknowledge financial support from NWO-NANO for Swapna Ganapathy and Shibabrata Basak. The research leading to these results has received funding from the European Research Council under the European Union’s Seventh Framework Programme (FP/2007-2013)/ERC Grant Agreement no. (307161) of Marnix Wagemaker.
Supplementary Material
The Supplementary Material for this article can be found online at http://www.frontiersin.org/Journal/10.3389/fenrg.2014.00053/abstract
References
Arico, A. S., Bruce, P., Scrosati, B., Tarascon, J. M., and Van Schalkwijk, W. (2005). Nanostructured materials for advanced energy conversion and storage devices. Nat. Mater. 4, 366–377. doi: 10.1038/nmat1368
Pubmed Abstract | Pubmed Full Text | CrossRef Full Text | Google Scholar
Armand, M., and Tarascon, J. M. (2008). Building better batteries. Nature 451, 652–657. doi:10.1038/451652a
Armstrong, A. R., Armstrong, G., Canales, J., Garcia, R., and Bruce, P. G. (2005a). Lithium-ion intercalation into TiO2-B nanowires. Adv. Mater. 17, 862. doi:10.1021/am4046487
Pubmed Abstract | Pubmed Full Text | CrossRef Full Text | Google Scholar
Armstrong, A. R., Armstrong, G., Canales, J., and Bruce, P. G. (2005b). TiO2-B nanowires as negative electrodes for rechargeable lithium batteries. J. Power Sources 146, 501–506. doi:10.1016/j.jpowsour.2005.03.057
Bavykin, D. V., Friedrich, J. M., and Walsh, F. C. (2006). Protonated titanates and TiO2 nanostructured materials: Synthesis, properties, and applications. Adv. Mater. 18, 2807–2824. doi:10.1002/adma.200502696
Borghols, W. J. H., Luetzenkirchen-Hecht, D., Haake, U., Chan, W., Lafont, U., Kelder, E. M., et al. (2010). Lithium storage in amorphous TiO2 nanoparticles. J. Electrochem. Soc. 157, A582–A588. doi:10.1149/1.3332806
Borghols, W. J. H., Wagemaker, M., Lafont, U., Kelder, E. M., and Mulder, F. M. (2008). Impact of nanosizing on lithiated rutile TiO2. Chem. Mater. 20, 2949–2955. doi:10.1021/cm703376e
Borghols, W. J. H., Wagemaker, M., Lafont, U., Kelder, E. M., and Mulder, F. M. (2009). Size effects in the Li4+xTi5O12 spinel. J. Am. Chem. Soc. 131, 17786–17792. doi:10.1021/ja902423e
Pubmed Abstract | Pubmed Full Text | CrossRef Full Text | Google Scholar
Bresser, D., Paillard, E., Binetti, E., Krueger, S., Striccoli, M., Winter, M., et al. (2012). Percolating networks of TiO 2 nanorods and carbon for high power lithium insertion electrodes. J. Power Sources 206, 301–309. doi:10.1016/j.jpowsour.2011.12.051
Bruce, P. G., Scrosati, B., and Tarascon, J. M. (2008). Nanomaterials for rechargeable lithium batteries. Angew. Chem. Int. Ed. 47, 2930–2946. doi:10.1002/anie.200702505
Pubmed Abstract | Pubmed Full Text | CrossRef Full Text | Google Scholar
Brutti, S., Gentili, V., Menard, H., Scrosati, B., and Bruce, P. G. (2012). TiO2-(B) nanotubes as anodes for lithium batteries: origin and mitigation of irreversible capacity. Adv. Energy Mater. 2, 322–327. doi:10.1002/asia.201200551
Pubmed Abstract | Pubmed Full Text | CrossRef Full Text | Google Scholar
Deng, D., Kim, M. G., Lee, J. Y., and Cho, J. (2009). Green energy storage materials: nanostructured TiO2 and Sn-based anodes for lithium-ion batteries. Energy Environ. Sci. 2, 818–837. doi:10.1039/b823474d
Diebold, U. (2003). The surface science of titanium dioxide. Surf. Sci. Rep. 48, 53–229. doi:10.1016/S0167-5729(02)00100-0
Graham, J., Rochester, C. H., and Rudham, R. (1981). Infrared study of the adsorption of ethyl-acetate on rutile. J. Chem. Soc. Faraday Trans. 1 77, 1973–1980. doi:10.1039/f19817701973
Guo, Y. G., Hu, Y. S., Sigle, W., and Maier, J. (2007). Superior electrode performance of nanostructured mesoporous TiO2 (anatase) through efficient hierarchical mixed conducting networks. Adv. Mater. 19, 2087. doi:10.1002/adma.200602828
Hadjiivanov, K. I., and Klissurski, D. G. (1996). Surface chemistry of titania (anatase) and titania-supported catalysts. Chem. Soc. Rev. 25, 61. doi:10.1039/cs9962500061
Hussein, G. A. M., Sheppard, N., Zaki, M. I., and Fahim, R. B. (1991). Infrared spectroscopic studies of the reactions of alcohols over group IVb metal-oxide catalysts.3. Ethanol over TIO2, ZRO2 and HFO2, and general conclusions from part-1 to part-3. J. Chem. Soc. Faraday Trans. 1 87, 2661–2668. doi:10.1039/ft9918702661
Jackson, P., and Parfitt, G. D. (1972). Infrared study of surface properties of rutile – adsorption of ethanol, butanol and hexanol. J. Chem. Soc. Faraday Trans. 1 68, 1443–1450. doi:10.1039/f19726801443
Kasavajjula, U., Wang, C., and Appleby, A. J. (2007). Nano- and bulk-silicon-based insertion anodes for lithium-ion secondary cells. J. Power Sources 163, 1003–1039. doi:10.1016/j.jpowsour.2006.09.084
Kyeremateng, N. A., Dumur, F., Knauth, P., Pecquenard, B., and Djenizian, T. (2011). Electropolymerization of copolymer electrolyte into titania nanotube electrodes for high-performance 3D microbatteries. Electrochem. Commun. 13, 894–897. doi:10.1186/1556-276X-7-349
Pubmed Abstract | Pubmed Full Text | CrossRef Full Text | Google Scholar
Larcher, D., Beattie, S., Morcrette, M., Edström, K., Jumas, J. C., and Tarascon, J. M. (2007). Recent findings and prospects in the field of pure metals as negative electrodes for Li-ion batteries. J. Mater. Chem. 17, 3759–3772. doi:10.1039/b705421c
Larson, A. C., and Von Dreele, R. B. (2004). General Structure Analysis System (GSAS). Los Alamos: Los Alamos National Laboratory.
Laskova, B., Zukalova, M., Zukal, A., Bousa, M., and Kavan, L. (2014). Capacitive contribution to Li-storage in TiO2 (B) and TiO 2 (anatase). J. Power Sources 246, 103–109. doi:10.1016/j.jpowsour.2013.07.073
Li, H., Wang, Z., Chen, L., and Huang, X. (2009). Research on advanced materials for Li-ion batteries. Adv. Mater. 21, 4593–4607. doi:10.1002/adma.200901710
Livage, J., Henry, M., and Sanchez, C. (1988). Sol-gel chemistry of transition-metal oxides. Prog. Solid State Chem. 18, 259–341. doi:10.1016/0079-6786(88)90005-2
Morterra, C. (1988). An infrared spectroscopic study of anatase properties. 6. Surface hydration and strong Lewis acidity of pure and sulfate-doped preparations. J. Chem. Soc. Faraday Trans. 1 84, 1617–1637. doi:10.1039/f19888401617
Nakabayashi, H., Kakuta, N., and Ueno, A. (1991). Strong acid sites created on small-sized anatase. Bull. Chem. Soc. Jpn. 64, 2428–2432. doi:10.1246/bcsj.64.2428
Plylahan, N., Kyeremateng, N. A., Eyraud, M., Dumur, F., Martinez, H., Santinacci, L., et al. (2012). Highly conformal electrodeposition of copolymer electrolytes into titania nanotubes for 3D li-ion batteries. Nanoscale Res. Lett. 7, 1–11. doi:10.1186/1556-276X-7-349
Pubmed Abstract | Pubmed Full Text | CrossRef Full Text | Google Scholar
Poizot, P., Laruelle, S., Grugeon, S., Dupont, L., and Tarascon, J. M. (2000). Nano-sized transition-metaloxides as negative-electrode materials for lithium-ion batteries. Nature 407, 496–499. doi:10.1038/35035045
Pubmed Abstract | Pubmed Full Text | CrossRef Full Text | Google Scholar
Ren, Y., Hardwick, L. J., and Bruce, P. G. (2010). Lithium intercalation into mesoporous anatase with an ordered 3D pore structure. Angew. Chem. Int. Ed. 49, 2570–2574. doi:10.1002/anie.200907099
Scrosati, B., and Garche, J. (2010). Lithium batteries: Status, prospects and future. J. Power Sources 195, 2419–2430. doi:10.1002/adma.200903328
Pubmed Abstract | Pubmed Full Text | CrossRef Full Text | Google Scholar
Shin, J. Y., Samuelis, D., and Maier, J. (2011). Sustained lithium-storage performance of hierarchical, nanoporous anatase TiO 2 at high rates: emphasis on interfacial storage phenomena. Adv. Funct. Mater. 21, 3464–3472. doi:10.1002/adfm.201002527
Sudant, G., Baudrin, E., Larcher, D., and Tarascon, J. M. (2005). Electrochemical lithium reactivity with nanotextured anatase-type TiO2. J. Mater. Chem. 15, 1263–1269. doi:10.1039/b416176a
Szczech, J. R., and Jin, S. (2011). Nanostructured silicon for high capacity lithium battery anodes. Energy Environ. Sci. 4, 56–72. doi:10.1039/c0ee00281j
Wagemaker, M., Borghols, W. J. H., and Mulder, F. M. (2007). Large impact of particle size on insertion reactions: a case of anatase LixTiO2. J. Am. Chem. Soc. 129, 4323. doi:10.1021/ja067733p
Pubmed Abstract | Pubmed Full Text | CrossRef Full Text | Google Scholar
Wagemaker, M., and Mulder, F. M. (2013). Properties and promises of nanosized insertion materials for li-ion batteries. Acc. Chem. Res. 46, 1206–1215. doi:10.1021/ar2001793
Pubmed Abstract | Pubmed Full Text | CrossRef Full Text | Google Scholar
Wu, W. C., Chuang, C. C., and Lin, J. L. (2000). Bonding geometry and reactivity of methoxy and ethoxy groups adsorbed on powdered TiO2. J. Phys. Chem. B 104, 8719–8724. doi:10.1021/jp0017184
Xiao, Y., Hu, C., and Cao, M. (2014). Compositing amorphous TiO2 with N-doped carbon as high-rate anode materials for lithium-ion batteries. Chem. Asian J. 9, 351–356. doi:10.1002/asia.201301183
Pubmed Abstract | Pubmed Full Text | CrossRef Full Text | Google Scholar
Yang, Z., Choi, D., Kerisit, S., Rosso, K. M., Wang, D., Zhang, J., et al. (2009). Nanostructures and lithium electrochemical reactivity of lithium titanites and titanium oxides: a review. J. Power Sources 192, 588–598. doi:10.1016/j.jpowsour.2009.02.038
Keywords: Li-ion battery, amorphous TiO2, nano-structured materials, surface functionalization, FTIR
Citation: Ganapathy S, Basak S, Lefering A, Rogers E, Zandbergen HW and Wagemaker M (2014) Improving reversible capacities of high-surface lithium insertion materials – the case of amorphous TiO2. Front. Energy Res. 2:53. doi: 10.3389/fenrg.2014.00053
Received: 12 September 2014; Accepted: 07 November 2014;
Published online: 28 November 2014.
Edited by:
Jie Xiao, Pacific Northwest National Laboratory, USAReviewed by:
Hui Xia, Nanjing University of Science and Technology, ChinaRuigang Zhang, Toyota Research Institute of North America, USA
Copyright: © 2014 Ganapathy, Basak, Lefering, Rogers, Zandbergen and Wagemaker. This is an open-access article distributed under the terms of the Creative Commons Attribution License (CC BY). The use, distribution or reproduction in other forums is permitted, provided the original author(s) or licensor are credited and that the original publication in this journal is cited, in accordance with accepted academic practice. No use, distribution or reproduction is permitted which does not comply with these terms.
*Correspondence: Marnix Wagemaker, Fundamental Aspects of Materials and Energy, Department of Radiation, Radionucleides and Reactors, Faculty of Applied Sciences, Delft University of Technology, Mekelweg 15, Delft 2629 JB, Netherlands e-mail: m.wagemaker@tudelft.nl