Effect of calendering on electrode wettability in lithium-ion batteries
 Yangping Sheng1
 Christopher R. Fell2
 Yong Kyu Son2
Bernhard M. Metz2
Junwei Jiang2
Yong Kyu Son2
Bernhard M. Metz2
Junwei Jiang2  Benjamin C. Church1*
- 1Department of Materials Science and Engineering, University of Wisconsin – Milwaukee, Milwaukee, WI, USA
- 2Global Technology and Innovation, Power Solutions, Johnson Controls, Milwaukee, WI, USA
Controlling the wettability between the porous electrode and the electrolyte in lithium-ion batteries can improve both the manufacturing process and the electrochemical performance of the cell. The wetting rate, which is the electrolyte transport rate in the porous electrode, can be quantified using the wetting balance. The effect of the calendering process on the wettability of anode electrodes was investigated. A graphite anode film with an as-coated thickness of 59 μm was used as baseline electrode film and was calendered to produce films with thickness ranging from 55 to 41 μm. Results show that wettability is improved by light calendering from an initial thickness of 59 μm to a calendered thickness of 53 μm where the wetting rate increased from 0.375 to 0.589 mm/s0.5. Further calendering below 53 μm resulted in a decrease in wetting rates to a minimum observed value of 0.206 mm/s0.5 at a calendered thickness of 41 μm. Under the same electrolyte, wettability of the electrode is controlled to a great extent by the pore structure in the electrode film, which includes parameters such as porosity, pore size distribution, pore geometry and topology. Relations between the wetting behavior and the pore structure as characterized by mercury intrusion and electron microscopy exist and can be used to manipulate the wetting behavior of electrodes.
Introduction
Demands for increased performance and lower costs for lithium-ion batteries have been increasing. This can be achieved through the development of novel materials (Tarascon and Armand, 2001), battery architectures (Edwin García and Chiang, 2007), and manufacturing techniques (Ramadesigana et al., 2012; Vu et al., 2012). Advances in battery performance have been primarily driven by the development of new cell materials, chemistries, and electrolytes (Scrosati and Garche, 2010), though theoretical limits for gravimetric or volumetric capacities have been identified (Hautier et al., 2011; Mueller et al., 2011; Dillon and Sun, 2012). Moreover, when a battery is examined at the system level in industry, issues like underutilization, capacity fade, thermal runaways, and low energy density will be obvious (Edwin García and Chiang, 2007; Yoshio et al., 2009). More detailed understanding of how materials and resulting structures within the cell react to the manufacturing process can provide greater insight into relating processing to battery performance (Guy et al., 2006; Thorat et al., 2011).
Electrolyte injection occurs after cell assembly. Electrolyte is added to the cell by a precision pump and then vacuum filled to ensure that the electrolyte permeates and completely fills the pores in the separator and electrode structures (Yoshio et al., 2009; Park, 2012). Wettability between the porous electrode film and electrolyte becomes important in this process since poor wettability can lead to incomplete filling or extended manufacturing times. Any un-wetted active material will cause an underutilization of electrode capacity and increased electrolyte resistance (Bae et al., 2013). Wettability is usually improved by modifying the electrolyte with a wetting additive (Zhang, 2006). However, there is very little quantitative data about wettability in literature, and only simple qualitative observations, good, poor, and fair, were reported on the wettability of microporous separators (Song et al., 2000). Thus, a quantitative measurement for wettability can improve the understanding of wetting behavior, which can have potential performance or economic impacts.
As has been reported, wettability of electrodes can be tested by a wetting balance method (Wu et al., 2004; Kühnel et al., 2013). Wettability encompasses aspects of both the liquid electrolyte and the porous electrode materials. The primary electrolyte factors are viscosity and surface tension (Wu et al., 2004). The influence of the porous electrode on the wetting rate is more complicated and has been investigated less (Ebner et al., 2014). It has been widely accepted that electrode microstructure resulting from the manufacturing process directly impacts energy, power, lifetime, and reliability of lithium-ion batteries (Edwin García and Chiang, 2007; Yoshio et al., 2009; Wang et al., 2012). Due to the limited cell volume, electrodes also function as electrolyte reservoirs (Yoshio et al., 2009). To obtain a high capacity retention at high current application, both the electronic and ionic conductivity of the electrodes must be optimal (Guy et al., 2006; Jannesari et al., 2011). A good ionic contact of all electrode particles as well as a sufficiently high lithium-ion transport rate in the electrode pores are controlled by the amount of electrolyte that is retained in the electrodes as well as by the size and shape of electrode pores (tortuosity) (Lee et al., 2002; Sawai and Ohzuku, 2003). Moreover, there are electrode thickness limitations related to the increased diffusive and ohmic losses from Li-ion transport through the electrolyte (Arora et al., 1999; Nelson et al., 2011; Klett et al., 2012). Therefore, understanding and controlling the wetting rate of electrolyte in electrode films is critical to developing high performance batteries and controlling reducing manufacturing cost by improving the filling, charging and aging processes.
In industry, calendering has been considered to be a critical step in the production of high performance anodes (Shim and Striebel, 2003). Porosity and thickness of the electrode film will decrease with increasing calendering. Calendering would also be expected to change the pore structure of the electrode, which would thereby impact the wetting behavior of the film. The wetting balance test was used to investigate the wetting behavior of an anode film as a function of degree of calendering and related to structural parameters as characterized with electron microscopy and mercury porosimetry. Relations between the development of the porous structure and the resulting wetting performance are discussed.
Materials and Methods
Anode electrodes containing graphite, styrene-butadiene rubber, carboxymethyl cellulose, and acetylene black were mixed at a ratio of 95:1.5:1.5:2 and processed into a 40 vol % solids slurry with DI water. The active material had a round morphology with an average particle size of 8 μm. The anode slurry, coating, and calendering processes were prepared in a dry-room condition with an average dewpoint of −38°C. Copper electrodes were coated to a specified loading weight of approximately 4–5 mg/cm2 with varying densities dependent on the electrode thickness. A graphite anode film with an as-coated thickness of 59 μm was used as the baseline electrode film (thickness includes the 18 μm copper foil substrate). It was then calendered to produce electrode films with thickness of 55, 53, 49, and 41 μm using a single-pass controlled-gap calendering operation. The electrolyte solution used was 3:7 (volumetric ratio) solution of EC:EMC with 1.2 M LiPF6.
The wetting balance test was performed using a gravimetric technique to track sample mass during the liquid infiltration process with a custom-made immersion test system. The electrode sample was suspended under an analytical balance and a container of liquid was lifted to partially immerse the sample to a set depth. The balance recorded the weight change of the electrode sample as a function of time. The wetting balance test was carried out to measure the weight change of electrolyte inside of the electrode film, and the result was shown in a mass versus time curve (m-t curve). All testing was performed in an argon-purged environment. A modified Lucas-Washburn equation, as shown in Eq. 1, was used to quantitatively analyze the relation of sample mass change with time.
where t is time, Δm: sample weight in m-t curve, ρsol: solution density, Ae: cross-section area of sample, K: wetting rate of electrolyte in porous electrode, P: electrode porosity, : effective pore radius of electrode, γlv: surface tension of electrolyte solution, cos θ: contact angle of the electrolyte with the electrode, and η: viscosity of the electrolyte solution. The wetting rate K can be obtained from a linear curve fit of a mass change versus the square root of time. The active material film on the electrodes can be modeled as a porous medium composed of bundled capillary tubes, and the electrolyte transport process in the electrode as a spontaneous liquid adsorption driven by capillary force (Wu et al., 2004). This can be considered as a capillary imbibition process. Inertia and gravity influences are neglected for simplification (Xiao et al., 2006). More details about the modified Lucas-Washburn equation can be found in literature (Washburn, 1921; Wu et al., 2004; Kühnel et al., 2013).
Electrode films were prepared for SEM characterization by mounting them vertically in a sample holder and infiltrating with a low viscosity epoxy resin solution. After 14 h of curing at room temperature, the epoxy resin molds were ground and polished with emery papers of successively finer grit size of 240, 800, 1000, 1200, and 2000 grit, followed by diamond abrasives of sizes 9, 3, and 0.25 μm. The polished samples were cleaned and air dried before imaged using a Hitachi S-4800 FE-SEM with backscattered electron (BSE) detector. Mercury intrusion porosimetry (MIP) tests were performed on a Micromeritics AutoPore IV 9510. The MIP measures pore diameters from nanometer to micrometer scale, which matches well with the pore range in the electrode film samples. Electrode films were vacuum dried at 105°C overnight before each test. The maximum applied pressure of mercury was 414 MPa, equivalent to a Laplace throat diameter of 0.004 μm (4 nm). The equilibration time at each of the increasing applied pressures of mercury was set to 10 s, and a sample mass of approximately 1.0 g was used. Contact angle and surface tension of mercury was assumed to be 130 and 485 mN/m, respectively, for porosimetry calculations.
Results and Discussion
A total of six samples were tested for each electrode film condition to account for experimental and electrode film variations. An example of a single wetting balance test is shown in Figure 1 where sample mass is shown as a function of time. After an initial transient caused by the insertion of the sample into the liquid and the subsequent meniscus formation, the mass gain follows the root-time relation as described by Eq. 1a. Wetting rates as measured for each sample condition are shown in Table 1 and Figure 2. Wettability improved steadily with calendering from the initial thickness of 59–53 μm and then decreased with additional calendering beyond 53 μm. Averaged curving fitting parameters (R2) from the determination of the wetting rate (K) were in the range from 0.9296 to 0.9936. This confirms that the electrolyte transport process in electrode films can be characterized with root-time behavior, which is the expected behavior for capillary rise (Alava et al., 2004). Error % as listed in Table 1 is defined as the standard deviation divided by the average wetting rate which is similar to a coefficient of variation and can be used to describe measurement stability. The error % for 59 μm film is 15.71%, and it is 15.59% for 55 μm films. The error % reaches lowest value in 53 μm, which is 6.08%. When the film is further compressed to 49 and 41 μm, the error % increased to 34.88 and 28.99% respectively.
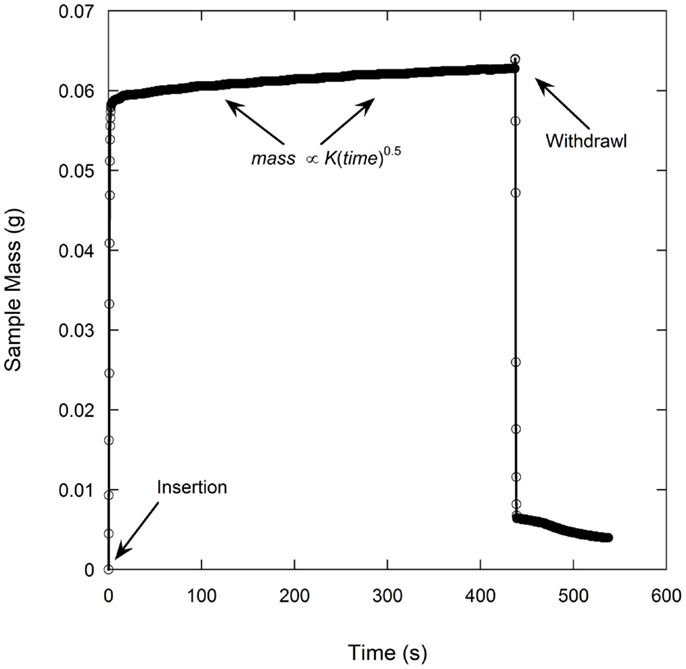
Figure 1. A typical mass vs time curve (m-t curve) from wetting balance test.
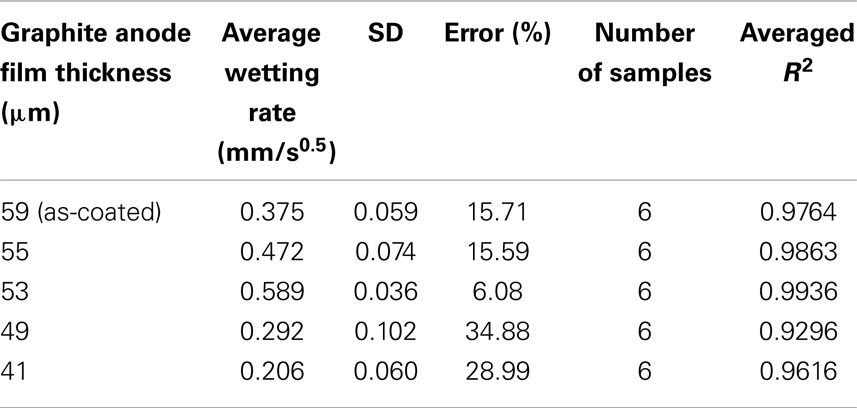
Table 1. Data summary of results from wetting balance test for all the electrode films.
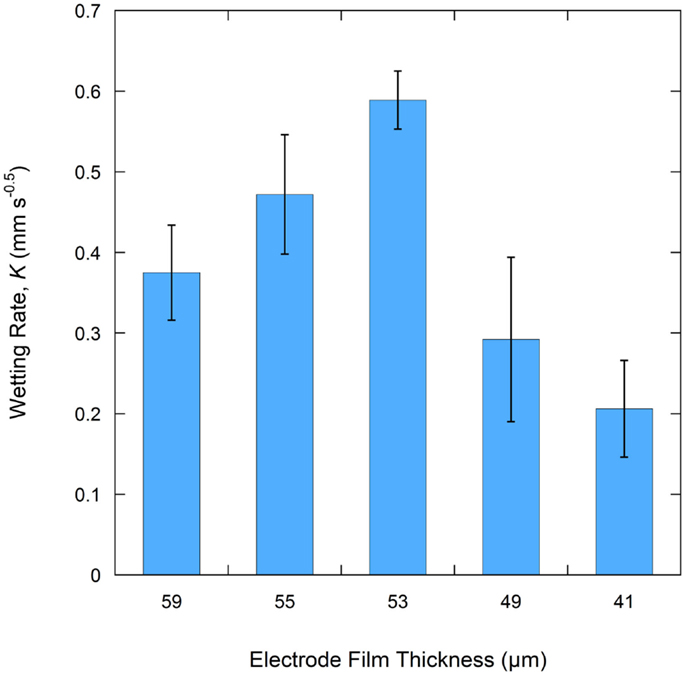
Figure 2. Wetting rate for electrode films calendering under various pressure.
As described in Eq. 1b, the wetting rate is related to electrode properties including porosity and effective pore radius, electrolyte properties including viscosity and surface tension, and the combined electrode-electrolyte property of contact angle. In this work, the same electrolyte solution was used for all tests and same electrode film compositions were used, meaning that the graphite particles, binder, and conductive additives were constant. Thus, electrolyte effects are not a variable and the contact angle can be considered the same for all the tests. The wetting rate is only influenced by electrode porosity and the effective pore radius. According to the Washburn equation, the effective pore radius is a simplified parameter describing the pore geometry of a porous medium and is varied to meet experiment results (Jianchao and Yu, 2011). This parameter lacks a precise physical definition which makes it difficult to relate to practical applications, particularly where complicated pore structures exist. The average pore diameter as measured by MIP was used to replace the more complex effective pore radius value. Results of porosity and average pore diameter from MIP are summarized in Table 2. Based on Eq. 1b, the product of porosity and the root of the effective pore radius would have a linear relation with the wetting rate. As shown in Figure 3, this relation is fairly linear for the anode samples calendered to various thicknesses. The linear curve fitting parameter (R2) of this trend was 0.7242 and the largest deviations from the linear behavior were found with the 59 and 53 μm samples. These particular samples were the as-coated sample and the sample with the highest observed wetting rate, respectively.
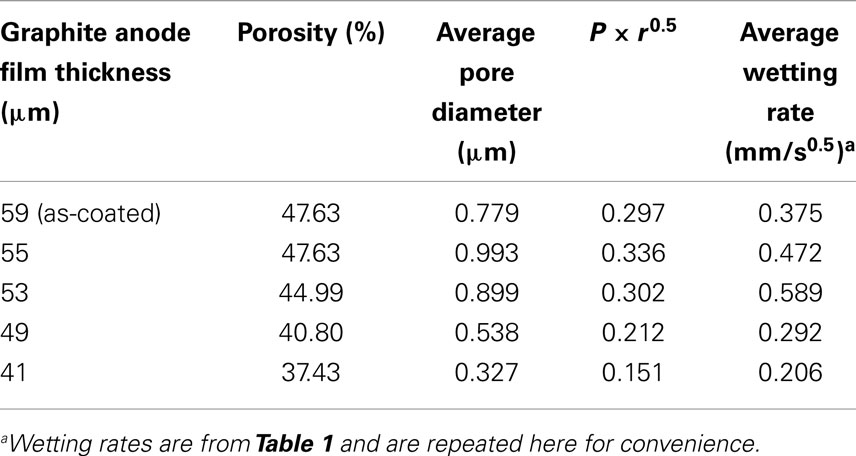
Table 2. Results summary for porosity and average pore diameter from mercury intrusion porosimetry.
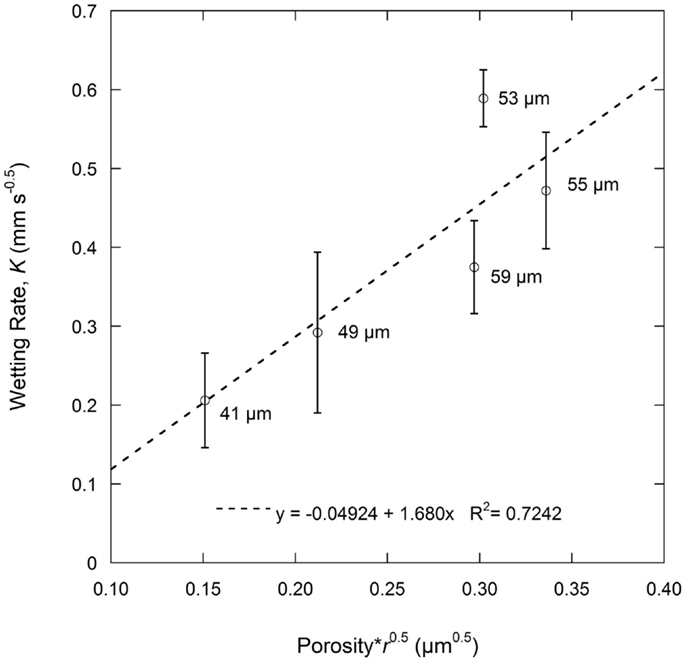
Figure 3. Wetting rate, K, as a function of porosity and average pore radius according to the Lucas–Washburn Eq. 1b. Average pore radius (r) is based on the average pore diameter as measured by MIP.
Electrode microstructure was observed with cross-sectional BSE-SEM imaging as shown in Figure 4. The backscattered images show the copper metal current collectors as bright white. Imaging of the graphite particles with the epoxy mounting material shows little contrast though several important features can be observed. The graphite particles are flaky and roughly aligned in a parallel fashion. The alignment increase with increasing calendering. There are irregular pore cavities among three or more particles which can be found in all films. These cavities may function as electrolyte reservoirs inside the electrode films. Due to the limited overall cell volume required to produce cells with high volumetric properties, both electrodes and separators need to function as electrolyte reservoirs to have sufficient lithium-ion transport rates (Yoshio et al., 2009). The larger pore cavities tend to be found around larger graphite particles. The distance between two nearby parallel particles is narrow and forms channels between the larger cavities. The pore structure consists of inter-connected throats (ducts) and cavities (nodes). Transport of electrolyte in these pore networks may include a converging-diverging feature (Durst et al., 1987). Electrolyte converges in the cavities first, and then diverges into nearby throats. Therefore, the wetting rate of electrolyte is affected mainly by the inter-connection between throats and cavities, which is highly affected by the calendering process. Additional manufacturing parameters beyond calendering can also be used to manipulate the pore structure of the electrode films. Use of graphite particles of different morphologies (e.g., flake, round, peanut, etc.,) or manipulation of particle size distributions could be used to design or tailor these pore networks.
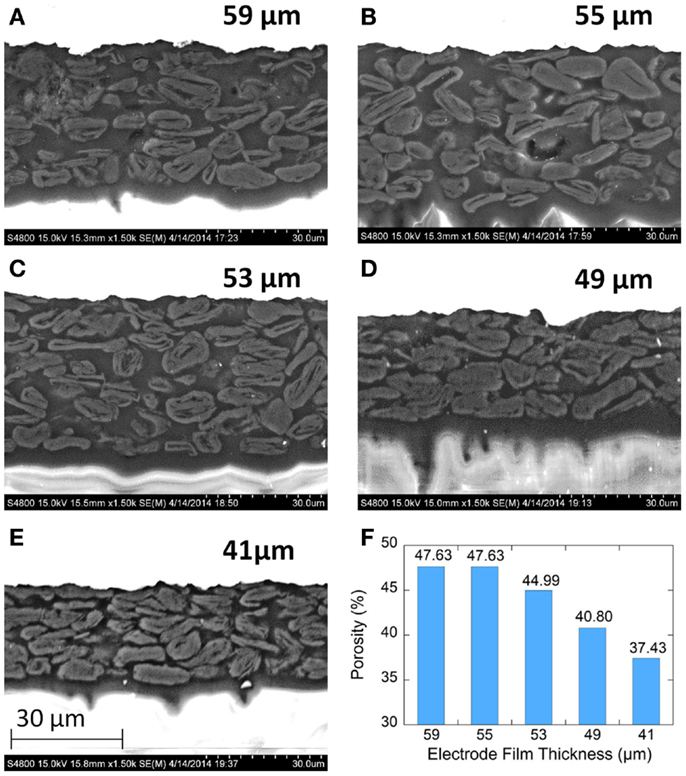
Figure 4. Cross-sectional backscattered electron (BSE) SEM images of graphite anode electrodes films. (A–E) are for 59, 55, 53, 49, and 41μm, respectively. (F) Porosity for each film as measured by MIP.
Normalized cumulative intrusion curves from MIP tests, shown in Figure 5, were obtained by dividing the cumulative intrusion volume with the total intrusion volume for each respective sample. The intrusion process begins with mercury filling pores that have the largest diameters and proceeds to pores of continually decreasing diameter with increasing applied pressure (Aligizaki, 2005). The intrusion rate is much slower in the large pore region. When a pore size smaller than a threshold pore diameter (dth) is achieved by increasing the applied pressure, further intrusion occurs rapidly by filling the nearby smaller pores (Aligizaki, 2005; Kaufmann et al., 2009). The fastest intrusion rate occurs when the pore diameter decreases to a critical pore diameter (dcr) value which is also the diameter for the smallest connecting pore throat. The region showing a steep increase of the intrusion volume can be related to a connected pore network at that particular pore size. In the normalized intrusion curve, this connected porosity region is also the ratio of connected pore volume to total pore volume or the percent of total porosity. As seen in Figure 6, differentiated curves are used to indicate these parameters of critical, threshold, and connecting pore sizes. For the differentiated curves, intrusion events are identified by peaks that cover certain pore sizes. The threshold diameter (dth) is found at the initial start of a peak (reading from high pore size to low) and the critical diameter (dcr) as the pore diameter at the apex of the peak. Detailed pore size information from the normalized intrusion curves are summarized in Table 3. Each peak in the differentiated curve is characterized by its relative dcr, and dth. Those values then describe intrusion events occurring over specific pore sizes. Additional random pore filling also occurs, which accounts for the remainder of the total pore volume.
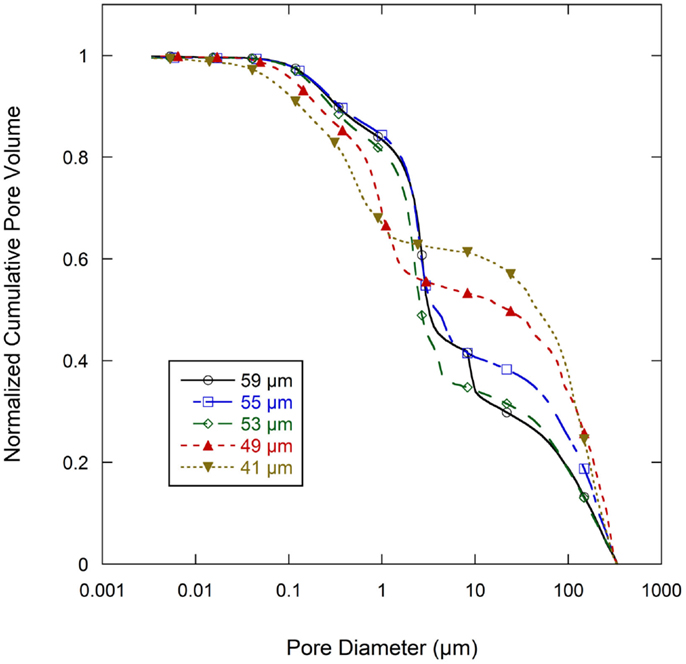
Figure 5. Slope of normalized cumulative intrusion curve for all graphite anode electrodes films.
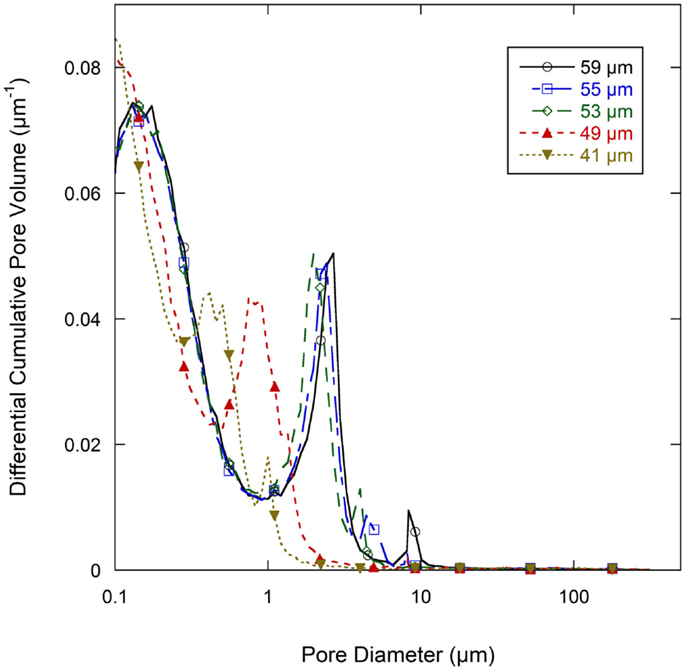
Figure 6. Differential pore volume of normalized cumulative intrusion curve (from Figure 5) for all graphite anode electrodes films.
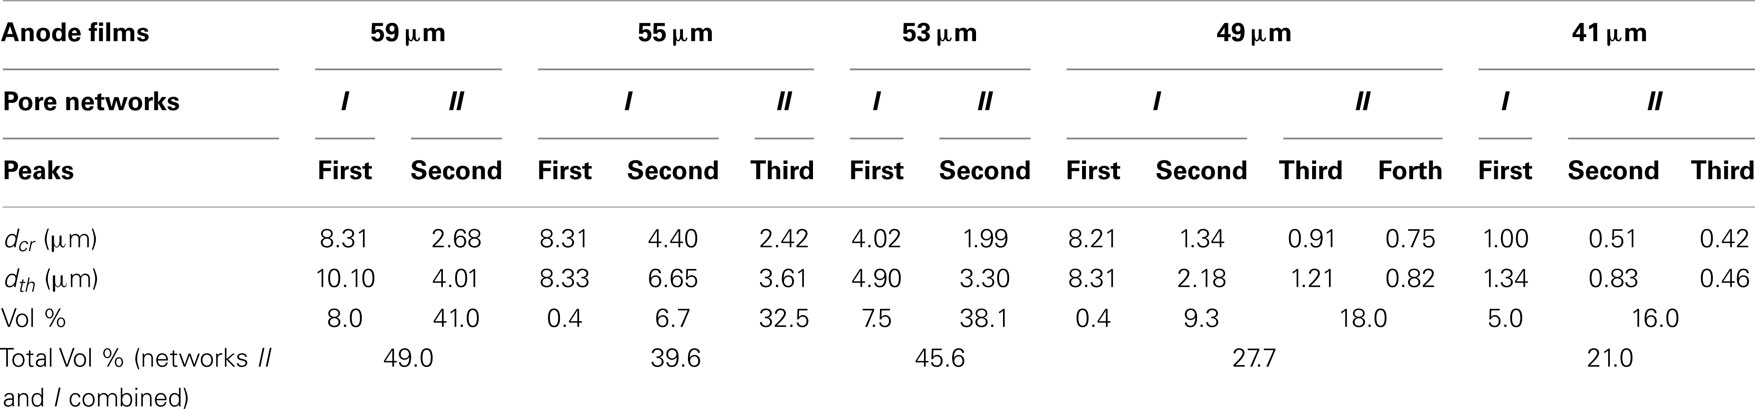
Table 3. Data summary of results from wetting balance test for all the electrode films.
As summarized in Table 3, there are two main levels of pore networks in the electrode films, denoted as network I and network II. Starting with the as-coated 59 μm film, network I accounts for 8.0% of the total pore volume, with a critical pore size (dcr) of 8.31 μm and threshold diameter (dth) of 10.10 μm. Network II accounts for 41.0% of the total pore volume, with dcr of 2.68 μm, and dth of 4.01 μm. With additional calendering, the networks are continually compressed to have smaller dcr and dth. The dth and dcr appear to develop independently. The largest pore sizes (8 μm range) are nearly eliminated upon initial calendering with only 0.4 vol % porosity remaining in that size range for Network I.
The change of the pore structures as a function of calendering is shown in Figure 7. In Network I, the threshold diameter decreased rapidly from the as-coated thickness of 59–49 μm and then leveled off with further calendering down to 41 μm. The trend for the critical diameter was similar except in the range of 55–53 μm, in which dcr has only a slight decrease from 4.40 to 4.02 μm. In Network II, both dcr and dth decrease slowly from the as-coated thickness down to 53 μm. The most dramatic change in the size of the network II occurs between 53 and 49 μm after which the network II size remains somewhat stable. The ratio of dcr/dth, which can be consider as the uniformity of the ducts, is shown in the secondary axis of the Figure 7 and shows no discernible trend as a function of calendering.
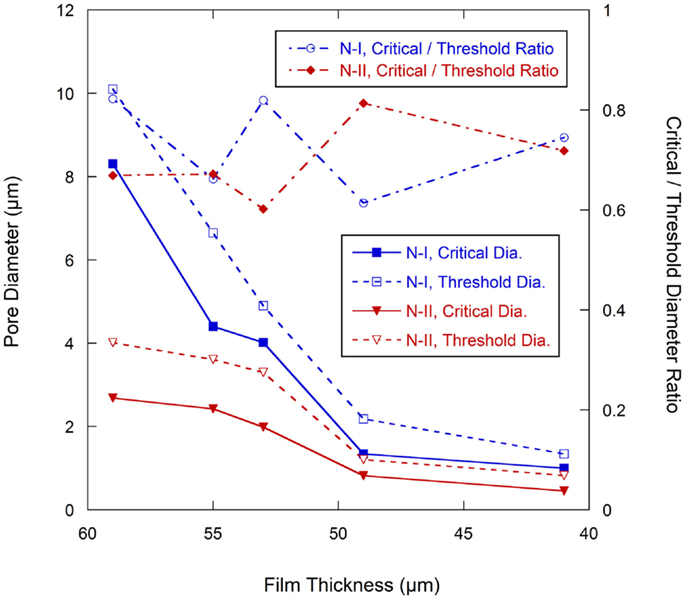
Figure 7. Pore diameter change with calendering force (Primary axis), ratio of dcr/dth change with calendering forces (secondary axis).
The pore size data were normalized to the as-coated 59 μm film thickness, as shown in Figure 8A, and plotted along with the film thickness ratio from calendering. The overall pore size ratio decreased more rapidly than the film thickness ratio. The critical diameter (dcr) for Network I had rapid decreases between the as-coated condition and the film calendered to 55 μm and again between the 53 and 49 μm films. Other regions for the critical diameter in Network I followed similar trends as the film thickness ratio. The threshold diameter (dth) for Network I decreased at a rapid rate from the as-coated thickness to the 49 μm level after which it generally followed the film thickness ratio. Network II showed a different behavior than Network I with a rapid decrease of the dcr between the 55 and 49 μm thicknesses. Both pore networks tended to track with the film thickness ratio at calendering thicknesses below 49 μm.
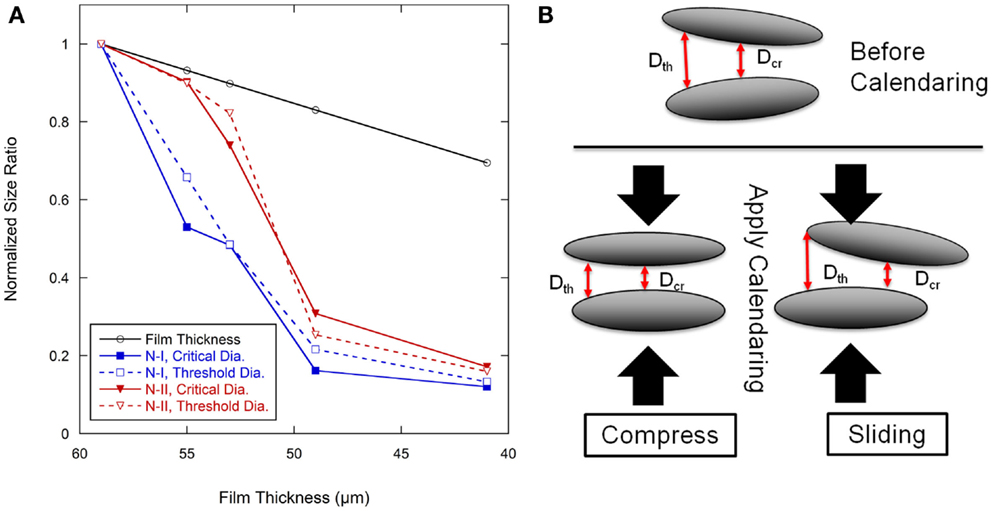
Figure 8. (A) Pore size ratio of calendered films to pore size in 59 μm baseline anode films, and film thickness change with calendering force. (B) Schematic showing the pore size and geometry change with calendering force in graphite anode films.
There are two types of movement of elliptical graphite particles when the calendering force is applied, as shown in Figure 8B. One is compressive movement where the graphite particles will move closer to the particles above and below as they become more aligned to the calendering direction. The other is a slipping movement where the nearby graphite particles will move parallel to each other which may reduce alignment. During calendering, both movements will happen. This would result in a complex development of pore structure which may account for the lack of a discernible trend in dcr/dth as shown in Figure 7. The electrolyte transport inside the porous electrode film can be considered as two parts, converging-diverging in the junction of cavities and capillary flow in the throat (Durst et al., 1987; Sochi, 2010). The latter can be quantified according to the Lucas-Washburn equation. Converging and diverging are generally affected by the cavity size and threshold diameter. A schematic diagram of one directional electrolyte transport process is shown in Figure 9. Figure 9A is a simplified description of the pore network, α and β are two kinds of cavities in two dimensions, which are created by four and three nearby graphite particles, respectively. The α cavity is connected by four throats, and β cavity is connected by three throats. When electrolyte is inputted through the left side, it will fill cavity α first by transporting through the throat, as shown in Figure 9B. This is the converging process during the electrolyte filling. After filling the cavity, electrolyte may transport along the throats in the other three directions equally. This is the diverging process. To simplify the situation, only one direction is considered here. As indicated in Figure 9C, after filling the cavity β, electrolyte may also transport along throats in other directions. The electrode pore structure can be described as a series of α–α, β–β, or α–β connected pores where larger fractions of the α–α type will tend to increase connectivity between the cavities.
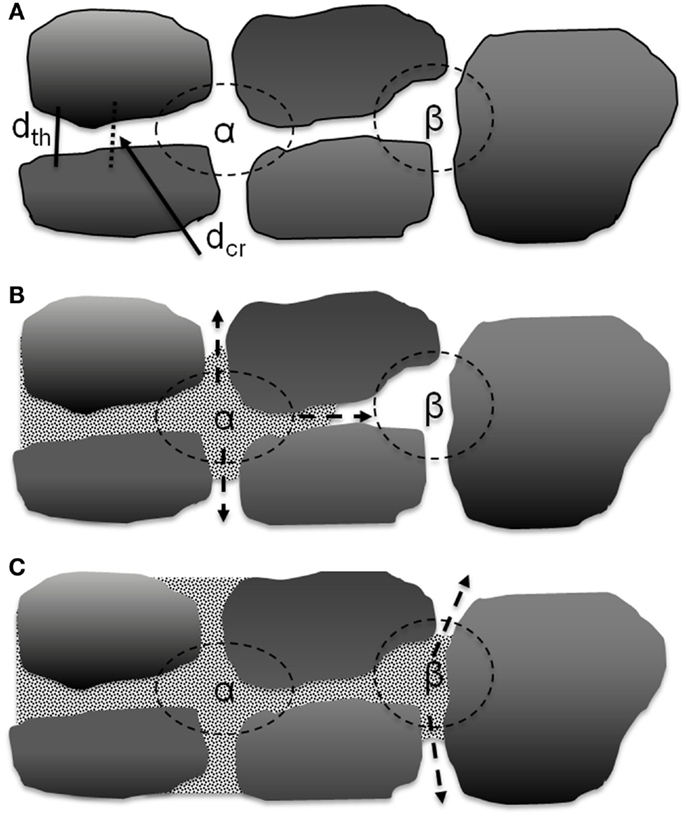
Figure 9. Scheme for electrolyte transport process in the porous medium. (A) Simplified two dimensional description of a pore network with cavity α (with 4 nearby graphite particles) and cavity β (with 3 nearby particles). (B) Electrolyte transported from left to fill cavity α with 3 possible transport direction in 2D. (C) Electrolyte fills nearby cavity β with 2 possible transport directions in 2D.
Both the SEM images and the MIP results show that the cavity size inside the electrode film decreases with calendering from 59 to 41 μm. The smaller cavity sizes would decrease the total amount of electrolyte converging into the cavities and act to increase the wetting rate. The SEM images also show that the inter-particle spacing is decreasing as a function of calendering. In terms of wetting, the inter-particle spacing is related to both the threshold diameter and the critical diameter. The combined impact of converging (based on cavity size) and diverging (based on dcr and dth) effects will determine the overall wetting rates of the film. As the film is initially calendered, the converging effects are acting to increase wetting rates (via smaller cavities) while the diverging effects are complicated by the combined effects of dcr, dth and the volume fraction of the pore networks. When the threshold diameter rate of decrease is larger than that of critical diameter rate, the pore throat is opened away from the cavities and the wetting rate in the throat will increase. When the threshold diameter rate of decrease is slower than that of the critical diameter, the pore throat opens toward the cavities, which lowers the wetting rate. Networks with a larger volume fraction will tend to dominate networks of lower volume fraction.
The pore size, normalized to the 59 μm baseline film thickness in Figure 8A, is a good indicator for the change of relative pore diameters and can help explain the converging-diverging properties and overall wetting behavior of the film. From 59 to 55 μm in Network I, the slope of threshold diameter is smaller than the critical diameter so the diverging process is increased. In Network II for the same film thicknesses, the slope is the same for both diameters so no diverging improvement occurred in that network. As a sum, the total wetting rate should increase with the modest overall increase in pore divergence, which matches our wetting balance test result. From 55 to 53 μm, the slope of the threshold diameter is steeper than the critical diameter in Network I so the diverging process has a slight decrease. In Network II for the same film thickness range, the slope of threshold diameter is smaller than the critical diameter so the diverging effect is increasing. The impact of Network I in this case is lower than Network II because the volume percent of Network I (7.5%) is much lower than that for Network II (38.1%). The slight decrease of divergence in Network I is overshadowed by increased divergence in Network II. The combined effects of Networks I and II again provide for an increase in wetting rate in spite of the decrease in overall film porosity. In the wetting balance result, wetting rate reaches a maximum value at the 53 μm film thickness. From 53 to 49 μm, the slope of threshold diameter change is steeper than the critical diameter in Network II so divergence is reduced. In Network I, the slope of the threshold diameter is smaller than the critical diameter so the diverging process is increased. Considering the volume fraction of each network, 9.3% for Network I, and 18.0% for Network II, the total diverging process should be reduced as the larger pore volume of Network II will dominate. This matches with the observed reduction in wetting rates between the 53 and 49 μm films. From 49 to 41 μm, the pore size ratio slopes for the critical and threshold diameters are almost the same as the film thickness decrease ratio. In this region, the pore network becomes more uniform with less cavity/throat structure and the wetting rates become increasingly dependent on capillary forces dictated by the inter-particle spacing.
The effects of converging-diverging features may not be obvious from SEM characterization or reliance on simple porosity comparisons. The wetting behavior of the as-coated and lightly calendered films appears to be based on the cavity structure and the evolving pore networks where the convergence/divergence mechanism dominates. Beyond a certain level of calendering, the convergence/divergence mechanism is less obvious and the wetting becomes dominated by the capillary forces inside the pore network. This may account for the initial increase in observed wetting rates with light calendering followed by a decrease in wetting rates at larger amounts of calendering. Initial calendering modifies the convergence/divergence in a way that improves electrolyte wetting even with a decrease in overall porosity of the film. Excessive calendering results in a pore structure dominated by capillary forces where lower porosity and smaller pore diameter limits the wettability of the film.
Conclusion
The wettability of graphite anode films as a function of the calendering process was investigated and related to the development of the pore structure in the electrode films. Modest calendering was shown to improve the wetting rate of anode films due to the alignment of particles and the increase in divergence within the pore networks. Calendering beyond an ideal level decreased wetting rates due to reductions in porosity and average pore diameter. A combination of convergence-divergence flow and capillary flow mechanisms determine the wetting rate of the film. Convergence-divergence dominates in the as-coated and lightly calendered conditions while capillary flow dominates at higher levels of calendering. Wetting rates generally follow the Washburn predictions as a function of pore size and porosity levels though deviations from ideal behavior were observed that indicate that the effective pore diameter used in that equation may be inadequate in describing the pore network of the electrode film.
Conflict of Interest Statement
The authors declare that the research was conducted in the absence of any commercial or financial relationships that could be construed as a potential conflict of interest.
Acknowledgments
This material was based upon work supported by the Department of Energy and Johnson Controls, Inc. under Award Number DE-EE0005500. Electron microscopy was conducted at the UW-Milwaukee Electron Microscope Laboratory.
References
Alava, M., Dubé, M., and Rost, M. (2004). Imbibition in disordered media. Adv. Phys. 53, 83–175. doi: 10.1080/00018730410001687363
Aligizaki, K. K. (2005). Pore Structure of Cement-Based Materials: Testing, Interpretation and Requirements. London: CRC Press.
Arora, P., Doyle, M., and White, R. E. (1999). Mathematical modeling of the lithium deposition overcharge reaction in lithium-ion batteries using carbon-based negative electrodes. J. Electrochem. Soc. 146, 3543–3553. doi:10.1149/1.1392512
Bae, C.-J., Erdonmez, C. K., Halloran, J. W., and Chiang, Y.-M. (2013). Design of battery electrodes with dual-scale porosity to minimize tortuosity and maximize performance. Adv. Mater. Weinheim 25, 1254–1258. doi:10.1002/adma.201204055
Dillon, S. J., and Sun, K. (2012). Microstructural design considerations for Li-ion battery systems. Curr. Opin. Solid State Mater. Sci. 16, 153–162. doi:10.1016/j.cossms.2012.03.002
Durst, F., Haas, R., and Interthal, W. (1987). The nature of flows through porous media. J. Nonnewtonian Fluid Mech. 22, 169–189. doi:10.1016/0377-0257(87)80034-4
Ebner, M., Chung, D.-W., García, R. E., and Wood, V. (2014). Tortuosity anisotropy in lithium-ion battery electrodes. Adv. Energy Mater. 4:1301278. doi:10.1002/aenm.201301278
Edwin García, R., and Chiang, Y.-M. (2007). Spatially resolved modeling of microstructurally complex battery architectures. J. Electrochem. Soc. 154, A856–A864. doi:10.1149/1.2754072
Guy, D., Lestriez, B., Bouchet, R., and Guyomard, D. (2006). Critical role of polymeric binders on the electronic transport properties of composites electrode. J. Electrochem. Soc. 153, A679–A688. doi:10.1149/1.2168049
Hautier, G., Jain, A., Chen, H., Moore, C., Onga, S. P., and Ceder, G. (2011). Novel mixed polyanions lithium-ion battery cathode materials predicted by high-throughput ab initio computations. J. Mater. Chem. 21, 17147–17153. doi:10.1039/c1jm12216a
Jannesari, H., Emami, M. D., and Ziegler, C. (2011). Effect of electrolyte transport properties and variations in the morphological parameters on the variation of side reaction rate across the anode electrode and the aging of lithium ion batteries. J. Power Sources 196, 9654–9664. doi:10.1016/j.jpowsour.2011.07.026
Jianchao, C., and Yu, B. (2011). A discussion of the effect of tortuosity on the capillary imbibition in porous media. Transp. Porous Media 89, 251–263. doi:10.1007/s11242-011-9767-0
Kaufmann, J., Loser, R., and Leemann, A. (2009). Analysis of cement-bonded materials by multi-cycle mercury intrusion and nitrogen sorption. J. Colloid Interface Sci. 336, 730–737. doi:10.1016/j.jcis.2009.05.029
Pubmed Abstract | Pubmed Full Text | CrossRef Full Text | Google Scholar
Klett, M., Giesecke, M., Nyman, A., Hallberg, F., Lindström, R. W., Lindbergh, G., et al. (2012). Quantifying mass transport during polarization in a Li Ion battery electrolyte by in situ 7Li NMR imaging. J. Am. Chem. Soc. 134, 14654–14657. doi:10.1021/ja305461j
Pubmed Abstract | Pubmed Full Text | CrossRef Full Text | Google Scholar
Kühnel, R.-S., Obeidi, S., Lübke, M., Lex-Balducci, A., and Balducci, A. (2013). Evaluation of the wetting time of porous electrodes in electrolytic solutions containing ionic liquid. J. Appl. Electrochem. 43, 697–704. doi:10.1007/s10800-013-0558-x
Lee, S.-I., Kim, Y.-S., and Chun, H.-S. (2002). Modeling on lithium insertion of porous carbon electrodes. Electrochim. Acta 47, 1055–1067. doi:10.1016/S0013-4686(01)00835-0
Mueller, T., Hautier, G., Jain, A., and Ceder, G. (2011). Evaluation of tavorite-structured cathode materials for lithium-ion batteries using high-throughput computing. Chem. Mater. 23, 3854–3862. doi:10.1021/cm200753g
Nelson, P. A., Bloom, K. G., and Dees, D. W. I. (2011). Modeling the Performance and Cost of Lithium-Ion Batteries for Electric-Drive Vehicles. No. ANL-11/32. Argonne, IL: Argonne National Laboratory (ANL).
Park, J.-K. (ed.) (2012). Principles and Applications of Lithium Secondary Batteries. Weinheim: John Wiley & Sons.
Ramadesigana, V., Northropa, P. W. C., Sumitava, D., Santhanagopalanb, S., Braatzc, R. D., Subramaniana, V. R., et al. (2012). Modeling and simulation of lithium-ion batteries from a systems engineering perspective. J. Electrochem. Soc. 159, R31–R45. doi:10.1149/2.018203jes
Sawai, K., and Ohzuku, T. (2003). Factors affecting rate capability of graphite electrodes for lithium-ion batteries. J. Electrochem. Soc. 150, A674–A678. doi:10.1149/1.1568107
Scrosati, B., and Garche, J. (2010). Lithium batteries: status, prospects and future. J. Power Sources 195, 2419–2430. doi:10.1002/adma.200903328
Pubmed Abstract | Pubmed Full Text | CrossRef Full Text | Google Scholar
Shim, J., and Striebel, K. A. (2003). Effect of electrode density on cycle performance and irreversible capacity loss for natural graphite anode in lithium-ion batteries. J. Power Sources 119, 934–937. doi:10.1016/S0378-7753(03)00235-0
Sochi, T. (2010). Flow of non-newtonian fluids in porous media. J Polym. Sci. B Polym. Phys. 48, 2437–2767. doi:10.1002/polb.22144
Song, J. Y., Wang, Y. Y., and Wan, C. C. (2000). Conductivity study of porous plasticized polymer electrolytes based on poly (vinylidene fluoride) a comparison with polypropylene separators. J. Electrochem. Soc. 147, 3219–3225. doi:10.1149/1.1393886
Tarascon, J. M., and Armand, M. (2001). Issues and challenges facing rechargeable lithium batteries. Nature 414, 359–367. doi:10.1038/35104644
Pubmed Abstract | Pubmed Full Text | CrossRef Full Text | Google Scholar
Thorat, I. V., Joshi, T., Zaghib, K., Harb, J. N., and Wheeler, D. R. (2011). Understanding rate-limiting mechanisms in LiFePO4 cathodes for Li-ion batteries. J. Electrochem. Soc. 158, A1185–A1193. doi:10.1149/2.001111jes
Vu, A., Qian, Y., and Stein, A. (2012). Porous electrode materials for lithium-ion batteries–how to prepare them and what makes them special. Adv. Energy Mater. 2, 1056–1085. doi:10.1002/aenm.201200320
Wang, M., Li, J., He, X., Wu, H., and Wana, C. (2012). The effect of local current density on electrode design for lithium-ion batteries. J. Power Sources 207, 127–133. doi:10.1016/j.jpowsour.2011.12.063
Washburn, E. W. (1921). The dynamics of capillary flow. Phys. Rev 17, 273. doi:10.1103/PhysRev.17.273
Wu, M.-S., Liao, T.-L., Wang, Y.-Y., and Wan, C.-C. (2004). Assessment of the wettability of porous electrodes for lithium-ion batteries. J. Appl. Electrochem. 34, 797–805. doi:10.1023/B:JACH.0000035599.56679.15
Xiao, Y., Yang, F., and Pitchumani, R. (2006). A generalized analysis of capillary flows in channels. J. Colloid Interface Sci. 298, 880–888. doi:10.1016/j.jcis.2006.01.005
Pubmed Abstract | Pubmed Full Text | CrossRef Full Text | Google Scholar
Yoshio, M., Brodd, R. J., and Kozawa, A. (2009). Lithium-Ion Batteries: Science and Technologies. Berlin: Springer.
Keywords: wettability, wetting rate, transport, electrode microstructure, manufacturing, lithium-ion battery, connected pore network, wetting balance
Citation: Sheng Y, Fell CR, Son YK, Metz BM, Jiang J and Church BC (2014) Effect of calendering on electrode wettability in lithium-ion batteries. Front. Energy Res. 2:56. doi: 10.3389/fenrg.2014.00056
Received: 05 October 2014; Paper pending published: 23 October 2014;
Accepted: 16 November 2014; Published online: 05 December 2014.
Edited by:
Jie Xiao, Pacific Northwest National Laboratory, USAReviewed by:
Mehmet Kadri Aydinol, Middle East Technical University, TurkeyShichun Mu, Wuhan University of Technology, China
Copyright: © 2014 Sheng, Fell, Son, Metz, Jiang and Church. This is an open-access article distributed under the terms of the Creative Commons Attribution License (CC BY). The use, distribution or reproduction in other forums is permitted, provided the original author(s) or licensor are credited and that the original publication in this journal is cited, in accordance with accepted academic practice. No use, distribution or reproduction is permitted which does not comply with these terms.
*Correspondence: Benjamin C. Church, University of Wisconsin – Milwaukee, 3200 North Cramer Street, Milwaukee, WI 53211, USA e-mail: church@uwm.edu