Thermal-hydraulic analysis of SWAMUP facility using ATHLET-SC code
 Zidi Wang
 Zhen Cao
  Xiaojing Liu
- School of Nuclear Science and Engineering, Shanghai Jiao Tong University, Shanghai, China
During the loss of coolant accident (LOCA) of supercritical water-cooled reactor (SCWR), the pressure in the reactor system will undergo a rapid decrease from the supercritical pressure to the subcritical condition. This process is called trans-critical transients, which is of crucial importance for the LOCA analysis of SCWR. In order to simulate the trans-critical transient, a number of system codes for SCWR have been developed up to date. However, the validation work for the trans-critical models in these codes is still missing. The test facility Supercritical WAter MUltiPurpose loop (SWAMUP) with 2 × 2 rod bundle in Shanghai Jiao Tong University (SJTU) will be applied to provide test data for code validation. Some pre-test calculations are important and necessary to show the feasibility of the experiment. In this study, trans-critical transient analysis is performed for the SWAMUP facility with the system code ATHLET-SC, which is modified in SJTU, for supercritical water system. This paper presents the system behavior, e.g., system pressure, coolant mass flow, cladding temperature during the depressurization. The effects of some important parameters such as heating power, depressurization rate on the system characteristics are also investigated in this paper. Additionally, some sensitivities study of the code models, e.g., heat transfer coefficient, critical heat flux correlation are analyzed and discussed. The results indicate that the revised system code ATHLET-SC is capable of simulating thermal-hydraulic behavior during the trans-critical transient. According to the results, the cladding temperature during the transient is kept at a low value. However, the pressure difference of the heat exchanger after depressurization could reach 6 MPa, which should be considered in the experiment.
Introduction
Supercritical water-cooled reactor (SCWR) is the only water-cooled reactor among the six generation IV reactors proposed by Generation IV International Forum (GIF) (Cheng et al., 2008). In the last few years, extensive R&D activities have been launched covering various aspects of SCWR (Oka, 2000; Cheng and Liu, 2008; Cheng et al., 2008). The steering committee of the SCWR system in GIF has prepared a system research plan which outlines the necessary research and development steps to enable a small SCWR prototype of a kind to be constructed and operated in 2020s (GIF, 2002). As the next step, this system research plan proposes to test a small scale fuel assembly under typical prototype conditions in a research reactor (Liu et al., 2013). Designing and licensing of such a small scale fuel assembly including the required coolant loop with supercritical water and its safety and auxiliary systems is subject of the project supercritical water reactor-fuel qualification test (SCWR-FQT) (Schneider et al., 2010). This water-cooled reactor with a core height of 60 cm enables to replace one of its assemblies with a pressure tube containing a four rods fuel bundle, to simulate a supercritical water environment at the fuel assembly (Raqué et al., 2012). The primary system pressure keeps at 25 MPa and the fissile power is 63.6 kW.
To show the feasibility of this SCWR-FQT loop, some pre-qualification work has to be performed, i.e., thermal-hydraulic and safety analysis for this system. Therefore, some phenomena should be identified and analyzed before the license issued. As it known, during the loss of coolant accident (LOCA), the pressure in the reactor system will undergo a rapid decrease from the supercritical pressure to the subcritical condition. This process is called trans-critical transients, which is of crucial importance for the LOCA analysis of SCWR. In order to simulate the trans-critical transient, a number of system codes for SCWR have been developed up to date (Fu et al., 2012). However, the validation work for the trans-critical models in these codes is still missing (Zhou et al., 2012). The test facility Supercritical WAter MUltiPurpose loop (SWAMUP) in Shanghai Jiao Tong University (SJTU) has been built to perform this depressurization transient test (Zhao et al., 2014). Some pre-test calculations are important and necessary to show the feasibility of the experiment. Furthermore, the experimental results will provide reference information for licensing SCWR-FQT.
Test Facility Description
The SWAMUP test facility, shown in Figure 1, is used to perform depressurization transient tests of supercritical water. The facility consists of the main test loop, two second water loops. The main test loop consists of a plunger pump, heat exchanger, pre-heater, mixing chamber, and the core.
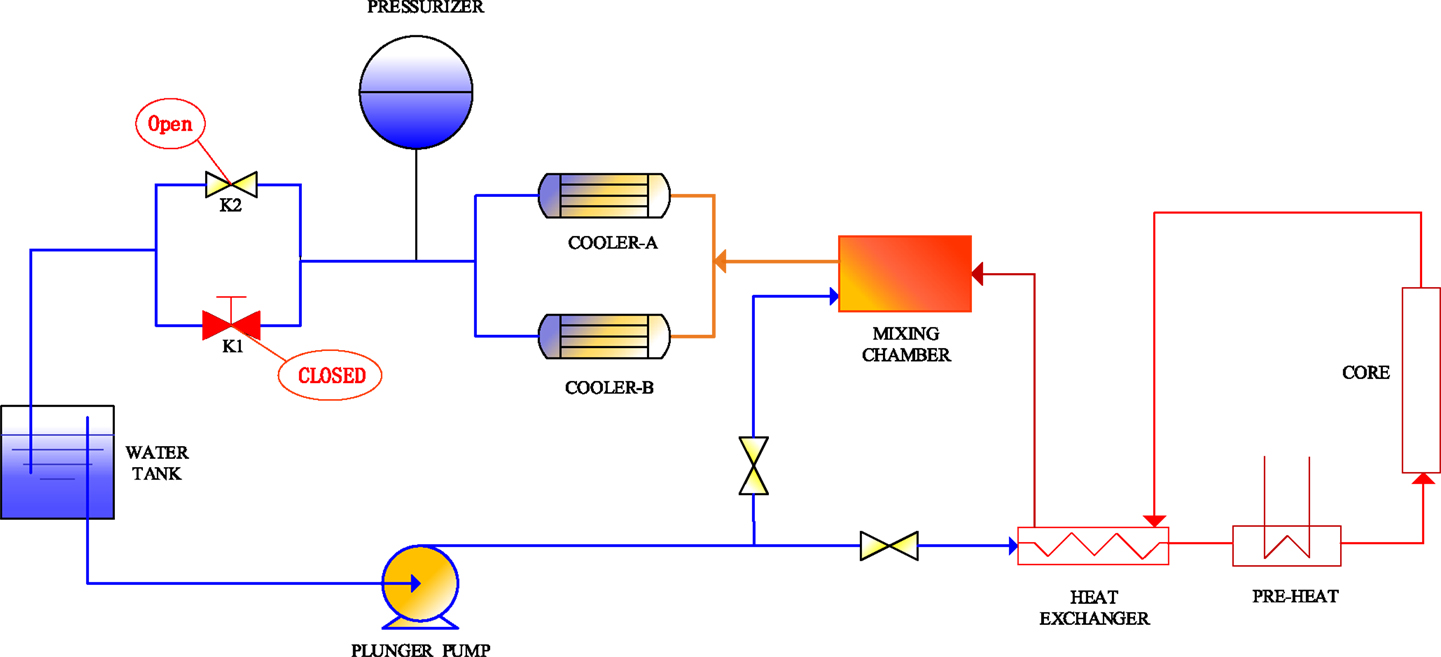
Figure 1. SWAMUP test facility.
In the test loop, the plunger pump provides a constant mass flow. After the plunger pump, the main test loop is at supercritical condition, i.e., the pressure keeps 25 MPa. Part of water flows through the bypass line and will not be heated. This is designed for rough adjustment of the flow rate through the core. The rest portion of flow first passes the heat exchanger (shown in Figure 2A) where water flow is heated by the hotter coolant which comes from the pre-heater and the core. Then the flow is heated by the pre-heater, where the water is heated up to a pre-defined temperature at inlet of the test section. Figure 2B shows the core with a 2 × 2 rod bundle heated by direct current power is inserted into test section. In the core, water can be heated to 450°C. The flow from the bypass and the core outlet are combined in the mixing box to achieve a lower temperature downstream. The two parallel heat exchangers are used to further cool down the water by the second loop which further reduces the water to 60°C before passing through two valves before the water tank. During the steady-state operation, valve K2 keeps open and valve K1 is closed. When transient starts, both valve K1 and valve K2 are opened. The valves are connected with the water tank where the pressure is 0.1MPa.
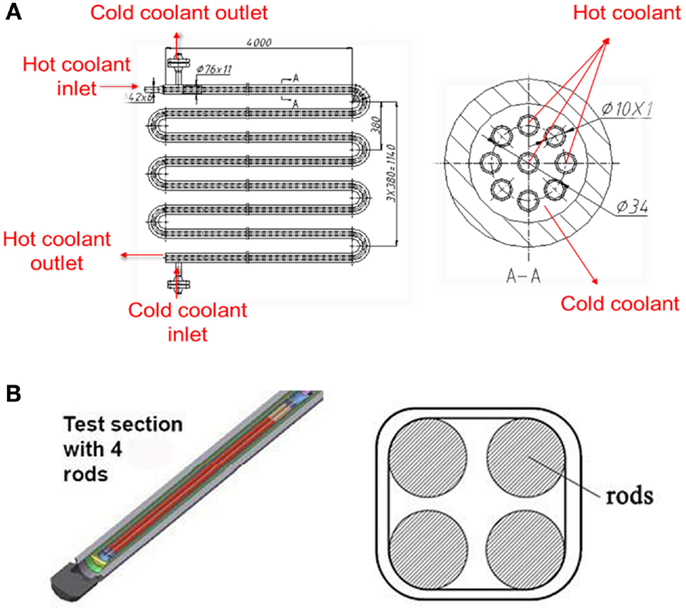
Figure 2. (A) Heat exchanger and (B) fuel rods in core.
Modeling Description
Our ATHLET input model mainly focuses on the main test loop. The thermo-fluid objects are based on five balance equations. Calculation model and key parameters during steady-state are shown in Figure 3.
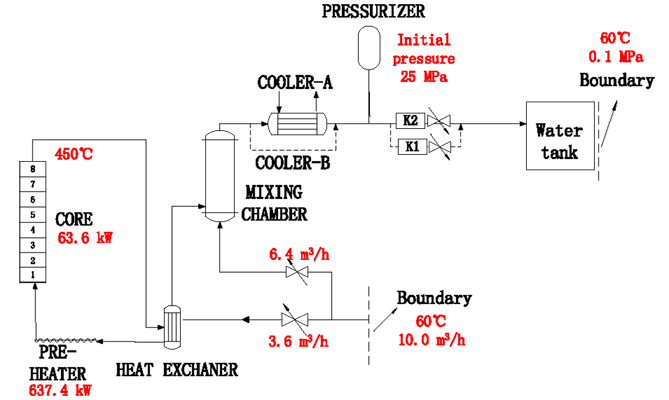
Figure 3. Model of SWAMUP test facility.
The model of SWAMUP experimental facility consists of:
• 185 volumes.
• 193 junctions.
• 37 pipes.
• 71 heat conduction volumes.
The plunger pump is represented by a boundary condition which is 60°C, 10 m3/h. A branch is used to which the test loop and bypass pipe are connected. Two valves are used to distribute the rates of mass flow. The heat exchanger is represented by two pipes which are divided into 15 control volumes each. Besides, they include many heat structures representing the wall and internals. The pre-heater is subdivided into 10 control volumes while the core consists of 8 control volumes. Moreover, the reactor core, which is represented with an electrical heater of homogeneous distribution, is also represented in the model with heat structures. Actually, the bypass mass flow is strongly mixed with the core exit mass flow in the mixture simulated as one branch. The two parallel pipes which connected to time-dependent volumes representing heat exchangers are used to further cool down. A pipe containing certain nitrogen is represented as the pressurizer whose initial pressure is 25 MPa. After that, the main loop is divided into two lines and each has a discharge valve. The water tank is simulated as a time-dependent volume which is 60°C, 0.1MPa.
Steady-State Analysis
The steady-state calculation by ATHLET-SC code takes 2000 s. After that point, the key parameters get close to the operation parameters of the facility. The result of major thermo-hydraulic parameters for the SWAMUP facility by ATHLET-SC and the design value are shown on Table 1.
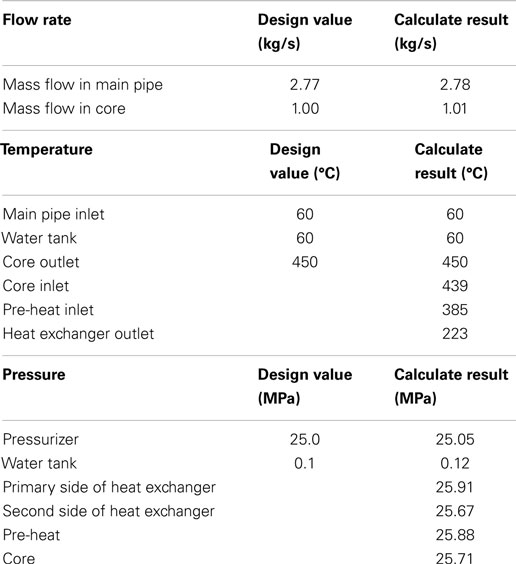
Table 1. Comparison of the steady parameters between design values and calculate results.
Figures 4A,B show the pressure and mass flow in the core as well as the temperature of core inlet and outlet we obtained by ATHLET-SC. Furthermore, Figure 4C presents the fluid temperature distribution of the test loop during the steady-state. The temperature of pre-heat inlet is about 385°C which is around the critical temperature. The temperature of core inlet is 439°C while the outlet is 450°C. The flow in the heat exchanger is in trans-critical condition.
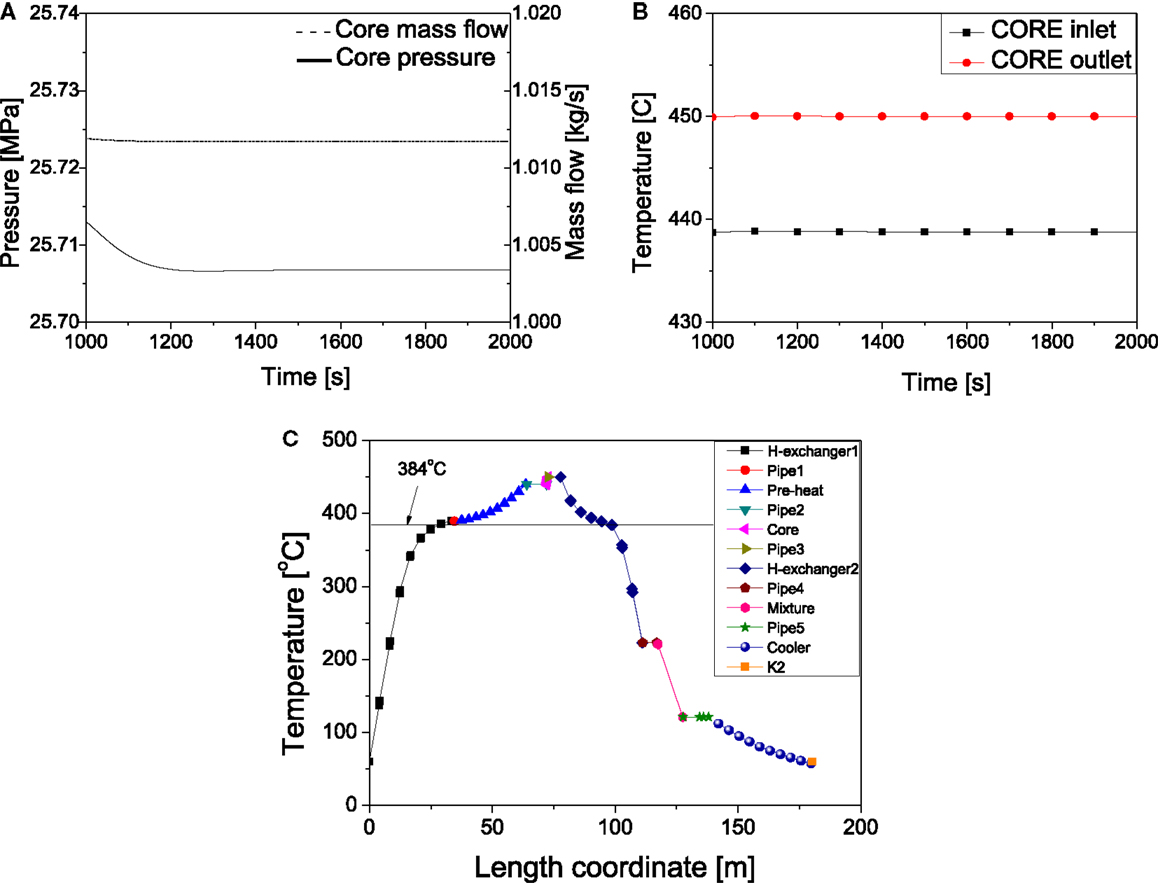
Figure 4. Operation parameters and temperature distribution of the main test loop. (A) Mass flow and pressure in core. (B) Coolant temperature of core inlet and outlet. (C) Temperature distribution of the main test loop.
Transient Analysis
To find out potential risk in the test loop is one of the primary objectives in this pre-test calculation. So the wall temperature of heating structure as well as pressure change during depressurization transient are calculated and analyzed. The transient begins at 2000 s, when the valve K1 open within 0.1 s while the valve K2 keeps open all the time, and the core power remains 63.6 kW during the whole transient.
Transient results are illustrated in Figures 5 and 6. The pressure starts to decrease since the depressurization, it reaches the critical pressure (22.05 MPa) at about 2004 s. Figure 5B shows the void fraction of the coolant in the core. It begins to decrease from the value of 1.0 when the pressure goes across the critical point, and the value is finally above 0.85. Figure 5C shows the heat transfer mode between the heat structure and the coolant in the core. It should be noted that the numbers (49, 48) in Figure 5C are illustrated in Figure 5D. As it can be seen from the figure, the coolant in the core changes into two-phase region after the pressure is under critical point. At about 2004 s, the flow pattern becomes film boiling and then it changes into transition boiling around 2060 s.
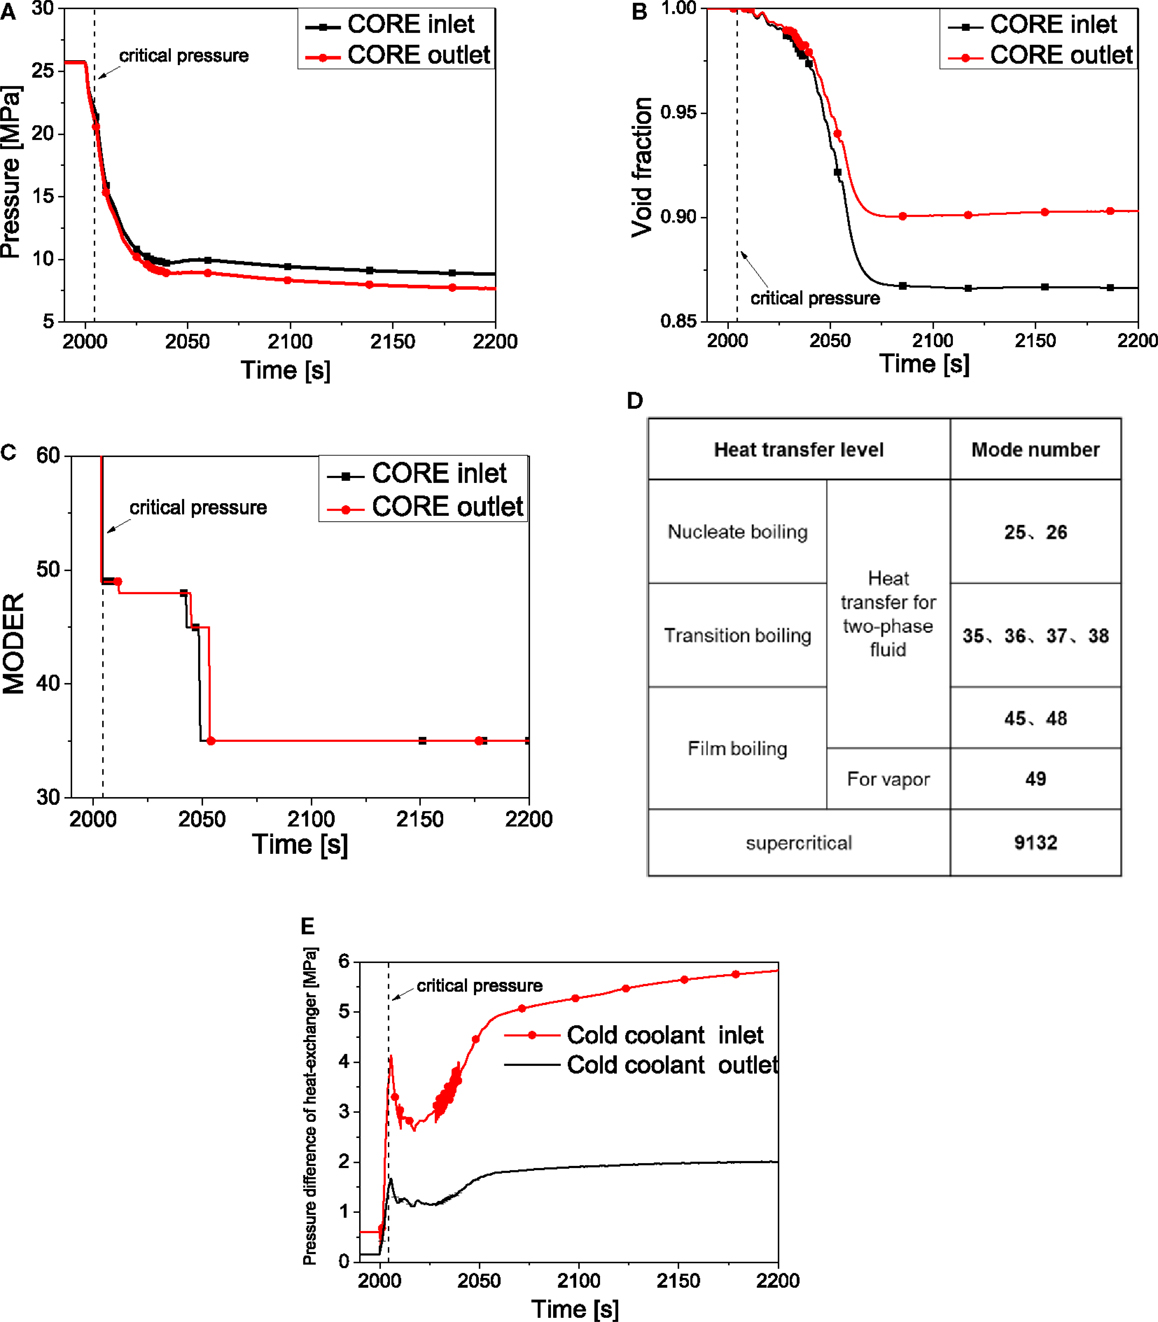
Figure 5. System behavior in transient state (I). (A) Core pressure. (B) Void fraction of coolant. (C) Heat transfer mode. (D) Heat transfer mode description. (E) Pressure difference of heat-exchanger.
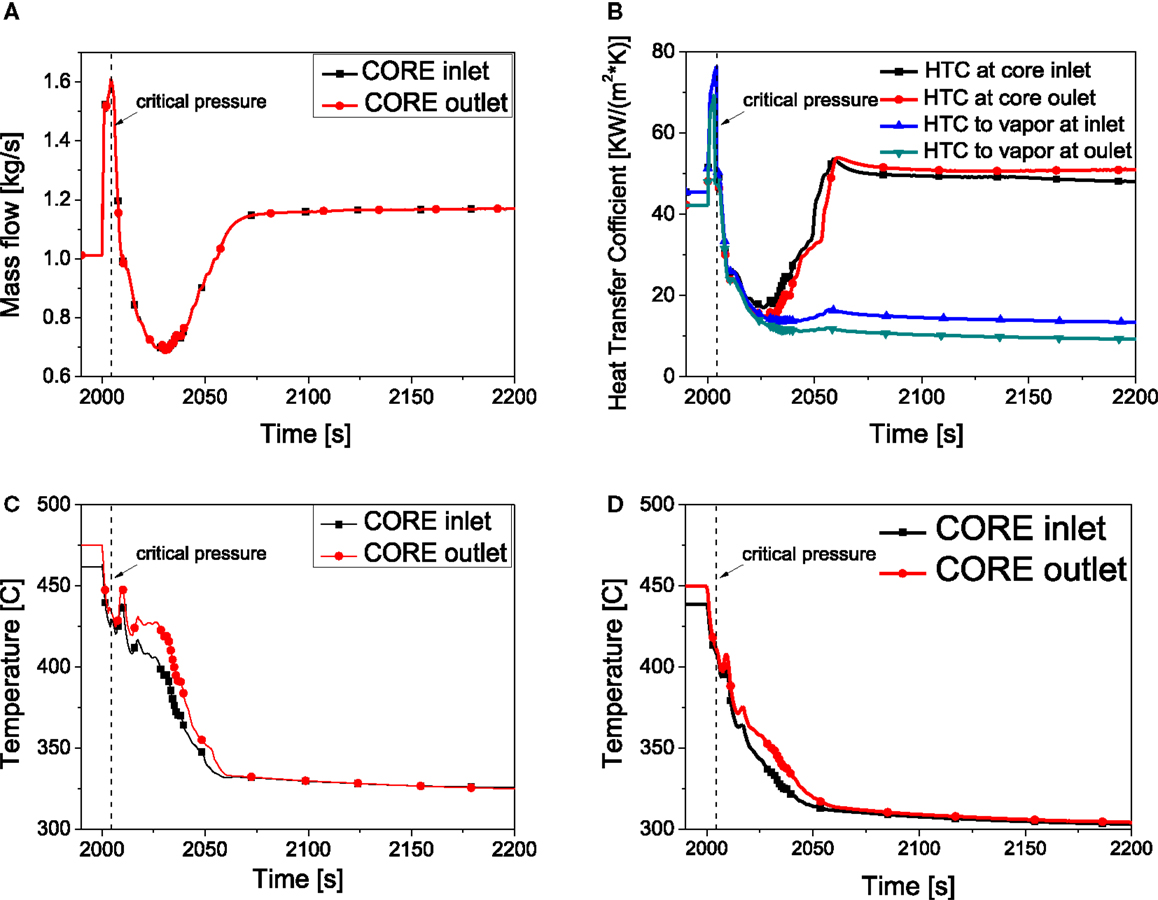
Figure 6. System behavior in transient state (II). (A) Mass flow. (B) Heat transfer coefficient. (C) Cladding temperature. (D) Coolant temperature.
Figure 5E presents the pressure difference between the heat exchanger tube side and shell side. The cold coolant inlet and cold coolant outlet of the heat exchanger is shown in Figure 2A. The pressure in the tube side of heat exchanger decreases significantly when valve K1 opens. Conversely, the pressure in the shell side decreases much more slowly. This causes the pressure difference increases at the beginning of the transient state. And it reaches maximum value around 2004 s. However, when the film boiling occurs and the flow pattern becomes two-phase flow, the flow resistance becomes very high due to the high two-phase friction factor. This causes a large pressure drop of friction in the core and pre-heater which make the pressure difference in the heat exchanger increase. It has to be pointed out that the exact time that the coolant in the core and in the pre-heater becomes two-phase is different. So there is a small decrease of pressure difference right after the critical point. The maximum pressure difference is located at the control volume N1 in Figure 3, which is the outlet of the heat exchange tube side and the inlet of the shell side. The maximum value could reach 6MPa.
As shown in Figure 6A, the mass flow in the core increases to a high value (1.6 kg/s) right after the depressurization occurs. Then the mass flow decreases from critical point due to the fast evaporation of the coolant. The mass flow in the core mainly depends on the pressure difference. So the increasing pressure difference after 2025 s which is mentioned in Figure 5E causes the recovery of the mass flow. Figure 6B describes the heat transfer coefficient in both liquid and vapor phase and heat transfer coefficient for the vapor phase only during the transient. The heat transfer coefficient increases as the pressure decreases because of the distinct increase of specific heat and mass flow near the pseudo-critical point. After that, the specific heat and mass flow decreases, so the heat transfer coefficient decreases remarkably. Before 2030 s, the heat transfer mode is film boiling in the core region (see Figure 5C), so the heat transfer coefficient for the vapor phase is almost equal to the HTC for both liquid and vapor phase. Afterwards, with the decreasing of the void fraction, the HTC of liquid plays an important role and it increases until 2060 s when the flow phase becomes transition boiling. The cladding temperature is the result of mass flow and the heat transfer coefficient. The cladding temperature presented in Figure 6C shows that it decreases before the pseudo-critical point because of the high HTC. After that, both the HTC and mass flow decrease and the cladding temperature increases. However, as the decreasing of void fraction, the flow pattern changes from vapor film boiling to two-phase film boiling which is shown in Figure 5C, the HTC increases for a short period, which causes a short cladding temperature decreasing. After that, the HTC and mass flow both decrease which makes the temperature staying at a relatively stable level. Then, with the increasing of HTC after 2030 s, the cladding temperature decreases until it becomes a steady value around 320° C.
Sensitivity Analysis
To predict the most important parameters for the trans-critical heat transfer phenomenon, the effects of heating power, depressurization rate et al. on the system characteristics are shown in this section. Some sensitivities study of the code models, e.g., heat transfer coefficient, critical heat flux (CHF) correlation are also analyzed and discussed.
Depressurization Rate
In order to realize different depressurization rate, various valve cross sectional areas are applied in this study. Table 2 summarizes the cladding temperature at various depressurization rates. Figure 7A illustrates the comparison of the core pressure under different depressurization rate by controlling the cross sectional area of the valve. As shown in Figure 7C, Under the condition of 50 and 200% of the CSA of the K2, the cladding temperature shows two peaks as the result of mass flow and the heat transfer coefficient. Compared to case 1 and case 2, the depressurization rate in case 3 is higher which causes higher mass flow at the beginning (Figure 7B), so the first peak cladding temperature is lower. After that, with the decreasing of the HTC and mass flow, another peak occurs around 2030 s. The HTC of case 3 around 2030 s is lower than that in case 1 (as shown in Figure 7D), so the second peak cladding temperature of case 3 is higher than that of case 1.
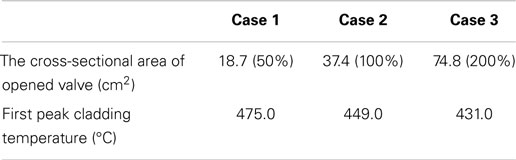
Table 2. Sensitivity analysis on depressurization rate.
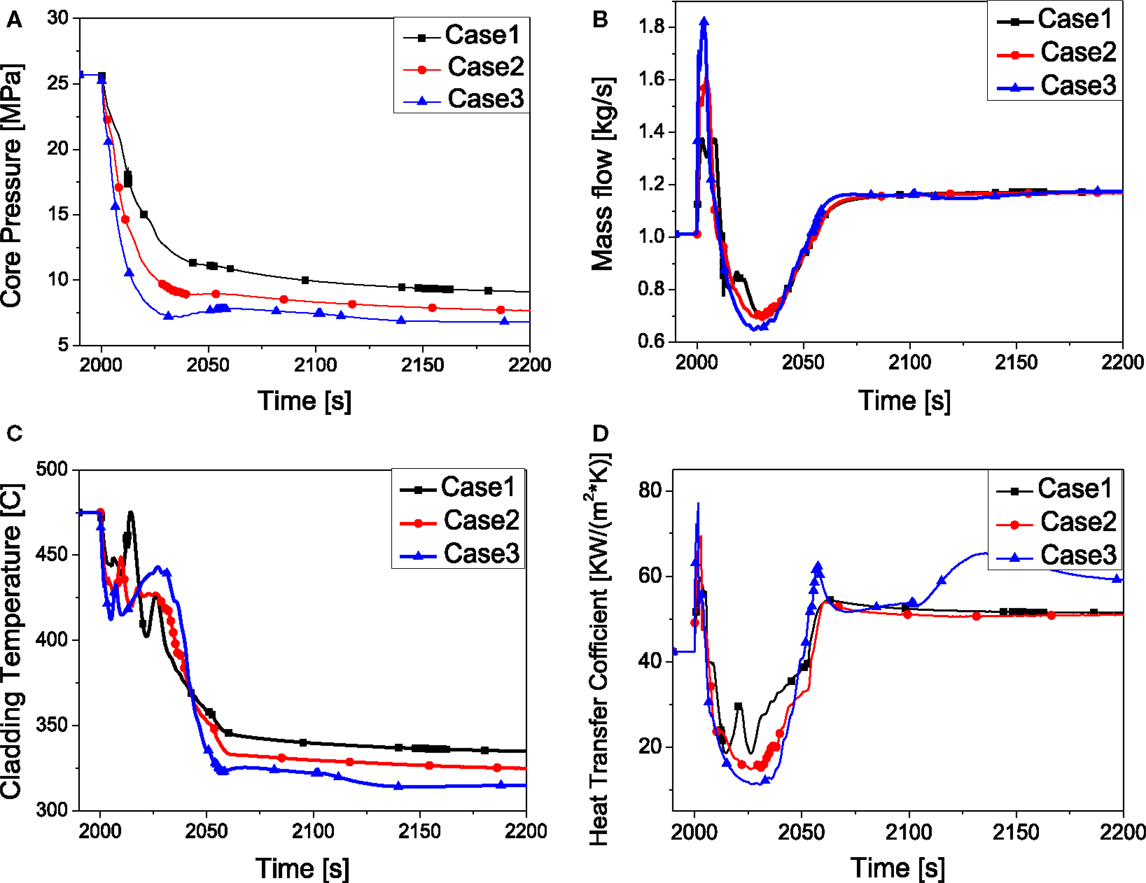
Figure 7. System behavior by the effect of depressurization rate. (A) Core pressure. (B) Mass flow. (C) Peaking cladding temperature. (D) Heat transfer coefficient.
Power Distribution
To study the effect of the power distribution in core and pre-heater, the power distribution of core and pre-heater are adjusted while keeping core outlet coolant temperature as constant (450°C). As summarized in Table 3, case 1 is the based case with core power 63.6 kW. With increase of the core power, the temperature of cladding temperature will go up. As shown in Figure 8A, it influences the heat transfer mode of the core. In case 3 (the highest core power), the flow pattern remains film boiling instead of transition boiling compared to the other two cases. Besides, in this case, the cladding temperature and the outlet temperature (Figures 8C,D) are the highest while those in case 1 are the lowest. This is mainly due to the HTC of the coolant in the core as shown in Figure 8B.
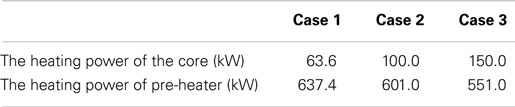
Table 3. Sensitivity analysis on power distribution.
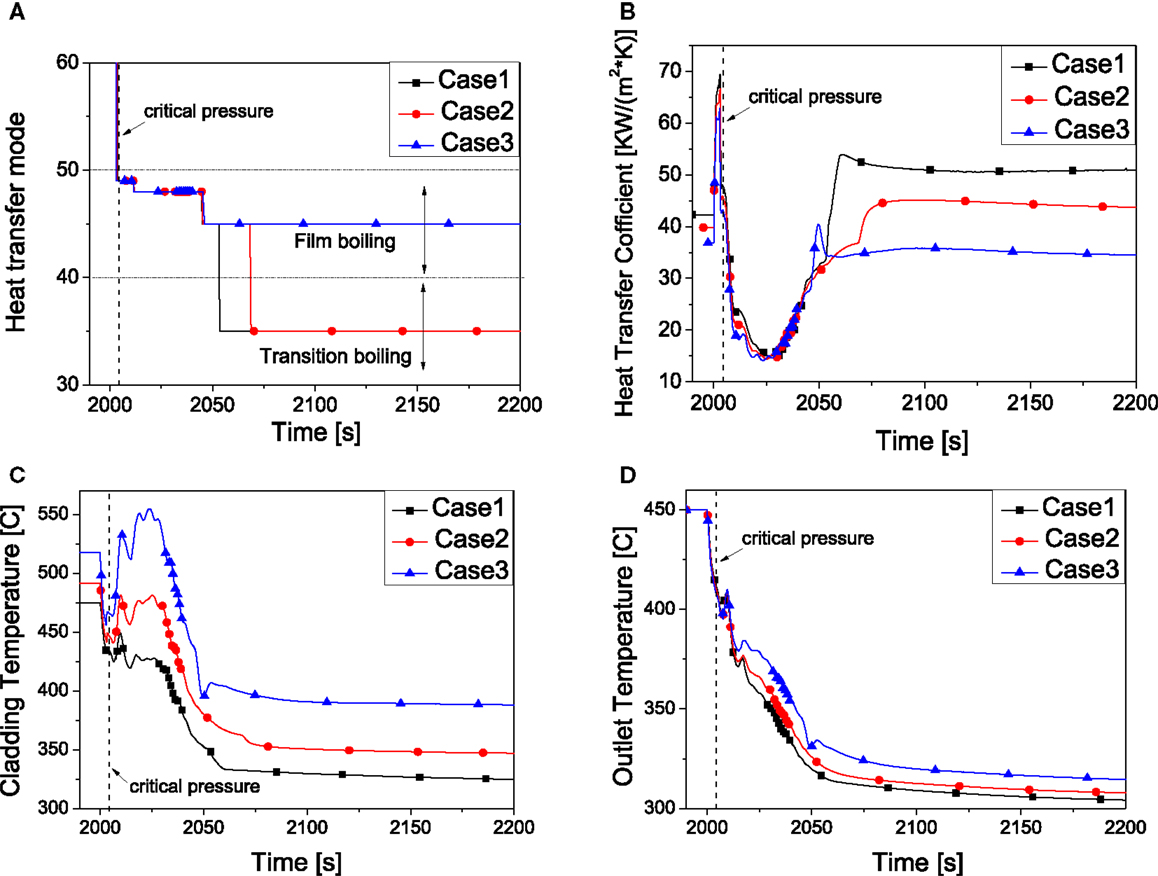
Figure 8. System behavior by the effect of power distribution. (A) Heat transfer mode. (B) Heat transfer coefficient. (C) Peaking cladding temperature. (D) Core outlet temperature.
Core Outlet Temperature
In this study, to get different core outlet temperatures, the power of pre-heater is changed while the power of core is kept as constant (63.6 kW). Table 4 summarizes the four cases with different coolant outlet temperature. As shown in Figure 9, the flow pattern of case 1 is totally different from the other three cases. In case 1, the core outlet temperature is 370°C which is in subcritical condition. During the depressurization, the heat transfer mode starts with nuclear boiling, transition boiling, film boiling, it then goes back to transition boiling and nucleate boiling (Figure 9A). CHF occurs when the heat transfer mode changes from nuclear boiling to film boiling where the heat transfer coefficient shows strong decrease. And the peak cladding temperature could reach as high as 1031°C. Different from case 1, the core outlet temperatures in the other three cases are in supercritical condition. In these cases, the CHF does not occur. This is mainly because heat transfer mode changes from supercritical condition into film boiling directly without becoming nuclear boiling during the depressurization.
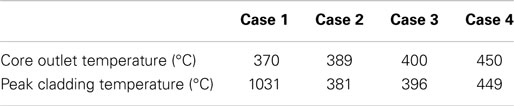
Table 4. Sensitivity analysis on core outlet temperature.
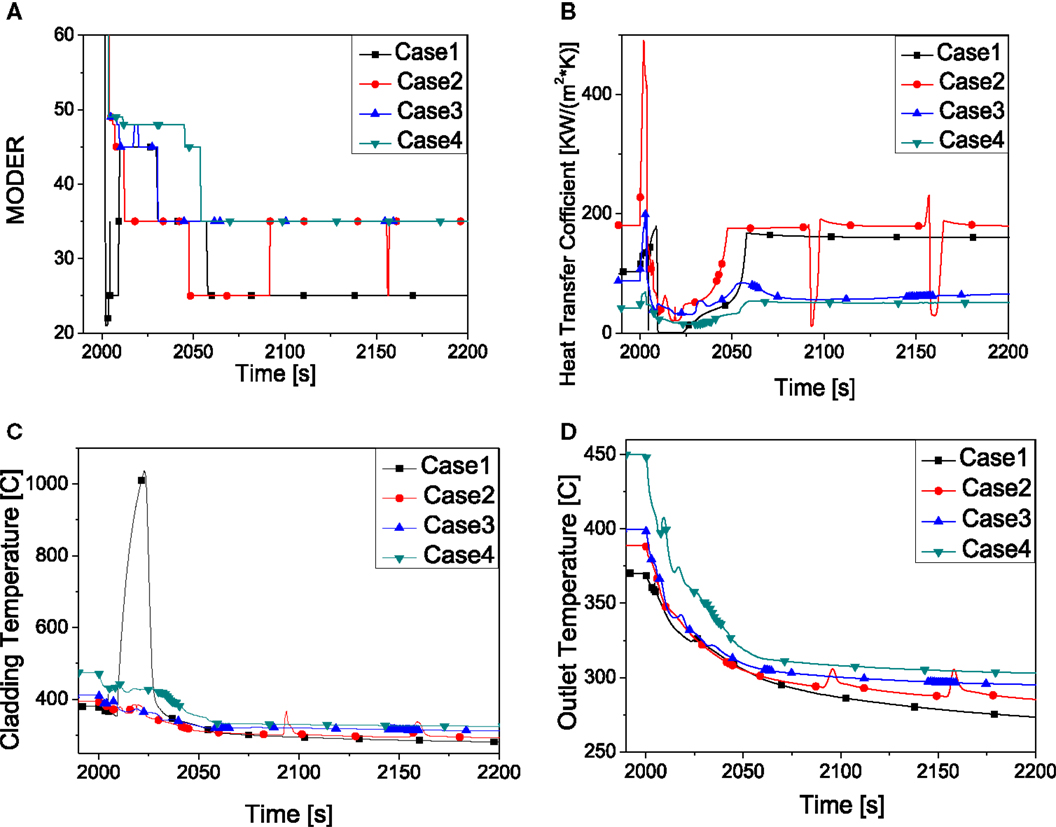
Figure 9. System behavior by the effect of core outlet temperature. (A) Heat transfer mode. (B) Heat transfer coefficient. (C) Peaking cladding temperature. (D) Core outlet temperature.
Heat Transfer Coefficient of Forced Convection to Vapor
The effects of heat transfer coefficient to vapor (Figure 10) are discussed in this section. Compared to liquid, the forced convection of heat transfer coefficient to vapor plays a more important role in film boiling. The heat transfer modes are similar but the heat transfer coefficients represent quite distinct behavior. Table 5 summarizes the peak cladding temperature at various HTC to vapor. It can be found that with increase of the HTC to the vapor, the peak cladding temperature shows a lower value. The obvious increase of the cladding temperature and the significantly decrease of core outlet temperature at the pseudo-critical temperature in case 1 are result from the decrease of HTC. After that point, with the void fraction decreasing, the vapor phase in the core becomes less and less, and the HTC begin to increase until the flow pattern changed into transition boiling after 2060 s. Finally, the temperatures of the three cases are almost the same due to the reason that the HTC of forced convection to vapor has little influence on the heat transfer behavior.
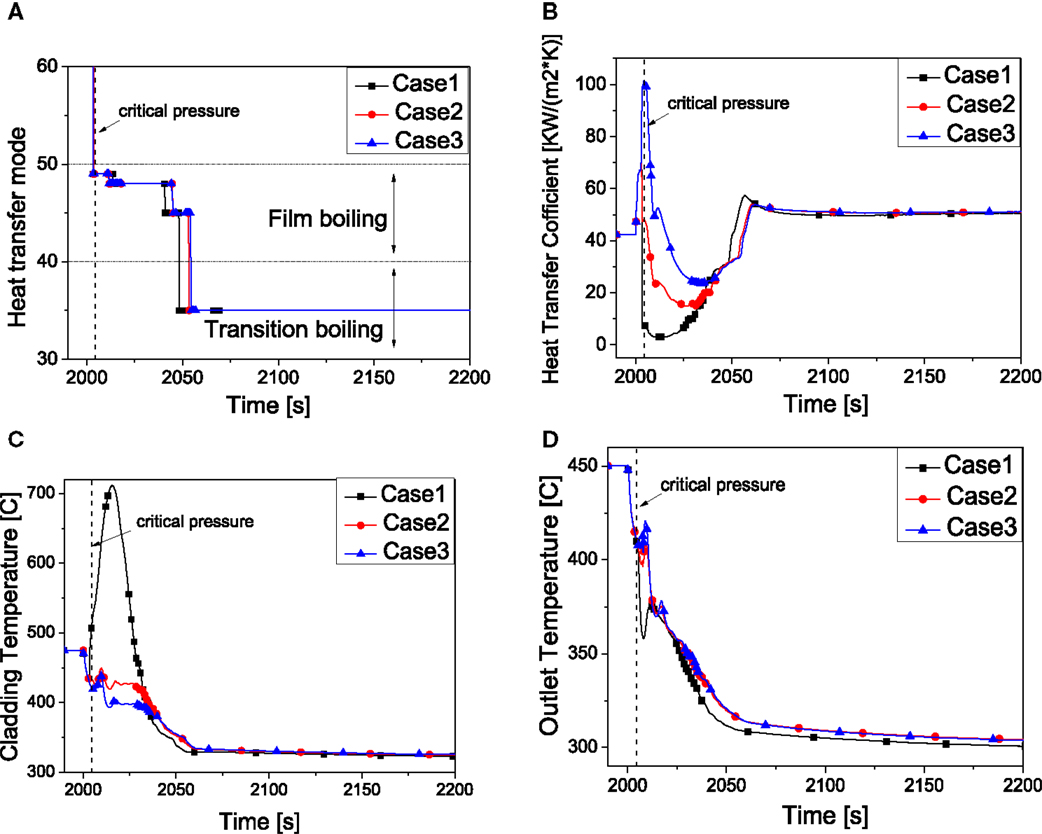
Figure 10. System behavior by the effect of HTC to vapor. (A) Heat transfer mode. (B) Heat transfer coefficient. (C) Peaking cladding temperature. (D) Core outlet temperature.

Table 5. Sensitivity analysis on HTC to vapor.
Heat Transfer Coefficient of Forced Convection to Water
As discussed above, HTC of forced convection to vapor plays a more important role than that to liquid. As shown in Table 6, it can be found that with decrease of the HTC to the water, the peak cladding temperature shows a higher value. But the difference between these three cases is very small (within 30°C). Figure 11A illustrates that the heat transfer modes of these three cases are almost the same. However, the heat transfer coefficients are quite different (Figure 11B) which make the cladding temperatures differ a lot (Figure 11C). It is clearly to see that when the heat transfer mode changes into transition boiling (after 2060 s), the limited temperature difference still exist (Figures 11C,D).

Table 6. Sensitivity analysis on HTC to water.
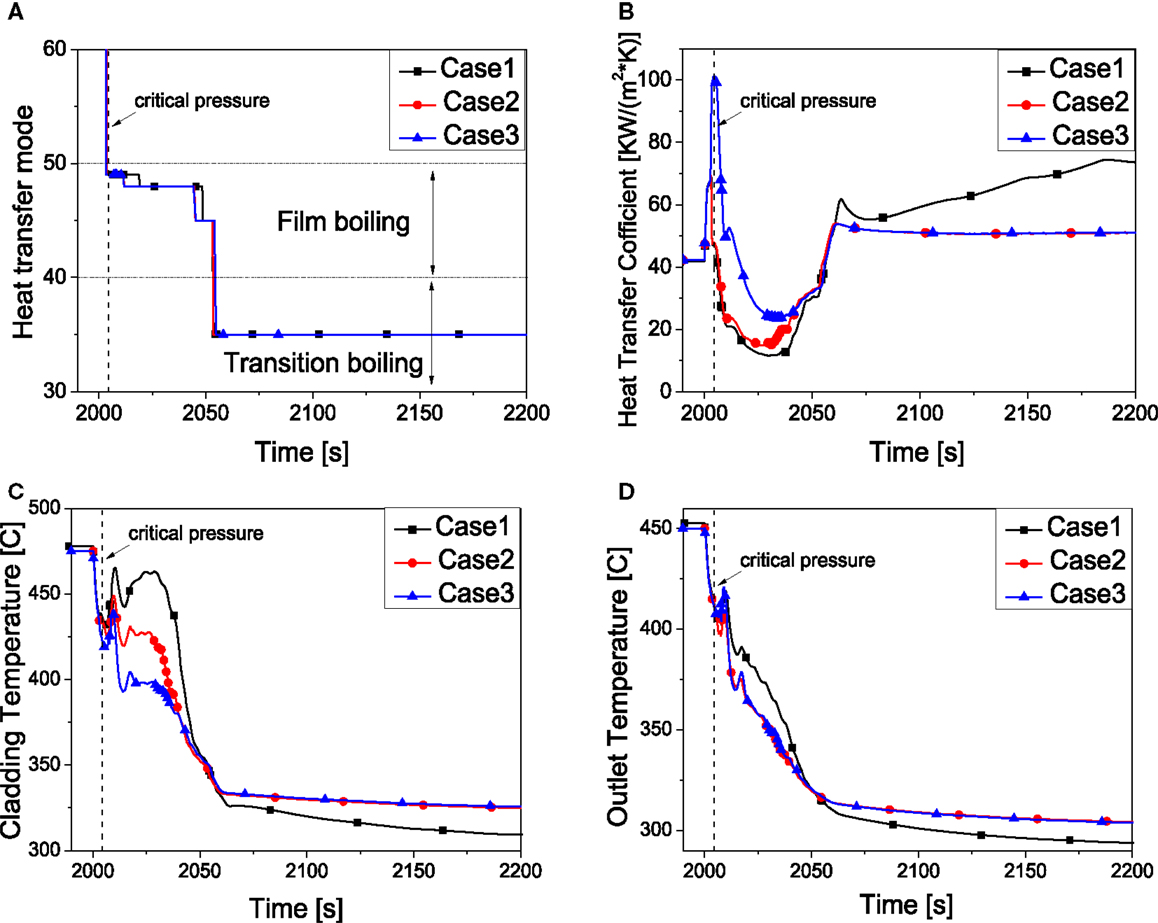
Figure 11. System behavior by the effect of HTC to water. (A) Heat transfer mode. (B) Heat transfer coefficient. (C) Peaking cladding temperature. (D) Core outlet temperature.
Heat transfer coefficient to film boiling
In this sensitivity analysis, results of different HTC to film boiling are discussed. Table 7 summarizes the peak cladding temperature at various HTC to film boiling. As shown in Figure 12, the heat transfer mode of case 1 changes to the transition boiling around 2050 s, but it soon changes back to and remains film boiling, which causes the HTC staying at a low value. The temperature behaves totally different from the other two cases. The cladding temperature increases sharply while the temperature of core outlet decreases heavily. This is mainly due to the low HTC in the core. After that point, the HTC remains at a low value while the cladding temperature stays at a very high value (475°C). The transition of the heat transfer mode gives rise to the behavior of the HTC as well as the cladding temperature.

Table 7. Sensitivity analysis on HTC to film boiling.
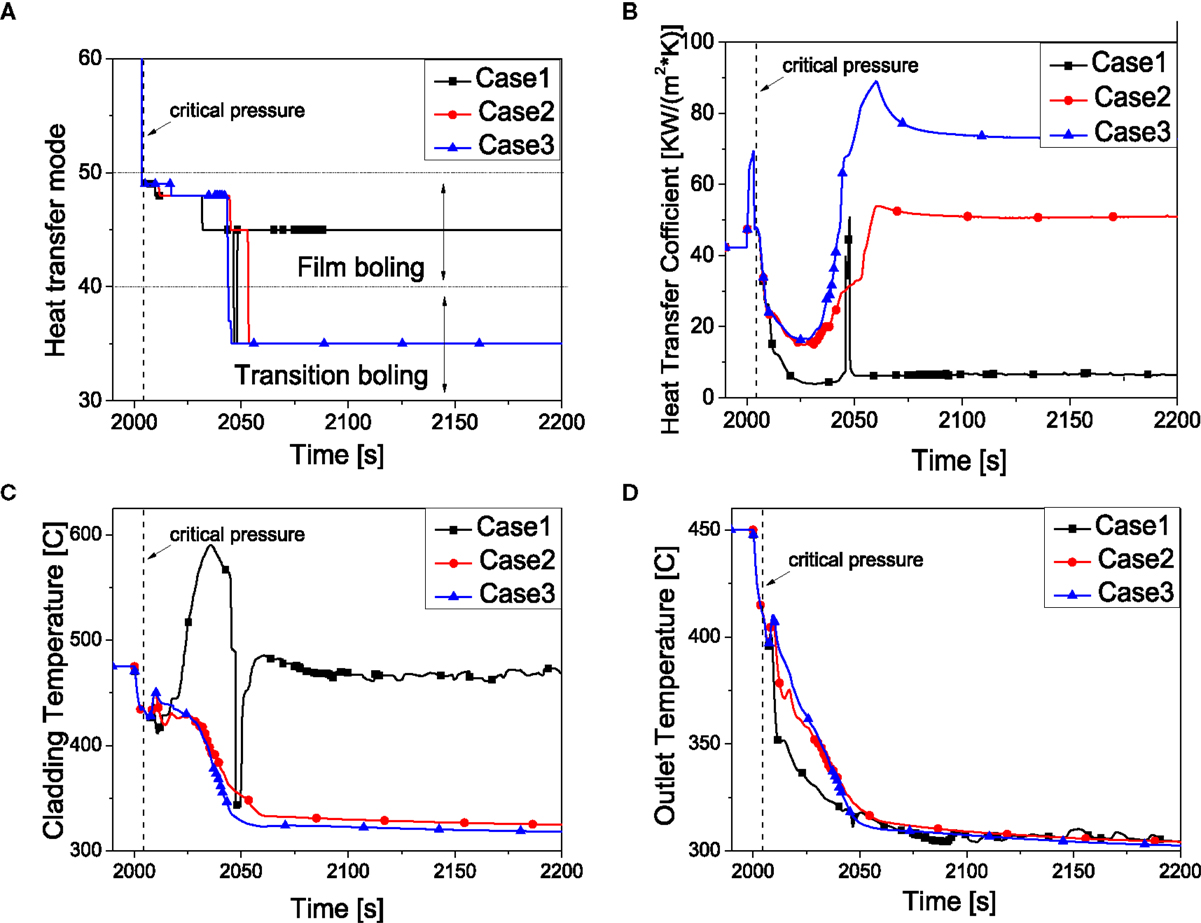
Figure 12. System behavior by the effect of HTC to film boiling. (A) Heat transfer mode. (B) Heat transfer coefficient. (C) Peaking cladding temperature. (D) Core outlet temperature.
Heat Transfer Coefficient for Critical Heat Flux
The CHF and return to nucleate boiling temperature will be increased if this multiple factor for CHF is increased. The multiple factors of these three cases are presented in Table 8. Figure 13A shows the effect on the heat transfer mode. The heat transfer mode of case 3 finally transits to nucleate boiling while the others still stay at transition boiling. Meanwhile, the HTC increases quickly in a very short time thus the cladding temperature shows a sharp decrease as presented in Figures 13B,C. The transition of the heat transfer mode makes the behavior of the HTC varied a lot as well as the cladding temperature. However, the core outlet temperature of these three cases is almost the same as shown in Figure 13D.

Table 8. Sensitivity analysis on HTC for CHF.
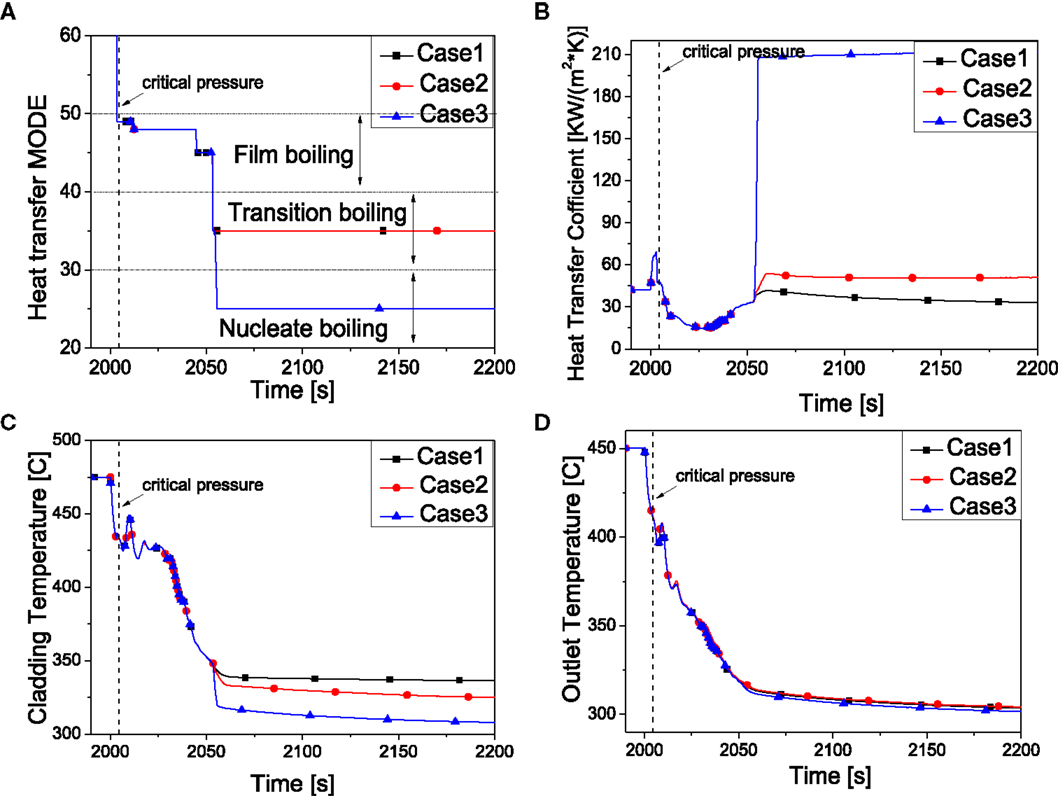
Figure 13. System behavior by the effect of HTC for CHF. (A) Heat transfer mode. (B) Heat transfer coefficient. (C) Peaking cladding temperature. (D) Core outlet temperature.
Correlations for CHF
Figure 14 compares the results by using four different correlations (Lerchel et al., 2006) (Biasi, Hench–Levy, Israel–Casterline–Matzner, Westinghouse W-3) for calculation of the CHF which are summarized in Table 9 while the former calculations are based on the Westinghouse W-3 correlation. The correlations contribute a lot to the heat transfer mode transition which is shown in Figure 14A. The result of using Hench–Levy correlation behaves similar as that of Israel–Casterline–Matzner, the heat transfer coefficient increases at a very high value (200 kW/m2K) because the flow patterns both change from transition boiling to nucleate boiling at about 2060 s. However, the HTC of Biasi correlation continues to increase for a long period, so the cladding temperature decrease slowly until it becomes a steady value when the flow pattern changes into nucleate boiling at about 2250 s. Despite the differences of CHF correlations, core outlet temperature behaves almost the same.

Table 9. Sensitivity analysis on correlations for CHF.
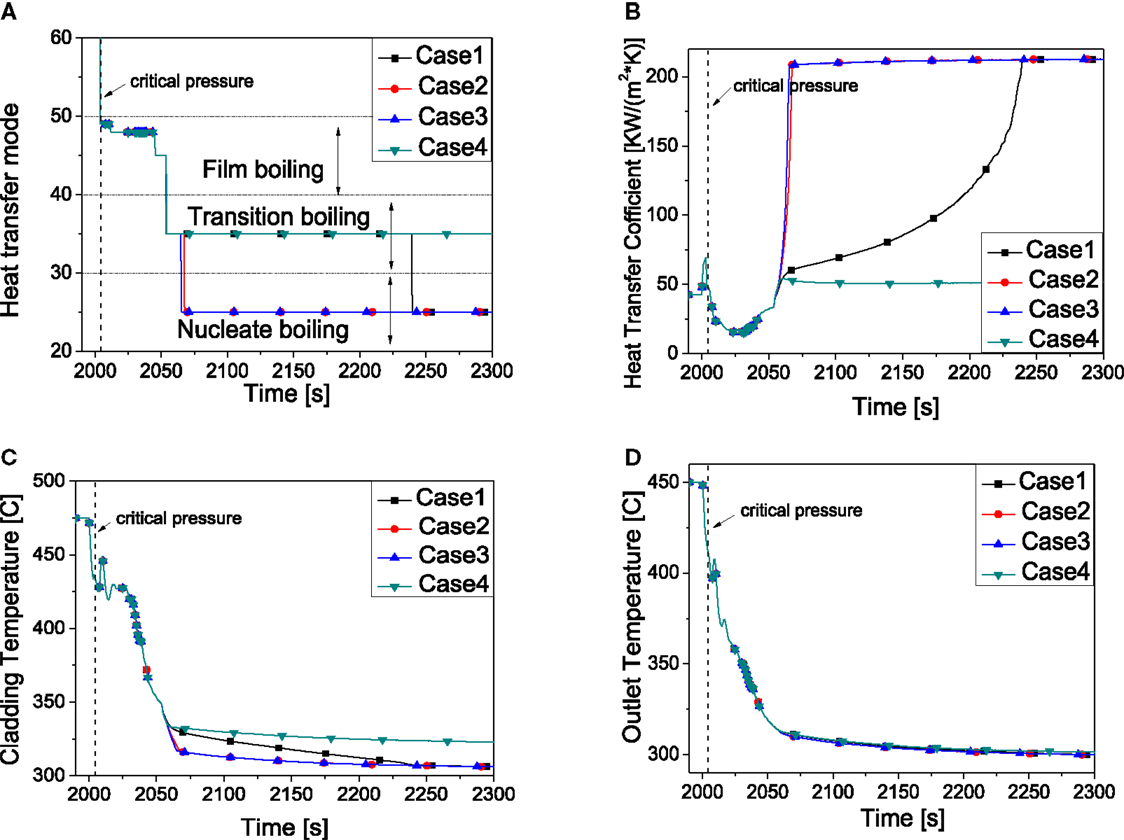
Figure 14. System behavior by the effect of correlations for CHF. (A) Heat transfer mode. (B) Heat transfer coefficient. (C) Peaking cladding temperature. (D) Core outlet temperature.
Summary and Future Work
In this paper, the modified system code ATHLET-SC is employed to analyze the thermal-hydraulic performance of the SWAMUP facility. The results achieved so far indicate that ATHLET-SC is capable to analyze the rapid depressurization transient with supercritical water. Several conclusions can be drawn:
• During depressurization transient, core pressure could be lower than critical pressure within 4.3 s. After coolant in core becomes subcritical, the heat transfer mode begins with film boiling, then transfers to transition boiling or nucleate boiling (depends on different calculation model).
• Peaking cladding temperature occurs when coolant is in film boiling region. Its value is sensitive to the heat transfer coefficient of forced convection to vapor/water and the heat transfer coefficient of film boiling, but not sensitive to HTC and correlations for CHF.
• The pressure difference of the heat exchanger could reach 6MPa during the transient state, which should be considered during the experiment.
Future work will focus on more detailed model analyzing on this result. Further code validation for ATHLET-SC will be done when experiment is finished, especially on supercritical water depressurization process.
Conflict of Interest Statement
The authors declare that the research was conducted in the absence of any commercial or financial relationships that could be construed as a potential conflict of interest.
Acknowledgments
This work is financially supported by National Natural Science Foundation of China (No.51106097). The authors would like to express thanks to GRS for providing the ATHLET code.
References
Cheng, X., and Liu, X. (2008). Research status and prospect of supercritical water-cooled reactor. Atomic Energy Sci. Technol. 2, 167–172.
Cheng, X., Liu, X., and Yang, Y. (2008). A mixed core for supercritical water-cooled reactors. Nucl. Eng. Technol. 40, 117. doi: 10.5516/NET.2008.40.2.117
GIF (2002). A Technology Roadmap for Generation IV Nuclear Energy Systems. Technical Report GIF-002-00.
Fu, S., Liu, X., Zhou, C., Xu, Z., Yang, Y., and Cheng, X. (2012). Modification and application of the system analysis code ATHLET to trans-critical simulations. Ann. Nucl. Energy 44, 40–49. doi:10.1016/j.anucene.2012.02.005
Lerchel, G., and Austregesilo H. ATHLET Mod 2.1 Cycle A, User’s Manual, GRS-p-1/Vol. 1, Rev. 4. (2006).
Liu, X., Yang, T., and Cheng, X. (2013). Thermal-hydraulic analysis of flow blockage in a supercritical water-cooled fuel bundle with sub-channel code. Ann. Nucl. Energy 59, 194–203. doi:10.1016/j.anucene.2013.03.047
Oka, Y. (2000). “Review of high temperature water and steam cooled reactor concepts,” in Proceedings of the First International Symposium on Supercritical Water-Cooled Reactors, Design and Technology. Tokyo.
Raqué, M., Vojecek, A., Hajek, P., and Schulenberg, T. (2012). “Design and 1D analysis of the safety systems for the SCWR fuel qualification test,” in Proceedings of the 9th International Topical Meeting on Nuclear Reactor Thermal Hydraulics, Operation and Safety, Kaohsiung.
Schneider, R., Schlagenhaufer, M., and Schulenberg, T. (2010). “Conceptual design of the safety system for a SCWR fuel qualification test,” in Proceedings of the 8th International Topical Meeting on Nuclear Reactor Thermal Hydraulics, Operation and Safety, Shanghai.
Zhao, M., Gu, H., and Cheng, X. (2014). Experimental study on heat transfer of supercritical water flowing downward in circular tubes. Ann. Nucl. Energy 63, 339–349. doi:10.1016/j.anucene.2013.08.031
Keywords: SWAMUP facility, trans-critical transient, ATHLET-SC code, pre-test calculation
Citation: Wang Z, Cao Z and Liu X (2015) Thermal-hydraulic analysis of SWAMUP facility using ATHLET-SC code. Front. Energy Res. 3:11. doi: 10.3389/fenrg.2015.00011
Received: 14 January 2015; Paper pending published: 03 February 2015;
Accepted: 25 February 2015; Published online: 16 March 2015.
Edited by:
Guoping Cao, University of Wisconsin-Madison, USAReviewed by:
Kun Chen, Chinese Academy of Sciences, ChinaZhangjian Zhou, University of Science and Technology Beijing, China
Copyright: © 2015 Wang, Cao and Liu. This is an open-access article distributed under the terms of the Creative Commons Attribution License (CC BY). The use, distribution or reproduction in other forums is permitted, provided the original author(s) or licensor are credited and that the original publication in this journal is cited, in accordance with accepted academic practice. No use, distribution or reproduction is permitted which does not comply with these terms.
*Correspondence: Xiaojing Liu, School of Nuclear Science and Engineering, Shanghai Jiao Tong University, 800 Dongchuan Road, Shanghai 200240, China e-mail: xiaojingliu@sjtu.edu.cn