Feasibility analysis and simulation of a stand-alone photovoltaic energy system for electricity generation and environmental sustainability – equivalent to 650VA fuel-powered generator – popularly known as “I pass my neighbour”
 Vincent Anayochukwu Ani
- Department of Electronic Engineering, University of Nigeria Nsukka, Nsukka, Nigeria
Photovoltaic (PV) power system can be used to replace wholly 650VA generator for electricity generation for household use in Nigeria. This paper presented the feasibility analysis of load data and simulation study of a stand-alone PV power system that produced the electrical needs of a household. This study is based on designing of PV energy system for household use. The patterns of load consumption within the household were studied and suitably modeled for simulation. The simulation study indicates that energy requirements to provide electricity, which is equivalent to 650VA generator for household use in Nigeria, can be accomplished by 520 W solar PV array, 2312 Ah nominal capacity battery, and a 1 kW DC/AC inverter. This would be suitable for deployment of 100% clean energy for environmental sustainability and uninterruptable power performance in the household. The results of this research show that, with a low-power consuming appliances, it is possible to meet the entire annual electricity demand of a single household solely through a stand-alone PV energy supply. Installing solar panels by most Nigerian home can significantly reduce home reliance on government power thereby reduce the strain on the current capacity of our power generation infrastructure. A detailed design and description of the system were presented in this paper.
Introduction
Nigeria, a nation of 160 million people covering a land area of over 924,000 km2 (Chendo, 2002), has very limited power coverage as well as generation capacity. Current electrification investment trends, security, and logistics issues make it unlikely that electrification by grid extension or through the creation of secondary power stations will reach more than a small minority of the rural population, at least in the next couple of decades. And due to the country’s large land area and the broad geographic dispersion of towns and villages, the cost of conventional grid power production, transmission, and distribution is extremely high. Stand-alone systems could thus be a more-cost effective electrification option in these areas (remote and non-electrified locations).
At present, many rural homes thus use fuel-powered generators. While these vary in capacity (often in line with household size or income level), the smallest and one of the most popular models is a 650VA (gasoline) generator shown in Figure 1. It has become so common in Nigerian households and small businesses that it has been nicknamed “I pass my neighbour” – a parlance derived from the fact that households acquiring one had “surpassed” in status neighbors with no electricity at all. These generator models have rated power of 520 W (650VA); a single phase, AC output of 220 V/50 Hz, and can typically power basic needs, including a television set, a fan and few lighting points – which is considerable capacity in rural areas where there is no electricity grid. The generator model is also widely regarded as a profoundly social innovation that has allowed average Nigerians access to affordable power.
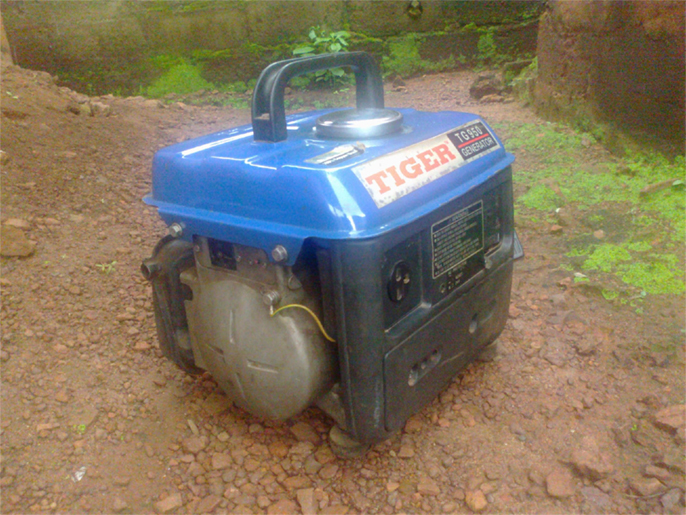
Figure 1. Picture of Tiger Generator – TG 950 650VA model.
However, these generators are associated with many problems which include among other things: considerable noise pollution and carbon monoxide (CO) emissions that can be fatal if the generators operate indoors in unventilated buildings. Less apparent, but equally worrisome is the fact that the generator emissions are rich in small particulate matter that penetrates deep into the lungs and is a cause, over time, of heart disease, stroke and respiratory illness, as well as cancers. Finally, fuel particulates contain and also a source of considerable black carbon, a “short-lived climate pollutant” which, while it only remains in the atmosphere for about a decade, has a short-term climate warming impact even higher than carbon dioxide (CO2) – per unit of pollutant emissions. The operation and maintenance of the 650VA generator also is relatively costly, typically accounting for 35% of the total cost of ownership (TCO) (Tamm et al., 2010). Thus, as the cost of renewable power declines, photovoltaic (PV) solar powered systems have the potential to become increasingly competitive with generator-powered systems for households in Nigeria.
This is particularly true in light of Nigeria’s geographical (lies approximately between 4° and 13°) and climate location. Nigeria lies along the equator and receives about 4.851 × 10¹² kWh of energy per day from the sun (Bala et al., 2000) with abundant sunshine all year round. This huge energy resource from the sun is available for about 26% of a whole day. Based on the land area of 924 × 103 km2 for the country and an average solar radiation capacity of 5.535 kWh/m2/day, Nigeria has an average of 1.804 × 10¹⁵ kWh of incident solar energy annually (Chendo, 2002). The country is thus endowed with very abundant renewable energy resources which, unlike the grid, are just as available in sparsely populated rural areas as in larger cities. Unfortunately, despite this abundance of solar energy resources, solar systems have so far found few applications in Nigeria. This may be attributed to a wide range of factors, including energy investments and market dynamics. But it is also certainly due to a lack of access to concrete and quantifiable information, both among the public and policymakers, on potential cost-efficiencies of solar systems, as well as the necessary locational and system parameters required to design energy system that would appropriately meet typical loads of rural households.
Therefore, the aim of this study is to provide a model and design guideline for a reliable, clean, and cost-efficient stand-alone PV energy system that is equivalent in power and reliability to a 650VA generator, popularly known as “I pass my neighbour.”
Methodology
In order to design a power system, one has to provide some information from the location, such as the load profile that should be met by the system (which is equivalent to the load 650VA generator should carry), solar radiation for PV generation, the initial cost of each component [PV panel(s), battery(s), and inverter], annual interest rate, and project lifetime. For us to get the accurate power profile, a question was raised to the occupant of the house: what are the times [hour(s)] when the loads are used?, and the answer to the question give us a baseline data on the household energy consumptions.
Feasibility Study of Electricity Consumption by the Household in Rural Nigerian Area
The Reference Household
From the acquired data, a profile of the household was created. This profile consists of the household load variations and electrical usage pattern within the household. Figure 2 shows the daily profile electricity consumption in a household located in the rural area in Nsukka (Enugu State, Nigeria). This household in the rural area in Nsukka is simple and does not require large quantities of electrical energy used for lightning [house lighting (four lighting bulbs; one bulb for each room including the parlor) and security lighting (two lighting bulbs; one bulb for the house frontage and another one for the toilet)] and electrical appliances (television and fan). Tables 1 and 2 show an estimation of each appliance’s rated power, its quantity, and the hours of use by the household in a single day.
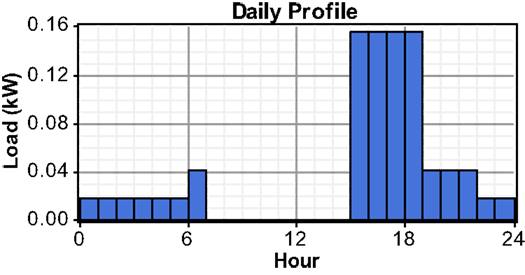
Figure 2. Daily load variation of the household.
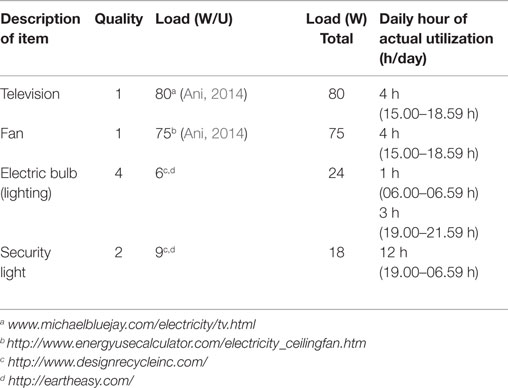
Table 1. Energy needed for the household use.
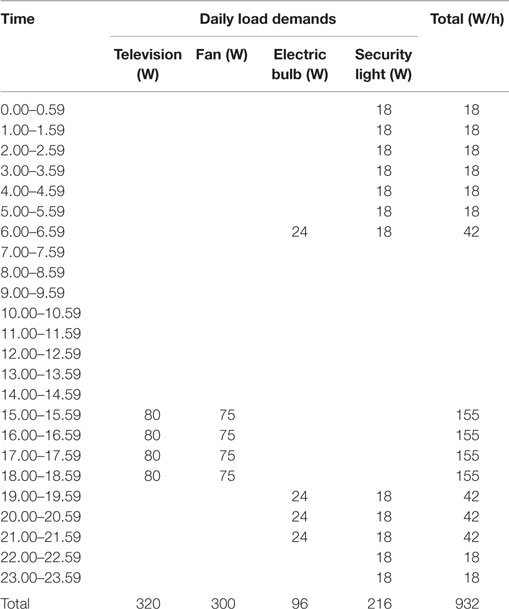
Table 2. The electrical load (daily load demands) data for the household.
The Pattern of Using Electricity Power within the Household
The lights in the household will be ON as from 6.00 a.m. (06:00 h) to 6.59 a.m. (06:59 h). By this time (6.00 a.m. to 6.59 a.m.), the occupants (parents) leave the house to the farm while the children start preparing for school. The children leave the house to school by 8.00 a.m. (08:00 h) and come back to the house by 1.59 p.m. (13:59 h). By 7.00 a.m. (07:00 h), the light will go off, since the rays of light come in through the windows during the day time [7.00 a.m. to 5.59 p.m. (07:00–17:59 h)].
As from 3.00 p.m. (15:00 h), the children will be in the parlor watching the television, and the fan will be ON till 6.59 p.m. (18:59 h). Once it is 7.00 p.m. (19:00 h), the children will go and read their books till 9.59 p.m. (21:59 h). By 10.00 p.m. (22:00 h), there will be light out and they will go to bed. The light out will be there till 6.00 a.m. (06:00 h) before the light comes in again. During the light out, the security light will be ON. Tables 1 and 2 show an estimation of each appliance’s rated power, its quantity, and the hours of use by this household in a single day.
Research Area
This research focuses on the feasibility analysis and simulation of PV power generation system for a household sited in Nsukka located in a valley with good solar energies. It is geographically located at 6°51′N latitude and 7°35′E longitude1 , 2 with annual average solar radiation of 4.920 kWh/m2/day. From the latitude (6°51′N) and longitude (7°35′E), the data for solar resource were obtained from the National Aeronautics and Space Administration (NASA) Surface Meteorology and Solar Energy website3. For this study, only solar PV technology was considered. Figure 3 shows the solar resource profile (clearness index and daily radiation) of this location. The clearness index is a measure of the clearness of the atmosphere. It is the fraction of the solar radiation that is transmitted through the atmosphere to strike the surface of the Earth. It is a dimensionless number between 0 and 1, defined as the surface radiation divided by the extraterrestrial radiation. The clearness index has a high value under clear, sunny conditions, and a low value under cloudy conditions as shown in Figure 3 as well as in Table A7 (in Supplementary Material). There are differences in daily solar radiation (increase and decrease in solar radiation) from month to month as shown in Figure 3 as well as in Table A7 (in Supplementary Material) and these differences were considered during system sizing.
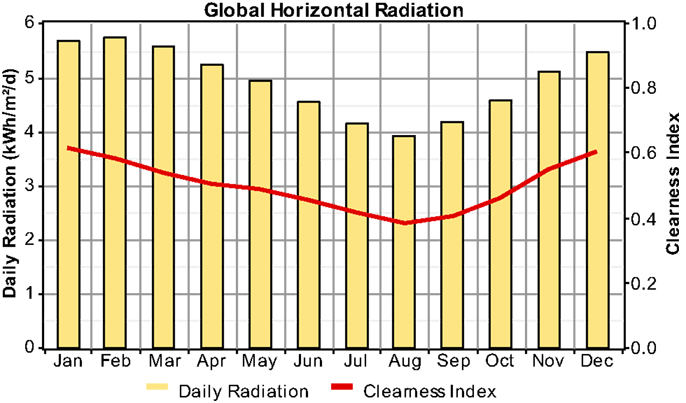
Figure 3. Graphics of monthly solar radiation profile for Nsukka.
Model of Stand-Alone Photovoltaic Energy System for the Power Generation
The energy system model to be described is the PV and battery – which are connected to the direct current (DC) bus (VDC). Only alternating current (AC) appliances are used and are connected to the load bus (IAC). An inverter (a DC-to-AC converter) is used to convert DC current (Iinv_DC) to AC current (Iinv_AC) to serve the AC load. Figure 4 shows the schematic diagram of the proposed PV-Battery system set-up. During day time (08:00–14:59 h), the PV charge the battery system, and as from 15:00 h the PV either serve the load alone and if there is extra power produced is stored in a battery system, or serve the load with the help of battery till 17:59 h when the battery will fully take over. Moreover, during night time, the battery is the only source of energy while the PV is off. This battery carries on all night till morning [18:00 h (6.00 p.m.) till 7:59 h (7.59 a.m.)] when the PV will start to charge the battery again.
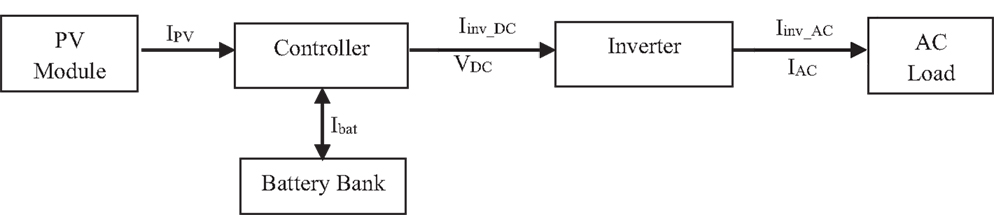
Figure 4. Model of the proposed PV-battery system (Ani and Ani, 2014).
Components System
The data for the components system (PV, battery, and inverter) are shown in Table 3.
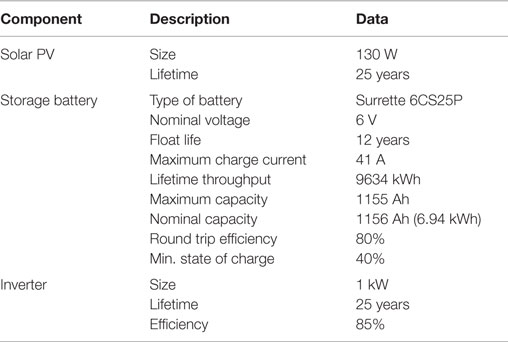
Table 3. Data for components system – solar and its balance of system (BOS) components.
Conversion of Volt-Amps to Watts
The conversion of VA to W is governed by the equation
where PF is the power factor (0.8).
From the Eq. 2 above, the 650VA generator was converted to read in Wattage
Therefore, in equivalent 650VA is 520 W.
From Table 4 when calculated, 4 numbers of 130 W PV panel is equivalent to TG 950 rated 520 W (650VA) generator.
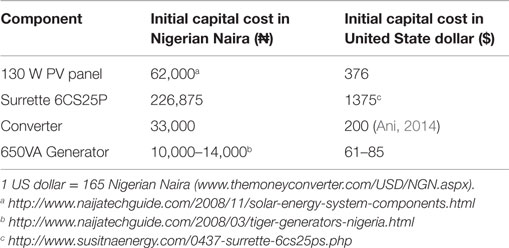
Table 4. Capital cost of the energy system component.
Equivalent of Kilo-Volt-Amps to Kilo Watts
Therefore, 650VA = 0.65 kVA; and 520 W = 0.52 kW
System Economics and Constraints
The capital costs for the PV module and the generator are based on quotes from PV system suppliers in Nigeria4. These costs are estimates based on a limited number of internet enquiries and prices conducted as at 19th of August, 2014. They are likely to vary for the actual system quotes due to many market factors. The figures used in the analysis are therefore only indicative. Table 4 shows the cost of the energy system component both in US dollar ($) and Nigerian Naira ( ) using the equivalent as 1 US Dollar ($) equal to 165 of Nigerian currency. The replacement costs of equipment are estimated to be 20–30% lower than the initial costs, while the maintenance costs are estimates based on approximate time required and estimated wages for this sort of work in a remote area of Nigeria. At present, a liter of premium motor spirit (PMS) for running a generator (commonly called petrol) is sold at $0.8/l.
The project lifetime is estimated at 25 years. The annual interest rate is fixed at 6%. There is no capacity shortage for the system and the operating reserve as a percentage of hourly load was 10%. Meanwhile, the operating reserve as a percentage of solar power output was 25%. Operating reserve is the safety margin that helps ensure reliability of the supply despite variability in electric load, and solar power supply.
Configuration and Simulation of Stand-Alone Photovoltaic Energy System
The selection of components of energy system is done using Hybrid Optimization Model for Electric Renewables (HOMER) design software developed by the National Renewable Energy Laboratory, accurate enough to reliably predict system performance. HOMER is an optimization model, which performs many hundreds or thousands of approximate simulations in order to design the optimal system. The system configuration is analyzed for various PV array sizes to operate in line with the storage (battery) system. The network architecture for the HOMER simulator of the completed stand-alone PV energy system and 650VA generator can be seen in Figures 5 and 6, respectively.
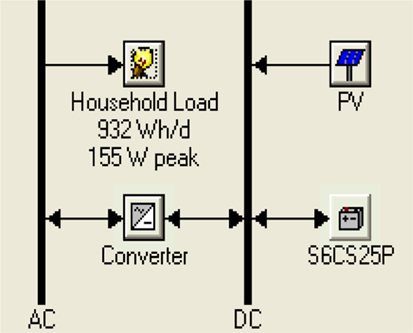
Figure 5. The network architecture for the HOMER simulator (0.52 kW PV energy system).
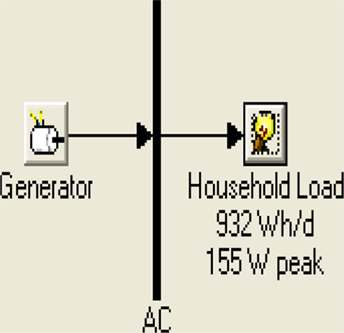
Figure 6. The network architecture for the HOMER simulator (650VA generator).
The energy consumption of the household is 932 Wh/day with a 155 W peak load demand, and the stand-alone PV energy system configured consists of 0.52 kW solar PV array, 2 unit of Surrette 6CS25PS Battery, and a 1 kW DC/AC inverter, as shown in Figure 5.
Results Analyses
An energy system is considered as an optimal solution for any particular household if it meets the required loads of the household at minimum total economic cost (NPC) and minimum adverse (little or no emissions) environmental impact. Thus, the simulation results are collated and classified according to these three major factors.
1. Electric energy (kilowatt hour) generated
2. Total economic costs
3. Pollutant emission produced.
Electric Energy Generated
Electricity Production
Energy from PV is greatly dependent on the availability of solar radiation and it differs from month to month as shown in Figure A5 (in Supplementary Material) as well as in Table A5 (in Supplementary Material); and with these differences, excess electricity were observed in the months of January, February, March, April, May, October, November, and December as shown in Figure A5 (in Supplementary Material), whereas a generator can provide energy at any time and it is the same from month to month as shown in Figure B3 (in Supplementary Material). The PV array in this household generates 754 kWh of electricity per year which effectively powers the load demand of 340 kWh/year as shown in Table 5, and the electrical production of PV energy system is shown in Figure A2 (in Supplementary Material) as well as in Figure A5 (in Supplementary Material); whereas the 650VA generator produces 911 kWh of electricity per year and supplies to the load demand of 340 kWh/year with 571 kWh of excess electricity per year as shown in Table B1 (in Supplementary Material), and the electrical production of 650VA generator is shown in Figure B2 (in Supplementary Material) as well as in Figure B3 (in Supplementary Material).
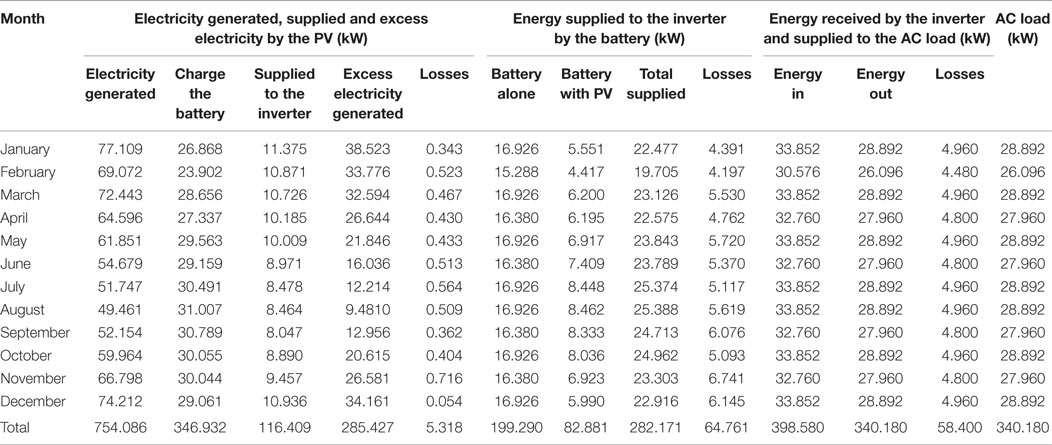
Table 5. Simulation results of electricity production, battery charge, supply, excess, losses, and consumption (kWh/year).
Losses from Balance of System Components
A battery is used to store excess energy for later use. The conversion efficiency of batteries is not perfect and energy is usually lost as heat during chemical reaction (discharging or re-charging). Also, the amount of energy that will be delivered from the battery is managed by the inverter. The inverter connects directly to the battery bank and converts the DC electrical energy from the battery bank to AC electrical energy, which is the energy that most residential homes use. During the conversion, energy is also lost. Other losses, such as PV panel combination, were calculated and the amount of energy that is lost from the system was tabulated (Table 5).
The Battery state of charge and inverter output are shown in (Figure A3 as well as in Table A3) and (Figure A4 as well as in Table A6), respectively, in Supplementary Material.
Excess Electricity
A single source renewable usually leads to component over-sizing (Bagul et al., 1996). Due to the variable nature of the energy source, one of the most expensive aspects of a PV power system is the necessity to build in system autonomy to provide reliable power during periods of adverse weather. This is accomplished by over-sizing the PV array and enlarging the battery storage, the two most costly system components as shown in Table 4.
The designed system is over-sized to be able to meet the given loads in all the months, which lead to excess electricity, and increase in the operating and life cycle costs as shown in Tables 5 and 6, respectively. The excess electricity occurs in all the months due to system over-sizing, but most noticeable in the months of January, February, March, April, May, October, November, December, and few days in September but occur most in January [as can be clearly seen in Figure A2 (in Supplementary Material) as well as in Figure A5 (in Supplementary Material)] when the energy generated by the solar energy system are at the highest (Table A5 in Supplementary Material). During these months, the PV produce excess electricity and the battery is fully charged and rarely supply to the load except by night and on the days (in rare cases) of adverse weather, as can be seen in Figure 7. On the other hand, during periods (months of June, July, and August) of adverse weather as shown in Figure 8, the PV produce less electricity but supplies to the load together with the battery at certain time of the day, and by night, the battery supplies alone to the load. The calculated excess electricity can be used to predict the type of electrical equipment that can be added as a load to minimize the excess electricity, particularly in the daytime.
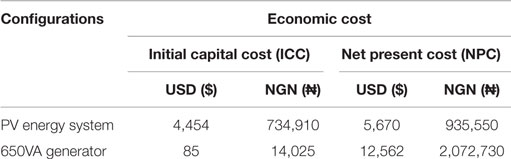
Table 6. Simulation results of economic cost.
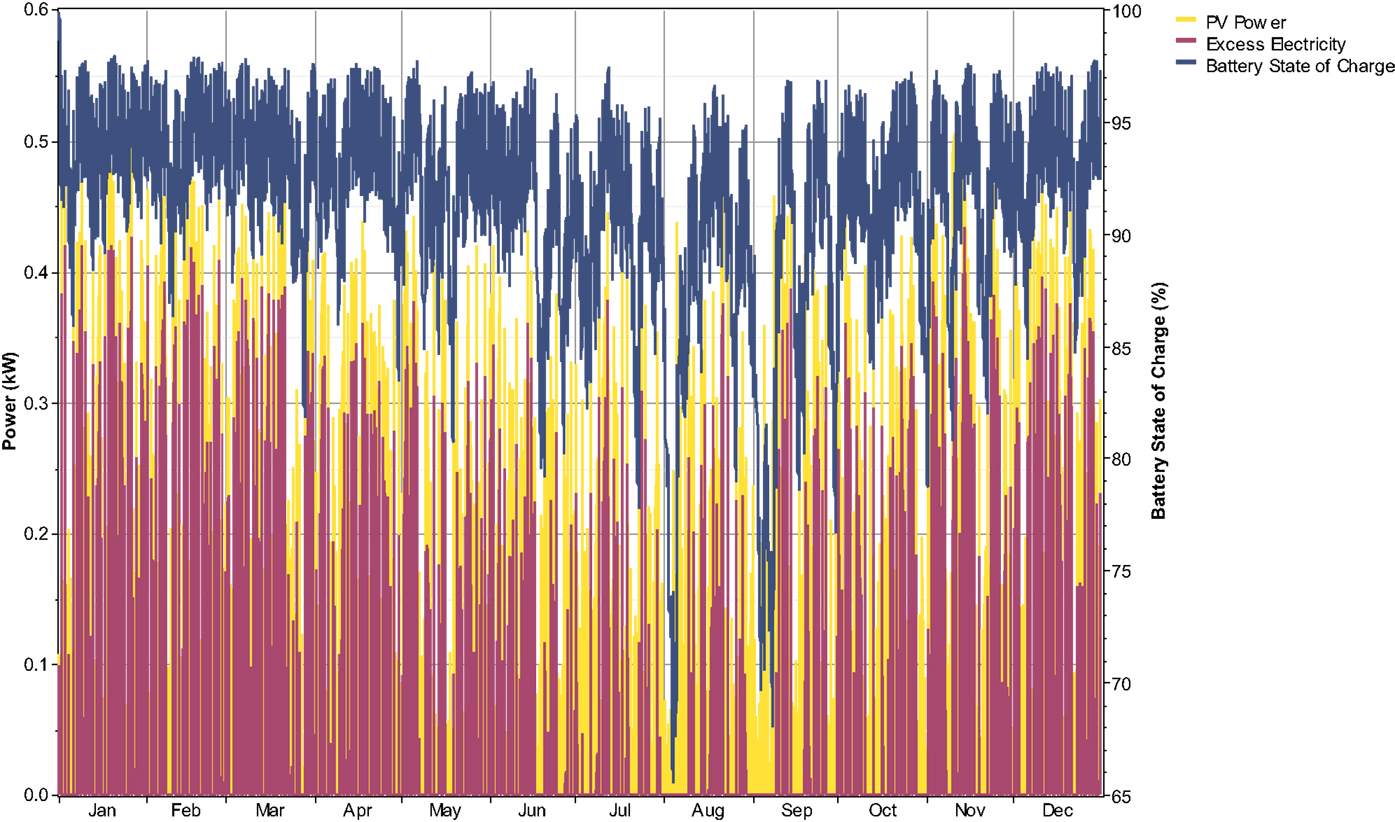
Figure 7. Comparison of three variables (PV power, excess electricity, and battery state of charge).
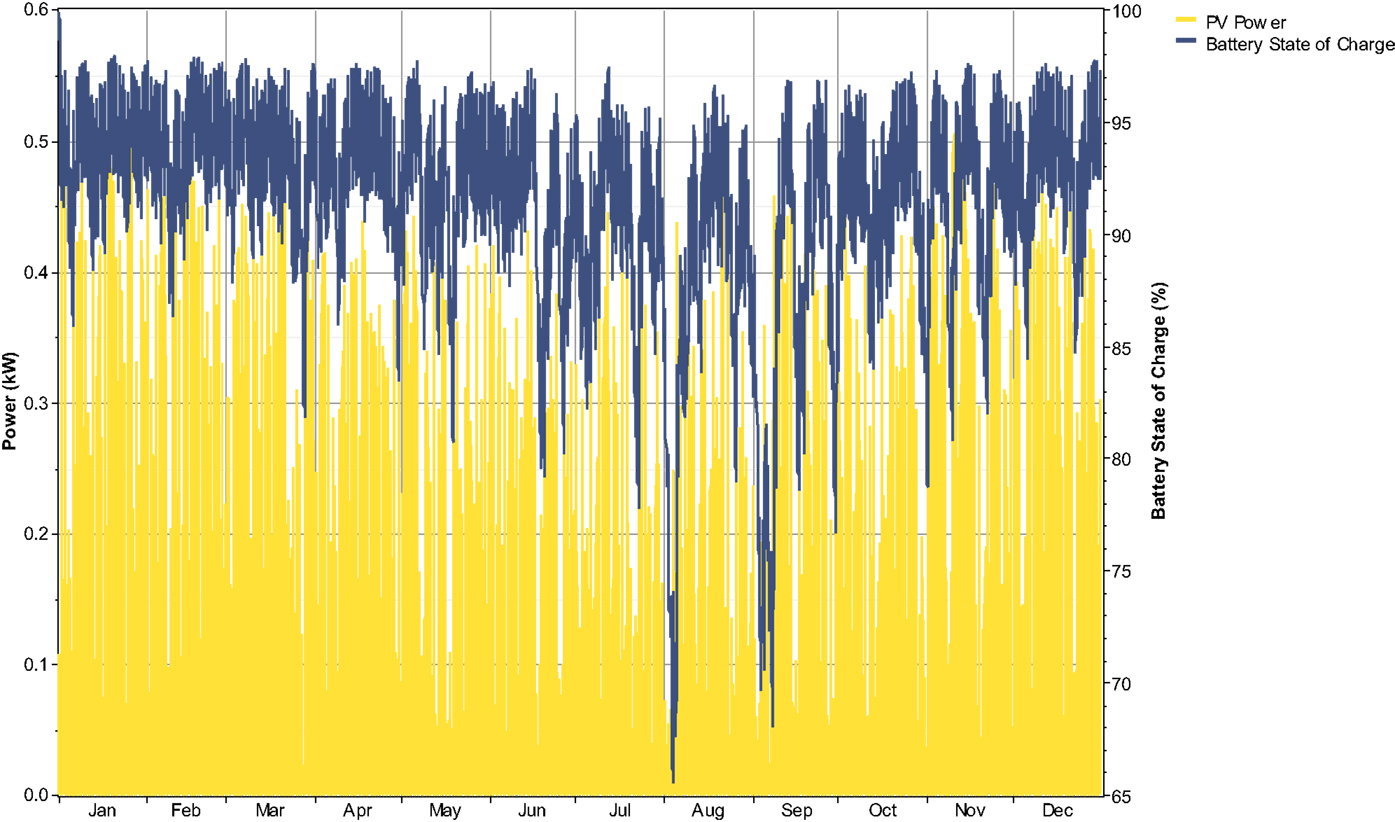
Figure 8. PV power versus Battery state of charge.
Feasibility Study of the Load Demand and the Designed Photovoltaic Energy System
The load is at its peak (155 W) during the daytime/evening hours (15:00–18:59 h) and decreases to 42 W during the nighttime hours (19:00–21:59 h). It is at its slack (18 W) during the nighttime hours (22:00–5:59 h) and increases to 42 W during the daytime hour (6:00–6:59 h). By 7:00 h, there is no load demand till 14:59 h. From the feasibility study of the patterns of load demand within the household tabulated in Table 2 and described above, the simulation study satisfied the demand by providing no unmet load in all the months as shown in Table 5. From the simulation result (Table 5) presented, one can predict the performance of the energy system designed for this household. The designed energy system is in accordance to hourly, daily, and monthly, but will be analyzed on monthly bases. The month of January has the highest energy generation, high excess electricity, but least battery charge (apart from February that has 28 days), while August has the least energy generation, low excess electricity but highest battery charge. Also, January has the highest energy supplied to the load by the PV, while August has the highest energy supplied to the load by the battery. The detail for each of the months on the energy generation, battery charge, supply, excess, losses, and consumption were tabulated in Table 5.
In this location (6°51′N latitude and 7°35′E longitude), January has the highest global solar (176.085 kW/m2) and incident solar (185.362 kW/m2) and the total power generated by PV is 77.109 kW as shown in Table A5 (in Supplementary Material). The highest energy generated by the PV in this month (January) is likely to occur in the afternoon toward the end of the month, while the least energy generated by the PV occurs in the evening during month ending as shown in Table A1 (in Supplementary Material). August has the least global solar (121.209 kW/m2) and incident solar (118.910 kW/m2) and the total power generated by PV is 49.461 kW as shown in Table A5 (in Supplementary Material). The highest energy per day generated by the PV in this month (August) is likely to occur in the middle of the day and toward end of the month, while the least energy generated by the PV occurs in the morning during month ending as shown in Table A1 (in Supplementary Material). The likely time and day of occurrence (highest and least) in months on the electricity generated by the PV, the PV power supplied to charge the battery, the battery state of charge, the excess electricity generated by the PV were summarized in Tables A1, A2, A3, and A4, respectively, in the Supplementary Material.
Economic Cost Analysis
One of the most important criterion for assessing an optimal solution for any particular household is the economic cost of the system. The cost ratings here are discussed in terms of two major cost components: (1) the initial capital cost (ICC) and (2) the total net present cost (NPC), the former being completely exclusive (i.e., ICC excludes other costs), while the latter is inclusive (i.e., includes the present value of all the costs that it incurs over its lifetime). Table 6 shows the economic cost results of the energy systems configurations.
Initial Capital Cost
The initial capital cost of a component is the total installed cost of that component at the beginning of the project; the initial cost results of PV configuration with Surrette battery and gasoline generator are illustrated in Table 6.
Total Net Present Cost
The total NPC of a system has been described as the present value of all the costs that it incurs over its lifetime, minus the present value of all the revenue that it earns over its lifetime. Costs include capital costs, replacement costs, operation and maintenance costs, and the costs of buying power from the grid. Revenues include salvage value and grid sales revenue. However, the analysis presented here considers neither the costs of buying power from the grid nor grid sales revenue, since the focus of this study is on household loads in rural areas without grid connections. Table 6 shows the NPC results for the configuration of PV system with Surrette, and gasoline generator option.
The case study results illustrate the financial dilemma faced by many households in off-grid settings. A gasoline generator has not only lowest capital cost (US$ 85) but also the highest lifetime cost (US$ 12562) due to constant fuel requirements.
The initial capital cost of a PV configuration with batteries is nearly 52 times higher than that of a generator (US$ 4454), but the NPC, representing cost over the lifetime of the system, is less than two of the gasoline generator option (US$ 5670). This is because the PV configuration with batteries has little or no maintenance and no operational cost (fuel consumption).
From the results of the simulation shown in Table 6, the biggest barrier to rapid expansion of solar solutions, however, is the higher initial cost of PV solar systems compared to small, stand-alone generators. So while the lifetime cost of solar systems will be much lower as compared to gasoline generators that require constant fuel inputs, generators will likely be cheaper to purchase outright. Thus, small household facilities may be compelled to purchase or to continue relying upon generators despite the higher long-term cost of using these systems.
The NPC of components of PV energy system and gasoline shown in Table 6 were generated from Figures A1 (in Supplementary Material) and B1 (in Supplementary Material), respectively.
Environmental Impact Analysis
One of the major attractions of renewable energy system is their environmental friendliness, and the objective of this design is to investigate alternative energy solution (Solar PV) that are not only feasible but also optimal for powering households in non-grid serviced rural areas in Nigeria. Table 7 shows the results of operational hour, fuel consumption, and pollutant emissions of the energy systems configurations.
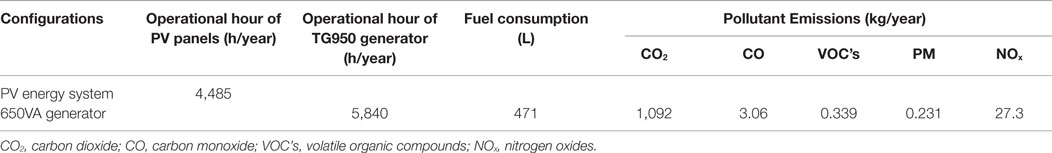
Table 7. Simulation results of operational hour, fuel consumption, and pollutant emissions of power generation.
The amount of fuel consumed determines the level of pollutant emission.
Volatile organic compounds (VOC’s) – consisting of unburned hydrocarbons and products of combustion reactions; these can further react to form ground level ozone (O3), a major component of smog5.
In the PV energy system, there is no fuel consumption; which means no emission of CO2, CO, VOC’s, PM, SO2, and NOx from the energy system. This system configuration would be suitable for deployment of 100% clean energy for uninterruptable power performance.
Conclusion
The simulation results show that the energy system configuration for the household energy consumption of 932 Wh/day with a 155 W peak load demand consists of 0.52 kW solar PV array, 2 unit of Surrette 6CS25PS Battery (2312 Ah nominal capacity battery) and a 1 kW DC/AC inverter. The energy system was designed in such a way that there is no unmet load in all the months. It was shown that solar incident ray falls to the PV panels as from 8:00 h (8.00 a.m.) and stops by 17:59 h (5.59 p.m.). Within these hours, there is no load demand between 8:00 h (8.00 a.m.) and 14:59 h (2.59 p.m.), and the excess electricity occurs between 10:00 h (10.00 a.m.) and 15:59 h (3.59 p.m.), but mostly by 13:00 h (1.00 p.m.) when the radiation is at the peak. During the settling stage of the sun (sunset: 16:00–17:59 h), the battery together with the PV supplies to the load, but the battery alone supplies to the load when the PV cannot function due to no radiation and this occurs as from 18:00 h (6.00 p.m.) till 7:59 h (7.59 a.m.). Nigeria is divided into three main climatic regions: the equatorial climatic region where the global solar radiation ranges from 4.1 to 4.9 kWh/m2/day, the tropical climatic region where the global solar energy is around 5 kWh/m2/day, and finally, the arid climatic region where the global solar radiation is higher than 5 kWh/m2/day. For example, the scaled annual average solar radiation for the locations in equatorial climatic region (Nsukka – Enugu State), tropical climatic region (Abaji – Abuja, FCT), and arid climatic region, are 4.920, 5.449, and 5.894 kWh/m2/day, respectively. Using this as a benchmark, it can be seen that even the minimum harnessible power in any part of the country is more than that required for powering an average three-room apartment using low-power consuming appliances (Tables 1 and 2). This gives an impression that implementing solar energy strategy is a great opportunity for Nigeria to minimize dependence from fossil fuels. Simulation results also show that the initial capital cost of solar system is high and expensive to acquire. This finding (high initial start-up cost) indicates the reason why many Nigerians are not embracing solar system but prefer to purchase generator. It is therefore recommend that Federal government should subsidize the cost of solar panels and batteries. If the government of Nigeria could subsidize the cost of solar panels and batteries; and most Nigerian home in rural areas install solar panels, it will help to reduce or eliminate health problems (respiratory diseases and eye problems) associated with using conventional energy supplies (gasoline generators). Also, by installing solar panels by most Nigerian home in urban areas can significantly reduce home reliance on government power by at least 70% thereby reduce the strain on the current capacity of our power generation infrastructure.
Conflict of Interest Statement
The author declares that the research was conducted in the absence of any commercial or financial relationships that could be construed as a potential conflict of interest.
Acknowledgments
Elaine Fletcher of the World Health Organization is acknowledged for her editorial review and advice on the text.
Supplementary Material
The Supplementary Material for this article can be found online at https://www.frontiersin.org/article/10.3389/fenrg.2015.00038
Footnotes
References
Ani, V. A. (2014). Feasibility and optimal design of a stand-alone photovoltaic (PV) energy system for the orphanage. J. Renew. Energy 2014, 379729. doi: 10.1155/2014/379729
Ani, V. A., and Ani, E. O. (2014). Feasibility study and simulation of optimal power system for off-grid voter registration centres. Int. J. Renew. Energy Res. 4, 3.
Bagul, A. D., Salameh, Z. M., and Borowy, B. (1996). Sizing of a stand-alone hybrid wind-photovoltaic system using a three-event probability density approximation. Solar Energy 56, 323–335. doi:10.1016/0038-092X(95)00116-9
Bala, E. J., Ojosu, J. O., and Umar, I. H. (2000). Government policies and programmes on the development of solar PV sub-sector in Nigeria. Niger. J. Renew. Energy 8, 1–6.
Chendo, M. A. C. (2002). Factors militating against the growth of the solar-PV industry in Nigeria and their removal. Niger. J. Renew. Energy 8, 151–158.
Keywords: TG 950 generator, household energy consumption, three room apartment, load variation, daily radiation, climatic regions, photovoltaic panel
Citation: Ani VA (2015) Feasibility analysis and simulation of a stand-alone photovoltaic energy system for electricity generation and environmental sustainability – equivalent to 650VA fuel-powered generator – popularly known as “I pass my neighbour”. Front. Energy Res. 3:38. doi: 10.3389/fenrg.2015.00038
Received: 29 May 2015; Accepted: 11 August 2015;
Published: 11 September 2015
Edited by:
Fu Zhao, Purdue University, USAReviewed by:
Yı Zong, Technical University of Denmark, DenmarkChris Foreman, Purdue University, USA
Copyright: © 2015 Ani. This is an open-access article distributed under the terms of the Creative Commons Attribution License (CC BY). The use, distribution or reproduction in other forums is permitted, provided the original author(s) or licensor are credited and that the original publication in this journal is cited, in accordance with accepted academic practice. No use, distribution or reproduction is permitted which does not comply with these terms.
*Correspondence: Vincent Anayochukwu Ani, Department of Electronic Engineering, University of Nigeria Nsukka (UNN), Nsukka 410001, Enugu State, Nigeria, vincent_ani@yahoo.com