Comparison of Chemical Composition and Energy Property of Torrefied Switchgrass and Corn Stover
 Jaya Shankar Tumuluru
- Idaho National Laboratory, Idaho Falls, ID, USA
In the present study, 6-mm ground corn stover and switchgrass were torrefied in temperatures ranging from 180 to 270°C for 15- to 120-min residence time. Thermogravimetric analyzer was used to do the torrefaction studies. At a torrefaction temperature of 270°C and a 30-min residence time, the weight loss increased to >45%. At 180°C and 120 min, there was about 56 and 73% of moisture loss in the corn stover and switchgrass; further increasing the temperature to 270°C and 120 min resulted in about 78.8–88.18% moisture loss in both the feedstock. Additionally, at these temperatures, there was a significant decrease in the volatile content and increase in the fixed carbon content, and the ash content for both the biomasses tested. The ultimate composition like carbon content increased and hydrogen content decreased with increase in the torrefaction temperature and time. At 270°C and 120-min residence time, the carbon content observed was 56.63 and 58.04% and hydrogen content observed was 2.74 and 3.14%. Nitrogen and sulfur content measured at 270°C and 120 min were 0.98, 0.8, 0.076, and 0.07% for both the corn stover and switchgrass. The hydrogen/carbon and oxygen/carbon ratios calculated decreased to the lowest values of 0.59 and 0.64, and 0.71 and 0.76 for both biomasses. The van Krevelen diagram drawn for corn stover and switchgrass torrefied at 270°C indicated that H/C and O/C values are closer to coals like Illinois Basis and Powder River Basin. In the present study, the maximum higher heating value that was observed by corn stover and switchgrass was 21.51 and 21.53 MJ/kg at 270°C and a 120-min residence time. From these results, it can be concluded that corn stover and switchgrass, after torrefaction, shows consistent proximate, ultimate, and energy properties.
Introduction
There is growing concern to reduce the use of fossil fuels due to the greenhouse gas emissions, which have a direct impact on the global warming temperatures. This has led researchers to explore alternative renewable energy sources. Biomass is considered a potential resource as it is considered carbon neutral because it is still part of the carbon cycle. According to the Bioenergy Technology office at the U.S. Department of Energy (DOE), biomass feedstock is defined as any renewable biological material that can be used directly as a fuel or converted to another form of fuel, such as ethanol, butanol, biodiesel, and other hydrocarbon fuels. Some examples of the biomass feedstocks that are widely used for bioenergy applications are corn starch, sugarcane juice, and crop residues (e.g., corn stover, sugarcane bagasse, purpose-grown grass crops, and woody plants). Corn stover is the largest quantity of biomass residue in the United States, and 120 million tons are available for biofuels production (U.S. Department of Energy, 2011). Corn stover is the leaf, husk, and cob remaining in the field after the harvest of cereal grain. The residue is the stalk of the leaves of maize (Zea mays ssp. mays L.) plants left in a field after harvest. Stover makes up about half of the yield of a crop and is similar to straw. Switchgrass (Panicum virgatum) is a warm-season perennial grass native to North America. It is a dedicated perennial crop and is considered a viable energy crop that could significantly increase the amount of biomass available for conversion to biofuel (Simmons et al., 2008). U.S. DOE in the 1990s selected switchgrass as a potential bioenergy feedstock due to adaptation to different growing conditions (Newman et al., 2014), and is successfully used for biopower application.
According to Nhuchhen et al. (2014), the lignocellulosic biomass, in spite of all its positive attributes, has different shortcomings like structural heterogeneity, non-uniform physical properties, low-energy density, hygroscopic nature, and low bulk density. These challenges in terms of physical (lower mass density, high-moisture content, irregular size and shape, and hydrophilic in nature), chemical (low carbon and high hydrogen, oxygen, and high volatiles), and energy properties [high hydrogen/carbon (H/C) and oxygen/carbon (O/C), and lower heating values] limit the use of woody, herbaceous, and agricultural straws and other biomasses for energy application. These limitations create difficulties in transportation, handling, storage, and conversion processes (Arias et al., 2008; Medic et al., 2011; Phanphanich and Mani, 2011; Uemura et al., 2011; Wannapeera et al., 2011). Tumuluru et al. (2012) in their review indicated that raw biomass physical properties and chemical composition does not make them suitable for co-firing higher percentages with coal. These authors stated that boiler inefficiency, due to higher moisture and volatiles and lower energy content of the biomass fuels as compared to coal, is a major limitation to cofire higher percentages with coal.
To overcome the biomass challenges in terms of physical, chemical, and energy properties, a torrefaction process was developed. Torrefaction is a thermal pretreatment method where the biomass is thermally pretreated in a temperature range of 200–300°C for about 30 min in absence of air at atmospheric pressure (Tumuluru et al., 2011). Torrefaction makes biomass (a) brittle product making it easier to grind (better particle size and shape), (b) changes the chemical composition (removing the moisture and low-energy content of volatiles), and (c) increases the net energy content of the biomass. According to Lu and Chen (2014), biomass torrefaction helps to retain most of its energy and simultaneously loses its hygroscopic properties. Sarkar et al. (2014) and Yang et al. (2014) have successfully used torrefied switchgrass for gasification and pyrolysis application. Nhuchhen et al. (2014), in their review on torrefaction of biomass, suggested that the process makes biomass suitable for co-firing applications and can be promoted as an alternative to charcoal. They also stated that the torrefaction increases its hydrophobicity, grindability, and energy density making it more suitable for thermochemical applications like gasification and pyrolysis.
The common biomass reactions during torrefaction are dehydration, devolatilization, depolymerization, and carbonization. During initial heating at a temperature about 180°C, the dehydration reactions remove most of the moisture in the biomass. Furthermore, heating biomass in the temperature range of 180–270°C promotes the reactions like depolymerization, devolatilization, and carbonization of hemicellulose, cellulose, and lignin. For torrefaction, process temperatures over 270°C can lead to extensive devolatilization of the biomass due to the initiation of the pyrolysis process (Tumuluru et al., 2011). Also during these reactions, biomass loses some of the lipophilic compounds that make it hydrophobic.
The torrefaction process is influenced by process parameters like temperature, heating rate, absence of oxygen, residence time, ambient pressure, and the properties of feedstock like moisture content and particle size. Torrefaction temperature is typically between 200 and 300°C and the residence time is adjusted to produce a brittle, hydrophobic, and high-calorific value product. Typically, biomass is pre-dried to <10% moisture content prior to torrefaction. The particle size of the biomass will influence the reaction mechanisms, kinetics, duration, and its specific heating rate of the process. Several researchers have worked on the torrefaction of agricultural and woody biomass using a thermogravimetric analyzer (TGA) (Bridgeman et al., 2008; Chen and Kuo, 2010; Repellin et al., 2010). These researchers have successfully used TGA to estimate the effects of particle size, temperature, and moisture to better understand the torrefaction kinetics, chemical, proximate, and energy properties of both woody and herbaceous biomass.
The focus of this work is to understand the effect of the torrefaction time and temperature on proximate and ultimate composition and energy property of corn stover and switchgrass using a TGA. The specific objectives for this research is to (a) understand the effect of torrefaction temperature (180–270°C) and its residence time (15–120 min) on the weight loss, proximate composition (moisture, ash, volatiles, and fixed carbon), ultimate composition (hydrogen, carbon, sulfur, nitrogen, and oxygen), and energy property (higher heating value), (b) understand the significance of torrefaction temperature and time on weight loss, chemical composition and higher heating value, and (c) develop mathematical models for weight loss, proximate and ultimate composition, and higher heating value experimental data.
Materials and Methods
Corn stover and switchgrass samples were used in the present torrefaction experiments. These biomass samples were harvested from farms in Iowa and Nebraska in the form of bales. It was initially ground to bigger particle sizes using a 50.8-mm screen with a Vermeer HG200 grinder (Vermeer Corporation–Agriculture, Pella, IA, USA). The ground material was evaluated for moisture content and stored in sealed plastic containers that were maintained at about 4°C until it was further size-reduced to 6 mm.
Thermogravimetric Analyzer
Torrefaction was performed on the LECO TGA701 (see Figure 1) in a batch procedure. Experiments were conducted in a temperature range of 180–270°C and a residence time of 15–120 min. Biomass sample preparation includes grinding corn stover and switchgrass to 6 mm using a Retsch splitter. These samples were double-bagged and stored in air-tight containers and used for torrefaction studies. A method file was also developed to carry out the torrefaction experiments using TGA (Bridgeman et al., 2008). This method file includes the steps for drying and torrefaction, and its associated cooling steps.
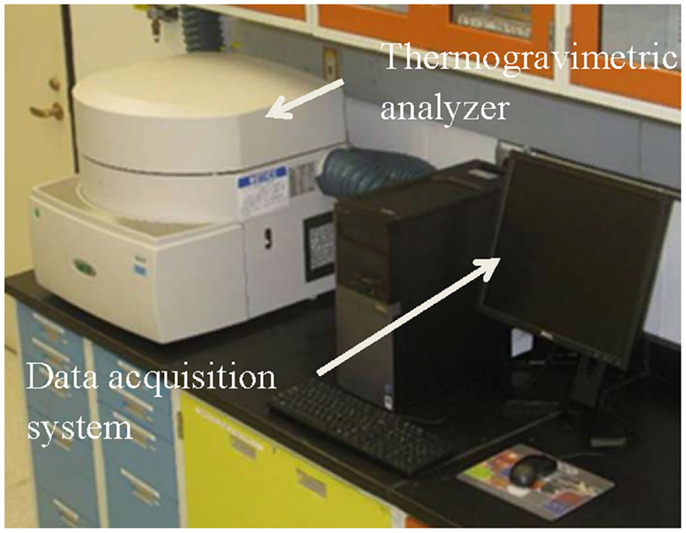
Figure 1. LECO Model 701 thermogravimetric analyzer.
For the present study, the heating rate selected was 10°C/min. LECO instrumentation contains an easy-to-follow menu, driven by Microsoft™ Windows®-based software, which allows its analysis method. Temperature, temperature ramp rate, and atmosphere are selectable at each step. Analysis methods can also be entered to evaluate the moisture, volatiles, and ash content. American Society for Testing and Materials (ASTM) standard methods for estimating the chemical composition was used to measure the proximate and ultimate composition of the torrefied biomass (Table 1). Table 2 shows the experimental design used for conducting the torrefaction tests.
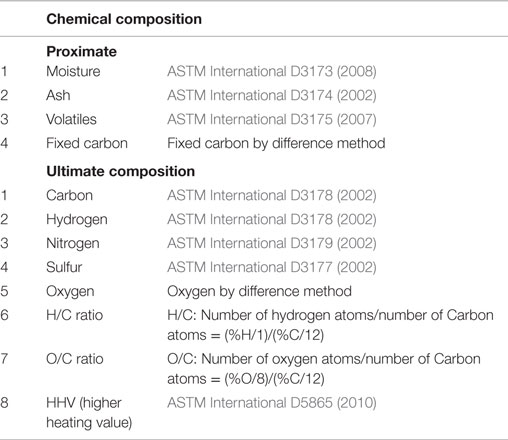
Table 1. Methods followed for measurement of chemical and energy properties of corn stover and switchgrass biomass samples.

Table 2. Experimental design for torrefaction experiments using TGA.
Data Analysis
The experimental data on weight loss, proximate and ultimate composition, and higher heating value obtained at different torrefaction temperatures (180°, 230°, and 270°C) and different residence times (15, 30, 60, and 120 min) for both corn stover and switchgrass was used to draw the bar plots, develop multiple regression equations (Eq. 1), and understand the significance of the torrefaction process variables with respect to torrefied material properties studied. Statistica (Version 9) statistical software was used to develop the multiple regression models and analysis of variance (ANOVA) for the experimental data. Coefficient of determination was used to understand the model fit and the ANOVA was used to understand the significance of the process variables with respect to the weight loss, proximate, ultimate composition, and higher heating value.
where b0, b1, and b2 are equation constants; x1 and x2 are torrefaction temperature (°C) and torrefaction residence time (min), respectively; and y is dependent variable (weight loss, proximate, ultimate composition, and higher heating value).
Results and Discussion
The proximate and ultimate composition of raw corn stover and switchgrass are indicated in Table 3. Ash content of corn stover is slightly higher compared to switchgrass, and volatiles are slightly higher in corn stover when compared to switchgrass. The carbon content of the corn stover and switchgrass were in the range of 42–43%. The heating values of both feedstocks were close. The oxygen content of the biomass feedstocks are in the range of 40–41%. The H/C and O/C ratios calculated are slightly higher for corn stover (1.64 and 1.38) compared to switchgrass (1.52 and 1.45). Table 4 indicates the ultimate composition and H/C and O/C ratios of Appalachian, Powder River Basin, Illinois Basin, and North Dakota lignite coals. The Appalachian coal has the highest carbon and lowest oxygen (66.93 and 7.55), and North Dakota lignite has the lowest carbon and highest oxygen values (31.8 and 26.35). The H/C and O/C ratios calculated for the coals indicated that Appalachian coals has the lowest values of 0.79 and 0.17, and North Dakota lignite has the highest values of 1.7 and 1.34.
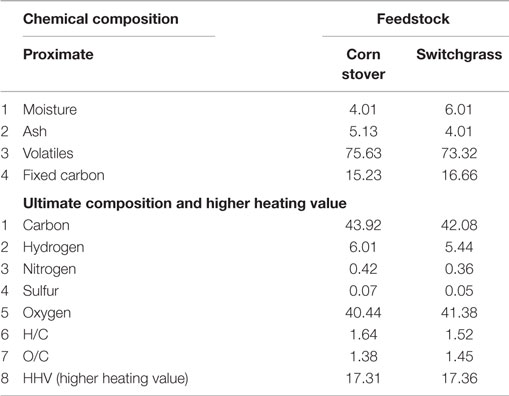
Table 3. Proximate, ultimate, and energy property of raw corn stover and switchgrass.
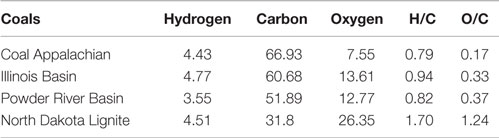
Table 4. Ultimate composition and H/C and O/C ratio of different coals (source: Tillman et al., 2009; Tumuluru et al., 2012).
Analysis of Variance and Mathematical Models
The experimental data was analyzed further to understand the significance of the process variables, and to develop multiple regression models for weight loss, proximate, ultimate composition, and energy data. Table 5 indicates the significance of the process variables, and Table 6 shows the multiple regression equations fitted for the experimental data. For the weight loss for both corn stover and switchgrass, the torrefaction temperature was found to be significant at P < 0.001 and the torrefaction residence time at P < 0.05. In the case of moisture content, volatiles, and fixed carbon, torrefaction temperature was found to be significant at P < 0.001 for both switchgrass and corn stover. Torrefaction residence time was found to be significant for switchgrass at P < 0.05 for moisture content, volatiles, and fixed carbon at P < 0.01; whereas for corn stover, it was found to be non-significant. In case of ash content, torrefaction temperature was found to be significant at P < 0.001, and residence time was found to be non-significant for both corn stover and switchgrass. Ultimate composition, hydrogen, oxygen, and carbon content were influenced by the torrefaction temperature at P < 0.001 for both corn stover and switchgrass. Torrefaction residence time was found to be significant only for hydrogen content at P < 0.05; whereas for carbon, it was found to be non-significant. For the H/C ratio and O/C ratio, the torrefaction temperature was found to be significant at P < 0.001; however, the residence time was significant only for corn stover at P < 0.05. In the case of the higher heating value, only the torrefaction temperature was found to be statistically significant at P < 0.05. The regression equation developed for the experimental data has adequately fitted based on the coefficient of determination values. Also, all the equations were found to be statistically significant at P < 0.001. These equations can help to predict the weight loss, proximate and ultimate composition, higher heating values, and H/C and O/C ratios of corn stover and switchgrass at different torrefaction temperatures and residence times studied in this paper.
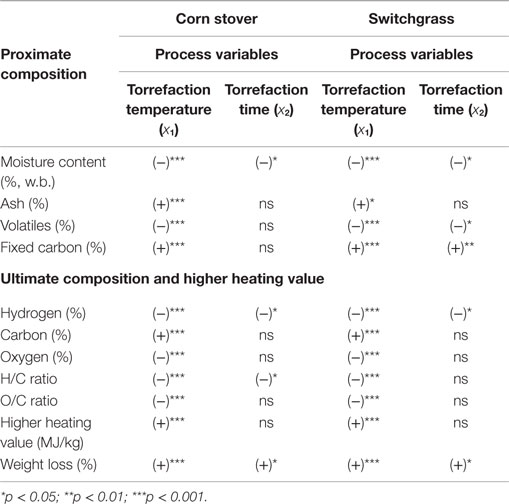
Table 5. Significance of the torrefaction temperature and time with respect to proximate, ultimate, and energy property.
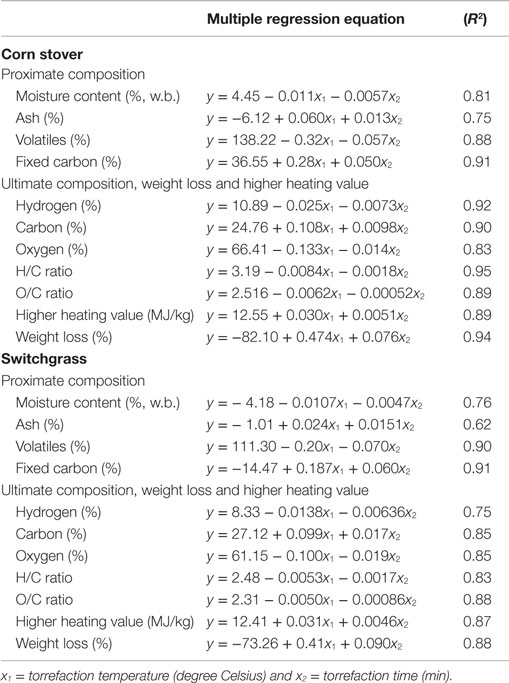
Table 6. Multiple regression equations for weight loss, proximate and ultimate composition, and energy properties of corn stover and switchgrass.
Weight Loss
The weight loss for both corn stover and switchgrass at different torrefaction temperatures and residence times are indicated in Figure 2. At 180°C, and 15–120 min residence time, the weight loss was in the range of 8.1–9.3% for switchgrass and 9.1–10.04% for corn stover. Increasing the torrefaction temperature and residence time increased the weight loss in both corn stover and switchgrass. The maximum weight loss observed for corn stover at this temperature was about 33% and about 26% for switchgrass. At 270°C and 30 min, the weight loss observed for corn stover and switchgrass was 42.63 and 51.26%, and at 120 min the weight loss values increased to final values of 54.93–58.29%.
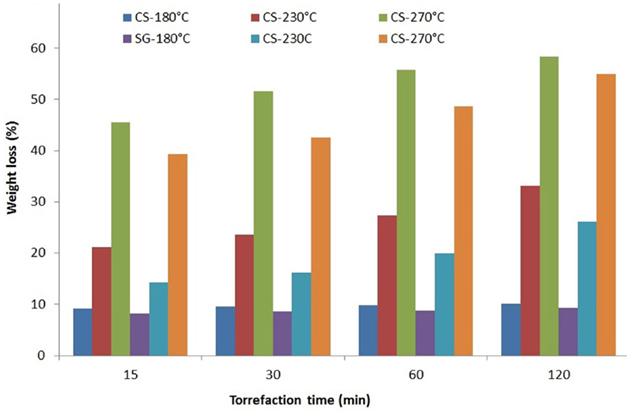
Figure 2. Weight loss in corn stover and switchgrass at different torrefaction temperatures and times.
Proximate Composition
The loss of moisture was significant at all the torrefaction temperature and residence times. At lower temperature of 180°C and 30 min residence times, the loss of moisture was about 26% for corn stover and 54% for switchgrass compared to its original value. Furthermore, increasing the residence time to 120 min reduced the final moisture content in both corn stover and switchgrass to about 1.67 and 1.62% – a reduction of 56 and 73% compared with their original value. The decrease in moisture content of the switchgrass and corn stover had increased with the increase in torrefaction temperature and residence time. At 270°C and 120-min residence time, a maximum moisture reduction of 78.8% for corn stover and 88.18% for switchgrass was observed (Figure 3). Tumuluru et al. (2011) in their review indicated that lower temperatures of <200°C contributes to the loss of moisture resulting from the dehydration reactions; whereas, at temperatures of >200°C, the loss of moisture is attributed to the complicated interactions of biomass components to temperature and residence time. Phanphanich and Mani (2011) in their studies indicated that torrefying the biomass at temperature >200°C results in improved grinding characteristics. The main reason for this behavior is due to loss of moisture and other low energy volatiles, which makes biomass brittle and easy to grind. Figure 4 shows the photos of corn stover and switchgrass torrefied at 180°, 230°, and 270°C for 120-min residence time. It is very clear from the figure that the color changes significantly with the torrefaction temperature, which can be a good indicator for the degree of torrefaction. According to Tumuluru et al. (2011), a temperature regime of 150–200°C, also called the reactive drying range, initiates the breakage of hydrogen and carbon bonds and results in a structural deformity that does not result in a significant change in color of the biomass. The same authors indicated that at a temperature range of 200–300°C, also called as destructive drying, results in the disruption of most of the inter- and intramolecular hydrogen bonds and C–C and C–O bonds and emits condensable and non-condensable gases, which result in darkening of the biomass. At these temperatures, cell structure is completely destroyed as the biomass loses its fibrous nature, becomes brittle, and is easier to grind (Bergman and Kiel, 2005).
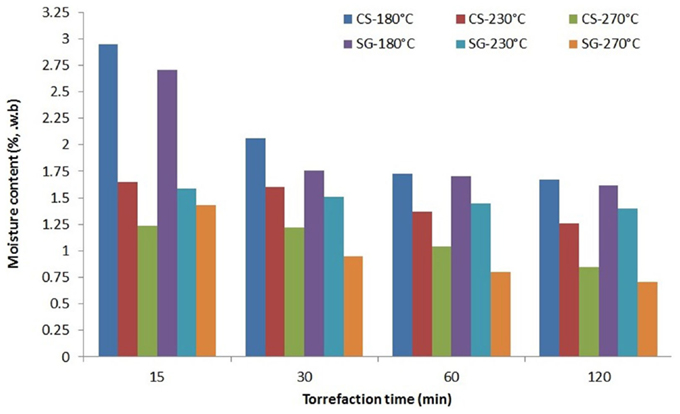
Figure 3. Torrefaction temperature and time effect on moisture content of the switchgrass and corn stover.

Figure 4. Color changes in corn stover and switchgrass at different torrefaction temperatures.
During torrefaction, the ash components in the biomass do not change. All ash components of biomass are still present in torrefied biomass. The change in the ash content is more relative to the change in the original biomass components. As the biomass loses some of the moisture and volatiles during the process, the ash content is more of a relative increase with respect to the original components. In the present study, the initial ash content of corn stover and switchgrass was 5.13 and 4.01%. At 180°C and 15-min residence time, the percent increase in the ash content was about 20.07% for corn stover, and in the case of switchgrass, it increased by about 8.22%. Increasing the residence time to 30 min did increase the ash content to 6.98 and 4.35%. This increase is marginal from 15–30 min for both the feedstocks. Figure 5 clearly indicates that the ash content in both the biomasses tested increased with the increasing of the torrefaction temperature and residence time. At 230° and 270°C torrefaction temperature and 15-min residence time, the ash content of both the biomasses tested increased. According to Poudel and Oh (2012) and Chen et al. (2014), during torrefaction the volatile content in the biomass decreases leading to an increase in ash content.
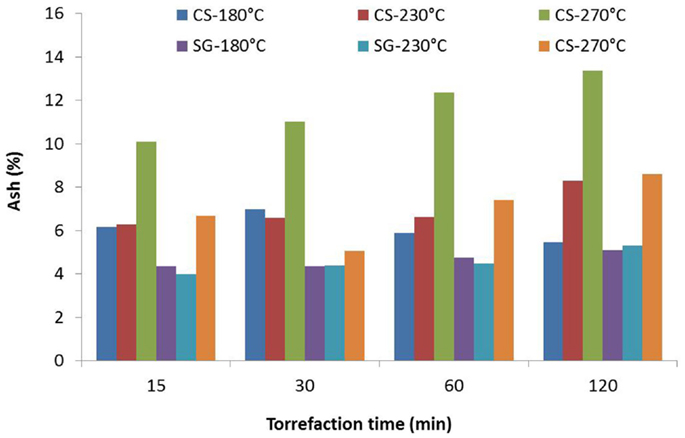
Figure 5. Torrefaction temperature and time effect on ash content of the switchgrass and corn stover.
Initial volatile content of corn stover was 75.63% and the switchgrass was 73.32%. At 180°C and 15-min residence time, the volatile content decreased to 74.03% (a decrease of about 2% from the original value for corn stover). In the case of switchgrass, the decrease was from 73.32 to 71.39% (a decrease of about 2.6% from the original value). The loss of volatiles increased with the increase in torrefaction temperature and residence time. At 230°C and between 15- and 120-min residence time, the decrease was in the range of 61.23–69.42%; however, at 270°C the decrease in the volatile content was further decreased and was in the range of 50.27–58.78% (Figure 6). The study indicated that the volatile losses are higher at higher torrefaction temperature and residence time. At torrefaction temperature of 200–300°C, weight loss in the biomass is mainly due to loss of moisture and hemicellulose and lignin decomposition. Xylan-based hemicellulose generally decomposes around 250–280°C. Lignin decomposition proceeds more slowly, but will gradually increase starting at about 200°C. At these temperatures, the disruption of most inter- and intramolecular hydrogen bonds and C–C and C–O bonds will result in a formation of hydrophilic extractives, carboxylic acids, alcohols, aldehydes, ether, and gases like CO, CO2, and CH4 (Tumuluru et al., 2011). The common reactions at these temperatures are limited devolatilization and carbonization of the hemicellulose. At temperatures of >250°C, the hemicellulose decomposes extensively into volatiles and a char-like solid product.
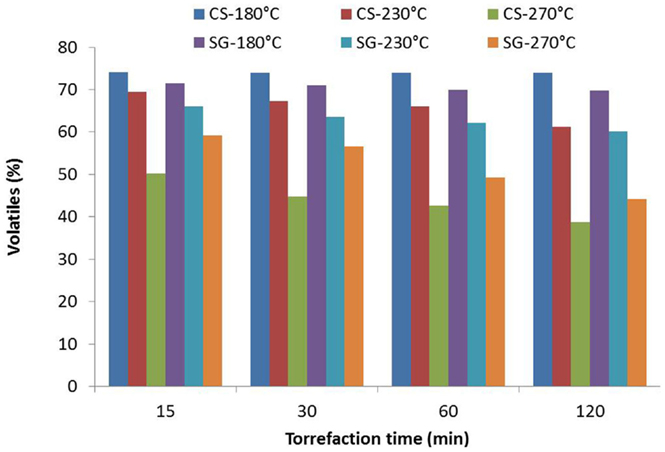
Figure 6. Torrefaction temperature and time effect on volatile content of the switchgrass and corn stover.
The initial fixed carbon content of corn stover and switchgrass is 15.23 and 16.66%. At lower temperatures the change in the fixed carbon is not significant, where at higher temperature of 270°C the change in the fixed carbon is more significant. At 180°C torrefaction temperature and 15-min residence time, the change in the fixed carbon is marginal for corn stover (16.86%); however, for switchgrass the fixed carbon increased to 21.56%. Increasing the residence time to 30–120 min at 180°C torrefaction temperature increased the fixed carbon to 18.95% for corn stover, and for switchgrass the fixed carbon increased to 23.49% (Figure 7). At 230 and 270°C, the increase in fixed carbon content was significant compared with its original value. At 270°C and 15 min, the fixed carbon content of both the biomasses tested almost doubled (28.35 and 32.71%).
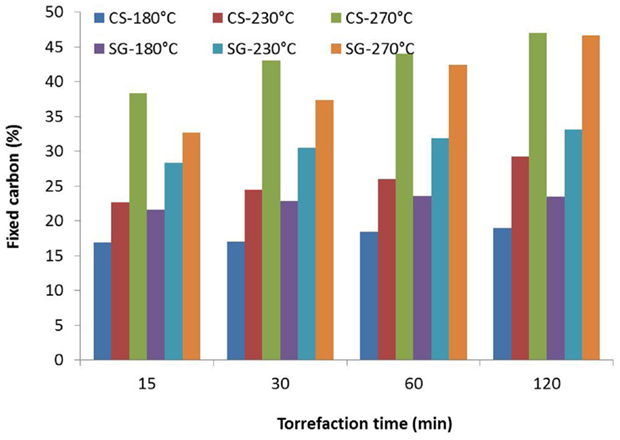
Figure 7. Torrefaction temperature and time effect on fixed carbon of the switchgrass and corn stover.
Ultimate Composition
The initial carbon content of corn stover and switchgrass is about 43.92 and 42.08%. The increased carbon content at 180°C at 15-min residence time is 45.26% for corn stover and 46.56% for switchgrass. Furthermore, increasing the residence time to 120 min increased the carbon content to a final value of 46.03% for corn stover and 47.28% for switchgrass (Figure 8). By increasing the torrefaction temperature to 230 and 270°C at 15-min residence time, the carbon content values observed from both corn stover and switchgrass were 47.92 and 48.53%, and 54.92 and 53.94%. Increasing the residence time further to 120 min also increased the carbon content, but marginally.
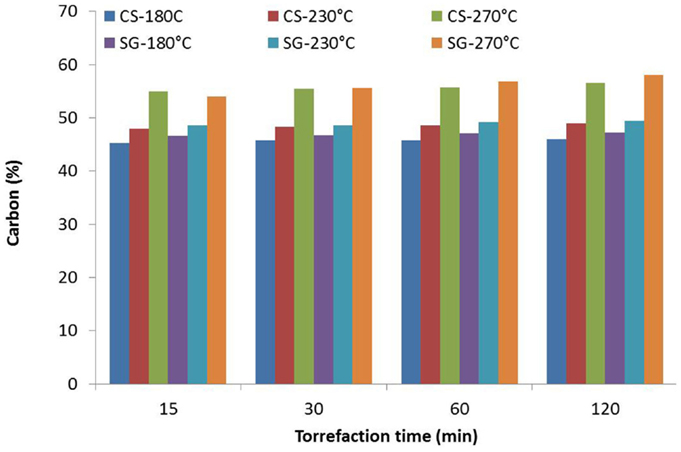
Figure 8. Torrefaction temperature and time effect on elemental carbon of the switchgrass and corn stover.
The initial hydrogen content of the corn stover and switchgrass is about 6.01 and 5.44%. The hydrogen content of corn stover and switchgrass at 180°C and 15-min residence time decreased to 5.9 and 5.39%. By further increasing the residence to 120 min, the decrease was marginal (5.8 and 5.35%). Increasing the torrefaction temperature to 230°C and 15 min, the hydrogen content of corn stover and switchgrass samples were found to be 5.14 and 5.20%, but increasing the residence time to 120 min decreased the hydrogen content of the samples to 4.53 and 4.89% (Figure 9). At 270°C and 15 min, the hydrogen content of corn stover and switchgrass were found to be 4.07 and 4.68%; however, at 30, 60, and 120 min, the hydrogen content of the samples observed was about 3.99 and 4.6; 3.48 and 3.97; and 2.74 and 3.14% for corn stover and switchgrass.
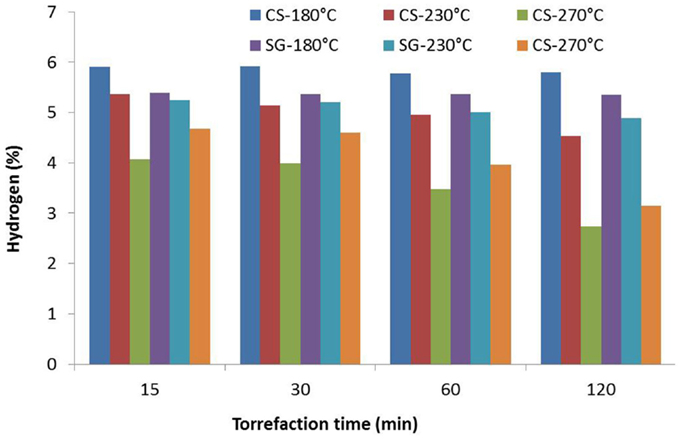
Figure 9. Torrefaction temperature and time effect on hydrogen content of the switchgrass and corn stover.
The initial nitrogen content of the corn stover and switchgrass was 0.42 and 0.36%. At 180°C and 120 min, the nitrogen content increased to 0.50% for corn stover; however, for switchgrass, the nitrogen content increased to 0.38%. Increasing the torrefaction temperature to 270°C and 120 min, the nitrogen content observed in the case of corn stover was 0.98%, while in the case of switchgrass it was about 0.8%. The initial sulfur content of corn stover and switchgrass was found to be 0.07 and 0.05%. There is not a significant change in the sulfur content of both of the biomasses tested, but at 270°C and 120 min the observed values were 0.076 and 0.07%.
Oxygen content is determined based on the difference method. The initial oxygen content of the corn stover and switchgrass was about 40.44 and 41.38%. At a lower torrefaction temperature of 180°C and smaller residence time of 15 min, the oxygen content of the corn stover and switchgrass decreased to 39.99 and 41% (Figure 10). Additionally, increasing the residence time to 120 min did not bring much change in the oxygen content of the samples. At 230°C and 15-min residence time, the observed oxygen content of the corn stover and switchgrass samples was 38.53 and 39.53%, which is also marginal. Torrefying the switchgrass and corn stover at higher temperatures of 270°C did have an impact on the oxygen content of both corn stover and switchgrass. At 270°C and 15 min residence time, the observed oxygen content of the corn stover and switchgrass samples was 29.67 and 33.29%. Furthermore, increasing the residence time to 120 min still reduced the oxygen content of the samples to 26.41 and 29.5%. The results indicated that the torrefaction temperature had a more-significant effect on the oxygen content compared to residence time.
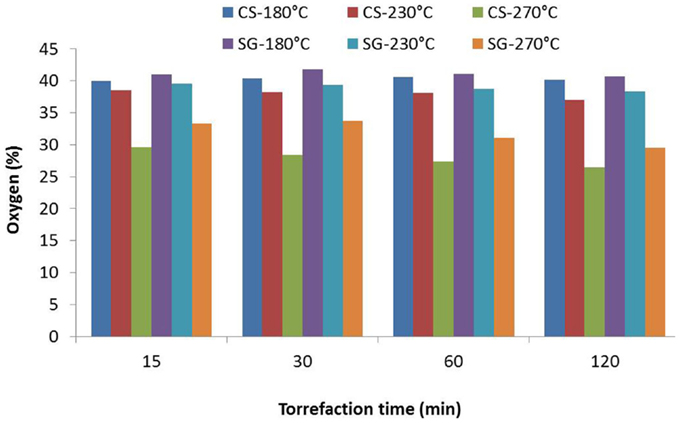
Figure 10. Torrefaction temperature and time effect on oxygen content of the switchgrass and corn stover.
The H/C and O/C ratios of the corn stover and switchgrass raw samples are calculated and indicated in Table 1. Corn stover has higher H/C ratio when compared to switchgrass, and switchgrass has higher O/C ratio when compared to corn stover (H/C and O/C ratios of corn stover showed 1.64 and 1.52 and switchgrass showed 1.38 and 1.45). At a lower torrefaction temperature of 180°C and 15 min, the observed H/C ratio for corn stover was 1.56 and switchgrass was 1.38. Increasing the torrefaction residence time to 120 min reduced the H/C ratio marginally (corn stover 1.51 and switchgrass 1.35). Increasing the torrefaction temperature to 230°C at 15 min residence time, reduced the H/C ratio to 1.27 for corn stover and 1.28 for switchgrass (Figure 11). Further increasing the residence time to 120 min at the same torrefaction temperature of 230°C, the H/C ratio values observed were 1.11 for corn stover and 1.18 for switchgrass. At 270°C torrefaction temperature and 15 min residence time, the observed H/C ratio value for corn stover was 0.88 and switchgrass was 1.04, though at 120 min residence time H/C values reduced to 0.59 and 0.64 for corn stover and switchgrass (Figure 11).
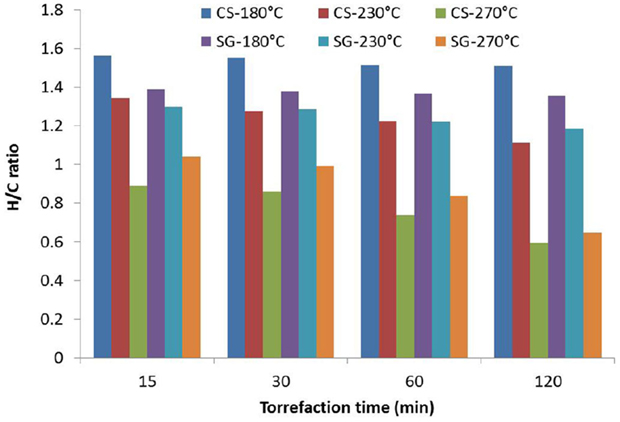
Figure 11. Torrefaction temperature and time effect on H/C ratio of the switchgrass and corn stover.
With the O/C ratio, a similar trend was observed, where increasing the torrefaction temperature and residence decreased the values for both corn stover and switchgrass. At a torrefaction temperature of 180°C and 15-min residence time, the observed values were 1.32 for both corn stover and switchgrass. Increasing the residence time to 120 min did change the values marginally (1.31 corn stover and 1.29 switchgrass). At the other torrefaction temperatures of 230 and 270°C and a 15-min residence time, the observed O/C ratio values for corn stover and switchgrass observed were 1.20, 1.22 and 0.81, 0.92. At 120 min residence time at 230 and 270°C, O/C values reduced to 1.13, 1.16 and 0.71, 0.76 (Figure 12). It is clear from the data that both torrefaction temperature and residence time had significant effect on the H/C ratio and O/C ratios.
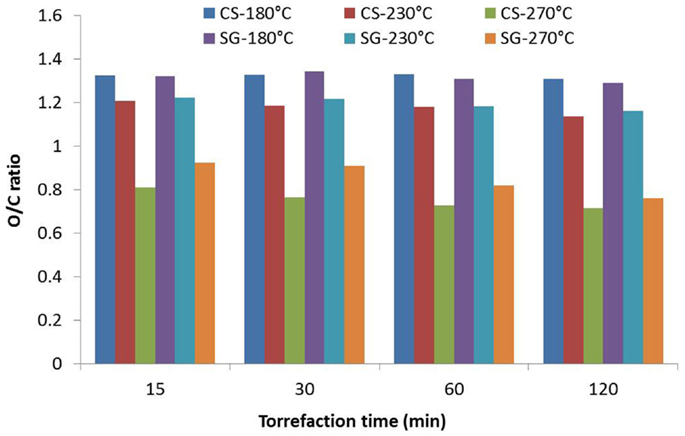
Figure 12. Torrefaction temperature and time effect on O/C ratio of the switchgrass and corn stover.
The van Krevelen diagram, which is drawn for O/C and H/C ratio, was drawn for corn stover and switchgrass and was compared to different grades of the coal (Figure 13). The lower ratio of H/C to O/C in coal is mainly due to lower oxygen content and higher carbon content when compared to biomass. Torrefaction of switchgrass and corn stover helped to lower the oxygen and hydrogen content of the biomass, and made it comparable to different forms of coal. It is clear from this diagram that lower H/C ratio and O/C ratios can be produced at higher torrefaction temperatures and residence times. Torrefying both switchgrass and corn stover at 230°C at different residence times resulted in H/C and O/C ratio closer to North Dakota lignite coal. Additionally, increasing the temperature to 270°C has moved the torrefied switchgrass and corn stover closer to other coal forms like Illinois Basin and Powder River Basin.
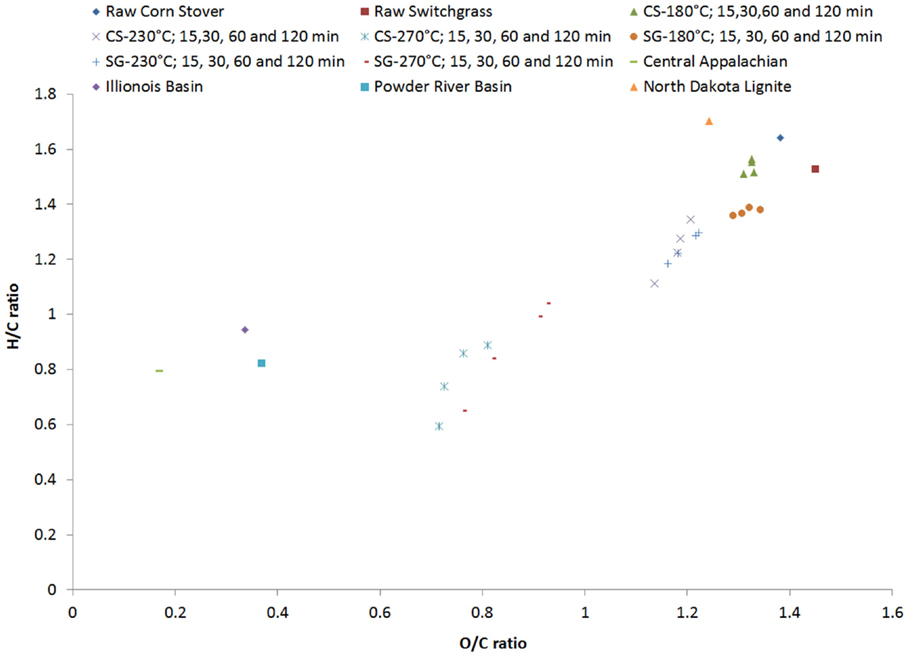
Figure 13. van Krevelen diagram for corn stover, switchgrass, and coals.
Higher Heating Value
The calorific value was measured for both raw and torrefied corn stover and switchgrass samples. The higher heating values of raw corn stover and switchgrass observed were 17.31 and 17.36 MJ/kg. At a torrefaction temperature of 180°C and 15-min residence times, the observed higher heating values were 18.43 and 18.06 MJ/kg (Figure 13). Increasing the residence to 120 min increased the higher heating values marginally. At 230°C torrefaction temperature and 15-min residence time, the higher heating values observed were 18.77 for corn stover and 18.75 MJ/kg for switchgrass. At 120-min residence time, the higher heating value of corn stover was 19.74 and switchgrass was about 19.34 MJ/kg. At a torrefaction temperature of 270°C and 15-min residence time, the higher heating values observed 20.55 for corn stover and 21.0 MJ/kg for switchgrass. At the same temperature, increasing the residence time to 120 min increased the higher heating values to 21.51 for corn stover and 21.53 MJ/kg for switchgrass (Figure 14).
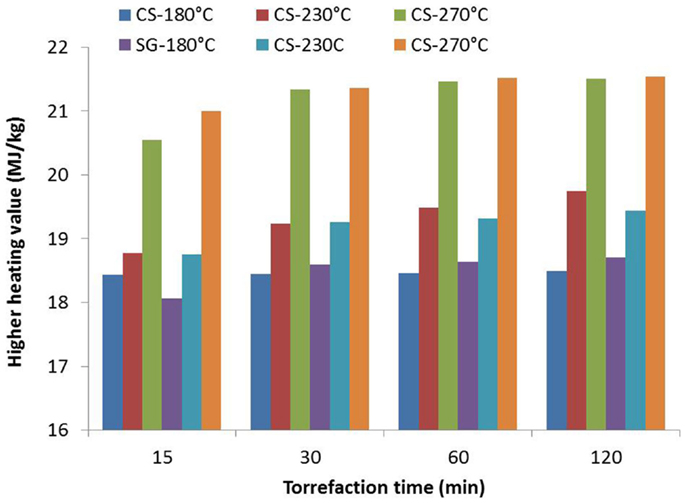
Figure 14. Higher heating value of corn stover and switchgrass at different torrefaction temperature and time.
Discussion
In the present study, both the switchgrass and corn stover lost moisture at different torrefaction temperatures and residence times tested. Tumuluru et al. (2011) and other researchers indicated that at temperatures of 150–200°C the loss of moisture is due to dehydration reactions. The dehydration reactions mainly result in loss of unbound moisture. According to Bridgeman et al. (2008) and other researchers, increasing the torrefaction temperature to 230 and 270°C, the loss of moisture can be attributed to drying and depolymerization of hemicellulose. The loss of volatiles at the temperature of 180°C is marginal, also at this temperature thermal devolatilization and depolymerization reactions do not initiate. At 230 and 270°C, the loss of volatiles is more significant, which might be due to depolymerization of hemicellulose, cellulose, and lignin (Tumuluru et al., 2012). Torrefaction temperatures (200–300°C) of biomass will affect the ash content in the biomass. The increase of ash content observed, in the present study, is more relative to a decrease in the biomass components when compared with the original biomass components. In case of ultimate composition, the carbon content of the biomass increased with increases in torrefaction temperature and residence time. In the present study, the increase in elemental carbon is higher at 270°C when compared with 230 and 180°C temperatures. According to Tumuluru et al. (2011) and other researchers, at a temperature of <250°C the decarbonizing reactions are more limited, but at a temperature of >250°C the biomass undergoes extensive devolatilization resulting with more volatiles loss and an increase in carbon content. The decrease in hydrogen and oxygen content at a lower temperature of 180°C was marginal; whereas, at higher torrefaction temperatures of 230°C and 270°C, the decrease in hydrogen and oxygen is more significant. The major reasons for the decrease in hydrogen and oxygen content at a higher torrefaction temperature are due to formation of water, carbon monoxide, and carbon dioxide. In the present study, it indicates that the nitrogen content increased slightly, while the sulfur content did not change much. The increase in nitrogen and sulfur is more a relative and is due to the decrease of oxygen content. H/C and O/C ratios that were calculated were marginal at the temperature of 180° compared to 230 and 270°C. This observation has corroborated with the findings of the other researchers (Poudel and Oh, 2012; Tumuluru et al., 2012b,c, and Tumuluru et al., 2011). Lower O/C ratio observed at higher torrefaction temperature can be due to the generation of volatiles rich in oxygen, such as CO, CO2, and H2O. Lower H/C ratios observed at higher torrefaction temperature can be due to the formation of hydrocarbons, such as CH4 and C2H6. In general, fuels with less H/C and O/C ratios resulted in less smoke and water vapor formation and less energy loss during combustion and gasification processes. The van Krevelen diagram drawn for torrefied corn stover and switchgrass at a torrefaction temperature of 270°C at different torrefaction residence times, indicated that the both corn stover and switchgrass moved closer to higher quality coals like Power River Basin and Illinois Basis. The lower H/C and O/C ratios of these fossil fuels is mainly due low oxygen content and hydrogen content, which makes them suitable for power generation and gasification applications. Torrefaction of switchgrass and corn stove at 270°C and different residence times lowered H/C and O/C ratios to <1 making them more suitable for biopower generation. Also, based on this study it can be concluded that torrefaction residence times of >30 min may not be necessary, as most of the changes in the biomass proximate, ultimate and higher heating value occur at ≤30 min of the residence time. Additionally in the present study, the higher heating value measured increased with higher torrefaction temperatures. Maximum heating values were observed at 270°C for both corn stover and switchgrass. The increase in higher heating values at higher torrefaction temperature can be due to the loss of lower energy content volatiles, resulting in net increases in the energy content of the torrefied biomass. Nevertheless, torrefaction of corn stover and switchgrass resulted in consistent proximate, ultimate, and energy properties making it more suitable for co-firing applications. The TGA data obtained will be further used to understand the mechanism that results in proximate and ultimate changes in biomass during torrefaction, kinetics of the biomass torrefaction process, and textural changes in torrefied biomass using a scanning electron microscope.
Conclusion
Torrefaction of corn stover and switchgrass has resulted in improved chemical and energy properties. Torrefaction temperature had more significant effect on the chemical and energy property compared to residence time. Weight loss observed during torrefaction at 180°C was about 10%, but at 270°C it increased to >45% for both corn stover and switchgrass. At 180°C and 120 min, about 78.8% in corn stover moisture and 88.18% in switchgrass moisture were lost. Loss of moisture at this temperature is mainly due to dehydration reactions. Increasing the temperatures to 230 and 270°C caused significant changes in proximate and ultimate composition. The relative ash content significantly increased to about 10.1 in the corn stover and 6.66% in the switchgrass at 270°C and 15 min. At this temperature, the volatiles decreased to about 50.27 in the corn stover and 52.03% in the switchgrass. In case of ultimate composition, the carbon content increased to about 54.92 in the corn stover and 53.94% in the switchgrass, and hydrogen content decreased to about 4.07 and 4.68%. Furthermore, the nitrogen and sulfur content observed in corn stover and switchgrass were 0.98 and 0.8%, and 0.076 and 0.07%. The oxygen content of the corn stover and switchgrass observed at 270°C and 120 min was about 26.41 and 29.5%. The H/C and O/C ratios also decreased with increasing torrefaction temperature. The van Krevelen diagram drawn for H/C and O/C ratios at 270°C and 15–30 min residence time is closer to some of the coals like Illinois Basis and Powder River Basin. Maximum higher heating values observed for corn stover and switchgrass were 21.51 and 21.53 MJ/kg at 270°C and 120 min. From the present study, it can be concluded that torrefaction resulted in improved and consistent chemical composition and energy properties of corn stover and switchgrass.
Disclaimer
This information was prepared as an account of work sponsored by an agency of the U.S. government. Neither the U.S. government nor any agency thereof, nor any of their employees, makes any warranty, express or implied, or assumes any legal liability or responsibility for the accuracy, completeness, or usefulness of any information, apparatus, product, or process disclosed, or represents that its use would not infringe privately owned rights. References herein to any specific commercial product, process, or service by trade name, trademark, manufacturer, or otherwise, do not necessarily constitute or imply its endorsement, recommendation, or favoring by the U.S. government or any agency thereof. The views and opinions of the authors expressed herein do not necessarily state or reflect those of the U.S. government or any agency thereof.
Conflict of Interest Statement
The authors declare that the research was conducted in the absence of any commercial or financial relationships that could be construed as a potential conflict of interest.
Acknowledgments
This work was supported by the Department of Energy, Office of Energy Efficiency and Renewable Energy under the Department of Energy Idaho Operations Office Contract DE-AC07-05ID14517. Accordingly, the publisher, by accepting the article for publication, acknowledges that the U.S. government retains a non-exclusive, paid-up, irrevocable, worldwide license to publish or reproduce the published form of this manuscript, or allow others to do so, for U.S. government purposes.
References
Arias, B., Pevida, C., Fermoso, J., Plaza, M. G., Rubiera, F., and Pis, J. J. (2008). Influence of torrefaction on the grindability and reactivity of woody biomass. Fuel Process Technol. 89, 169–175. doi: 10.1016/j.fuproc.2007.09.002
ASTM International D3173. (2008). Standard Test Methods for Moisture in the Analysis Sample of Coal and Coke”, Last Modified 2015. Available from: http://www.astm.org/Standards/D3173.htm
ASTM International D3174. (2002). Standard Test Methods for Ash Analysis of Coal and Coke”, Last Modified 2015. Available from: https://edis.ifas.ufl.edu/pdffiles/AG/AG29600.pdf.
ASTM International D3175. (2007). Standard Test Methods for Volatile Matter in the Analysis Sample of Coal and Coke” Last Modified 2015. Available from: http://www.astm.org/Standards/D3175.htm
ASTM International D3177. (2002). Standard Test Methods for Total Sulfur in the Analysis Sample of Coal and Coke” Last Modified 2015. Available from: http://www.astm.org/Standards/D3177.htm
ASTM International D3178. (2002). Standard Test Methods for Carbon and Hydrogen in the Analysis Sample of Coal and Coke” Last Modified 2015. Available from: http://www.astm.org/Standards/D5373.htm
ASTM International D3179. (2002). Standard Test Methods for Nitrogen in the Analysis Sample of Coal and Coke” Last Modified 2015. Available from: Ahttp://www.astm.org/Standards/D3179.htm
ASTM International D5865. (2010). Standard Test Methods for Gross Calorific Value of Coal and Coke” Last Modified 2015. Available from: http://www.astm.org/Standards/D5865.htm
Bergman, P. C. A., and Kiel, J. H. A. (2005). “Torrefaction for biomass upgrading,” in Proceedings of the 14th European Biomass Conference & Exhibition (Paris), 17–21. Available at: http://www.energy.ca.gov/2009_energypolicy/documents/2009-04-21_workshop/comments/Torrefaction_for_Biomass_Upgrading_TN-51257.PDF
Bridgeman, T. G., Jones, J. M., Shield, I., and Williams, P. T. (2008). Torrefaction of reed canary grass, wheat straw and willow to enhance solid fuel qualities and combustion properties. Fuel. 87, 844–856. doi:10.1016/j.fuel.2007.05.041
Chen, D., Zhou, J., Zhang, Q., Zhu, X., and Lu, Q. (2014). Upgrading of rice husk by torrefaction and its influence on the fuel properties. Bioresour. 9, 5893–5905.
Chen, W. H., and Kuo, P. C. (2010). A study on torrefaction of various biomass materials and its impact on lignocellulosic structure simulated by a thermogravimetry. Energy 35, 2580–2586. doi:10.1016/j.energy.2010.02.054
Lu, J. J., and Chen, W. H. (2014). Product yields and characteristics of corncob waste under various torrefaction atmospheres. Energies 7, 13–27. doi:10.3390/en7010013
Medic, D., Darr, M., Shah, A., Potter, B., and Zimmerman, J. (2011). Effects of torrefaction process parameters on biomass feedstock upgrading. Fuel 91, 147–154. doi:10.1016/j.fuel.2011.07.019
Newman, Y., Williams, M. J., Helsel, Z., and Vendramini, J. (2014). Production of Biofuel Crops in Florida: Switchgrass. Gainesville, FL: IFAS Extension University of Florida, SSAGR291.
Nhuchhen, D. R., Basu, P., and Acharya, B. (2014). A comprehensive review on biomass torrefaction. Interantinla J. Renew. Energy ad Biofuels 2014, 1–55. doi:10.5171/2014.506376
Phanphanich, M., and Mani, S. (2011). Impact of torrefaction on the grindability and fuel characteristics of forest biomass. Bioresour. Technol. 102, 1246–1253. doi:10.1016/j.biortech.2010.08.028
Poudel, J., and Oh, S. C. (2012). A kinetic analysis of wood degradation in supercritical alcohols. Ind. Eng. Chem. Res. 51, 4509–4514. doi:10.1021/ie200496b
Repellin, V., Govin, A., Rolland, M., and Guyonnet, R. (2010). Energy requirement for fine grinding of torrefied wood. Biomass Bioenergy 34, 923–930. doi:10.1016/j.biombioe.2010.01.039
Sarkar, M., Kumar, A., Tumuluru, J. S., Patil, K. N., and Bellmer, D. D. (2014). Gasification performance of switchgrass pretreated with torrefaction and densification. Appl. Energy 127, 194–201. doi:10.1016/j.apenergy.2014.04.027
Simmons, B. A., Loque, D., and Blanch, H. W. (2008). Next-generation biomass feedstocks for biofuel production. Gen. Biol. 9, 242. doi:10.1186/gb-2008-9-12-242
Tillman, D. A., Duong, D. N. B., Miller, B. G., and Bradley, L. C. (2009). “Combustion effects of biomass co-firing in coal-fired boiler,” in Proceedings of Power-Gen International (Presentation) (Las Vegas, NV), December 8–10 (2009).
Tumuluru, J. S., Boardman, R. D., and Wright, C. T. (2012c). Response surface analysis of elemental composition and energy properties of corn stover during torrefaction. J. Biobased Mater. bioenergy. 6, 25–35. doi:10.1166/jbmb.2012.1187
Tumuluru, J. S., Boardman, R. D., Wright, C. T., and Hess, J. R. (2012b). Some chemical compositional changes in Miscanthus and white oak sawdust samples during torrefaction. Energies 5, 3928–3947. doi:10.3390/en5103928
Tumuluru, J. S., Hess, J. R., Boardman, R. D., Wright, C. T., and Westover, T. L. (2012). Formulation, pretreatment, and densification options to improve biomass specifications for co-firing high percentages with coal. Ind. Biotechnol. 8, 113–132. doi:10.1089/ind.2012.0004
Tumuluru, J. S., Shahab, S., Hess, J. R., Wright, C. T., and Boardman, R. D. (2011). A review on biomass torrefaction process and product properties for energy applications. Ind. Biotechnol. 7, 384–401. doi:10.1089/ind.2011.7.384
U.S. Department of Energy. (2011). U.S. Billion-Ton Update: Biomass Supply for a Bioenergy and Bioproducts Industry. R. D. Perlack and B. J. Stokes (Leads), ORNL/TM-2011/224. Oak Ridge, TN: Oak ridge National Laboratory. p. 227.
Uemura, Y., Omar, W. N., Tsutsui, T., and Yusup, S. B. (2011). Torrefaction of oil palm wastes. Fuel 90, 2585–2591. doi:10.1016/j.fuel.2011.03.021
Wannapeera, J., Fungtammasan, B., and Worasuwannarak, N. (2011). Effects of temperature and holding time during torrefaction on the pyrolysis behaviors of woody biomass. J. Anal. Appl. Pyrolysis 92, 99–105. doi:10.1016/j.jaap.2011.04.010
Keywords: corn stover, switchgrass, torrefaction temperature and time, chemical composition, energy property, mathematical model
Citation: Tumuluru JS (2015) Comparison of Chemical Composition and Energy Property of Torrefied Switchgrass and Corn Stover. Front. Energy Res. 3:46. doi: 10.3389/fenrg.2015.00046
Received: 01 September 2015; Accepted: 15 October 2015;
Published: 30 November 2015
Edited by:
Cherng-Yuan Lin, National Taiwan Ocean University, TaiwanReviewed by:
Shanmugaprakash Muthusamy, Kumaraguru College of Technology, IndiaJaime Puna, Instituto Superior Engenharia Lisboa, Portugal
Copyright: © 2015 Tumuluru. This is an open-access article distributed under the terms of the Creative Commons Attribution License (CC BY). The use, distribution or reproduction in other forums is permitted, provided the original author(s) or licensor are credited and that the original publication in this journal is cited, in accordance with accepted academic practice. No use, distribution or reproduction is permitted which does not comply with these terms.
*Correspondence: Jaya Shankar Tumuluru, jayashankar.tumuluru@inl.gov