Net-Energy Analysis of Integrated Food and Bioenergy Systems Exemplified by a Model of a Self-Sufficient System of Dairy Farms
 Mads Ville Markussen1
 Siri Pugesgaard2
 Piotr Oleskowicz-Popiel1†
 Jens Ejbye Schmidt1†
  Hanne Østergård1*
- 1Department of Chemical and Biochemical Engineering, Technical University of Denmark, Kgs Lyngby, Denmark
- 2Department of Agroecology, Aarhus University, Tjele, Denmark
Agriculture is expected to contribute in substituting of fossil fuels in the future. This constitutes a paradox as agriculture depends heavily on fossil energy for providing fuel, fodder, nutrients, and machinery. The aim of this paper is to investigate whether organic agriculture is capable of providing both food and surplus energy to the society as evaluated from a model study. We evaluated bioenergy technologies in a Danish dairy-farming context in four different scenarios: (1) vegetable oil based on oilseed rape, (2) biogas based on cattle manure and grass-clover lays, (3) bioethanol from rye grain and whey, and (4) a combination of (1) and (2). When assessing the energetic net-contribution to society from bioenergy systems, two types of problems arise: how to aggregate non-equivalent types of energy services and how to account for non-equivalent types of inputs and coproducts from the farming? To avoid the first type, the net output of liquid fuels, electricity, useful heat, and food were calculated separately. Furthermore, to avoid the second type, all scenarios were designed to provide self-sufficiency with fodder and fertilizer and to utilize coproducts within the system. This approach resulted in a transparent assessment of the net-contribution to society, which is easy to interpret. We conclude that if 20% of land is used for energy crops, farm-gate energy self-sufficiency can be achieved at the cost of 17% reduction in amount of food produced. These results demonstrate the strong limitations for (organic) agriculture in providing both food and surplus energy.
Introduction
Agricultural production depends on fossil energy for providing fuels, fertilizer, pesticides, fodder, and machinery (Østergård et al., 2010; Pelletier et al., 2011). Consequently, food production is vulnerable to fluctuating and rising oil prices (Neff et al., 2011). At the same time, agriculture is expected to contribute in substitution of depleting fossil energy sources for the society (Farrell et al., 2006; EU, 2009; Cherubini, 2010). This constitutes a paradox. In addition, the production of biofuels from energy crops will require replacing land for food with land for energy. For instance, it has been shown that even drastic land use changes may only provide 7–20% of total Danish energy supply in economically feasible scenarios (Callesen et al., 2010).
The limitations of biofuels as an energy source for the contemporary industrial economy may be considered in the light of history. Before the era of fossil fuels, agriculture was together with forestry the main source of net-energy in the society by providing food for human labor, fodder for draft animals, and biomass for heating (Odum, 2007; Hall et al., 2009). During the nineteenth and twentieth centuries, coal, oil, and natural gas took over as society’s main source of net-energy and agriculture was industrialized in the way that farms were supplied with oil- and industrial-based inputs. Farmers no longer needed to produce fodder for draft animals because they could import oil to power their machinery. On-farm production of organic fertilizers was substituted by import of commercial fertilizers produced by the use of fossil energy, and manual or mechanical weeding was substituted by applying fossil fuel-based pesticides (Hall et al., 1986; Conforti and Giampietro, 1997). Altogether, the productivity per hectare was boosted with the consequence that food supply systems now uses 4–10 times more fossil energy than the food energy they produce (Heller and Keoleian, 2003; Markussen and Østergård, 2013), i.e., agriculture became a net-energy sink. If agriculture should play a significant role in the future energy system, then the first milestone to be achieved would be to become net-energy neutral, e.g., self-sufficient with fuels.
Organic agriculture has taken the first step in reducing the dependency of fossil energy by using neither fossil-based fertilizer nor pesticides (IFOAM, 2014). However, although the omission of pesticides and mineral fertilizers reduces the external energy use for organic agriculture, organic production still depends on fossil fuels for both fuel and electricity (Dalgaard et al., 2001; Halberg et al., 2008). The next step in making agriculture into a net-energy provider is to implement strategies that increase farm energy output. In this respect, it is important to pay attention to the various non-equivalent energy carriers, which are needed in agriculture (i.e., liquid fuels, electricity, and heat) and in which way they can be provided by biomass. Scenarios for energy production have been investigated for different organic farming systems (Halberg et al., 2008; Karpenstein-Machan, 2001; Fredriksson et al., 2006; Østergård and Markussen, 2011; Oleskowicz-Popiel et al., 2012). When comparing such scenarios, two types of problems typically arise: (1) How to aggregate non-equivalent energy data, i.e., joules of energy of different quality providing different services like electricity, liquid fuel, and heat (Giampietro, 2006)? This problem is often either neglected by simply balancing inputs and outputs in joules disregarding their lack of substitutability (Fredriksson et al., 2006; Pugesgaard et al., 2013) or solved by converting to monetary units (Karpenstein-Machan, 2001) or by applying assumptions regarding how much fossil fuel is replaced in the surrounding society (Halberg et al., 2008). (2) How to compare scenarios with different types and amounts of inputs and/or outputs? In a system perspective, changing one component of the system implies that many other components are affected. This problem has often been addressed by system expansion (Halberg et al., 2008) or allocation based on heating value or economical values of output (Fredriksson et al., 2006). Common to most approaches to the two types of problems is that they summarize the net-energy balance of the specific system in one number and thus facilitate direct comparison between different systems. However, they also result in a severe loss of information regarding the qualitative nature of the output, which may make results problematic to explain and interpret (Giampietro, 2004; Giampietro et al., 2006).
The aim of this work is to assess the possibilities of contemporary dairy farms to become net-energy providers at the same time as producing food. Based on a Danish organic dairy farm model system for a specific land area, four scenarios for bioenergy production are analyzed. The four scenarios are designed to address the two types of problems outlined above. The first problem is approached by balancing energy consumption and production of liquid fuels, electricity, and useful heat separately. The second problem is approached by designing all scenarios such that the farms are self-sufficient with fertilizers and fodder, and all coproducts from the farms are used within the farming system as fodder or fertilizer. In this way, the consumption and production of the three energy products and food can be compared among the scenarios.
Technologies for Producing Bioenergy in Organic Agriculture
The bioenergy technologies of interest for our scenarios are the production of vegetable oil from oilseed rape, biogas from manure, and grass-clover and bioethanol from grain and whey. Their specific characteristics in relation to our design of scenarios are described below.
Producing vegetable oil from oilseed rape to be used in modified diesel engines is a simple and inexpensive process (Karpenstein-Machan, 2001), which is practically independent of scale in terms of effectiveness. A trade-off of this technology is that oilseed rape, especially in organic agriculture under Danish growing conditions, is considered a problematic crop due to high fertilizer needs and to high risk of pests. The latter risk increases with increasing density, and therefore no more than 10% land should be used for oilseed rape (Halberg et al., 2008). The residual oilcakes can be used as fodder on the farm making it useful for dairy farms.
Biogas is useful in organic agriculture because at the same time it produces energy and an effluent that can be applied as fertilizer (Rehl and Müller, 2011; Johansen et al., 2013). Grass-clover has been suggested as feedstock for biogas in organic agriculture (Stinner et al., 2008; Pugesgaard et al., 2013) as clover is a nitrogen-fixing plant that contributes with extra nitrogen to the other crops in the rotation. During the anaerobic digestion process, part of the organic N in the feedstock is mineralized implying that the ammonia content of the digestate is higher than in the feedstock (Halberg et al., 2008). Therefore, using digested plant biomass and manure as a fertilizer may increase the yields of crops as compared to using undigested biomass (Stinner et al., 2008; Pugesgaard et al., 2013). The methane in the biogas can be converted to electricity or used as motor fuel. In practice, however, biogas may not be a preferable motor fuel on the farm because the biogas is produced throughout the year, and the motor fuel is needed in seasonal peaks for crop management. If the biogas is stored as a gas, it takes up enormous space, and if it is stored as compressed gas, it takes large investment in pressure-proofed storage (Fredriksson et al., 2006). The biogas could be utilized continuously in a combined heat and power facility (CHP), producing hot water and electricity to the grid (Karpenstein-Machan, 2001). However, depending on the specific location of the biogas plant, it may be difficult to utilize the potential useful heat. Another possibility is to upgrade the biogas and distribute it via the natural gas grid or use it as fuel in the transportation sector (Ahlgren et al., 2010).
Bioethanol has the advantage of being a liquid fuel that to some extend can be handled in the existing infrastructure and supplement gasoline as a fuel for some combustion engines. However, it has limited use in agriculture since most existing machinery and trucks run on diesel, which cannot easily be substituted by ethanol. Another disadvantage is that distilling of bioethanol is energy intensive and should preferably be done in large-scale facilities capable of reusing thermal energy and utilizing waste heat (Gan and Smith, 2011). Starch-based feedstock for bioethanol production is often wheat or maize, but at a dairy farm, returned whey combined with a cereal, e.g., rye, may be used for energy production (Kádár et al., 2011). The residuals from the bioethanol process dried distillers grains with solubles (DDGS) can be used at the farm as fodder.
Materials and Methods
In this study, we model farm-level production and consumption of energy and analyze a reference scenario and four bioenergy scenarios (vegetable oil, biogas, bioethanol, and combined vegetable oil and biogas) which aim at increasing energy output. The farm model accounts for flows of energy and material based on published data for input and output parameters. The model consists of a farm community of 10 identical dairy farms of 100 ha each (specified below) representing full time organic dairy farms on loamy soil in accordance to Pugesgaard et al. (2013). However, to isolate the net-energetic contributions of these farms, the otherwise representative farms are modified to have no import of fodder and fertilizer (Figure 1), and the number of animals is adjusted accordingly to match on-farm fodder production.
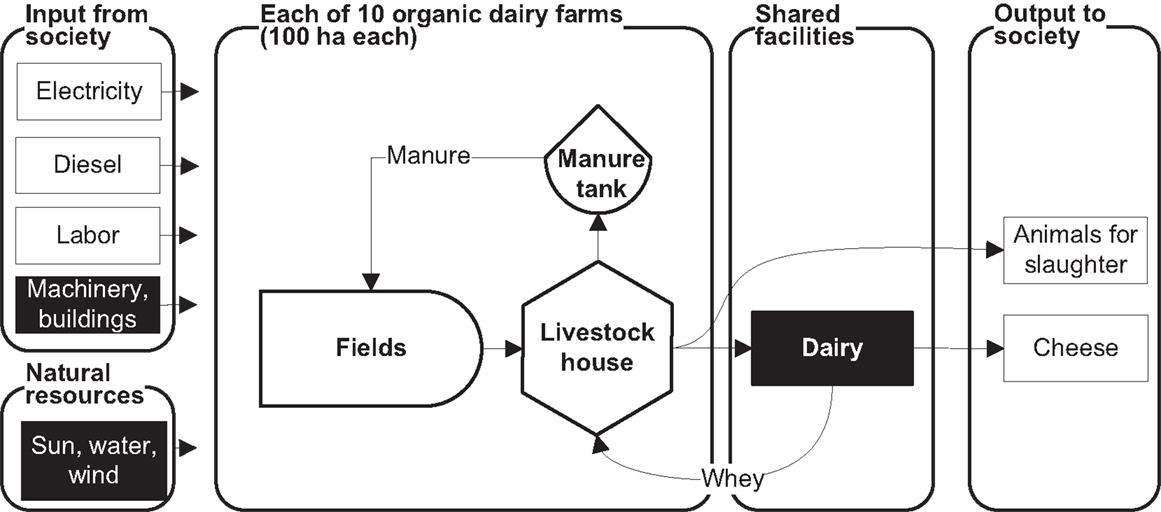
Figure 1. Material and energy flows in the reference scenario. The system consists of 10 identical farms and a shared dairy. Based on the natural resources and input from the society, each farm produces fodder for the livestock. The cows produce manure, animals for slaughter and milk for the dairy. The dairy then produces cheese and whey that are fed back to the cows as fodder. The manure is used as fertilizers on the fields. The dairy is included as a black box because energy and labor use in this process is not accounted for, neither is indirect energy use for the production of machinery and buildings. For further explanation, see text (see The Reference Scenario).
In the reference scenario, the only output is cheese and animals for slaughtering. Whey resulting from the cheese production is returned to the farms for fodder or as feedstock in the bioethanol scenario. In the bioenergy scenarios, either 10 or 20% of land is allocated to bioenergy feedstock production (Figure 2) to consider a range, which is within reach (Pugesgaard et al., 2013). It is assumed that the average distance from each farm to the shared dairy and biogas facility is 5 km. The assumption is arbitrary but is considered as a best case based on the structure of Danish organic agriculture. The main components of the model are production and consumption of liquid fuels, electricity, heat, fodder, and food from a self-sufficient farming system on a specific land area. Each of these energy services is balanced separately to emphasize the lack of substitutability between them. They are all accounted in joules to be able to compare the numbers:
(1) Liquid fuel (i.e., diesel, vegetable oil, and bioethanol). Diesel is used for crop cultivation and for transportation of different substances specified in each scenario.
(2) Electricity. Electricity is used for powering the livestock houses and the bioenergy facilities.
(3) Useful heat. The only consumption of heat takes place at the biogas plant itself as the livestock houses are unheated and potential energy requirements for drying cereals not are considered. Housing for the people at the farm is outside the system boundary.
(4) Fodder. Fodder is modeled in Scandinavian Fodder Unit (SFU) which is defined as “12 MJ of metabolizable energy or the equivalent to the fodder value in 1 kg barley” (Dalgaard et al., 2001). In all scenarios, production and consumption is balanced such that all fodders are used on the farm. This implies that the number of cows and amount of produced milk are adjusted in each scenario according to the amount of produced fodder. The comparison between the scenarios is still possible as it is self-sufficient agricultural systems covering a specific land area and with different energy production which are compared
(5) Food. Food is accounted in food energy from a human nutritional perspective. Production and consumption is balanced based on UN’s recommendation for a healthy life, which is a daily intake of minimum 8.8 MJ (2100 kcal) (United Nations, 2014).
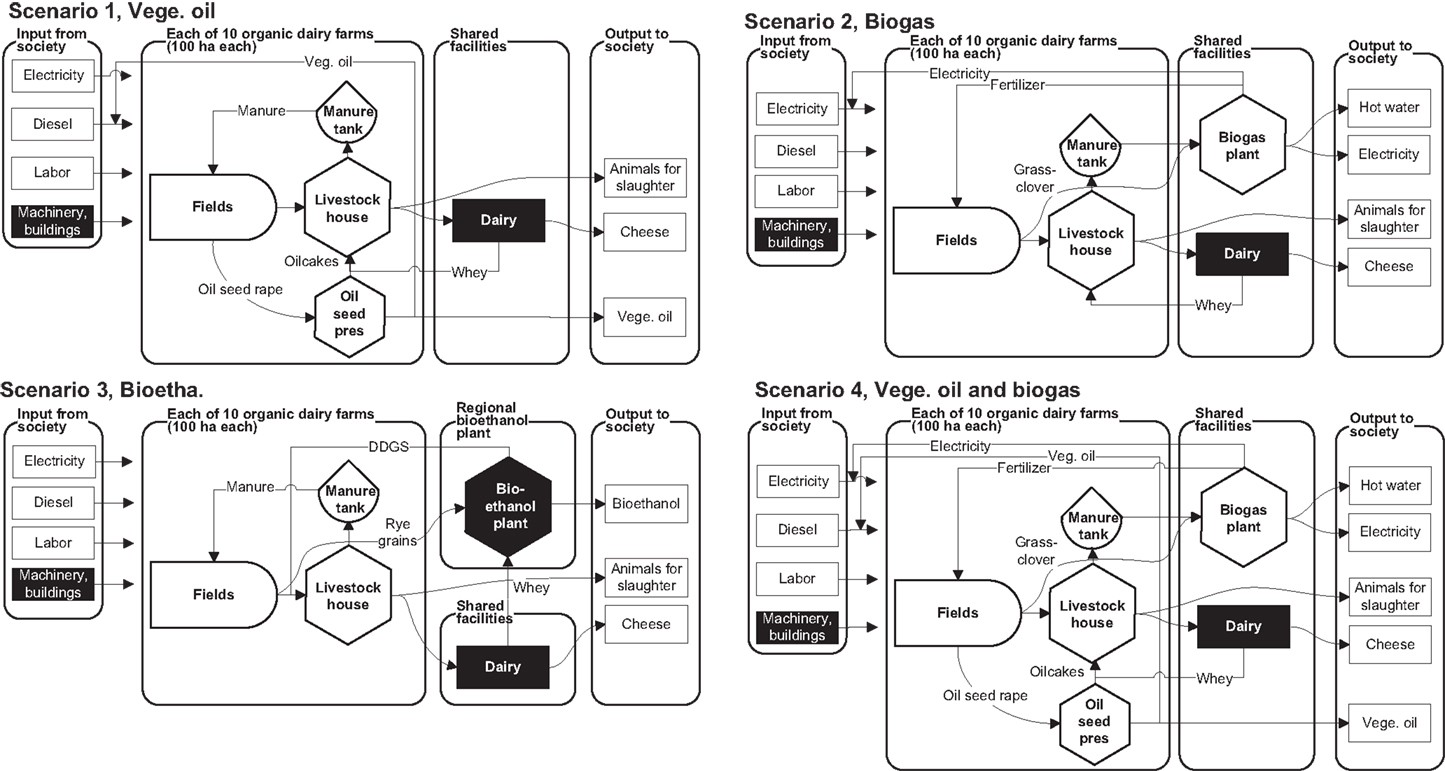
Figure 2. Material and energy flows in bioenergy scenarios. Scenario 1: 10% land used for oilseed rape, which is used to produce oil to substitute imported diesel and oilcake used for fodder. Scenario 2: 10% land used to produce grass-clover that is fed to the biogas facility together with manure from the cows. The biogas is used on location to produce heat and power, which is used in the system and the surplus is exported to society. Scenario 3: 10% land used to produce rye for ethanol production together with whey at a central bioethanol plant. The ethanol is exported to surrounding economy. Residues from ethanol production (DDGS) are fed back to the livestock. Scenario 4: 10% land used for oilseed rape and 10% used for grass-clover combining Scenarios 1 and 2. For further explanation, see text (see Crops).
Notably, indirect energy requirements to provide inputs and capital investments are omitted in the analysis. In addition, energy costs in the dairy process are not accounted for as the system boundaries are at the farm gate including the shared biogas facility.
The scenarios have different N-dynamics. This dynamic is not considered in our model since nutrients are not a limiting factor due to the availability of animal manure and a large grass-clover area for fodder (see the nutrient balance in Pugesgaard et al., 2013). Using digested plant biomass and manure as a fertilizer may increase the yields of crops as compared to undigested biomass (Stinner et al., 2008; Pugesgaard et al., 2013). In this study, we assume that crop yields are the same independently of whether the manure is treated or not.
Finally, for consistency best-case assumptions, i.e., assumptions that are favorable for increasing production and reducing consumptions have been chosen whenever possible.
The Reference Scenario
In this section, the farm model for the reference scenario (Figure 1) is described in terms of data sources and assumptions and consumption and production of energy and materials.
Crops
Data for full-time organic dairy farms on loamy soil have been chosen for the analysis in accordance to Pugesgaard et al. (2013). The mix of crops grown (Table 1) corresponds to the average mix for Danish organic dairy farms in 2006 on non-irrigated loamy soil based on data from the Danish annual farm account statistics (StatBankDanmark, 2007). This gives 10–30% better yield than the more representative sandy soil type in Denmark, but it has been chosen as a best-case assumption. The total fodder production from grazed areas makes up 20% of the total fodder production measured in SFU, which corresponds to the amount of time that the livestock is spending grazing per year according to Danish regulation (specified below). Remaining grass-clover ley is cut four times per year. Yields in SFU and dry matter (DM) are given in Table 2. All crops are used as fodder, and all straws are used for livestock management.
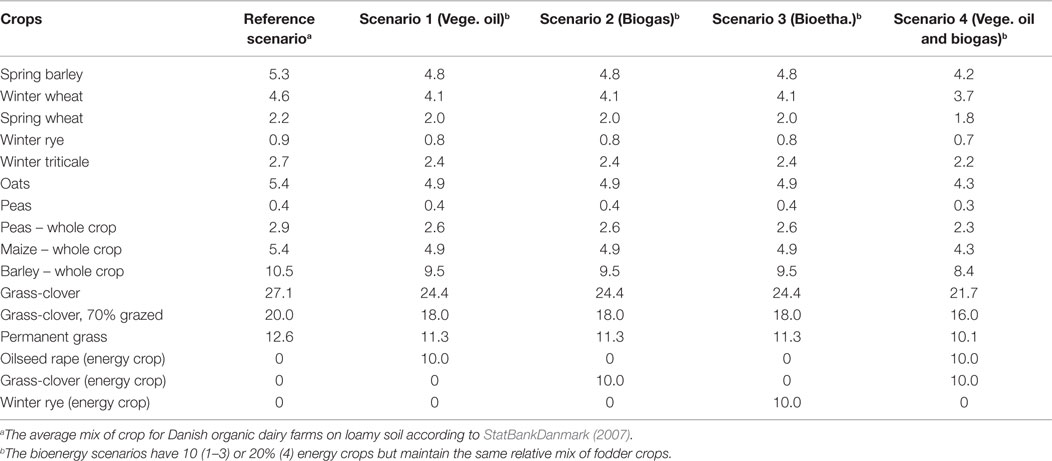
Table 1. Mix of crops in percentage of total area in each scenario.
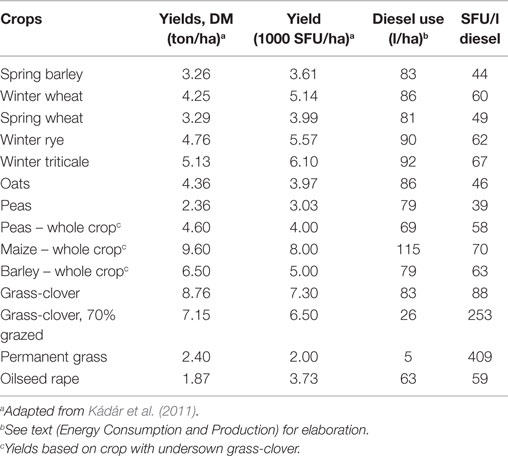
Table 2. Yield and diesel use per hectare per year for crops included in study.
Livestock
The livestock diet consists of 78% whole crop (grass-clover, maize, barley, and peas), 16% cereals and peas, and 6% whey from the cheese production with a fodder value of 15 kg whey per SFU (Møller et al., 2005). No specific calculations have been done on the protein intake of the livestock. The milk production per cow per year is 7969 kg milk corresponding to an average organic dairy farm cow (StatBankDanmark, 2007). The consumption of fodder is calculated according to Olesen et al. (2006). It is assumed that each milk-producing cow has one offspring per year. The production of meat is estimated to 195 kg of meat per year per milk-producing cow (StatBankDanmark, 2007).
Milk is transported in average 5 km to the shared dairy where it is converted to cheese and the whey is transported back to the farms and utilized as fodder for the livestock. The number of milk-producing cows is calculated as the maximum herd size possible based on the fodder produced on the farms including the whey from the cheese production. The results of combination of data and the assumptions above are found in Tables 3 and 4.
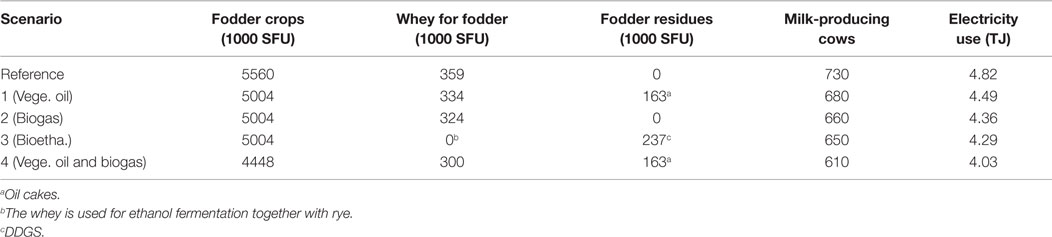
Table 3. Inputs to livestock production for the entire system of 1000 ha.
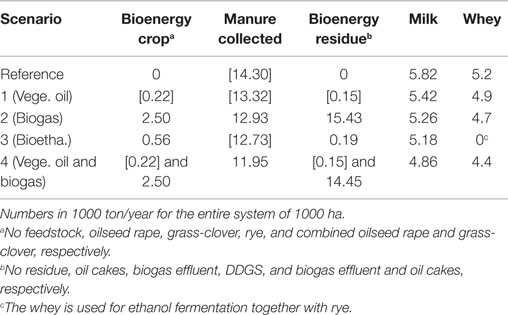
Table 4. Products (other than fodder crops) that stay within each farm [in brackets] and products that are transported 5 km to or from shared facilities in each scenario.
Manure
The production of manure is estimated according to the Danish standards that take into account the yield of milk and the consumption of fodder (Poulsen, 2008). Based on this, each lactating cow produces 19.7 ton/year of manure, and each calf of 0–6 months produces 1.9 ton/year and young animals and of 6–28 months produces 6.5 ton/year. A fraction of the manure corresponding to the time the cows spend outside is assumed to be excreted at the grazing fields and is not available for collection. It is assumed that lactating cows are grazing 8 h/day half of the year, meaning that 17% of year they are outside. Calves of 0–6 months are outside 25%, and calves of 6–28 months are outside 45% of the year (according to Danish regulation of organic dairy cows). All manures collected in the livestock house are spread on the fields as a fertilizer. The results of combination of data and the assumptions above are found in Table 3.
Energy Consumption and Production
Energy input from society is calculated in terms of electricity, diesel, and labor. Electricity use is 6.6 GJ/year per milk-producing unit (one cow + one heifer) (Refsgaard et al., 1998). The diesel use for crop production (Table 2) is calculated based on the Danish Agricultural Advisory Service (2008), which prescribes the fields operation needed for each crop, and Dalgaard et al. (2001), which estimate the diesel use for the field operations per hectare or per ton of harvested biomass. Diesel use for mowing of whole crop peas, once per year, and grass-clover, four times per year, is based on 5 l/ha. Chopping and handling is calculated based on the weight of the whole crop, where the weight is calculated according to the DM content of ensilaged crops (Møller et al., 2005). Manure collected in the livestock house is assumed to be spread equally on all fields with 14.3 ton/ha. For this, 0.3 l diesel is used per ton of manure. Diesel use for transporting milk to the dairy and whey back to the farm is included with the value of 1 MJ/t km as a transport of liquids in truck exclusive empty return (Berglund and Börjesson, 2006).
The input of labor is accounted for as the amount of food energy needed to feed the labor force. It is assumed that each farm employs two workers full time.
Output to society is calculated in terms of food energy. Cheese is evaluated as the food energy in milk minus the food energy in whey (Møller et al., 2005). Food energy value of meat is estimated based on the 1050 kcal/kg of live weight cows (Syrstad, 1993).
Bioenergy Scenarios
In four alternative scenarios, different strategies aiming at increasing energy production by means of vegetable oil, biogas, and bioethanol are explored. Flows of materials and energy for the four scenarios are illustrated in Figure 2. In Scenarios 1–3, 10% of the arable land is used for producing energy crops, and in Scenario 4, 20% is used for energy crops (Table 1). On the remaining land, the relative mix of fodder crops is the same as in the reference scenario. The milk and manure productions per cow are also kept constant, but the number of cows is reduced according to the reduced fodder production (Table 3). Energy use in cultivation and livestock management and food output is calculated in the same way as in the reference scenario except that it is adjusted according to the new mix of crops (Table 1) and number of animals (Table 3).
Scenario 1 – Vegetable Oil
Each farm uses 10% land to produce oilseed rape. The seeds are used in a farm scale cold press system that produces vegetable oil to substitute diesel as well as oilcakes, which are used as fodder (Figure 2). Average yield of the oilseed rape is 2200 kg/ha for oilseed rape (85% DM) on fertile loamy soil (Danish Agricultural Advisory Service, 2008). Oil yield is 33% of oilseed yield, and lower heating value is 37 MJ/kg corresponding to 34 MJ/l. The vegetable oil is assumed to substitute diesel on a 1:1 J basis (Halberg et al., 2008). Fodder value of oilcakes is 1.1 SFU/kg (Møller et al., 2005). Electricity for the oil press is included as 1.1 kWh/30 kg seeds (Jørgensen and Dalgaard, 2004). The straw is used for other purposes at the farms, and it is assumed that no extra labor is needed at the farms to produce the vegetable oil.
Scenario 2 – Biogas
The 10 farms share a biogas facility to take reduced costs. The average distance between biogas facility and each farm is 5 km. The biogas reactor is fed with mixture of manure and grass-clover from 10% of land. The biogas is used to generate electricity and useful heat on location. Part of it is used in the system, and the surplus is exported to the society. The biogas effluent is spread on the fields as fertilizer (Figure 2). Transport of manure from the 10 farms and transport of the biogas effluent back to the farms require 1 MJ/t km (Berglund and Börjesson, 2006), and the weight of the digested feedstock is assumed to be equal to the weight of manure and grass-clover, respectively. Transport of grass-clover is accounted for as 0.7 MJ/ton km (Berglund and Börjesson, 2006). The biogas yield from manure and grass-clover is 6.2 and 10.6 GJ per dry ton, respectively (Berglund and Börjesson, 2006). The use of electricity and heat is 26 and 190 MJ, respectively, per ton manure feedstock and 92 and 540 MJ, respectively, per ton grass-clover feedstock (Börjesson and Berglund, 2006). The CHP unit is assumed to convert the raw biogas to electricity and heat with an efficiency of 32 and 55%, respectively (Jungbluth et al., 2007). It is assumed that one person full time is employed at the shared biogas facility.
Scenario 3 – Bioethanol
The 10 farms use rye grains from 10% land and whey from the dairy to produce bioethanol at a regional bioethanol production plant outside the system. The residue from the distilling process, DDGS, is fed back to the livestock as a fodder (Figure 2). Energy use at the bioethanol production plant is not accounted for as it is outside the system boundary. The bioethanol yield is calculated based on the starch content in rye grains, 64% of DM, and the lactose content in whey, 77.5% of DM (Møller et al., 2005). Based on the stoichiometric mass balance, ethanol yield is assumed to be 0.51 g/g starch and 0.54 g/g lactose. All starch and lactose are assumed to be converted to ethanol. The fodder value of the DDGS is 34% of rye grain fodder value (Bentsen et al., 2007) plus the fodder value of whey protein (Møller et al., 2005). Transport of grains from the farms to a collection point 5 km away and transport of DDGS from that point and back to the farms require 0.7 MJ/t km (Berglund and Börjesson, 2006). The weight of DDGS is assumed to be 34% of rye grains. No extra labor is assumed.
Scenario 4 – Vegetable Oil and Biogas
The 10 farms share a biogas facility that is fed with grass-clover from 10% of the fields (similar to Scenario 2), and each farm uses another 10% of land to produce oilseed rape that is used in a low-tech farm scale oilseed press (similar to Scenario 1).
Results and Discussion
The aim of this study is to investigate the limitations and potentials for agriculture in providing both food and energy and the trade-off between growing fodder or energy crops. In four alternative scenarios, different strategies aiming at increasing energy production by means of vegetable oil, biogas, and bioethanol are modeled. The scenarios are described in Section “Materials and Methods” and illustrated in Figure 2. The modeling is based on a number of critical assumptions as outlined in Section “Materials and Methods.” However, because conservative estimates and best-case assumptions have been used regarding, e.g., yields, transport distances, and conversion efficiencies, the resulting energy balances are expected to demonstrate what may be possible but in many cases, the requirements could be much more demanding.
Energy Consumption
Diesel is used for field operations and for transport between farms and shared facilities. There is a notable difference between the scenarios in the amount of products that are transported (Table 4) and in the corresponding use of diesel for transportation (Table 5). Biogas production has the highest impact as it involves transportation of large quantities of high water content feedstock and residues. In Scenario 2, 15,430 ton of biogas feedstock is transported to the biogas plant, and the same amount of biogas residue is transported back (Table 4). This means that each day throughout the year, more than 40 ton should be transported each way by tractors and trailers. In Scenario 4, 14,450 ton is transported each way. For this reason, the diesel use for transportation is significantly higher in these scenarios, making up 7.7 and 7.3%, respectively, of total diesel use at the farm. In scenarios without biogas, the diesel use for transportation of milk and whey (reference scenario and Scenario 1) and also grain for ethanol production (Scenario 3) is 2.3, 2.2, and 2.1%, respectively, of total diesel use in the farming system (Table 5).
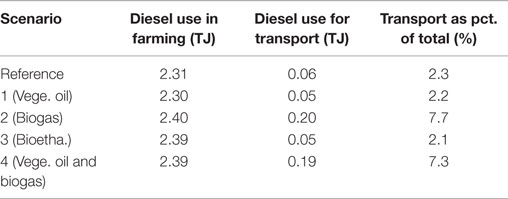
Table 5. Annual diesel use for farming and transportation for the entire system of 1000 ha for each scenario.
Electricity is primarily used for livestock production, and the consumption is proportional to the number of cows (Table 3). In the bioenergy scenarios, additional 0.03 TJ of electricity is required for vegetable oil production (Table 6), 0.57 and 0.54 TJ, respectively, for biogas production in Scenarios 2 and 3 (Table 7) and nothing for bioethanol production (Table 8). Heat is only used for the biogas production.
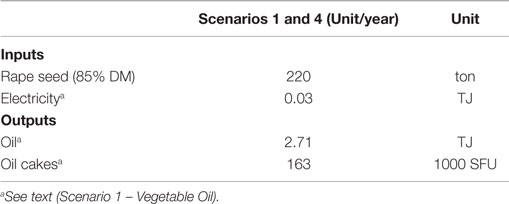
Table 6. Inputs and outputs from the vegetable oil production process for the entire system of 1000 ha.
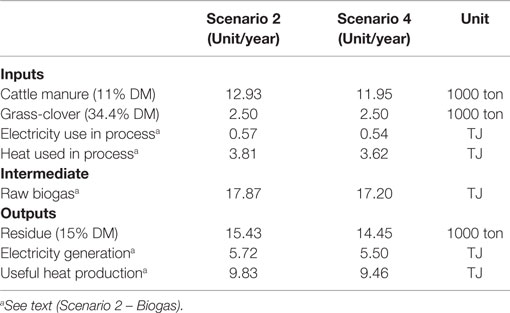
Table 7. Inputs and outputs from the biogas production process for the entire system of 1000 ha.
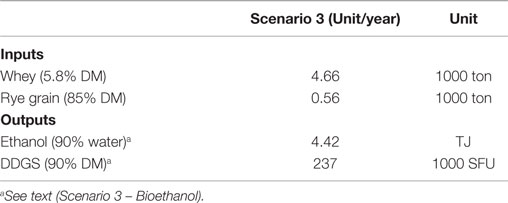
Table 8. Inputs and outputs from the bioethanol production process for the entire system of 1000 ha.
Energy Balance
The inputs and outputs to each of the bioenergy production processes were summarized in Tables 6–8. These tables quantify feedstock and residue production in the specific scenarios in addition to the energy consumption and production. The main results of this study are the gross energy consumptions and productions (Figure 3) and the resulting net-energy output of each of the three energy services and food for each of the five scenarios (Table 9).
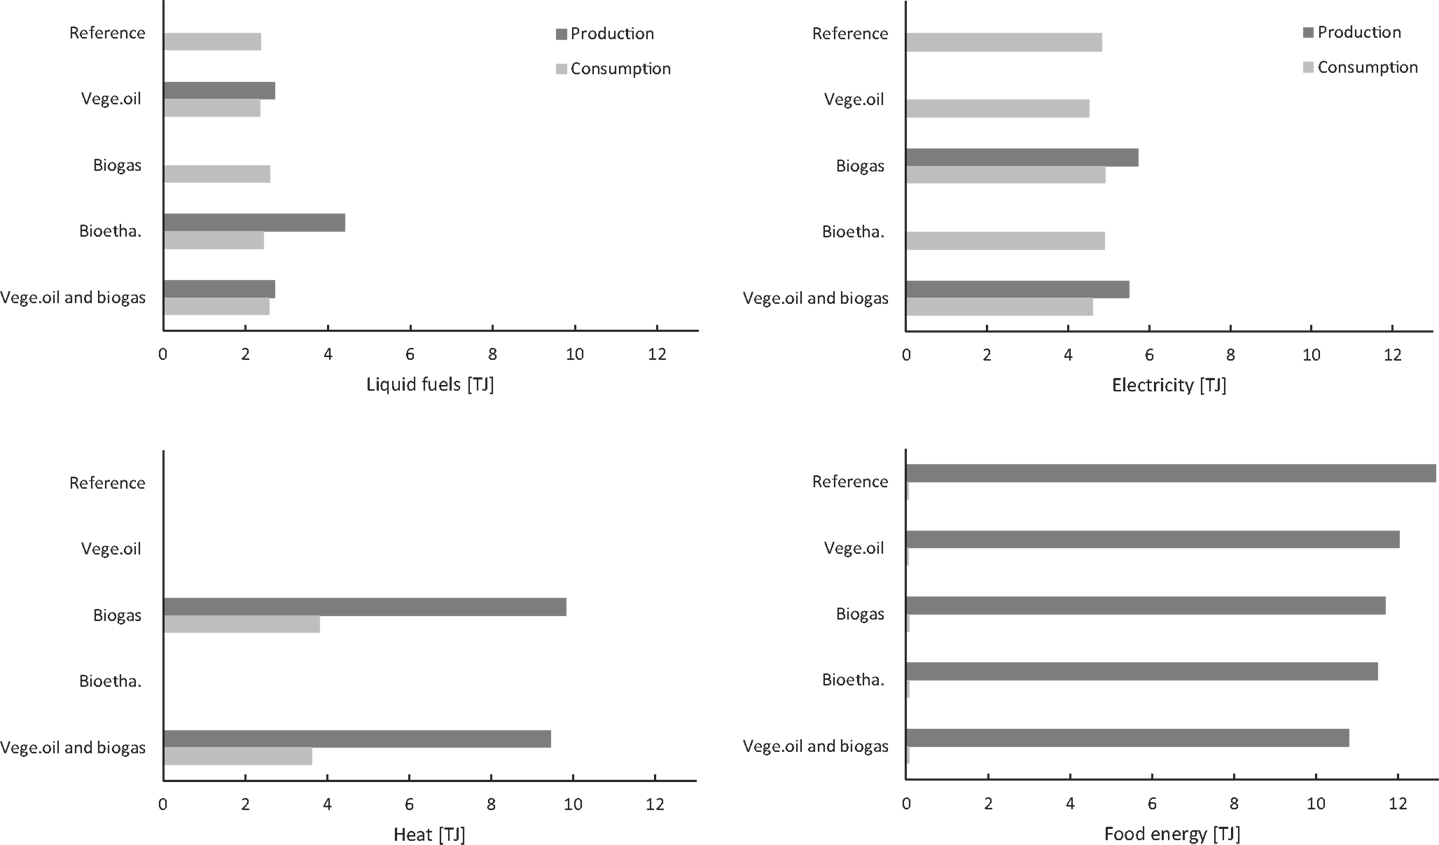
Figure 3. Annual production and consumption of liquid fuels, electricity, heat, and food energy for the entire system of 1000 ha in each scenario.
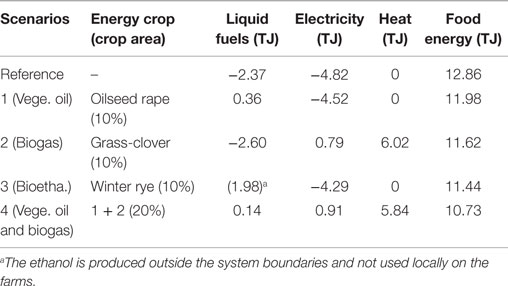
Table 9. Annual net output of liquid fuels, electricity, heat, and food energy for the entire system of 1000 ha in each scenario.
Liquid Fuel
The production of liquid fuels consists of vegetable oil in Scenarios 1 and 4 and bioethanol in Scenario 3. Using 10% of land for oilseed rape as energy, crop produces 2.71 TJ of vegetable oil. If the produced oil replaces purchased diesel, this results in a net output in Scenarios 1 and 4 of 0.36 and 0.14 TJ, respectively (Table 9), corresponding to 15 and 5% of the diesel used within the system for field operations and transport. This result is in line with Karpenstein-Machan (2001) who found that using 10% of land for oilseed rape as an energy crop would be sufficient for achieving self-sufficiency with liquid fuels for German dairy farms. In a Danish context, 10% of land for oilseed rape could produce 50–60% of the diesel required at a cash-crop farm (Halberg et al., 2008). In our dairy farm model, we have lower diesel consumption due to the high share of permanent grass and grazed areas, which demand less consumption of diesel in their production (Table 2).
A Swedish study of motor fuel self-sufficiency in a cash-crop farm concluded that allocating 9.3, 5.9, and 3.8% of farm land to oilseed rape for biodiesel, winter wheat for ethanol, and ley for biogas, respectively, would be sufficient to meet the on-farm fuel demand (Fredriksson et al., 2006). The energetic values of our results are essentially in agreement with these results. However, in our study, we do not consider the possibility of using biogas as a motor fuel or using ethanol to substitute diesel or to be produced on small scale suitable for a farm community (see Technologies for Producing Bioenergy in Organic Agriculture).
In Scenario 3, bioethanol is produced in a regional ethanol plant based on whey and rye grains from 10% of the land. The ethanol produced is equivalent to 4.42 TJ, resulting in a net output of liquid fuels of 1.98 TJ (Table 9). This is the highest gross production of liquid fuel (Figure 3), but it also implies additional reduction in food production (discussed below). When comparing Scenario 3 to the other scenarios, it is important to take into account that energy use for ethanol production is not included. The production is at a regional ethanol plant outside the system boundaries so it depends on the existence of such a plant. Data from literature for ethanol production from grains indicate that the production of 1 MJ ethanol requires 0.27 MJ steam or 0.36 MJ of natural gas and 0.027 MJ of electricity (Bentsen et al., 2007). For Scenario 3, this would imply an additional consumption of 0.12 TJ of electricity and 1.60 TJ of natural gas. Besides, more energy would be needed to transport whey and rye to the regional plant and DDGS back to the collection point.
Electricity and Useful Heat
Electricity and useful heat are produced only in the two scenarios with biogas production (Scenarios 2 and 4; Figure 3). Producing biogas from manure and grass-clover from 10% of the area gives a net electricity output of 0.79 or 0.91 TJ in Scenarios 2 and 4, respectively (Table 9). This corresponds to 16 and 20%, respectively, of the electricity used in the systems to power the livestock house and to operate the biogas facility.
Energy Self-Sufficiency
In this study, the imperative of energy self-sufficiency has been applied as a way to model the potential energetic contribution from agriculture. The aim was to produce quantitative results, which are straightforward to interpret by avoiding allocation and systems expansion and quantitative normalization of qualitative differences.
The results show that using 10% of land for oilseed rape production (Scenario1) can make the system more than self-sufficient with liquid fuel and using 10% land for grass-clover biogas feedstock (Scenario 2) can make the system more than self-sufficient with electricity and heat. Only Scenario 4 achieves self-sufficiency with both electricity and fuel, and it produces a small energy surplus, i.e., 0.14 TJ of vegetable oil and 0.91 TJ of electricity (Table 9). These results are in line with a study of a German livestock system, which showed that energy self-sufficiency could be achieved by using 18% land for energy crops with the combination of vegetable oil and anaerobic codigestion of energy crops and manure (Karpenstein-Machan, 2001). However, the results are in contrast to the previous Danish livestock model farming system with biogas production analyzing similar scenarios as in our study (Pugesgaard et al., 2013). They concluded that manure and grass-clover from 10% of the area could alone make the farm into a net-energy producer (also considering consumption of diesel). This discrepancy is mainly due to that liquid fuel, useful heat, and electricity were added in their energy balance, and thus that they implicitly assumed that these energy qualities can substitute each other, which is not the case. In Scenario 2, we would reach a similar result if the net-energy balance was calculated as the sum of net production of liquid fuel, electricity, and heat. In this case, the net-energy output ends up in a positive balance (4.21 TJ).
In a study of a Danish organic cash-crop system with 20% of land grown with grass-clover for biogas and 20% of land grown with oilseed rape for vegetable oil, twice the amount of liquid fuel needed on the farm was produced as well as a large surplus of useful heat and electricity (Østergård and Markussen, 2011). However, our conclusion that it requires about 20% land to produce a net-energy output differs significantly from a study of a Danish cash-crop system which was shown to be a “net-energy producer” by using alone 10% grass-clover as energy crop for biogas (Halberg et al., 2008). In that study, the energy balance was calculated based on how much fossil fuel the produced electricity and useful heat could replace in the economy. Such an approach implicitly answers the question: how much fossil fuel can be replaced in the economy if one farm changes its cropping system? It thus assumes that everything outside the system of interest stays the same, e.g., that the demand for energy in the economy is constant and that it will be met. Consequently, that approach is suitable for short-term outlooks of incremental changes. If, as in our case, the aim is to assess the possibilities of agriculture to provide both food and energy in a future where supply of fossil fuel is limited, then the assumption that everything else stays the same is less useful; there may not be any fossil fuel consumption to replace.
The energy self-sufficiency that is obtained in Scenario 4 should be seen in perspective of the energy requirements that was not included in the model, namely energy required upstream for producing and maintaining machinery and buildings and energy required downstream for processing the food and distributing it to consumers. Energy use for the construction of machinery and buildings is particularly relevant for the biogas plant, which requires a significant investment of energy. Furthermore, other studies show that energy consumption at the farm only constitutes from 20 to 30% of the total energy requirement in the food system (Heller and Keoleian, 2003).
Food Production
The primary product of a farming system is food (Figure 3), which is directly correlated to the fodder production. The production of fodder from crops, whey, and bioenergy residues and the resulting number of milk-producing cows in each scenario are summarized in Table 3. In Scenario 1, the fodder production is only 7% smaller than in the reference scenario even though the area for fodder crops is reduced by 10%. This is due to the fodder value of the oil cake residue, which corresponds to 1630 SFU/ha oilseed rape used for bioenergy. In Scenario 2, there are no fodder residues, and, therefore, exactly 10% less fodder is produced when compared to the reference scenario. In Scenario 3, the fodder production is 11.5% lower than in the reference scenario. This is because rye and whey are used for ethanol production instead of fodder, and the lactose in the whey is consumed during the fermentation. Finally in Scenario 4, the fodder production is reduced by 17% (i.e., the combination of Scenarios 1 and 2) when compared to the reference scenario.
The net output of food for each scenario (gross food production minus food consumed by workers) is shown in Table 9. In Scenarios 2 and 4 with biogas, there are 21 workers employed compared to 20 workers in the other scenarios. Each of these workers is assumed to need 8.8 MJ of food energy per day (United Nations, 2014). The food output thus corresponds to that each person within the system produces food to support 201, 187, 173, 178, and 159 persons for the five scenarios, respectively.
Another study of a 100% self-sufficient and manually managed mini farm of 372 m2 (4000 ft2) that grows grain crops, root crops, and vegetables and produces eggs showed that each farmer could support up to five additional people with a complete diet (Schramski et al., 2011). Compared to this, Scenario 4 is impressively 30 times more productive per labor input, but also needs 40 times more land per person supported (2994 versus 74 m2). In addition, our system needs input of machinery and other industrial inputs, which are not needed in the manually managed farm.
Conclusion
The methodological approach of assessing bioenergy technologies in the context of a farming system that is self-sufficient with fodder and fertilizers and that utilizes all coproducts within the system is useful for providing a clear picture of limitations and possibilities of agriculture as energy provider. The approach circumvents the problem of comparing scenarios with different types of inputs and outputs. In this way, the agricultural system is seen in isolation without taking into account input of manure or fodder, i.e., agricultural production outside the system boundaries. Furthermore, balancing different types of energy separately is a useful way to avoid the problem of adding non-equivalent energy data. For these two reasons, the comparison of different scenarios for production of fodder, livestock, and bioenergy from a specific area is straightforward to interpret.
According to our farm model, a community of dairy farms of 1000 ha in total can be self-sufficient with fodder and fertilizer as well as liquid fuels, electricity, and heat. This is possible if 10% land is used for oilseed rape for vegetable oil production and 10% for grass-clover used codigestion with manure in a biogas plant. In addition, the system produces a surplus of heat, which may be used in nearby buildings. This strategy reduces the food production with approximately 17% when compared to the reference scenario. However, even if 20% land is used for energy crops, the net output of energy is marginal and in any case insufficient to provide energy for, e.g., downstream processing and distributions of the produced food or any other activities in the surrounding economy. Overall, it seems unlikely that (organic) agriculture can contribute significantly in powering an industrialized economy, as we know it today, without devoting an unacceptable large share of the land for energy crops. However, a net-energy neutral (or even slightly positive) agriculture will save energy resources for other uses.
Author Contributions
MM did all the calculations in collaboration with HØ, and MM was the prime writer of the manuscript. SP and PO-P contributed with data and drafting the text for the agricultural part and the technical part, respectively. JS and HØ developed the project and contributed to drafting the text.
Conflict of Interest Statement
The authors declare that the research was conducted in the absence of any commercial or financial relationships that could be construed as a potential conflict of interest.
Acknowledgments
This study has partly been within the BioConcens project, which is linked to the International Centre for Research in Organic Food Systems (ICROFS) and funded under the research program: Research in Organic Food and Farming, International Research Co-operation and Organic Integrity.
References
Ahlgren, S., Bernesson, S., Nordberg, Å, and Hansson, P. (2010). Nitrogen fertiliser production based on biogas – energy input, environmental impact and land use. Bioresour. Technol. 101, 7181–7184. doi: 10.1016/j.biortech.2010.04.006
Bentsen, N. S., Felby, C., and Ipsen, K. H. (2007). Energy balance of 2nd generation bioethanol production in Denmark. Available at: http://www.tekno.dk/pdf/projekter/p09_2gbio/ClausFelby/p09_2gbio%20Bentsen%20et%20al%20(2006).pdf
Berglund, M., and Börjesson, P. (2006). Assessment of energy performance in the life-cycle of biogas production. Biomass Bioenergy 30, 254–266. doi:10.1016/j.biombioe.2005.11.011
Börjesson, P., and Berglund, M. (2006). Environmental systems analysis of biogas systems – Part 1: fuel-cycle emissions. Biomass Bioenergy 30, 469–485. doi:10.1016/j.biombioe.2005.11.014
Callesen, I., Grohnheit, P. E., and Østergård, H. (2010). Optimization of bioenergy yield from cultivated land in Denmark. Biomass Bioenergy 34, 1348–1362. doi:10.1016/j.biombioe.2010.04.020
Cherubini, F. (2010). The biorefinery concept: using biomass instead of oil for producing energy and chemicals. Energy Conver. Manage. 51, 1412–1421. doi:10.1016/j.enconman.2010.01.015
Conforti, P., and Giampietro, M. (1997). Fossil energy use in agriculture: an international comparison. Agric. Ecosyst. Environ. 65, 231–243. doi:10.1016/S0167-8809(97)00048-0
Dalgaard, T., Halberg, N., and Porter, J. R. (2001). A model for fossil energy use in Danish agriculture used to compare organic and conventional farming. Agric. Ecosyst. Environ. 87, 51–65. doi:10.1016/S0167-8809(00)00297-8
Danish Agricultural Advisory Service. (2008). Budget Estimates for Organic Production 2008 [in Danish; Original Title “Budgetkalkuler 2008”]. Aarhus: Landbrugsforlaget.
EU. (2009). Directive 2009/28/EC of the European Parliament and of the Council of 23 April 2009 on the Promotion of the Use of Energy from Renewable Sources and Amending and Subsequently Repealing Directives 2001/77/EC and 2003/30/EC. Official Journal of the European Union. L 140, 16–62
Farrell, A. E., Plevin, R. J., Turner, B. T., Jones, A. D., O’Hare, M., and Kammen, D. M. (2006). Ethanol can contribute to energy and environmental goals. Science 311, 506–508. doi:10.1126/science.1121416
Fredriksson, H., Baky, A., Bernesson, S., Nordberg, O., Norén, O., and Hansson, P. (2006). Use of on-farm produced biofuels on organic farms – evaluation of energy balances and environmental loads for three possible fuels. Agric. Syst 89, 184–203. doi:10.1016/j.agsy.2005.08.009
Gan, J., and Smith, C. T. (2011). Optimal plant size and feedstock supply radius: a modeling approach to minimize bioenergy production costs. Biomass Bioenerg. 35, 3350–3359. doi:10.1016/j.biombioe.2010.08.062
Giampietro, M. (2006). Comments on “the energetic metabolism of the European union and the United States” by Haberl and colleagues – theoretical and practical considerations on the meaning and usefulness of traditional energy analysis. J. Ind. Ecol. 10, 173–185. doi:10.1162/jiec.2006.10.4.173
Giampietro, M., Allen, T. F. H., and Mayumi, K. (2006). The epistemological predicament associated with purposive quantitative analysis. Ecol. Complex. 3, 307–327. doi:10.1016/j.ecocom.2007.02.005
Halberg, N., Dalgaard, R., Olesen, J. E., and Dalgaard, T. (2008). Energy self-reliance, net-energy production and GHG emissions in Danish organic cash crop farms. Renew. Agr. Food Syst. 23, 30–37. doi:10.1017/S1742170507002037
Hall, C., Balogh, S., and Murphy, D. (2009). What is the minimum EROI that a sustainable Society must have? Energies 2, 25–47. doi:10.3390/en20100025
Hall, C. A. S., Cleveland, C. J., and Kaufmann, R. (1986). Energy and Resource Quality: The Ecology of the Economic Process. New York, NY: Wiley.
Heller, M. C., and Keoleian, G. A. (2003). Assessing the sustainability of the US food system: a life cycle perspective. Agric. Syst. 76, 1007–1041. doi:10.1016/S0308-521X(02)00027-6
IFOAM. (2014). The principles of Organic Agriculture, International Federation of Organic Agriculture Movements. Available at: http://www.ifoam.bio/en/organic-landmarks/principles-organic-agriculture 2014
Johansen, A., Carter, M. S., Jensen, E. S., Hauggard-Nielsen, H., and Ambus, P. (2013). Effects of digestate from anaerobically digested cattle slurry and plant materials on soil microbial community and emission of CO2 and N2O. Appl. Soil Ecol. 63, 36–44. doi:10.1016/j.apsoil.2012.09.003
Jørgensen, U., and Dalgaard, T. (2004). Energy in Organic Agriculture [In Danish, original title “Energi i økologisk jordbrug”]. Foulum: Danish Research Center in Organic Farming.
Jungbluth, N., Chudacoff, M., Dauriat, A., Dinke, F., Doka, G., Faist Emmenegger, M., et al. (2007). Life Cycle Inventories of Bioenergy. Ecoinvent Report No. 17. Dübendorf: Swiss Centre for Life Cycle Inventories.
Kádár, Z., Christensen, A. D., Thomsen, M. H., and Bjerre, A. (2011). Bioethanol production by inherent enzymes from rye and wheat with addition of organic farming cheese whey. Fuel 90, 3323–3329. doi:10.1016/j.fuel.2011.05.023
Karpenstein-Machan, M. (2001). Sustainable cultivation concepts for domestic energy production from biomass. Crit. Rev. Plant Sci. 20, 1–14. doi:10.1080/20013591099164
Markussen, M. V., and Østergård, H. (2013). Energy analysis of the Danish food production system: food-EROI and fossil fuel dependency. Energies 6, 4170–4186. doi:10.3390/en6084170
Møller, J., Thøgersen, R., Helleshøj, M. E., Weisbjerg, M. R., Søegaard, K., and Hvelplund, T. (2005). Feed Material Table 2005 – Composition and Nutritive Value of Feeds for Livestock [In Danish, original title “Fodermiddeltabel 2005 – Sammensætning og Foderværdi af Fodermidler til kvæg”]. Available at: https://www.landbrugsinfo.dk/Kvaeg/Foder/Sider/Fodermiddeltabel_2005.aspx
Neff, R. A., Parker, C. L., Kirschenmann, F. L., Tinch, J., and Lawrence, R. S. (2011). Peak oil, food systems, and public health. Am. J. Public Health 101, 1587–1597. doi:10.2105/AJPH.2011.300123
Odum, H. T. (2007). Environment, Power, and Society for the Twenty-First Century: The Hierarchy of Energy. New York, NY: Columbia University Press.
Olesen, J. E., Schelde, K., Weiske, A., Weisbjerg, M. R., Asman, W. A. H., and Djurhuus, J. (2006). Modelling greenhouse gas emissions from European conventional and organic dairy farms. Agric. Ecosyst. Environ. 112, 207–220. doi:10.1016/j.agee.2005.08.022
Oleskowicz-Popiel, P., Kádár, Z., Heiske, S., Klein-Marcuschamer, D., Simmons, B. A., Blanch, H. W., et al. (2012). Co-production of ethanol, biogas, protein fodder and natural fertilizer in organic farming – evaluation of a concept for a farm-scale biorefinery. Bioresour. Technol. 104, 440–446. doi:10.1016/j.biortech.2011.11.060
Østergård, H., and Markussen, M. V. (2011). “Energy Self-sufficiency from an Emergy Perspective Exemplified by a Model System of a Danish Farm Cooperative,” in Emergy Synthesis 6, Theory and Application of the Emergy Methodology, eds M. T. Brown and S. Sweeney (Gainesville, FL: The Center for Environmental Policy, Department of Environmental Engineering Sciences, University of Florida), 311–322.
Østergård, H., Markussen, M. V., and Jensen, E. S. (2010). “Challenges for sustainable development in a biobased economy,” in The Biobased Economy, eds H. Langeveld, M. Meeusen and J. Sanders (Washington, DC: Earthscan Publications Ltd), 33–48.
Pelletier, N., Audsley, E., Brodt, S., Garnett, T., Henriksson, P., Kendall, A., et al. (2011). Energy intensity of agriculture and food systems. Annu. Rev. Environ. Resour. 36, 223–246. doi:10.1146/annurev-environ-081710-161014
Poulsen, H. D. (2008). Standard Figures for Manure – 2008 [In Danish, Original Title “Normtal for Husdyrgødning – 2008”]. Faculty of Agricultural Sciences Aarhus University. Available at: http://anis.au.dk/fileadmin/DJF/Anis/normtal2008.pdf
Pugesgaard, S., Olesen, J., Jørgensen, U., and Dalgaard, T. (2013). Biogas in organic agriculture – effects on productivity, energy self sufficiency and greenhouse gas emissions. Renew. Agr. Food Syst. 29, 28–41. doi:10.1017/S1742170512000440
Refsgaard, K., Halberg, N., and Kristensen, E. S. (1998). Energy utilization in crop and dairy production in organic and conventional livestock production systems. Agric. Syst. 57, 599–630. doi:10.1016/S0308-521X(98)00004-3
Rehl, T., and Müller, J. (2011). Life cycle assessment of biogas digestate processing technologies. Resour. Conserv. Recy. 56, 92–104. doi:10.1016/j.resconrec.2011.08.007
Schramski, J. R., Rutz, Z. J., Gattie, D. K., and Li, K. (2011). Trophically balanced sustainable agriculture. Ecol. Econ. 72, 88. doi:10.1016/j.ecolecon.2011.08.017
StatBankDanmark. (2007). Accounts Statistics for Agriculture Organic Holdings, Financial Results and Balance by Type and Account Items (1996–2009). Available at: http://www.statistikbanken.dk
Stinner, W., Möller, K., and Leithold, G. (2008). Effects of biogas digestion of clover/grass-leys, cover crops and crop residues on nitrogen cycle and crop yield in organic stockless farming systems. Eur. J. Agron. 29, 125–134. doi:10.1016/j.eja.2008.04.006
Syrstad, O. (1993). Evaluation of dual-purpose (milk and meat) animals. World Animal Rev. 77, 56–59.
United Nations. (2014). What is Hunger? United Nations World Food Programme – Fighting Hunger Worldwide. Available at: http://www.wfp.org/hunger/what-is
Keywords: dairy farms, self-sufficiency, net-energy, vegetable oil, biogas, bioethanol, organic farming
Citation: Markussen MV, Pugesgaard S, Oleskowicz-Popiel P, Schmidt JE and Østergård H (2015) Net-Energy Analysis of Integrated Food and Bioenergy Systems Exemplified by a Model of a Self-Sufficient System of Dairy Farms. Front. Energy Res. 3:49. doi: 10.3389/fenrg.2015.00049
Received: 02 March 2015; Accepted: 05 November 2015;
Published: 25 November 2015
Edited by:
Luís Alexandre Duque Moreira De Sousa, Public Research Centre Henri Tudor, LuxembourgReviewed by:
Ramesh Lekshmana, Dr. MGR Educational and Research Institute, IndiaMichael Carbajales-Dale, Global Climate and Energy Project, USA
Copyright: © 2015 Markussen, Pugesgaard, Oleskowicz-Popiel, Schmidt and Østergård. This is an open-access article distributed under the terms of the Creative Commons Attribution License (CC BY). The use, distribution or reproduction in other forums is permitted, provided the original author(s) or licensor are credited and that the original publication in this journal is cited, in accordance with accepted academic practice. No use, distribution or reproduction is permitted which does not comply with these terms.
*Correspondence: Hanne Østergård, haqs@kt.dtu.dk
†Present address: Piotr Oleskowicz-Popiel, Institute of Environmental Engineering, Poznan University of Technology, Poznan, Poland;
Jens Ejbye Schmidt, Institute Center for Energy (iEnergy), Masdar Institute of Science and Technology, Abu Dhabi, United Arab Emirates